Urban River Transformation and the Landscape Garden City Movement in China


1
College of Urban and Environmental Sciences, Peking University, Beijing 100871, China
2
College of Architecture and Landscape, Peking University, Beijing 100871, China
3
Collegium—Institute of Advanced Studies, University of Lyon, 69007 Lyon, France
4
College of Environmental Design, University of California at Berkeley, Berkeley, CA 94720, USA
*
Author to whom correspondence should be addressed.
Sustainability 2018, 10(11), 4103; https://0-doi-org.brum.beds.ac.uk/10.3390/su10114103
Submission received: 27 September 2018
/
Revised: 29 October 2018
/
Accepted: 2 November 2018
/
Published: 8 November 2018
(This article belongs to the Special Issue Human–River Interactions in Cities)
Abstract
:The practice of enhancing existing rivers and creating entirely new waterscapes has exploded in China over the past two decades. In our study of 104 randomly selected cities across China, we identified 14 types of river projects based on grey literature reports and their appearance on sequential aerial imagery, falling into three categories: ‘engineering’, ‘waterfront spaces’ and ‘ecological’ projects. ‘Waterfront spaces’ is the most common (60.5%), followed by ‘engineering’ (28.7%) and ‘ecological’ (10.8%). Using multiple stepwise regression, we found that the types of projects undertaken were strongly influenced by factors such as climate, social-economic setting, and ‘Landscape Garden City’ designation. Designation as a ‘Landscape Garden City’ was correlated with ‘waterfront spaces’, but not ‘engineering’ and ‘ecological’ projects. We found that cities in drier climates (as measured by ‘precipitation minus evaporation’) constructed more projects and they included many projects that impounded seasonal rivers to create year-round water bodies. Based on our results, we conclude that Chinese cities are still in the process of ‘decorating’ rivers, and that the ‘Landscape Garden City’ designation promoted such ‘decorating’ projects, especially ‘linear greening’ projects and ‘public spaces along rivers’. The results also demonstrate that the new river projects in China are often at odds with the local climate.
1. Introduction
The practice of enhancing existing rivers and creating entirely new waterways has exploded in China over the past two decades, accompanying the rapid expansion of urban areas. While these river projects share many attributes with urban riverfront projects that have proliferated in Europe and North America over the same time period, there are some significant differences. To better understand the many urban river projects in China, we explore the influence of urban area expansion, social-economic development, different climates, the ‘Landscape Garden City’ designation, and the influence of Chinese classical garden design and Howard’s Garden City concept. We focus on the morphological transformation of urban river projects, excluding whole-watershed or water resources development projects, although these larger-scale projects could certainly merit comparable study.
Even in the purely western context of Europe, North America, and Australia, the term ‘river restoration’ is contested, with multiple and often conflicting meanings [1,2]. Many authors have pointed out that true ‘restoration’ is rarely possible [3] and have proposed alternative terms such as enhancement or improving water quality for most contexts [2,4,5,6]. Early definitions of river restoration tended to emphasize restoration of conditions ‘prior to disturbance’ [7], which is a standard that could only be applied in contexts in which the ‘disturbance’ (i.e., massive anthropic transformations) occurred recently enough that there is evidence of the prior condition. This is the case in parts of North America and Australia, but certainly not Europe or other long-settled areas. In these latter environments, a more applicable goal might be achieving certain conditions or functions deemed ecologically important [8]. Moreover, the movement to restore ecological functions of urban rivers and human contact with them did not emerge until after improvement in water quality in these rivers, following for example, the Clean Water Act (1972) in the US and especially the Water Framework Directive (2000) in Europe. So long as rivers were open sewers, there was little opportunity to restore ecological conditions and little motivation to connect urban populations to these polluted, foul-smelling waterways.
Many studies have documented how river systems have been changed by urbanization, presenting examples from America, Europe, Australia, and Africa [1,9,10,11]. Morphological changes have been examined for a range of human impacts, including dam construction, land use changes, channelization and urbanization [9,12,13,14]. Legislative and political-economic factors influencing river morphology and design have been studied elsewhere such as the US and Japan [15,16,17], but there have been few studies in China [18,19]. Moreover, the river channels are treated differently in different locales. In some places, the river channels are preserved to retain their ecological functions, in some they are landscaped and cosmetically managed, and in some they are ignored and carry heavy loads of sewage [10]. In China, research on the impacts of urbanization on rivers has lagged behind [20]. Since 2000, the Chinese government has placed greater emphasis on the quality of urban environments [21] and their sustainability [22]. In this paper, we document the morphological changes of Chinese urban rivers in the last one to two decades and explore potential factors behind the observed changes.
1.1. River Projects in the Chinese Context
While China has abundant fresh water resources, its per capita water availability is 2100 m3 per person per year [23], only about a quarter of the world average. More challenging, the distribution of China’s economy and population do not align with the distribution of water resources [24,25], with important population centers in northern China supplied with only about one quarter of the water resources of the south. To address the water shortage in the north, China has undertaken the ‘South-to-North Water Diversion’, with three lines envisioned. The east and middle lines have taken a decade to complete, at a cost of about 254 billion RMB to date [26].
In China, many river restoration projects are established by local governments or landowners and are often undertaken opportunistically [19] rather than being based on a prioritization at the basin or regional scale. Many such projects seek to ensure the river has water all year round, despite highly seasonal runoff [27], and aim to “beautify” the urban landscape [28,29], through elements such as waterfront parks [30] or damming the river to pool water [31,32]. Rivers are central to the identity of many towns and cities, and waterfront areas are often sought as desirable areas for urban development and gentrification [33,34], with properties adjacent to such waterscapes typically commanding higher prices [35]. All these factors have promoted construction of urban waterscapes in China.
In the first decades of the 21st century, the emphasis of river management in China is still on improving water quality [5], and river restoration (in the North American sense) is still a relatively new concept. Much of the literature on river and waterfront design in China has been in the form of design principles for building pool-riffle sequences, restoring sinuosity to straightened channels, removing concrete revetment, and constructing more ecologically friendly riverbanks in their stead [36,37]. Maintaining or increasing the sinuosity of river channels is the principle most frequently emphasized (often through construction of curved revetments) and imitating the natural channel forms is advocated [5,38,39]. Benefits to key aquatic species have been emphasized in some research studies [39], but few projects have emphasized this objective in practice.
1.2. Chinese Classical Garden and the Design of Rivers
Landscape practice in China is heavily influenced by principles of the Chinese classical garden or the design philosophy of the ‘unity of man with nature’ [40]. Within the philosophy of the Chinese Classical garden, water is recognized as the most important design element, and the concept of ‘Lishui’ (literally ‘manage-water’) guides management of water in the garden. Nearly every Chinese garden has water. Where there is no natural body of water present, the designers typically create a man-made pond. For the layout of the garden’s water system, designers seek to imitate natural features, and prefer curved banks over straight ones. In addition, the width of a channel should vary along its length to create contrasting experiences, such as open scenery over wide parts of the channel contrasted with a more intimate experience offered by a narrower reach lined with trees, exemplifying one of the principles that the visitor should experience different scenery with each step [41].
Some larger urban river projects have been designed and built by hydraulic engineers rather than landscape architects, but even these projects have been influenced by classical garden design, as reflected in the manual Principles and Technologies of Ecological Hydraulic Engineering which includes guidance for river restoration [5], recommending that project designers draw upon the aesthetic values of the Chinese classical garden. Some universities, such as China Three Gorges University, have a curriculum in ‘Ecological Hydraulic Engineering’. Thus, some superficial characteristics of the classical garden have influenced river projects designed by both landscape architects and hydraulic engineers.
1.3. The Changing ‘Landscape Garden City’
In other aspects, river projects in China have been strongly influenced by government policies, notably the encouragement of the ‘National Landscape Garden City’ (NLGC) and the ‘Mountains-Waters City’ (Shanshui City), both introduced in 1992. Since then, the Ministry of Housing and Urban-Rural Development (MOHURD) of China introduced a new category, ‘National Ecological Landscape Garden City’ (NELGC) and raised the standards for qualifying for these designations. Cities must qualify for these designations at the provincial level, and then after at least two years, if they meet national standards, they can apply for national-level designation. To date, 345 cities have qualified (at the national level) as NLGC, and 11 as NELGC. One of the most important variables taken into account in Landscape Garden City applications is the ratio of green space to total area, and some indexes are related to water bodies. From 1992 to 2016, the requirements to achieve ‘Landscape Garden City’ status were changed (generally strengthened) many times (Table 1).
Many cities have attempted to achieve the standards of a ‘Landscape Garden City’ since 1992 [43], so these standards have had a strong influence on the creation of green space in cities in general, including rivers. Before submitting an application, a municipal government must make significant investments to construct a ‘Landscape Garden City’, creating parks and green spaces intended to increase land values and encourage commercial development [22]. As many or most parks are constructed along rivers or other water bodies, we hypothesized that river projects would become more common in response to ‘Landscape Garden City’ requirements, whose standards have evolved over the past two decades. In this paper, we analyze a set of randomly selected Chinese cities to characterize their river projects, and to analyze factors affecting implementation of river projects.
2. Materials and Methods
2.1. Data Collection
From the 665 Chinese cities (designated by the central government as of June 2016) [44], we identified cities to study through a stratified random selection process. We first eliminated the two special administrative regions (Hong Kong and Macau) because of their size and complexity, and we eliminated nine cities in the Xinjiang Province that are under a unique economic or paramilitary organization (the Xinjiang Production and Construction Corps). There are four large municipalities excluded which contain not only the center city proper but also a large surrounding area. This resulted in a set of 650 cities remaining. In addition, these and most of the provincial capitals in China are megacity behemoths (urban population ≥ 10 million) or mega cities (urban population 5–10 million) [45], within which it would be difficult to identify all the river projects. So, for provinces with less than five cities, we included the capital city as one of study cities, but for provinces with six cities or more we excluded the capitals. We randomly selected cities based on the number of cities within the province, drawing separately from the lists of prefectural-level cities and county-level cities, as outlined in Table 2.
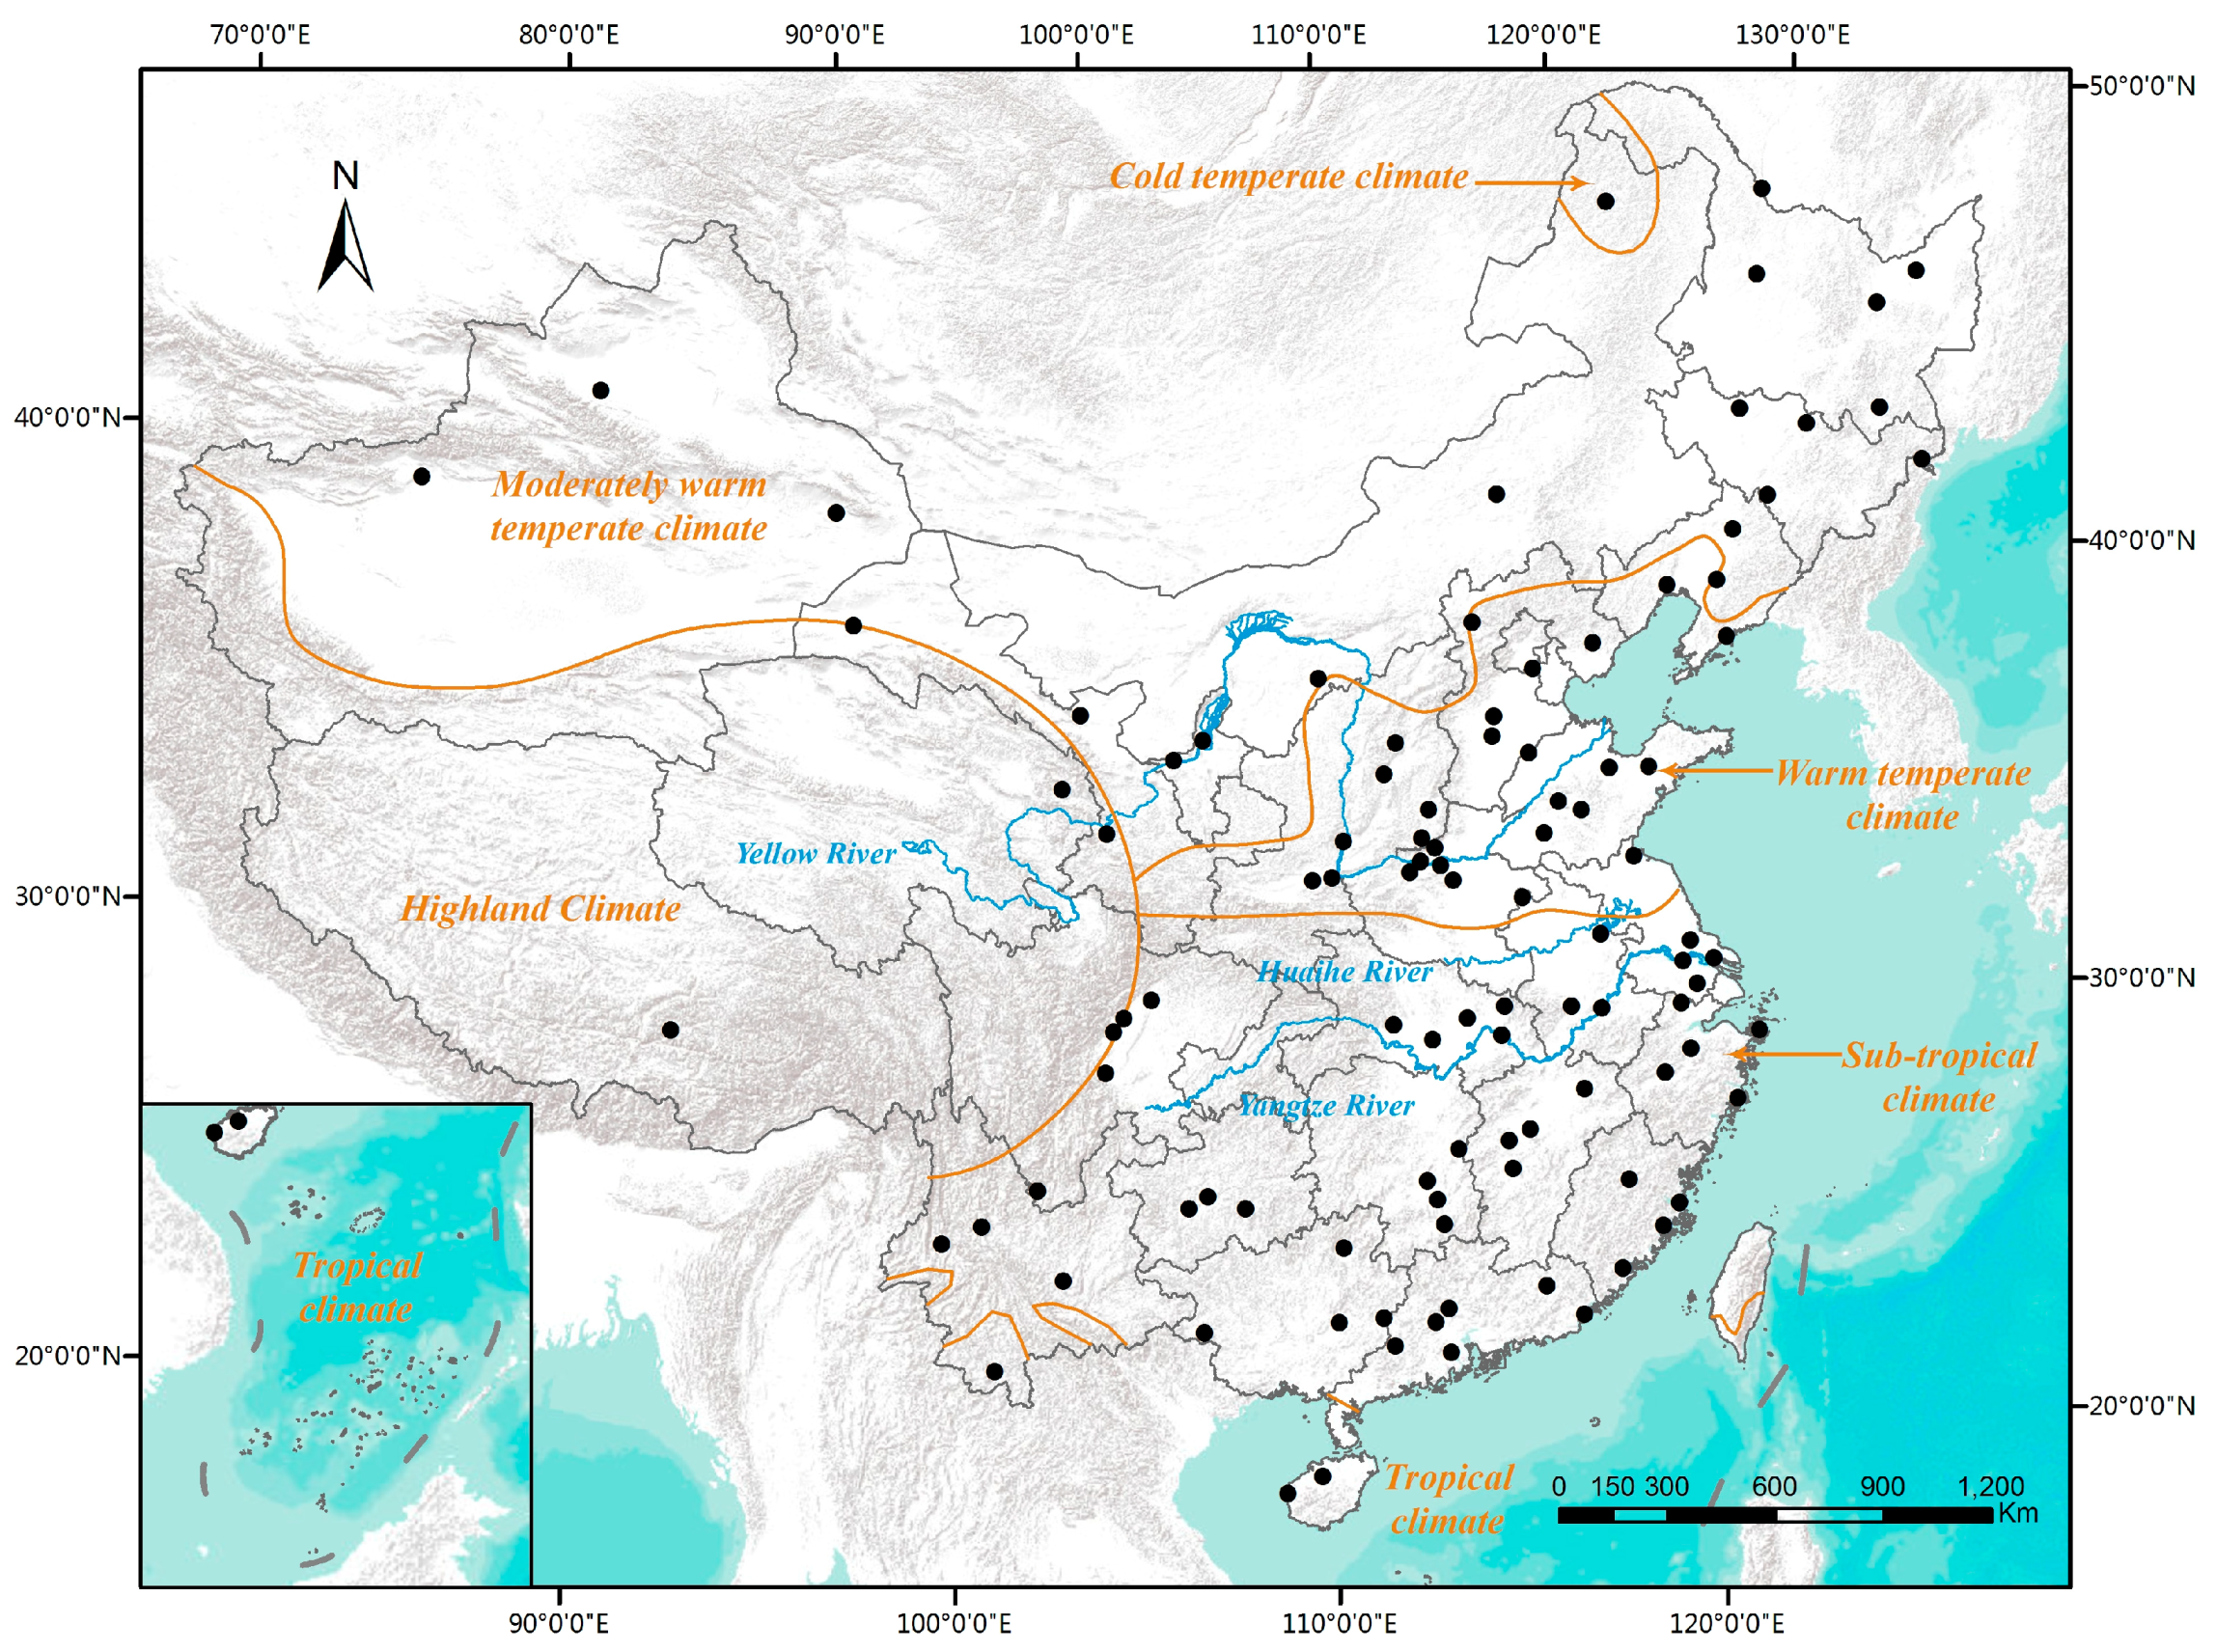
Except for the capitals, we selected the cities using randomly-generated numbers. We first developed lists of prefectural-level and county-level cities in each province, and then we used a random-number generator to randomly select the cities. Thus, if a province, like Sichuan, had 35 cities, of which 17 were prefectural-level cities, we used a random number generator to select two numbers between 1 and 17, which selected two prefectural-level cities. This systematic but random process of city selection resulted in a set of 104 cities, of which 47 were prefectural-level cities and 57 county-level cities (Figure 1).
For each city selected, we compiled basic data on climate (e.g., local temperature, precipitation and evaporation), topography (e.g., elevation, slope, relief, terrain roughness), social-economic indicators (including urban district population, city population, Gross Domestic Product (GDP), urban district area, urban built area, area of green space, etc.) and river related data (including number of rivers, maximal river width, widened river width, original river width), etc.
We obtained climate data from the China Meteorological Data Service Center (CMDC) (http://data.cma.cn/) and used annual average data from 1981 to 2010. For precipitation, we identified the stations with longitude and latitude nearest to the cities and used only stations whose elevation were similar to the cities. For the 60 cities we selected, evaporation data were available only from 20 cm diameter evaporation pans (E-601). We first converted all the E-601 values to equivalents E-601B Pan data (which yield data closer to actual evaporation) using the conversion coefficients of Ren et al. [46] and tested the conversions with data from the 44 cities with both E601 and E-601B data. The conversion had an error range of less than 5% for 49% stations, and error of less than 10% for 95% of the stations, confirming the conversion was sufficiently accurate to convert data from the 60 cities with only E601 data to E-601B data, giving us a consistent data set across the study cities.
For topography, we used the free digital elevation data at 30 m resolution provided by the Geospatial Data Cloud site, Computer Network Information Center, Chinese Academy of Sciences (http://www.gscloud.cn), originally collected by the Advanced Spaceborne Thermal Emission and Reflection Radiometer (ASTER) on National Aeronautics and Space Administration (NASA)’s Terra satellite. This was published in 2009, and then adjusted by the Japanese Ministry of Economy, Trade and Industry (METI) and NASA. We calculated elevation, slope, relief and terrain roughness by ArcGIS over circular regions centered on urban center, determining the radius (R) as a function of overall urban built area (UBA, UBA = πR2). We calculated relief (RE) by calculating the maximal value (A) of the raster, the minimal value (B), and relief as A minus B. We calculated terrain roughness (TR) with the equation, TR = 1/cos ([slope]* π/180).
We drew socio-economic data from the ‘China Urban Construction Statistical Yearbook-2015’ and ‘China City Statistical Yearbook-2016’, which both report data for Chinese cities in 2015. In compiling population data, we used data for permanent resident populations, which includes both residents with permanent urban resident status (Hukou) and those without urban Hukou. We included only population within urban district areas, a useful distinction because many cities’ municipal extent includes large areas of rural land. We used GDP divided by city population to calculate GDP per capita, a reflection of the economic level of the urban area.
We directly measured (on aerial imagery) the extent of rivers in cities with less than 10 rivers, but for cities with greater densities of river channels, such as Suzhou, with more than 100 rivers, we consulted other data sources for a good estimate of river extent. In each case, we measured the maximum river width on Google Earth imagery.
We also recorded whether the city was designated a ‘Landscape Garden City’ (a designation awarded since 1992) or a ‘National Ecological Landscape Garden City’ (awarded since 2015), and we assigned different values to distinguish the levels of Landscape Garden City level. For ‘National Ecological Landscape Garden City’, we assigned a value of 4, followed by National Landscape Garden City (3), Provincial Landscape Garden City (2), Landscape Garden City under construction (1), and no Landscape Garden City designation (0) (Table 3).
For the 104 cities, we identified the years with high resolution aerial imagery available on Google Earth. The cities averaged 11.3 years of high-resolution imagery (back to 2005). Low-resolution imagery was available for all cities back to 1986. We then looked closely on sequential aerial imagery to identify changes to river courses, bank treatments, etc., and we scoured the academic, professional, and grey literature for accounts of river enhancement projects. We developed a typology of river enhancement or creation projects based on the changes we documented (Table 4), and for each site studied, we identified the projects undertaken by application of the typology. For every year of imagery studied, we tabulated years with new river projects visible, not the number of new projects. We then summed these values to yield the number of cities with new projects by year. For example, of the hundreds of projects in Suzhou, we counted only new projects visible on imagery in different years. So, during the years 2003 to 2017, we identified nine years with new public space constructed along rivers, which we recorded as ‘9’. We also noted whether projects were built in “new districts” (i.e., an urban area newly constructed within the prior five years) or in previously-existing districts.
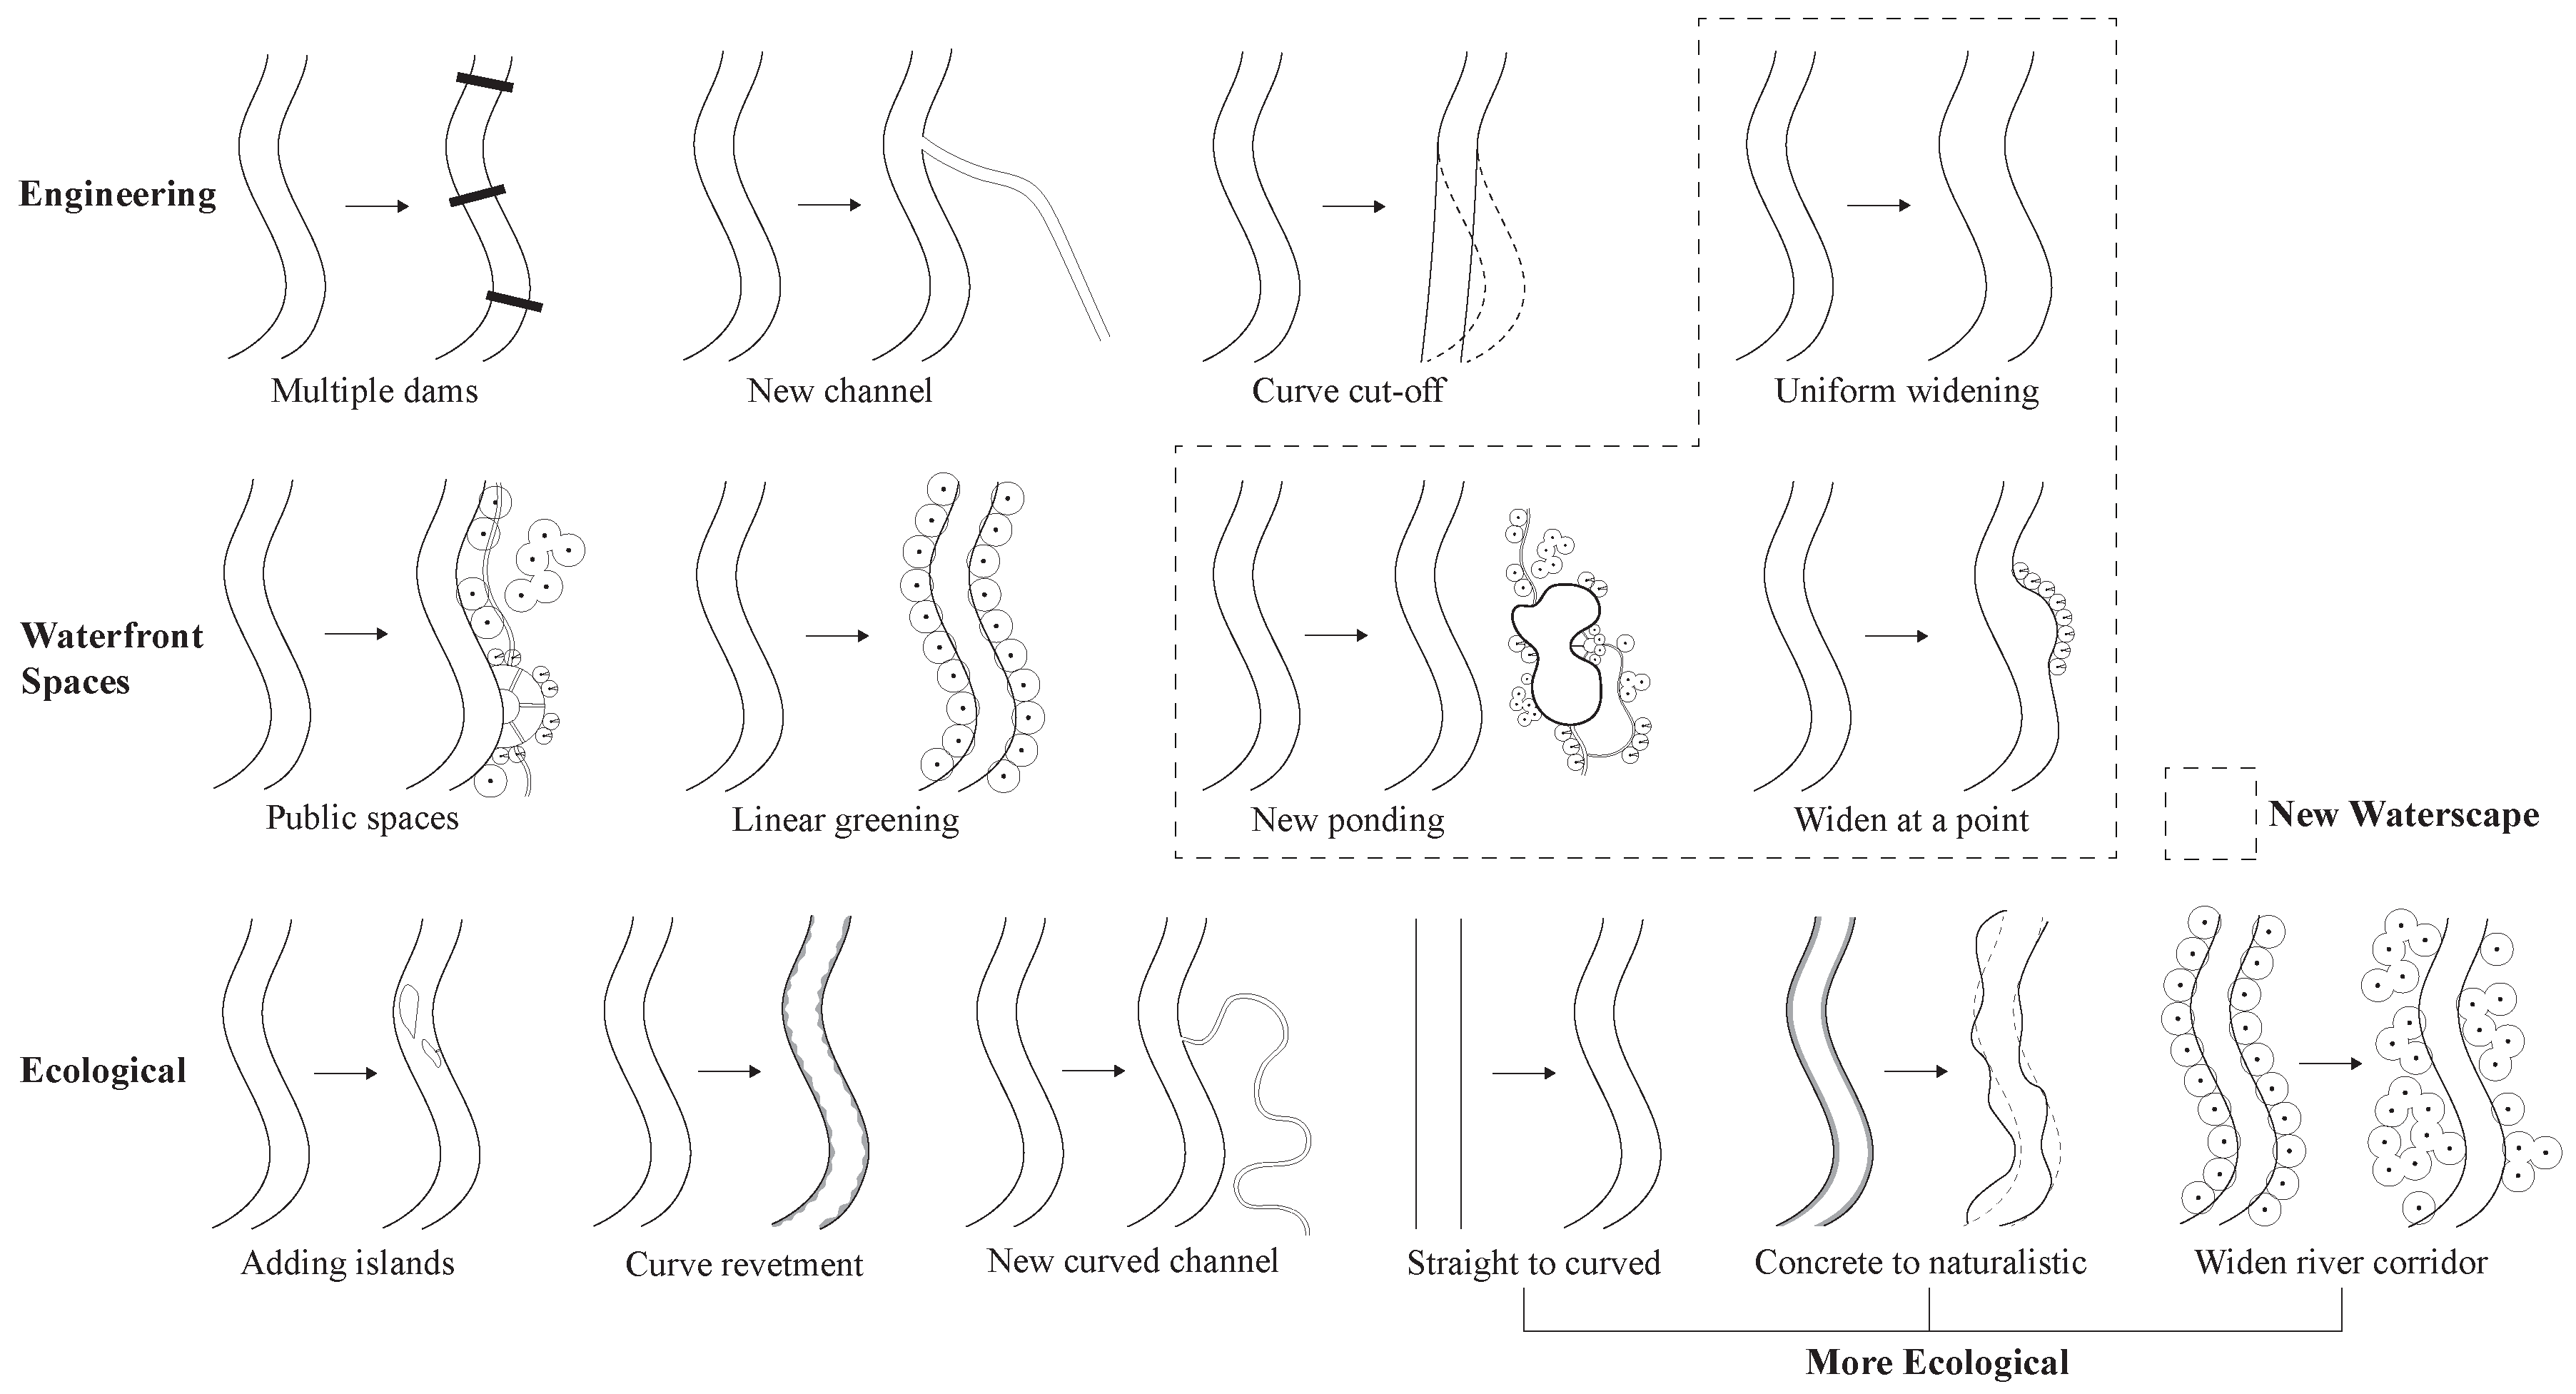
We identified each river project using our typology shown in Figure 2, in which river interventions are classified by their dominant characteristics as ‘engineering’, ‘waterfront spaces’, or ‘ecological’, and a specific type within these broad categories (Table 4). It is worth noting that projects in the ‘ecological’ category would not necessarily be considered as benefiting ecology by the standards of most environmental scientists, but only that they in some way tended to make the water body more complex or naturalistic (e.g., through establishing meanders in a formerly straight channel, adding islands or secondary channels). Among the ‘ecological’ project types, three (‘Straight to curved’, ‘Concrete to naturalistic’ and ‘Widen river corridor’) can be considered more ‘ecological’ than the others, so we did a separate analysis only on them (Figure 2).
In addition to the modifications to river channels shown, we encountered many new ponds. Prior research has shown that urbanization can result in the extensive disappearance of ponds from the landscape in China [47], whereas in many of the cities we studied, newly-urbanized areas gained new ponds, many with elongated shapes resembling rivers (but not flowing anywhere), which would support cities’ applications for Landscape Garden City designation. We mapped only such ponds in urban areas, whose purpose is essentially decorative, not water bodies with functions such as reservoirs and fish ponds, etc.
Some types of projects (‘uniform widening’, ‘new ponding’ and ‘widen at a point’) resulted in a net increase in surface area of water, which would be advantageous for a city to qualify for the ‘Landscape Garden City’ designation. We designated these project types as ‘new waterscape’ projects, as they created water bodies that did not previously exist at that location.
In addition, for the temporal pattern of the three groups of river projects, we compiled data on the year of the construction of the projects. As high-resolution aerial maps were available going back only 11.3 years on average, and we found no aerial maps from 2016 for some cities, we analyzed the 10 years from 2006 to 2015. To show the change clearly, we divided the numbers by the total number of the group, so for the engineering projects in 2006, we have the number ‘11’, then we divided it by the total engineering projects to normalize it.
2.2. Data Analysis
For all the river projects, we first summarized the numbers and types of projects encountered in our study cities to characterize overall patterns across China (The detailed data could be found in the Supplementary Materials). We then sought to explain patterns of project type and frequency based on various factors. We set the river project characteristics (e.g., dimensions, types) as dependent variables, and analyzed them against 19 independent variables (Table 5). The dependent variables include types and characteristics of projects we documented, as well as summary statistics for the total number of river projects, and number of ‘engineering’, ‘waterfront spaces’, and ‘ecological’ projects. We performed stepwise regression analyzes separately for the different river projects, first pooling together all the projects, and thereafter for the projects grouped into ‘engineering’, ‘waterfront spaces’, ‘ecological’, and ‘new waterscape’, etc. The stepwise regression was intended to combine explanatory variables by minimizing their multi-collinearities. Moreover, every model we established passed the following tests: F-test, Student’s t-test, Durbin Watson (DW) and variance inflation factor (VIF). Finally, among the 14 types of river projects, we discuss three in greater depth because they are so commonly implemented in China: ‘uniform widening’ (Figure 3), ‘new ponding’ (Figure 4) and ‘curve revetment’ (Figure 5). In addition, for the ‘uniform widening’ projects, we calculated the degree of widening (widened river width divided by original river width) and analyzed the influence of various factors on the net widening.
3. Results
3.1. The Numbers and Distribution of Different River Projects
For the 104 cities we studied, we identified an average of 11.7 years of imagery per city in which one or more river projects were constructed, as visible on aerial imagery. We then calculated the average number of years of imagery in which each type of the project occurred (Table 6). ‘Waterfront spaces’ is the most common of the three broad categories (60.5%), followed by ‘engineering’ (28.7%) and ‘ecological’ (10.8%). Of the specific project 14 types, ‘public spaces’ and ‘linear greening’ are the most common, followed by ‘new ponding’, ‘multiple dams’, and ‘uniform widening’. Except for ‘public spaces’, ‘linear greening’ and ‘multiple dams’, most project types were dominantly in newly-constructed districts (more than 90%). Our analysis clearly indicates that most urban river projects in China are concentrated in new districts, i.e., districts other than the original central district.
3.2. Temporal Pattern of Project Construction
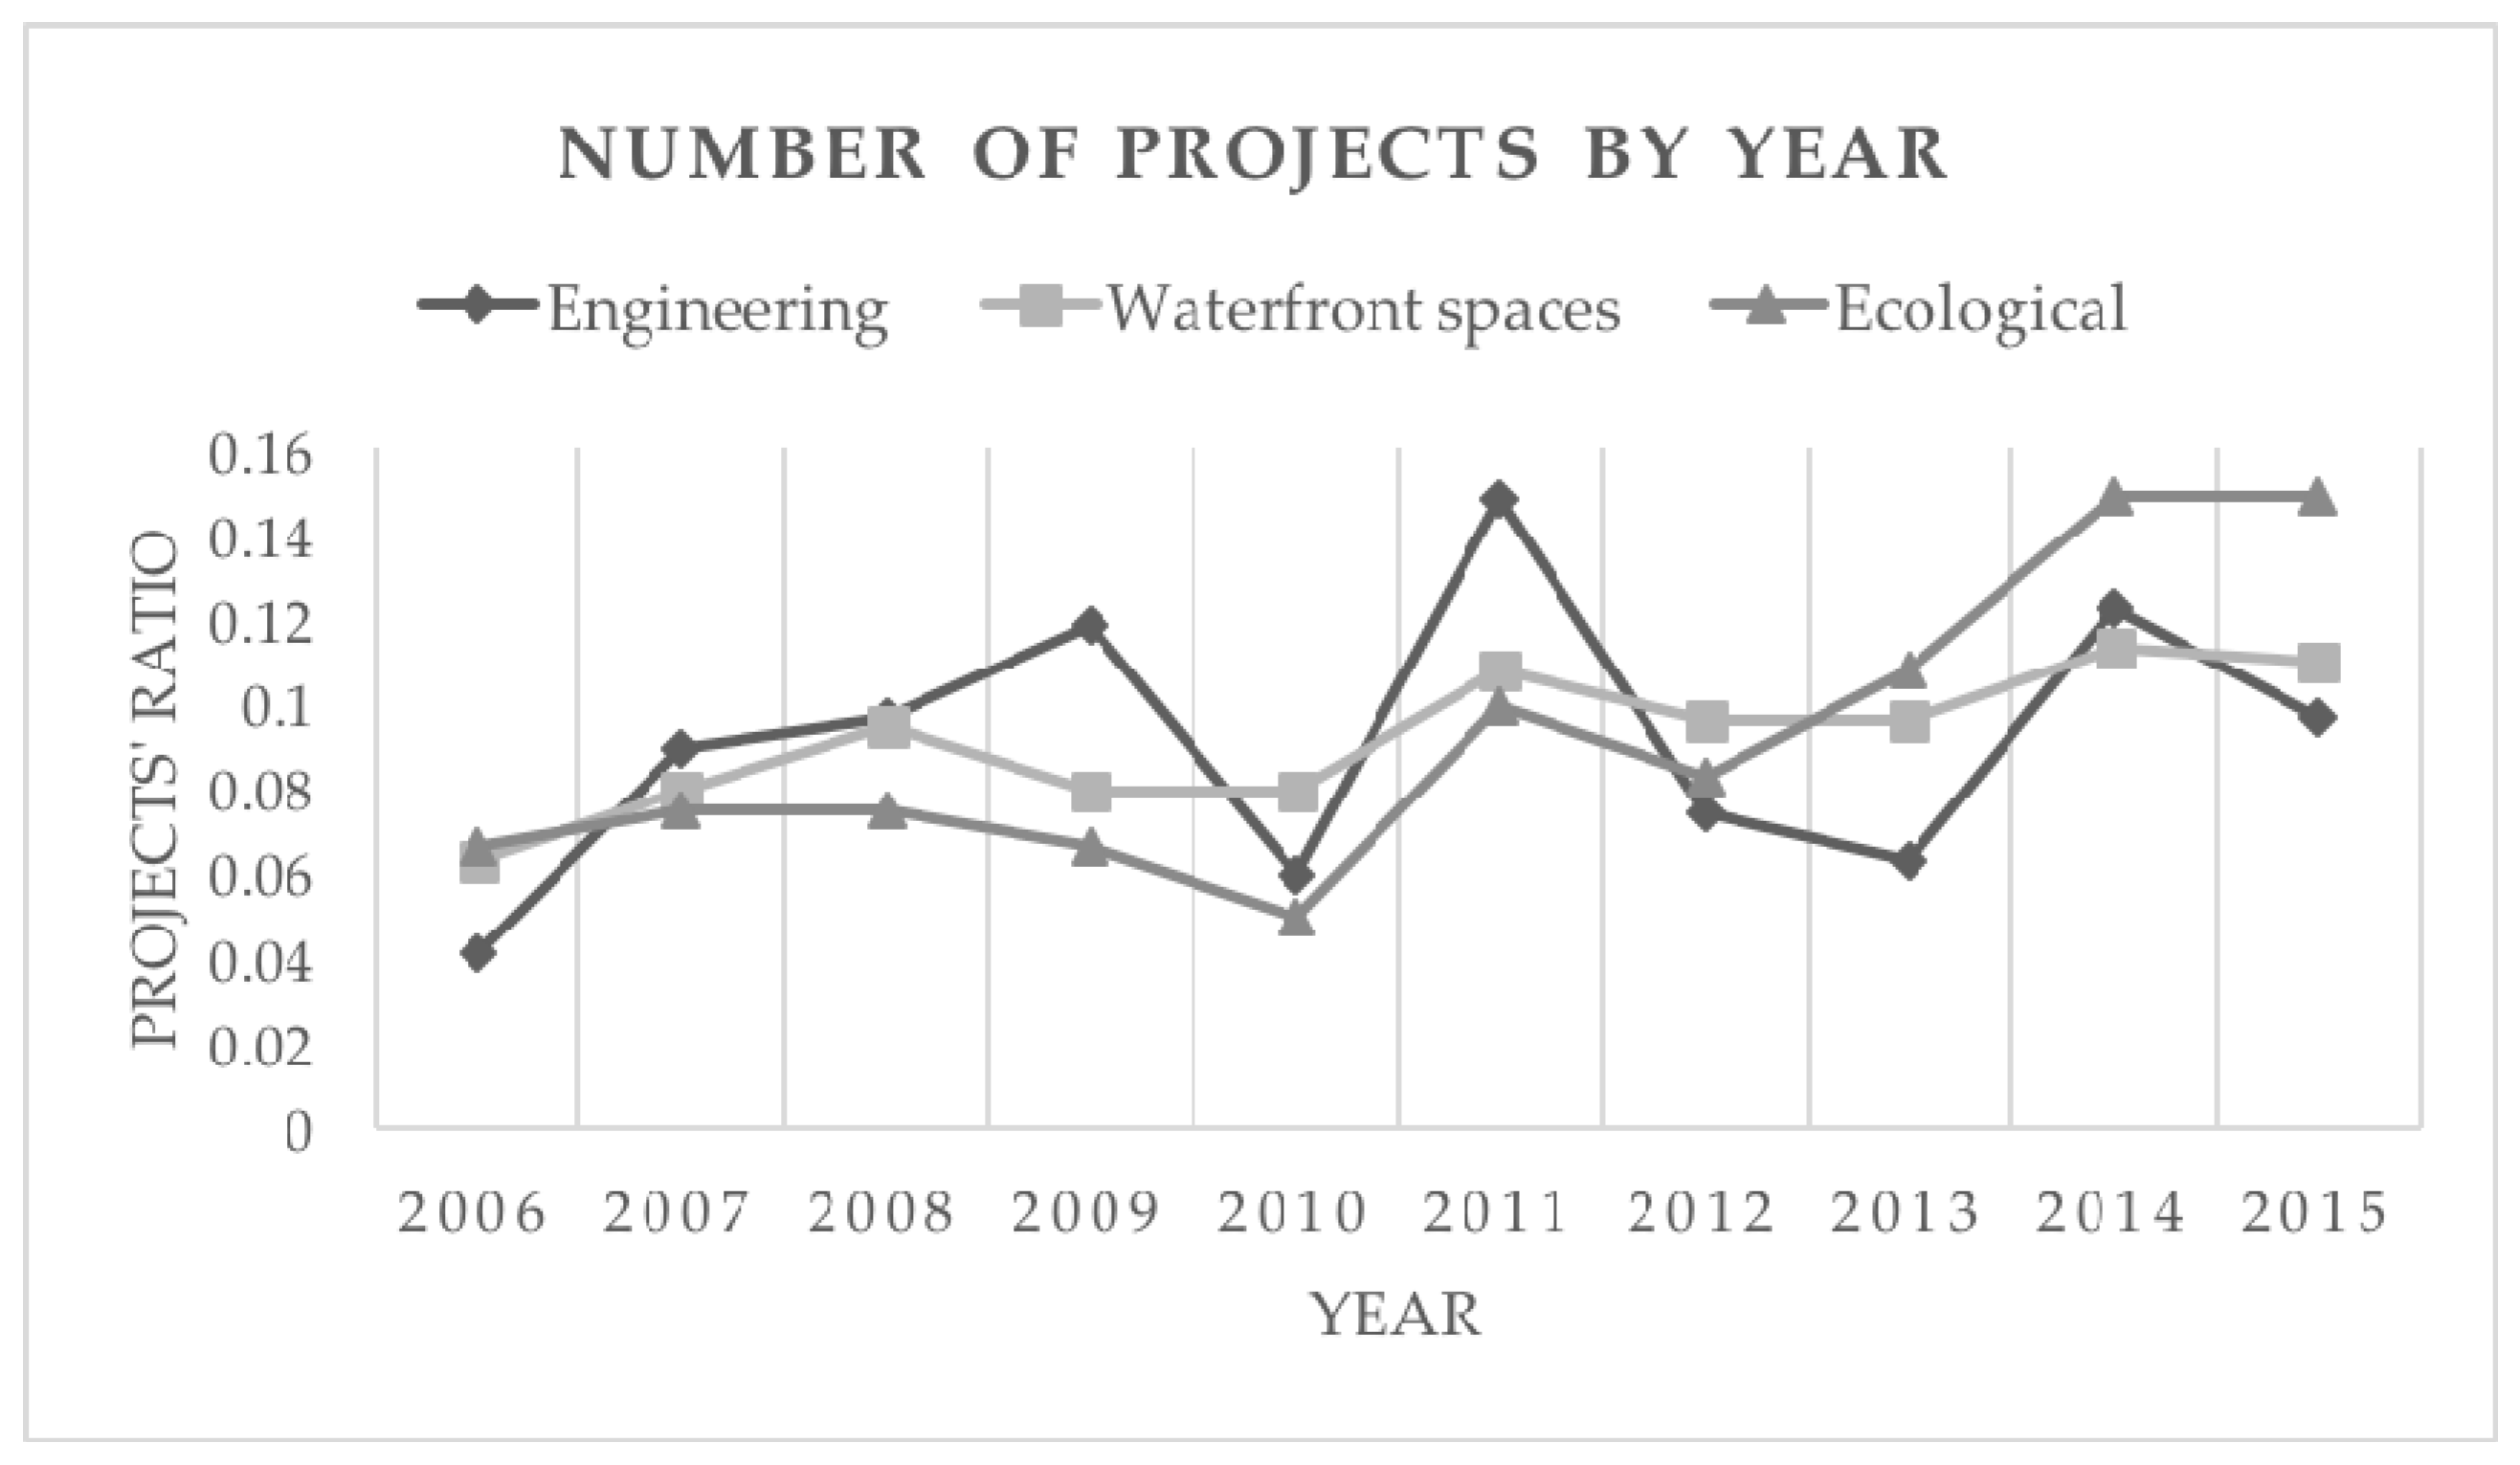
The number of river projects constructed by year in the three categories shows two minor peaks, in 2011 and 2014 (Table 7, Figure 6). ‘Waterfront spaces’ and ‘ecological’ projects show a steady, increasing trend over our study period (especially ‘ecological’ post 2012), while the number of projects in the ‘engineering’ category fluctuated more.
3.3. Relations among Project Types and Independent Variables
Stepwise multiple regression analyses for all groups of river projects demonstrate that five variables are significantly correlated with the total river projects (adjusted accumulated r2 = 0.604) (Table 8). Except for ‘Area of built district’, ‘Landscape Garden City’ designation is the most significant variable (r2 change = 0.073), displaying a positive correlation, followed by excess precipitation ‘P-E’ (0.046) (negative correlation), GDP per capita (0.037) (positive), and ‘maximal river width’ (0.017) (negative). Engineering projects show weaker relationships with the selected variables (adjusted accumulated r2 = 0.426). The most two significant variables are ‘area of built district’ (r2 change = 0.259) and ‘minimal monthly precipitation’ (0.100). ‘Waterfront spaces’ projects and ‘new waterscape’ exhibit a closer relationship with the independent variables than engineering projects (r2 = 0.611 for ‘waterfront spaces’ and r2 = 0.520 for ‘new waterscape’). The two groups are both mainly correlated with ‘area of green spaces’ (r2 change = 0.463 and 0.305), both with positive correlation. And they are both positive correlated with ‘Landscape Garden City’ designation (r2 change = 0.086 and 0.067). Ecological projects don’t show any correlations with climate or topography, but do with social-economic variables, as is the case for all three categories.
The number of projects of all three categories exhibit significant and positive correlations with social-economic factors such as ‘area of built district’ and ‘GDP per capita’, indicating that larger and more prosperous cities were more likely to have more river projects. Cutting across social-economic conditions, whether a city is designated as a ‘Landscape Garden City’ is strongly positively correlated with the number of projects, indicating this designation was a strong motivation for cities to build such projects. Excess precipitation (P-E) is negatively correlated with the number of projects, or put another way, there were more projects in cities with drier climates. Also, ‘maximal river width’ and ‘minimal monthly precipitation’ show negative correlation with the projects. In addition, only elevation of the topographic factors demonstrates a positive correlation with ‘waterfront spaces’ and ‘new waterscape’.
3.4. Typical Urban River Projects in China
Stepwise multiple regression analyses for the three most common types of river projects (Figure 3, Figure 4 and Figure 5) are summarized in Table 9. For ‘uniform widening’, the model is explained by two variables (with r2 of 0.240): ‘P-E’ is negatively correlated (r2 change = 0.132). The model for degree of widening (widened river width divided by original river width) selected three variables whose explanatory power is 0.251, with ‘P-E’ negatively correlated (r2 change = 0.176), and ‘maximal monthly precipitation’ positively correlated (0.049). For ‘new ponding’ projects, four variables are significantly correlated, with explanatory power of 0.321. Most significantly, the designation as a ‘Landscape Garden City’ is positively correlated (r2 change = 0.204), followed by ‘area of green spaces’ (0.058), which itself is a standard for designation as a ‘Landscape Garden City’. For ‘curved revetment’, ‘urban district population’ is positively correlated, while ‘precipitation’ is negatively correlated.
4. Discussion
4.1. The Waterfront Spaces Occupied Status and New District Clustering Distribution
Waterfronts have become hot spots for urban redevelopment worldwide [48,49]. Most urban river projects have aimed to improve aesthetics, enhance city identity, and provide open-space and recreational opportunities for urban dwellers [50], and have rarely focused on enhancing biodiversity and other ecosystem service [51]. Our results show that most river projects in urban China have aimed to create waterfront spaces for human use [36] or to enhance real estate market values [52]. Waterfronts are ideal sites for residential and commercial development [53], and river-view and lake-view housing tends to fetch higher prices than other kinds of housing [35,54].
Our analysis shows that the most common types of projects in Chinese cities have been ‘waterfront spaces’, with new ‘public spaces’ or ‘linear greening’ along rivers in almost every city in our study. As we documented with newly constructed urban ponds (often river-shaped), new urban districts have undergone substantial reshaping of the landscape, including often massive rearrangement of existing water bodies and the creation of entirely new ones.
Ecologically-oriented projects were the least common. Projects in our ‘ecological category’ include some that would not generally be considered as necessarily enhancing ecological function but simply add complexity, such as ‘adding islands’ and ‘curve revetment’, based on notions that curvilinear boundaries can enhance ecosystem function [55] and the importance of the length of the interface between land and water. However, most islands added in Chinese urban river projects have geometric shapes and vertical concrete banks, and thus provide little or no aquatic or riparian habitat. In addition, traditional Chinese notions of Mountains-Waters Culture (Shan-Shui Culture) and Taoism call for mountains and waters in a garden [41,56], so that islands commonly represent mountains in a garden by using the design method ‘see big things through small ones’. Curve revetments have been widely used as a strategy to improve the ecological value of channelized rivers in China [5]. Curved banks are typically constructed with revetment, with vegetation planted on top to appear more ‘natural’. These types arguably increase the length of the water-land interface but add little, if any, ecological value. Project types that are arguably more ecological, like ‘concrete to naturalistic’ and ‘widen river corridor’, occurred in few of the cities in our study.
In addition, most of the river projects were constructed in new districts. The last two decades have seen tremendous urban expansion and corresponding growth of the real estate market in China [57,58], with urban riverfront projects serving as drivers affecting construction [22], with river projects often as key selling points, justifying higher prices. As a result, in new districts, we find more rivers are dammed, widened, decorated, and have new waterfront spaces created adjacent to these water bodies, with more rapidly urbanizing cities tending to transform their rivers more dramatically.
4.2. The Policy Dominated Projects in China
In interpreting the temporal pattern of urban river project construction (Figure 6), it is important to consider the influence of national real estate and land policy, as well as that of the Landscape Garden City program (discussed below). In mid-2010, the first ‘house purchase quota policy’ was issued to control rapid-inflating housing prices. As a result, new housing construction slowed (from an urbanization growth rate of 6.6% in 2010 to 3.3% in 2011 [59,60,61]). The year of construction we recorded reflects when the projects were completed, and as these are inevitably multi-year projects, that can explain why the peak (2011) lagged behind the slowdown in residential construction.
Regarding ecological policy, in November 2012, ‘Beautiful China’ was written into the report of the 18th National Congress of the Communist Party of China, and in 2015, it was brought into China’s 13th Five-Year Plan. In January 2014, the policy of the ecological ‘red line’ (setting limits to further urban expansion) reached the national level and redlines were delimited in 2014. The increased occurrence of ‘ecological’ urban river projects after 2012 may partly reflect this national policy. For the Landscape Garden City designation, standards limiting engineering construction were added in 2012, since then ‘ecological’ projects have become more common, as ‘engineering’ projects have decreased.
These patterns for Chinese cities may reflect the central-government policy-dominance in China. While in the U.S., it can be argued that the government ‘made the rivers’ [15], local forces and influences also played a role in urban waterfront development, and this has been true also in China [62]. Nonetheless, China’s decision-making process is more top-down than in many other countries [22] and observed patterns of urban waterfront projects likely reflect its national policies.
4.3. The ‘Landscape Garden City’ Designation Promoted Decorating River Projects Other Than Ecological Projects
One of the most important influences of the central government has been the ‘Landscape Garden City’ designation, which our results show to be positively correlated with ‘total river projects’ (Table 8) overall, not only projects specifically associated with decorating: ‘waterfront spaces’ and ‘new waterscape’ (Figure 2). Conversely, the regression models don’t select the ‘Landscape Garden City’ designation as driving ‘engineering’ or ‘ecological’ projects. But overall, ‘Landscape Garden City’ designation is correlated with all the groups of projects (p < 0.05). The ‘more ecological’ projects show the weakest correlation with ‘Landscape Garden City’ (Pearson r = 0.184), suggesting that the ‘Landscape Garden City’ designation didn’t promote true ecological river restoration. Instead, more projects with naturalistic appearance (‘ecological’ projects, r = 0.369) and ‘engineering’ projects (r = 0.369) were built. The regression model shows that the most significant factor correlated with ‘new ponding’ is also the ‘Landscape Garden City’ designation (Table 9). Although some ecological requirements were added to the Landscape Garden City standards in 2005, real ecological projects are uncommon. The significant correlation between Landscape Garden City and ‘waterfront spaces’, ‘new waterscape’ indicate the main results of ‘Landscape Garden City’ program were to build green spaces for human use instead of ecological improvements.
4.4. River Projects at Odds with Local Climate
Excess precipitation (‘P-E’) is significantly negatively correlated with two groups of river projects (‘total river projects’ and ‘new waterscape’, Table 8), which demonstrates that cities in drier climate regions tended to construct more river projects than those in humid regions. Engineering projects are significantly negatively correlated with ‘minimal monthly precipitation’ (r2 change = 0.100), also indicating that cities in northern China with less precipitation in winter tended to construct more engineering projects. Excess precipitation is significantly negatively correlated with ‘uniform widening’, ‘degree of widening’ and ‘new ponding’ (Table 9).
Our results demonstrate that Chinese cities in drier climates have enlarged water bodies and impounded water bodies more than humid-climate cities. Such a tendency to create new water bodies, enlarge the scale of existing ones, and to perennialize naturally seasonal water bodies has previously been documented in dry and seasonal-climate cities in the US, Portugal, Spain, and India [63,64,65,66], and evidently reflects a widespread cultural preference for perennial waters and larger-scale rivers within the urban setting. In some cases, the enlarged water bodies were created simply by impounding an existing river [63,66], while in other cases imported water was used [64,65]. With nearly every northern city in China facing a water crisis, the construction of new waterscapes with high evapotranspiration potential may not be sustainable [67,68], given the water requirements to maintain such artificial water landscapes [69]. Ironically, the ‘Landscape Garden City’ designation, by promoting the new waterscape projects, has played a role in increasing the imbalance between water supply and demand in cities in the dry north China climate.
4.5. The Characteristics of the Typical River Projects
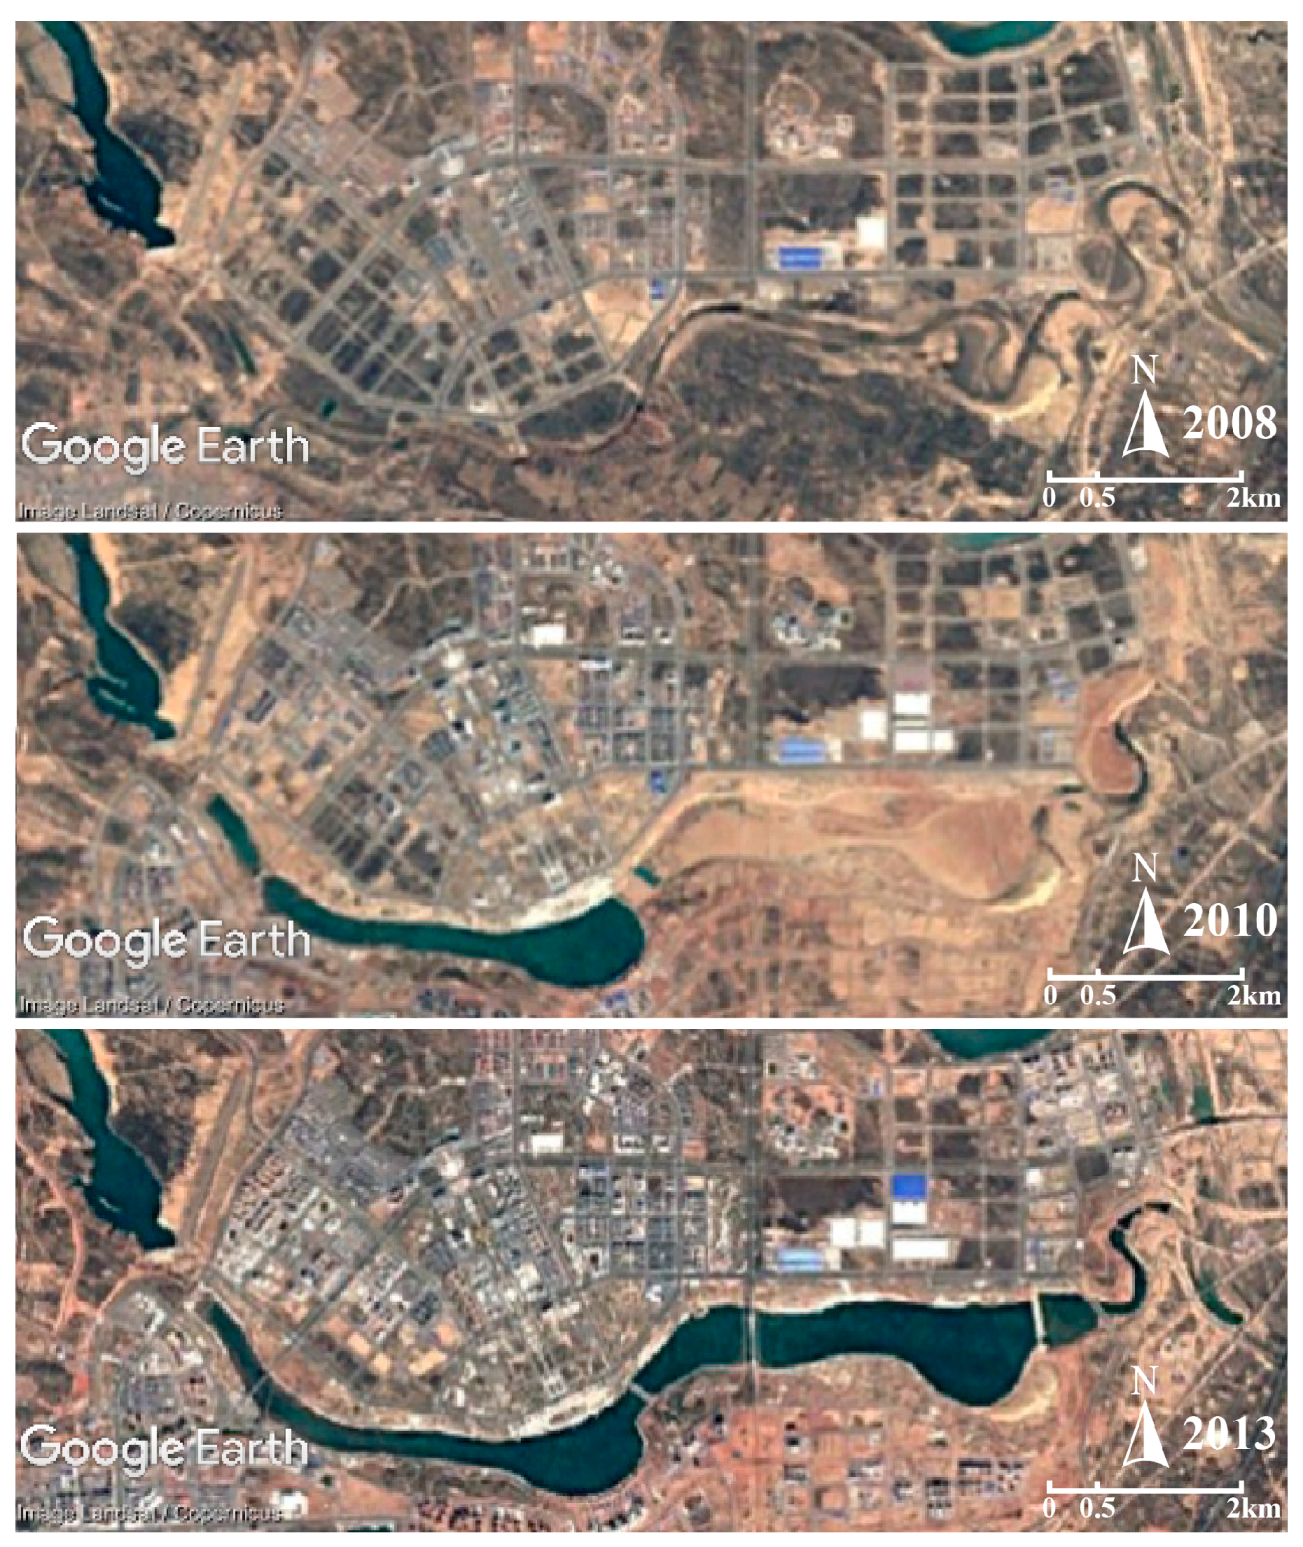
The urbanization of a drainage basin and consequent changes to runoff and sediment loads can produce changes in river channels, with increases in channel width of 2–3 times typical, and up to 15 times reported [9]. We documented an average widening rate of 4.35 times for the 72 cities (out of the 104 we studied), but these width increases result from direct mechanical modification of the channel, not erosion in response to changed flow and sediment load from the drainage basin. The cities with one main river traversing the city center have commonly widened the river channel to beautify the city and to make the river to be vital area of the city (e.g., Zhangjiakou, Weinan, Jincheng). Some cities constructed levees and dams to impound the river into a series of ponds, increasing the size and visual effect of the river within the city, but also breaking its longitudinal connectivity. These projects were most common in drier areas, such as Ordos (Figure 3) and Qian’an.
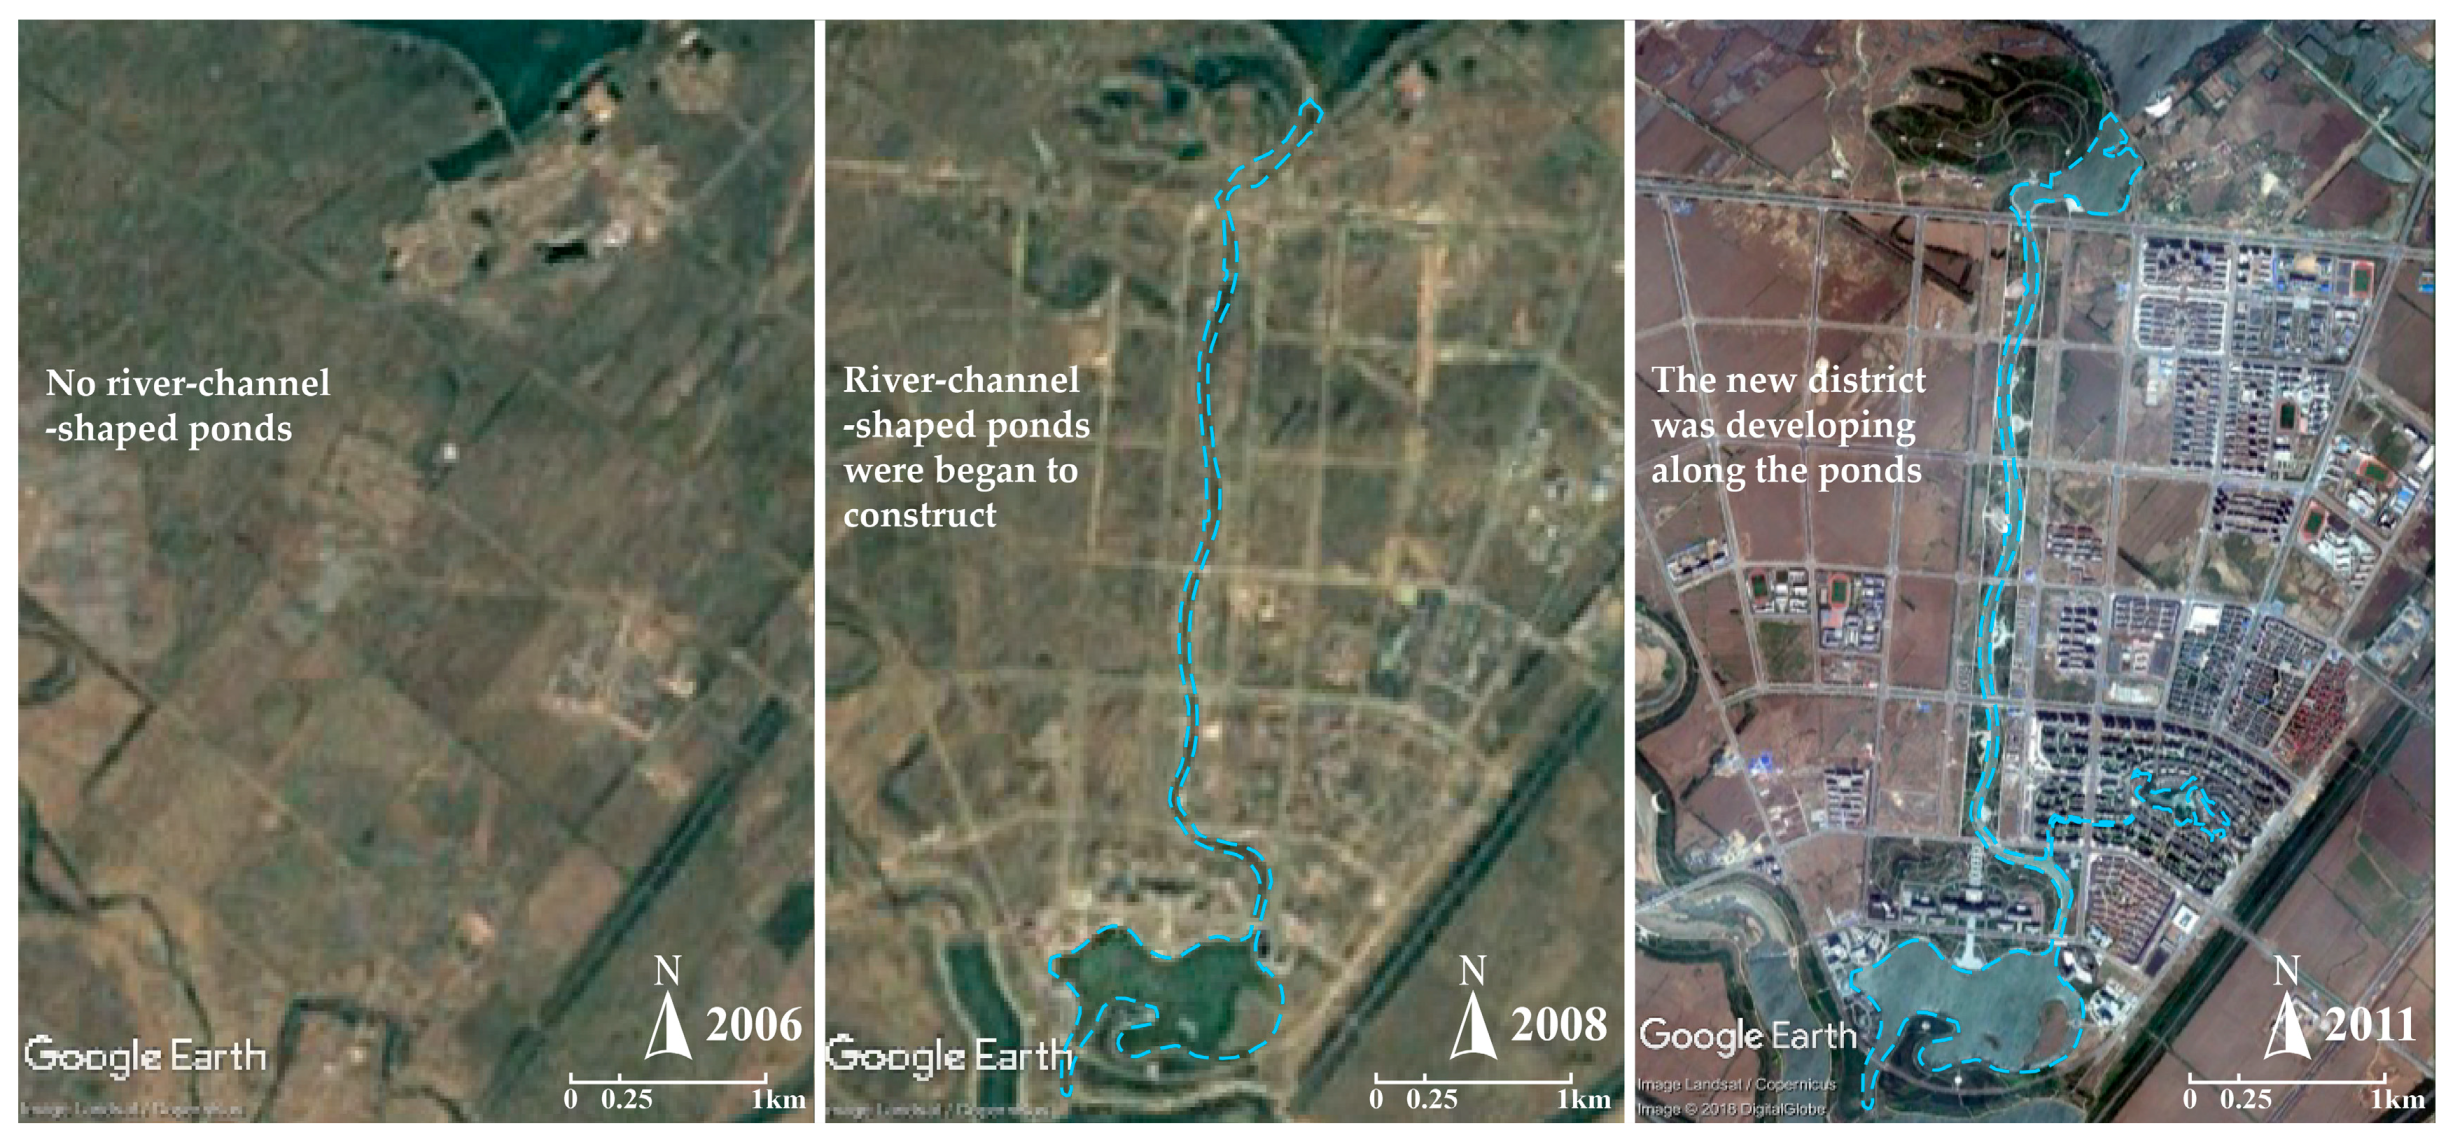
Meander-shaped ponds were popular as the central foci of parks and axes of open space. Some northern cities aimed to construct new districts and ‘water-cities’ by building new water bodies [70], as illustrated by Tieling (Figure 4).
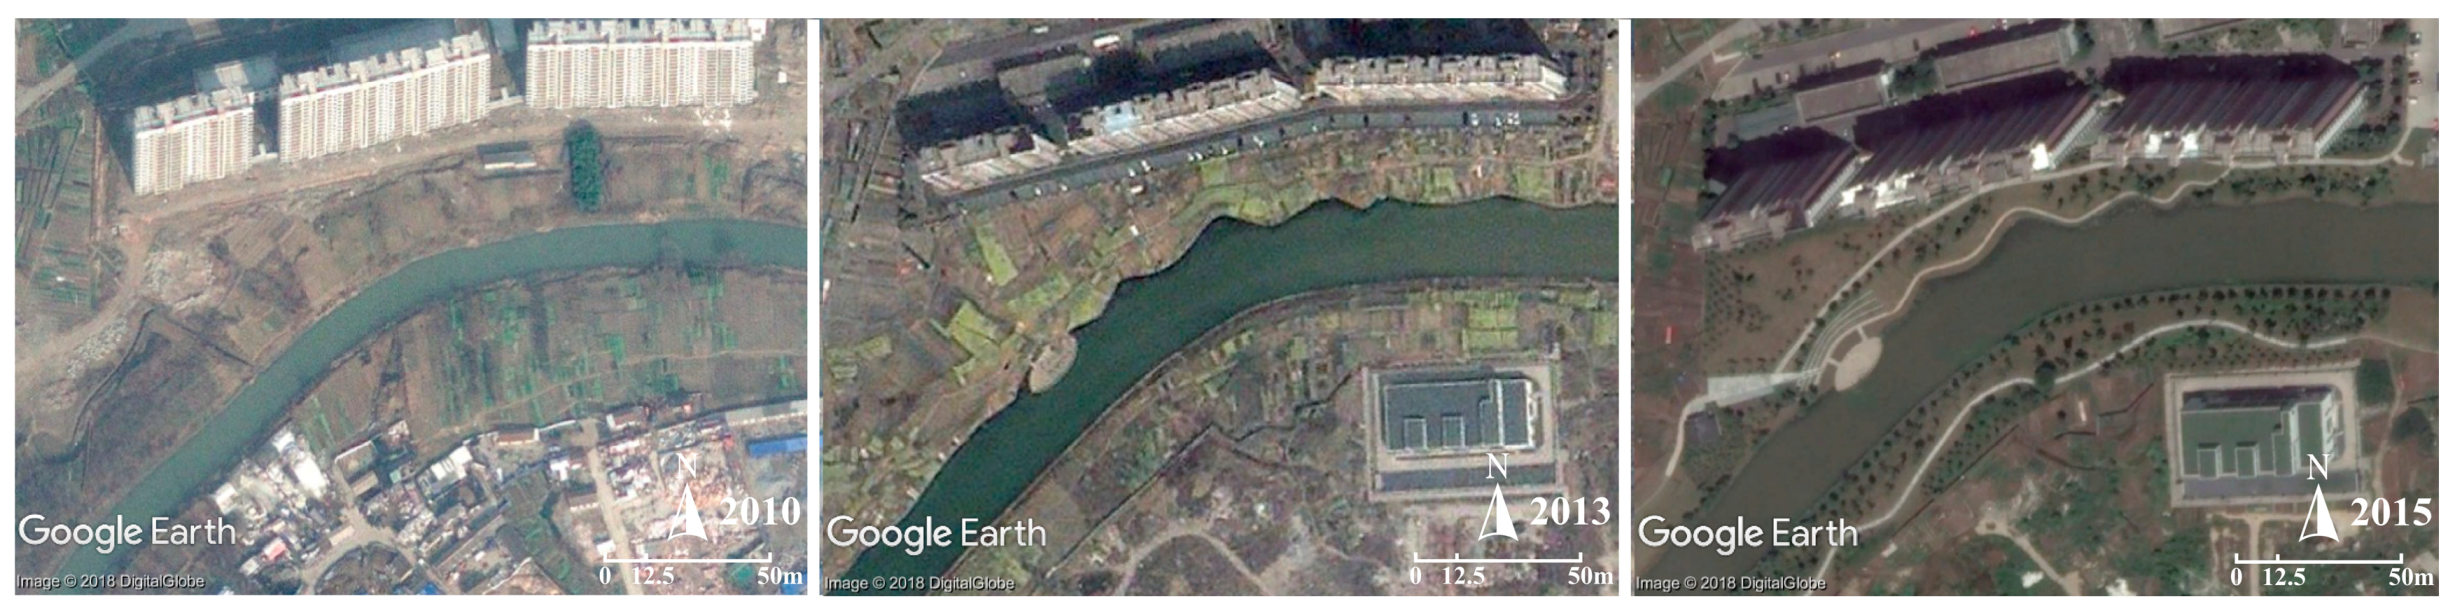
Curved revetment has been advocated to improve sinuosity of rivers in China [5]. In 2005, improving the ecological value of river revetment (typically by planting vegetation on the bank top) was added to the standards of ‘Landscape Garden City’. Maintaining or increasing the sinuosity of rivers and imitating the shape of natural river is considered an important design principle [5,38,39]. ‘Curve revetment’ was a popular method to construct ‘ecological’ parks along rivers (e.g., Jiangyin, Figure 5). The curved contour reads as “ecological” for many people, even though there is little real ecological value, especially with revetted banks.
4.6. Influence of Social-Economic Context on River Projects
The ‘area of built district’, ‘area of green spaces’ and ‘urban district population’ significantly and positively correlated with the number of river projects. This makes sense because within a larger urban area we will encounter more projects. Though we only counted the years with given project types existing and did not count multiple examples of the same types of projects within the same year, there remains a large gap between big and small cities. GDP also demonstrates a positive correlation with the number of projects, with bigger cities having higher GDP (Pearson r = 0.709) and GDP per capita (0.247). Thus, cities with larger area and higher GDP tended to construct more river projects.
4.7. Comparison to Urban River Projects in the West
While we are not aware of a comparable study (e.g., using stratified random sampling, systematic analysis of satellite imagery) of urban river restoration projects in the North America, Europe, and Australia, we can compare the characteristics of projects we document in Chinese cities with those in western cities as reported in published studies (e.g., Castonguay and Evenden, 2012 [71]). Both western and Chinese urban river projects are dominated by social and economic goals, creating spaces in which urban residents and tourists can interact with the river. These interactions can range from passive uses (such as quiet and secluded contemplation) to active (such as running a riverside trail), and from bank-top down to in-channel uses (such as swimming and fishing) [72]. The latter, in-water uses depend strongly on good water quality conditions increasingly since the US Clean Water Act (1972 and subsequent amendments) and the EU Water Framework Directive (2000), and require good vertical connectivity [73], which is not universally the case. Urban river projects in North America and Europe are dominantly undertaken on existing rivers, commonly at the city’s historic core, but with the explosive pace of urbanization in China, and rapid construction of new districts, urban river projects in China occur in large part in new districts and are constructed with an eye towards qualifying for landscape garden city designations. In many cases these involve creating entirely new water bodies in new districts, many of which are not flowing rivers but might be better characterized as elongated lakes.
The tendency we documented in China for drier-climate cities to pond small rivers to create larger, perennial water bodies has parallels in the West, with many examples of such projects, such as the Ebro River, Zaragosa, Spain [74], the Salt River, Tempe, Arizona [72], and an ultimately unbuilt proposal to build multiple dams on the Guadalupe River, California [63].
5. Conclusions
Cities have long been preferentially located on rivers, and rivers have been the cultural and economic heart of most cities over history, an essential living element of the urban landscape [66,74,75,76]. After a century in which industrial cities in the West turned their backs on their rivers and during which urban rivers underwent adjustments in response to altered flow, sediment loads, and pollutant loads [9], the late 20th and early 21st centuries have seen a resurgence of interest in reconnecting cities with their rivers [71,73]. While some of these projects have emphasized ecological restoration [77], most have focused on social and economic benefits. Our research has for the first time documented the extent of urban rivers projects in China. While terms such as ‘ecological’ and ‘restoration’ have been used to describe some of these projects, very few have involved genuine ecological improvement. Most of urban river projects in China are best characterized as ‘decorating’ rivers, rather than restoring natural river processes and ecology, and their goals are primarily social and economic (stimulating urban development or redevelopment, increasing property values, etc.), consistent with patterns evident among urban river restoration projects in North America and Europe. Creating spaces for social uses has predominated over ecological projects, with the latter highly constrained in any event by the modifications to hydrology in urban drainage basins and encroachment of development up to river banks, constraining potential channel migration and creating conflicts from overbank floods.
In China, the ‘Landscape Garden City’ designation has promoted such ‘decorating’ projects, especially ‘linear greening’ projects and ‘public spaces’ along rivers, because these projects produce metrics that can allow a city to qualify for the garden city designation. In the broader context of urban sustainability, the selection of appropriate metrics of sustainability is still contested [78], and certainly in the specific context of ‘urban greening’ in China, many cities appear to be constructing projects that answer directly to the requirements for garden city designation, but do not go beyond the metric itself. Though there are some ecological principles, in the standards of ‘Landscape Garden City’, to meet the standards required for Landscape Garden City designation, cities were most likely to build river projects with green banks and linear parks in new districts, where it was easiest to gain larger scores in these categories. The ‘Landscape Garden City’ designation encouraged ‘new waterscape’ projects including ‘uniform widening’, ‘new ponding’ and ‘widen at a point’, which take decorating as the first principle and neglect ecological function. In addition, new river projects in China seem to not be based on availability of water resources. The cities in drier climates tended to construct more river projects, especially ‘engineering’ and ‘new waterscape’ projects, with many projects turning formerly seasonal rivers into year-round water bodies through impoundments, and often through augmenting natural flow. We focused on morphological changing of the rivers, mostly as visible on remotely sensed imagery, as we lacked sufficient data on most geological and geomorphological aspects. Moreover, other not easily quantified factors such as cultural geography no doubt affects river projects, which could likely explain some of the differences between cities of Northern and Southern China.
Supplementary Materials
The following are available online at https://0-www-mdpi-com.brum.beds.ac.uk/2071-1050/10/11/4103/s1, Table S1: Data of the 13 independent variables used in the analyses, Table S2: The years with river projects visible of the 104 cities, Table S3: Degree of widening of the 104 cities.
Author Contributions
Conceptualization, S.S., G.M.K. and D.L.; Data curation, S.S.; Formal analysis, S.S.; Investigation, S.S.; Methodology, S.S. and G.M.K.; Resources, S.S.; Supervision, G.M.K.; Validation, S.S.; Visualization, S.S.; Writing—original draft, S.S. and G.M.K.; Writing—review & editing, S.S., G.M.K. and D.L.
Funding
This research received no external funding.
Acknowledgments
The authors gratefully acknowledge the Collegium de Lyon—Institut des Etudes Avancées de l’Université de Lyon, the EURIAS Fellowship Programme, and the European Commission (Marie-Sklodowska-Curie Actions-COFUND Programme-FP7) for support of manuscript preparation by Kondolf. The Collegium also supported research collaboration of the authors with other scholars. In addition, we thank the Chinese Scholarship Council to support Shuhan Shi’s work as a visiting Ph.D. student at the University of California Berkeley, working with G. Mathias Kondolf. We also thank Haowen Lin, a Ph.D. Candidate of Peking University, who inspired us to apply new analytical methods.
Conflicts of Interest
The authors declare no conflict of interest.
References
- Chin, A.; Gregory, K. From research to application: Management implications from studies of urban river channel adjustment. Geogr. Compass 2009, 3, 297–328. [Google Scholar] [CrossRef]
- Downs, P.; Gregory, K. River Channel Management: Towards Sustainable Catchment Hydrosystems; Routledge: Cambridge, UK, 2014. [Google Scholar]
- Bernhardt, E.S.; Palmer, M.A. Restoring streams in an urbanizing world. Freshw. Biol. 2007, 52, 738–751. [Google Scholar] [CrossRef]
- Bernhardt, E.S.; Palmer, M.A.; Allan, J.D.; Alexander, G.; Barnas, K.; Brooks, S.; Carr, J.; Clayton, S.; Dahm, C.; Follstad-Shah, J.; et al. Ecology. Synthesizing U.S. river restoration efforts. Science 2005, 308, 636–637. [Google Scholar] [CrossRef] [PubMed]
- Dong, Z.; Sun, D. Principles and Technologies of Eco-Hydraulic Engineering; China Water & Power Press: Beijing, China, 2007. (In Chinese) [Google Scholar]
- Kenney, M.A.; Wilcock, P.R.; Hobbs, B.F.; Flores, N.E.; Martínez, D.C. Is Urban Stream Restoration Worth It? J. Am. Water Resour. Assoc. 2012, 48, 603–615. [Google Scholar] [CrossRef]
- Council, N.R. Restoration of Aquatic Ecosystems: Science, Technology, and Public Policy; National Academies Press: Washington, DC, USA, 1992. [Google Scholar]
- Dufour, S.; Piegay, H. From the Myth of a Lost Paradise to Targeted River Restoration: Forget Natural References and Focus on Human Benefits. River Res. Appl. 2009, 25, 568–581. [Google Scholar] [CrossRef]
- Chin, A. Urban transformation of river landscapes in a global context. Geomorphology 2006, 79, 460–487. [Google Scholar] [CrossRef]
- Gregory, K.J. The human role in changing river channels. Geomorphology 2006, 79, 172–191. [Google Scholar] [CrossRef]
- Taylor, K.G.; Owens, P.N. Sediments in urban river basins: A review of sediment–contaminant dynamics in an environmental system conditioned by human activities. J. Soils Sediments 2009, 9, 281–303. [Google Scholar] [CrossRef]
- Gregory, K. River channels. In Human Activity and Environmental Processes; Wiley: Chichester, UK, 1987; pp. 207–235. [Google Scholar]
- Gregory, K. Environmental effects of river channel changes. Regul. Rivers Res. Manag. 1987, 1, 358–363. [Google Scholar]
- Gurnell, A.; Lee, M.; Souch, C. Urban rivers: Hydrology, geomorphology, ecology and opportunities for change. Geogr. Compass 2007, 1, 1118–1137. [Google Scholar] [CrossRef]
- O’Neill, K.M. Rivers by Design: State Power and the Origins of US Flood Control; Duke University Press: Durham, NC, USA, 2006. [Google Scholar]
- Waley, P.; Aberg, E.U. Finding space for flowing water in Japan’s densely populated landscapes. Environ. Plan. A 2011, 43, 2321–2336. [Google Scholar] [CrossRef]
- Ashmore, P. Towards a sociogeomorphology of rivers. Geomorphology 2015, 251, 149–156. [Google Scholar] [CrossRef]
- Zhang, Y.H.; Jia, H.F.; Yao, Y.J.; Chen, X.G. Evaluating the evolution of the old urban river system of the plain river network in Southern Jiangsu Province. J. Food Agric. Environ. 2013, 11, 2556–2560. [Google Scholar]
- Fu, B.-J.; Zhuang, X.-L.; Jiang, G.-B.; Shi, J.-B.; Lu, A.Y.-H. FEATURE: Environmental Problems and Challenges in China. Environ. Sci. Technol. 2007, 41, 7597–7602. [Google Scholar] [CrossRef] [PubMed] [Green Version]
- Han, L.F.; Xu, Y.P.; Lei, C.G.; Yang, L.; Deng, X.J.; Hu, C.S.; Xu, G.L. Degrading river network due to urbanization in Yangtze River Delta. J. Geogr. Sci. 2016, 26, 694–706. [Google Scholar] [CrossRef]
- Wu, J.G.; Xiang, W.N.; Zhao, J.Z. Urban ecology in China: Historical developments and future directions. Landsc. Urban Plan. 2014, 125, 222–233. [Google Scholar] [CrossRef]
- Wang, Z.F. Evolving landscape-urbanization relationships in contemporary China. Landsc. Urban Plan. 2018, 171, 30–41. [Google Scholar] [CrossRef]
- Ministry of Water Resources. Water Resources in China; Ministry of Water Resources: Beijing, China, 2016.
- Cheng, H.; Hu, Y.; Zhao, J. Meeting China’s water shortage crisis: Current practices and challenges. Environ. Sci. Technol. 2009, 43, 240–244. [Google Scholar] [CrossRef] [PubMed]
- Jiang, Y. China’s water scarcity. J. Environ. Manag. 2009, 90, 3185–3196. [Google Scholar] [CrossRef] [PubMed]
- Xu, X. Practice of Static Control and Dynamic Management in Investment Management of Middle Route Project of South-to-North Water Transfer Project. Water Resour. Plan. Des. 2017, 12, 85–87. (In Chinese) [Google Scholar]
- Ding, Y.F.; Tang, D.S.; Wei, Y.H.; Sun, Y.X. Naturalization design of urban water landscape. Adv. Mater. Res. 2014, 919, 1559–1562. [Google Scholar] [CrossRef]
- Pei, Y.S.; Lin, C.J.; Tian, Z.H. An integrated rehabilitation of urban water environment in Guilin City, China. In Proceedings of the 2009 3rd International Conference on Bioinformatics and Biomedical Engineering, Beijing, China, 11–13 June 2009. [Google Scholar]
- Jia, H.F.; Sun, Z.X.; Li, G.H. A four-stage constructed wetland system for treating polluted water from an urban river. Ecol. Eng. 2014, 71, 48–55. [Google Scholar] [CrossRef]
- Li, F.; Wang, R.S.; Paulussen, J.; Liu, X.S. Comprehensive concept planning of urban greening based on ecological principles: A case study in Beijing, China. Landsc. Urban Plan. 2005, 72, 325–336. [Google Scholar] [CrossRef]
- Jim, C.Y.; Chen, S.S. Comprehensive greenspace planning based on landscape ecology principles in compact Nanjing city, China. Landsc. Urban Plan. 2003, 65, 95–116. [Google Scholar] [CrossRef]
- Yu, K.J.; Padua, M.G. China’s cosmetic cities: Urban fever and superficiality. Landsc. Res. 2007, 32, 255–272. [Google Scholar] [CrossRef]
- Francis, R.A. Positioning urban rivers within urban ecology. Urban Ecosyst. 2012, 15, 285–291. [Google Scholar] [CrossRef]
- Fumagalli, N.; Toccolini, A. Relationship Between Greenways and Ecological Network: A Case Study in Italy. Int. J. Environ. Res. 2012, 6, 903–916. [Google Scholar]
- Wen, H.Z.; Xiao, Y.; Zhang, L. Spatial effect of river landscape on housing price: An empirical study on the Grand Canal in Hangzhou, China. Habitat Int. 2017, 63, 34–44. [Google Scholar] [CrossRef]
- Sun, P.; Wang, Z. The natural landscape of the river and waterfront design in urban areas. City Plan. Rev. 2000, 24, 19–22. (In Chinese) [Google Scholar]
- Ma, B. Searching for Design Method about Waterfront Environment in the City Park with Ecology Priority. Appl. Mech. Mater. 2013, 357, 2028–2031. (In Chinese) [Google Scholar] [CrossRef]
- Sun, D.; Dong, Z.; Xu, M.; Zhu, C.; Zhao, J. River ecological restoration: Techniques and practices. Water Resour. Hydropower Eng. 2006, 37, 4–7. (In Chinese) [Google Scholar]
- Dong, Z. River Restoration; China Water & Power Press: Beijing, China, 2013. (In Chinese) [Google Scholar]
- Chen, X.; Wu, J. Sustainable landscape architecture: Implications of the Chinese philosophy of “unity of man with nature” and beyond. Landsc. Ecol. 2009, 24, 1015–1026. [Google Scholar] [CrossRef]
- Peng, Y. Analysis of Chinese Classical Garden; China Architecture & Building Press: Beijing, China, 1986. (In Chinese) [Google Scholar]
- Ministry of Housing and Urban-Rural Development of the People’s Republic of China. Available online: http://www.mohurd.gov.cn/ (accessed on 2 November 2017).
- Jin, Y.; Chen, G.; Ma, W. Re-recognition of the target orientation of the ‘National Garden City’ from the evolution of evaluation indexes. Shanghai Urban Plan. 2015, 5, 75–80. (In Chinese) [Google Scholar]
- List of Cities in China. Available online: https://en.wikipedia.org/wiki/List_of_cities_in_China (accessed on 20 May 2017).
- The State Council of the People’s Republic of China. The Adjustment of the Standard on City Scales Classification. Available online: http://www.gov.cn/zhengce/content/2014-11/20/content_9225.htm (accessed on 5 May 2018). (In Chinese)
- Ren, Z.; Li, M.; Zhang, W. Conversion Coefficient of Small Evaporation Pan into E601B Pan in China. J. Appl. Metrol. Sci. 2002, 13, 508–512. (In Chinese) [Google Scholar]
- Du, N.; Ottens, H.; Sliuzas, R. Spatial impact of urban expansion on surface water bodies—A case study of Wuhan, China. Landsc. Urban Plan. 2010, 94, 175–185. [Google Scholar] [CrossRef]
- Bassett, K.; Griffiths, R.; Smith, I. Testing governance: Partnerships, planning and conflict in waterfront regeneration. Urban Stud. 2002, 39, 1757–1775. [Google Scholar] [CrossRef]
- Moulaert, F.; Rodríguez, A.; Swyngedouw, E. The Globalized City: Economic Restructuring and Social Polarization in European Cities; OUP Oxford: Oxford, UK, 2003. [Google Scholar]
- Chang, T.C.; Huang, S. Reclaiming the City: Waterfront Development in Singapore. Urban Stud. 2011, 48, 2085–2100. [Google Scholar] [CrossRef]
- Dyson, K.; Yocom, K. Ecological design for urban waterfronts. Urban Ecosyst. 2015, 18, 189–208. [Google Scholar] [CrossRef]
- Bao, J.; Liu, X. Reflection on Renewal of Water-side Area Guided by Real Estate Development—With the East Riverside Area of Guangzhou as an Example. Planners 2005, 21, 107–110. (In Chinese) [Google Scholar]
- Hagerman, C. Shaping neighborhoods and nature: Urban political ecologies of urban waterfront transformations in Portland, Oregon. Cities 2007, 24, 285–297. [Google Scholar] [CrossRef]
- Wen, H.Z.; Zhang, Y.; Zhang, L. Assessing amenity effects of urban landscapes on housing price in Hangzhou, China. Urban For. Urban Green. 2015, 14, 1017–1026. [Google Scholar] [CrossRef]
- Forman, R.T.T. Some General-Principles of Landscape and Regional Ecology. Landsc. Ecol. 1995, 10, 133–142. [Google Scholar] [CrossRef]
- Zhu, J.; Yang, Y. The modern meaning of Chinese traditional gardens. Chin. Landsc. Arch. 2005, 21, 001. (In Chinese) [Google Scholar]
- Deng, F.F.; Huang, Y.Q. Uneven land reform and urban sprawl in China: The case of Beijing. Prog. Plan. 2004, 61, 211–236. [Google Scholar] [CrossRef]
- Fei, X.; Ruhua, Y. Empirical Analysis on Urbanization Impact on the Development of Real Estate in China. Econ. Geogr. 2014, 34, 78–83. (In Chinese) [Google Scholar]
- Statistical Communique of the People’s Republic of China on the 2009 National Economic and Social Development. Available online: http://www.stats.gov.cn/tjsj/tjgb/ndtjgb/qgndtjgb/201002/t20100225_30024.html (accessed on 10 December 2017).
- Communique of the National Bureau of Statistics of People’s Republic of China on Major Figures of the 2010 Population Census (No. 1). Available online: http://www.stats.gov.cn/tjsj/tjgb/rkpcgb/qgrkpcgb/201104/t20110428_30327.html (accessed on 10 December 2017).
- Statistical Communique of the People’s Republic of China on the 2011 National Economic and Social Development. Available online: http://www.stats.gov.cn/tjsj/tjgb/ndtjgb/qgndtjgb/201202/t20120222_30026.html (accessed on 10 December 2017).
- Chang, T.C.; Huang, S.; Savage, V.R. On the waterfront: Globalization and urbanization in Singapore. Urban Geogr. 2004, 25, 413–436. [Google Scholar] [CrossRef]
- Kondolf, G.M.; Podolak, K.; Grantham, T.E. Restoring mediterranean-climate rivers. Hydrobiologia 2013, 719, 527–545. [Google Scholar] [CrossRef]
- Larson, E.K.; Grimm, N.B. Small-scale and extensive hydrogeomorphic modification and water redistribution in a desert city and implications for regional nitrogen removal. Urban Ecosyst. 2012, 15, 71–85. [Google Scholar] [CrossRef]
- Balakrishnan, K. Sabarmati Riverfront Development: An Exercise in ‘High-Modernism’? In Proceedings of the ISRivers Conference, Lyon, France, 4–8 June 2018.
- Pueyo, Á.; Climent, E.; Ollero, A.; Pellicer, F.; Peña, J.L.; Sebastián, M. L’interaction entre Saragosse et ses cours d’eau: Évolution, conflits et perspectives. Sud-Ouest Européen 2018, 44, 7–23. [Google Scholar]
- Jing, H.; Hua, L.; Sun, C.; Guo, J. Analysis on urban lakes’ eutrophication status in Beijing. J. Lake Sci. 2008, 20, 357–363. (In Chinese) [Google Scholar]
- Tang, X.; Yang, L.; Cao, Q. Status Investigation and Measure Analysis of Landscape Water at Home and Abroad. Environ. Sci. Surv. 2008, 27, 66–68. (In Chinese) [Google Scholar]
- Liu, X. Urban landscape water must be strictly controlled in the drought city. Pop. Sci. News 2007, 24, A04. [Google Scholar]
- Hu, D.; Wang, Y. Focus on Water Town in Northern Cities in China. Garden 2006, 2, 16–17. [Google Scholar]
- Castonguay, S.; Evenden, M. Urban Rivers: Remaking Rivers, Cities, and Space in Europe and North America; University of Pittsburgh Press: Pittsburgh, PA, USA, 2012. [Google Scholar]
- Kondolf, G.; Podolak, K. Urban rivers: Landscapes of leisure and consumption. In Globalization and Metropolization—Theory and Practice from Europe’s West Coast; Berkeley Public Policy Press: Berkeley, CA, USA, 2014; pp. 33–44. [Google Scholar]
- Kondolf, G.M.; Pinto, P.J. The social connectivity of urban rivers. Geomorphology 2017, 277, 182–196. [Google Scholar] [CrossRef]
- Valette, P.; Carozza, J.-M. Toulouse face à la Garonne: Emprise de l’urbanisation dans la plaine inondable et géohistoire des aménagements fluviaux. Geographicalia 2013, 63–64, 177–203. [Google Scholar] [CrossRef]
- Wantzen, K.M.; Ballouche, A.; Longuet, I.; Bao, I.; Bocoum, H.; Cisse, L.; Chauhan, M.; Girard, P.; Gopal, B.; Kane, A.; et al. River Culture: An eco-social approach to mitigate the biological and cultural diversity crisis in riverscapes. Ecohydrol. Hydrobiol. 2016, 16, 7–18. [Google Scholar] [CrossRef]
- Mauch, C.; Zeller, T. Rivers in History: Perspectives on Waterways in Europe and North America; University of Pittsburgh Press: Pittsburgh, PA, USA, 2008. [Google Scholar]
- Zingraff-Hamed, A.; Noack, M.; Greulich, S.; Schwarzwalder, K.; Wantzen, K.M.; Pauleit, S. Model-Based Evaluation of Urban River Restoration: Conflicts between Sensitive Fish Species and Recreational Users. Sustainability 2018, 10, 1747. [Google Scholar] [CrossRef]
- Caprotti, F.; Cowley, R.; Datta, A.; Broto, V.C.; Gao, E.; Georgeson, L.; Herrick, C.; Odendaal, N.; Joss, S. The New Urban Agenda: Key opportunities and challenges for policy and practice. Urban Res. Pract. 2017, 10, 367–378. [Google Scholar] [CrossRef]
Figure 1.
The layout of the randomly selected 104 cities in China.

Figure 2.
The grouped river projects in the typology.

Figure 3.
The ‘uniform widening’ with tremendous urbanization in Ordos from 2008 to 2013 (Source: Google Map).
Figure 3.
The ‘uniform widening’ with tremendous urbanization in Ordos from 2008 to 2013 (Source: Google Map).

Figure 4.
Newly created, river-channel-shaped ponds in Tieling were built as part of the Fanhe New District construction (Source: Google Map).
Figure 4.
Newly created, river-channel-shaped ponds in Tieling were built as part of the Fanhe New District construction (Source: Google Map).

Figure 5.
The ‘curve revetment’ transformation of the Xiheng River in Jiangyin from 2010 to 2015. Note the three massive apartment blocks due north of the river, which appear differently in each image due to the different angle from which the scene was viewed (Source: Google Map).
Figure 5.
The ‘curve revetment’ transformation of the Xiheng River in Jiangyin from 2010 to 2015. Note the three massive apartment blocks due north of the river, which appear differently in each image due to the different angle from which the scene was viewed (Source: Google Map).

Figure 6.
Number of projects by year constructed for our study period 2006–2015.


Table 1.
Evolution of the Landscape Garden City Program, 1992–2016 [42].
Table 1.
Evolution of the Landscape Garden City Program, 1992–2016 [42].
| Year | Changing Requirements |
|---|---|
| 1992 | NLGC program introduced. Original requirements emphasized extent of vegetated area and afforestation |
| 2000 | Ministry of Construction (named MOHURD since 2008) issued first formal document with standards for NLGC. Emphasis still on ‘green area’ but water features mentioned. |
| 2004 | NELGC designation introduced, formal document with standards issued. For comparison, the application of NELGC required higher standards on green space and other ecological construction, such as treatment rate of domestic sewage and municipal refuse. In addition, keeping natural features of rivers was first added. |
| 2005 | Improving ecological value of revetment and riverbed were added as criteria for NLGC designation |
| 2010 | Standards for NLGC designation were made more specific: 80% ‘riverway greening’ and 80% ‘revetment naturalization’ in lieu of prior descriptive standard |
| 2012 | For NELGC, ecological principles were added for ‘riverway greening’, standards added against some engineering techniques. |
| 2016 | Restoring ecological function of water systems was added as a criterion for designation. The 80% ‘riverway greening’ standard was excluded. And for NELGC, all water bodies are required to meet the standard of 80% ‘revetment naturalization’, but for NLGC, only natural water bodies are required to meet this standard. |
Notes: NLGC = national landscape garden city, NELGC = national ecological landscape garden city.
Table 2.
Stratification for Random Selection of Cities in China.
| Number Cities in the Province | Capital | Prefectural-Level Cities | County-Level Cities | Total Selected |
|---|---|---|---|---|
| >40 | 0 | 3 | 3 | 6 |
| 31–40 | 0 | 2 | 3 | 5 |
| 21–30 | 0 | 2 | 2 | 4 |
| 11–20 | 0 | 1 | 2 | 3 |
| 6–10 | 0 | 1 | 1 | 2 |
| <6 | 1 | 0 | 0 | 1 |
Table 3.
The assignments and amount of different Garden cities.
| Landscape Garden City Level | Score Assigned | Number of Cities |
|---|---|---|
| National Ecological Landscape Garden City | 4 | 2 |
| National Landscape Garden City | 3 | 58 |
| Provincial Landscape Garden City | 2 | 27 |
| Landscape Garden City under construction | 1 | 10 |
| Non-activity | 0 | 7 |
Table 4.
The typology we developed to identify river projects.
| Engineering | Waterfront Spaces | Ecological | |
|---|---|---|---|
| Typology | Multiple dams | Public spaces | Adding islands |
| New channel | Linear greening | Curve revetment | |
| Curve cut-off | New ponding | New curved channel | |
| Uniform widening | Widen at a point | Straight to curved | |
| - | - | Concrete to naturalistic | |
| - | - | Widen river corridor |
Table 5.
Variables used in the different stepwise multiple regression analyzes.
| Independent Variables | Dependent Variables | |
|---|---|---|
| Temperature (T) | 1. Total river projects | |
| Precipitation (P) | 2. Engineering | |
| Climate | Evaporation (E) | 3. Waterfront spaces |
| Excess Precipitation (P-E) | 4. Ecological | |
| Maximal monthly precipitation (MAP) | 5. More ecological | |
| Minimal monthly precipitation (MIP) | 6. New waterscape | |
| 7. Uniform Widening | ||
| Elevation (EL) | 8. Degree of widening | |
| Topography | Slope (S) | 9. New ponding |
| Relief (RE) | 10. Curve revetment | |
| Terrain roughness (TR) | ||
| Urban district population (UDP) | ||
| Urban district area (UDA) | ||
| Social-economic | Area of built district (ABD) | |
| Area of green space (AGS) | ||
| Gross domestic product (GDP) | ||
| GDP per capital | ||
| River related | Number of rivers (NR) | |
| Maximal river width (MRW) | ||
| City Designation | Landscape Garden City (LGC) | |
Table 6.
Average number of years with indicated project type appearing in imagery, and percent of projects occurring in new districts.
Table 6.
Average number of years with indicated project type appearing in imagery, and percent of projects occurring in new districts.
| Types | Average Number of Years | Percent in New Districts |
|---|---|---|
| Engineering | 3.36 | 90.4% |
| Multiple dams | 1.36 | 78.9% |
| New channel | 0.39 | 100% |
| Curve cut-off | 0.34 | 100% |
| Uniform widening | 1.27 | 94.8% |
| Waterfront spaces | 7.06 | 79.6% |
| Public spaces | 2.56 | 71.5% |
| Linear greening | 2.35 | 72.5% |
| New ponding | 1.46 | 95.9% |
| Widen at a point | 0.69 | 100% |
| Ecological | 1.26 | 97.5% |
| Adding islands | 0.56 | 96.1% |
| Curve revetment | 0.36 | 96.9% |
| New curved channel | 0.19 | 100% |
| Straight to curved | 0.12 | 100% |
| Concrete to naturalistic | 0.03 | 100% |
| Widen river corridor | 0.01 | 100% |
Table 7.
Number of projects by year from 2006 to 2015. (Note: the totals don’t include all projects, as explained in the text).
Table 7.
Number of projects by year from 2006 to 2015. (Note: the totals don’t include all projects, as explained in the text).
| Groups | 2006 | 2007 | 2008 | 2009 | 2010 | 2011 | 2012 | 2013 | 2014 | 2015 | Total |
|---|---|---|---|---|---|---|---|---|---|---|---|
| Engineering | 11 | 24 | 26 | 32 | 16 | 40 | 20 | 17 | 33 | 26 | 270 |
| Waterfront Spaces | 37 | 47 | 56 | 47 | 47 | 64 | 57 | 57 | 67 | 65 | 593 |
| Ecological | 8 | 9 | 9 | 8 | 6 | 12 | 10 | 13 | 18 | 18 | 121 |
Table 8.
Stepwise multiple regression analyses for all the groups of river projects.
| Variables | Standardized Coefficients (±Std. Error) | Adjusted Accumulated Multiple r2 | Student’s t | VIF | F | Durbin-Watson |
|---|---|---|---|---|---|---|
| 1. Total river projects | 32.38 | 2.23 | ||||
| Area of built district | 0.539 ± 0.009 | 0.444 | 7.51 *** | 1.34 | ||
| Landscape Garden City | 0.244 ± 0.600 | 0.514 | 3.40 ** | 1.34 | ||
| P-E | −0.160 ± 0.001 | 0.557 | −2.37 * | 1.19 | ||
| GDP per capital | 0.227 ± 0.000 | 0.590 | 3.40 ** | 1.16 | ||
| Maximal river width | −0.143 ± 0.001 | 0.604 | −2.08 * | 1.22 | ||
| 2. Engineering | 16.28 | 2.43 | ||||
| Area of built district | 0.831 ± 0.007 | 0.252 | 5.61 *** | 3.93 | ||
| Minimal monthly precipitation | −0.227 ± 0.013 | 0.346 | −2.80 ** | 1.19 | ||
| GDP per capital | 0.368 ± 0.000 | 0.383 | 3.91 *** | 1.59 | ||
| GDP | −0.442 ± 0.000 | 0.406 | −2.67 ** | 4.94 | ||
| Maximal river width | −0.171 ± 0.000 | 0.426 | −2.09 * | 1.21 | ||
| 3.Waterfront spaces | 33.41 | 2.07 | ||||
| Area of green spaces | 0.235 ± 0.071 | 0.458 | 2.12 * | 3.25 | ||
| Landscape Garden City | 0.253 ± 0.340 | 0.540 | 3.64 *** | 1.28 | ||
| Area of built district | 0.349 ± 0.008 | 0.565 | 3.27 ** | 3.03 | ||
| Elevation | 0.185 ± 0.000 | 0.594 | 2.97 ** | 1.03 | ||
| GDP per capital | 0.161 ± 0.000 | 0.611 | 2.36 * | 1.24 | ||
| 4. Ecological | 18.80 | 2.14 | ||||
| Urban district population | 0.423 ± 0.003 | 0.210 | 4.90 *** | 1.04 | ||
| GDP per capital | 0.235 ± 0.000 | 0.257 | 2.72 ** | 1.04 | ||
| 5. More ecological | 5.70 | 2.19 | ||||
| Maximal monthly precipitation | −0.264 ± 0.001 | 0.048 | −2.78 ** | 1.01 | ||
| Urban District population | 0.212 ± 0.001 | 0.084 | 2.23 * | 1.01 | ||
| 6. New waterscape | 23.28 | 2.17 | ||||
| Area of green spaces | 0.369 ± 0.031 | 0.298 | 4.54 *** | 1.42 | ||
| P-E | −0.216 ± 0.000 | 0.419 | −2.79 ** | 1.29 | ||
| Landscape Garden City | 0.276 ± 0.225 | 0.482 | 3.58 ** | 1.27 | ||
| Elevation | 0.182 ± 0.000 | 0.501 | 2.38 * | 1.26 | ||
| GDP per capital | 0.167 ± 0.000 | 0.520 | 2.20 * | 1.24 |
* p < 0.05, ** p < 0.01, *** p < 0.001.
Table 9.
Stepwise multiple regression analyses for ‘uniform widening’, ‘degree of widening’, ‘new ponding’ and ‘curve revetment’.
Table 9.
Stepwise multiple regression analyses for ‘uniform widening’, ‘degree of widening’, ‘new ponding’ and ‘curve revetment’.
| Variables | Standardized Coefficients (±Std. Error) | Adjusted Accumulated Multiple r2 | Student’s t | VIF | F | Durbin-Watson |
|---|---|---|---|---|---|---|
| 7. Uniform widening | 17.23 | 2.347 | ||||
| Area of built district | 0.365 ± 0.002 | 0.114 | 4.25 *** | 1.00 | ||
| P-E | −0.364 ± 0.000 | 0.240 | −4.23 *** | 1.00 | ||
| 8. Degree of widening | 12.53 | 2.25 | ||||
| P-E | −0.804 ± 0.001 | 0.168 | −4.61 *** | 4.19 | ||
| Maximal monthly precipitation | 0.464 ± 0.008 | 0.209 | 2.66 ** | 4.19 | ||
| GDP per capital | 0.222 ± 0.000 | 0.251 | 2.59 * | 1.01 | ||
| 9. New ponding | 13.15 | 1.634 | ||||
| Landscape Garden City | 0.277 ± 0.140 | 0.197 | 3.03 ** | 1.27 | ||
| Area of green spaces | 0.251 ± 0.018 | 0.248 | 2.76 ** | 1.25 | ||
| P-E | −0.480 ± 0.000 | 0.299 | −3.36 ** | 3.10 | ||
| Minimal monthly precipitation | 0.288 ± 0.012 | 0.321 | 2.03 * | 3.06 | ||
| 10. Curve Revetment | 15.92 | 2.166 | ||||
| Urban district population | 0.470 ± 0.001 | 0.194 | 5.39 *** | 1.01 | ||
| Precipitation | −0.196 ± 0.000 | 0.225 | −2.24 * | 1.01 |
* p < 0.05, ** p < 0.01, *** p < 0.001.
© 2018 by the authors. Licensee MDPI, Basel, Switzerland. This article is an open access article distributed under the terms and conditions of the Creative Commons Attribution (CC BY) license (http://creativecommons.org/licenses/by/4.0/).
Share and Cite
MDPI and ACS Style
Shi, S.; Kondolf, G.M.; Li, D. Urban River Transformation and the Landscape Garden City Movement in China. Sustainability 2018, 10, 4103. https://0-doi-org.brum.beds.ac.uk/10.3390/su10114103
AMA Style
Shi S, Kondolf GM, Li D. Urban River Transformation and the Landscape Garden City Movement in China. Sustainability. 2018; 10(11):4103. https://0-doi-org.brum.beds.ac.uk/10.3390/su10114103
Chicago/Turabian StyleShi, Shuhan, G. Mathias Kondolf, and Dihua Li. 2018. "Urban River Transformation and the Landscape Garden City Movement in China" Sustainability 10, no. 11: 4103. https://0-doi-org.brum.beds.ac.uk/10.3390/su10114103
Note that from the first issue of 2016, this journal uses article numbers instead of page numbers. See further details here.