Research on Mixed and Classification Simulation Models of Medical Waste—A Case Study in Beijing, China

School of Economics and Management, Beihang University, No. 37 Xueyuan Road, Haidian District, Beijing 100191, China
*
Author to whom correspondence should be addressed.
Sustainability 2018, 10(11), 4226; https://0-doi-org.brum.beds.ac.uk/10.3390/su10114226
Submission received: 28 September 2018
/
Revised: 11 November 2018
/
Accepted: 12 November 2018
/
Published: 16 November 2018
(This article belongs to the Collection Trends in Municipal Solid Waste Management)
Abstract
:Medical waste has strict classification standards. However, in reality, the process of collection and disposal of most medical waste does not strictly follow the corresponding standards, thus resulting in great potential risks to people’s health. Our research analyzed existing problems with medical waste classification management, optimized the medical waste recycling business model, and then used the simulation software AnyLogic to design mixed and classification simulation models based on current literature regarding the standards of medical waste classification and composition in China. Furthermore, we simulated and calculated the generation of nonrecyclable medical waste, recyclable medical waste, and domestic waste in the three models based on 30,000 tons of medical waste generated in Beijing in 2015. We compared and analyzed the output, generation rate, disposal cost, recycling revenue, and cost–benefit based on the disposal cost standards of the Beijing Municipal Commission of Development and Reform and the China Renewable Resources Price Index in Beijing. The importance of strengthening the classification and recycling of medical waste was further validated by modeling and simulation. The study provides an important reference to hospitals, disposal plants, and government regulatory departments in their decision-making.
1. Introduction
Medical waste, which has infectious, toxic, and other hazardous properties, is generated by healthcare institutions through medical treatment, prevention, healthcare, and other related activities [1]. It has a greater impact on the environment and society compared to other wastes. Medical waste is generally divided into five categories: infectious waste, pathological waste, injury waste, drug-induced waste, and chemical waste [2]. According to statistics produced by the World Health Organization (WHO), about 85% of the total amount of medical waste is general and nonhazardous, and about 15% is harmful [3]. Most of the general and nonhazardous medical waste can be disposed of through conventional treatment methods, while harmful medical wastes need to be rigorously classified and treated in stages.
There are strict standards and requirements for the recycling, classification, transportation, storage, and disposal of medical waste according to the Medical Waste Management Regulations (Decree of the State Council of the People’s Republic of China No. 380) [1]. If medical waste is improperly handled, it may pose a potential threat to healthcare workers, the environment, and human health [4]. However, in reality, most small and medium-sized medical institutions, including primary hospitals, community hospitals, and other health centers, do not strictly implement the national disposal standards for medical waste because of high disposal costs, location in remote areas, limited capacity of disposal, etc. [5]. Medical waste is generally disposed of as ordinary garbage through private incineration, landfill, and other methods. However, it is more serious if medical waste is sold to illegal traders who can then go on to produce everyday items like toys and tableware after simple processing of the waste, leading to these materials flowing into people’s lives. This causes the spread of diseases, environmental pollution, and poses great risks to people’s health.
We can reduce disease transmission, prevent environmental pollution, and improve resource utilization by strengthening the classification management of medical waste. However, the various types of medical waste generated, along with disposal costs, resource utilization, and other aspects, cannot be quantitatively analyzed, and thus the importance of medical waste classification cannot be reflected effectively. The problem of quantification indicators in the classification and mixed of medical waste is the main focus of this article.
2. Literature Review
In recent years, a number of scholars have studied the classification management of medical waste. A survey of medical waste management in Gansu Province and Shandong Province, China, by Zhang et al. and Gai et al. found that the generation of medical waste in primary hospitals was higher than secondary hospitals if medical waste was not strictly classified [6,7]. Zhang et al. analyzed and evaluated the state of medical waste management in Nanjing through field surveys and questionnaires, and the results showed that medical waste was classified in 73% of hospitals [8]. Jang et al. studied the state of medical waste management in Korea from the aspects of generation, composition, isolation, transportation, etc. and pointed out the major problems that need to be dealt with in the future [9]. Windfeld and Brooks studied the current state of medical waste management and emphasized that the treatment of general waste as infectious waste would increase disposal costs and affect the environment [10]. Askarian et al. defined and classified medical waste in Namazi Hospital in Shiraz, Iran, in order to reduce the amount of infectious waste [11]. Kei Robert and Njagi Ananias surveyed two National Teaching and Referral Hospitals in Kenya on the basis of four types of medical waste and found that medical waste in both hospitals was not well classified [12]. Hossain et al. emphasized that the management of clinical solid medical waste should be strengthened and proposed to use sf-co2 sterilization technology to manage clinical solid waste to reduce exposure of infectious waste while lowering labor and disposal costs [13]. El-Salam found that the current medical waste management problems were mainly caused by unreasonable source separation, improper collection methods, unsafe storage, improper treatment, and so on [14]. Mohamed et al. studied the generation, isolation, storage, collection, transportation, and disposal of medical waste in the Kingdom of Bahrain, pointed out the problems, and gave corresponding suggestions [15]. Moreira and Günther classified solid medical waste into infectious, recyclable, and nonrecyclable wastes and evaluated the implementation of a medical waste management plan at a primary health care center in São Paulo, Brazil [16]. Janagi et al. studied and analyzed the current situation of medical waste management in the US and UK, providing some guidance for safer and more efficient management of medical waste [17]. These recent studies show that strengthening the classification management of medical waste can effectively reduce the amount of nonrecyclable medical waste, lower disposal costs, and reduce environmental pollution. This further illustrates the importance of strengthening the classification management of medical waste.
Furthermore, many scholars have also studied generation rates and factors influencing medical waste. Minoglou and Komilis used multiple linear regression modeling and principal component analysis methods to analyze and study the relevant influencing factors of medical waste generation rate from an economic perspective [18]. Korkut conducted a statistical analysis of nearly 18 years worth of data into medical waste collection and disposal in Istanbul, Turkey, to estimate the total amount of medical waste and output per unit bed in medical institutions every year for better management of medical waste [19]. Xin analyzed the annual amount of medical waste, the number of beds, hospitalization rates, and patient populations in Beijing, China, in order to evaluate the generation rate of medical wastes and improve its management [20]. Graikos et al. conducted research on the health care facility of Social Insurance Institute in Xanthi, Greece, and found that the proportion of hazardous and infectious waste in clinical laboratories, X-ray laboratories, surgery departments, and injection rooms were 91.6%, 12.9%, 24.2%, 17.6% and 75.6%, 0%, 100%, 75.6%, respectively [21]. Sharma and Gupta conducted a questionnaire survey of medical waste management in Himachal Pradesh, India, which showed that private hospitals produced more yellow and red medical waste, while public hospitals produced more blue medical waste [22]. The recent analyses of generation rate and related factors influencing medical waste provide some reference for decision-making, which will be helpful for better management of medical waste.
Meanwhile, some scholars have conducted research into the composition of medical waste. Kalogiannidou et al. studied three public and four private medical histopathology laboratories in the city of Thessaloniki, Greece, and found that 57% of the total medical waste generated was toxic; 28% and 24% were mixed hazardous waste in public and private facilities, respectively; and 15% was infectious waste [23]. Rabeie et al. investigated three hospitals in Amol City, Iran, and found that 51.5% of the medical waste was hazardous and 48.5% was nonhazardous; the smallest and largest components of hospital waste were metal (1.07%) and paper (17.9%), respectively [24]. Caniato et al. studied medical waste management in Gaza by means of policy legislative analysis, field investigation, stakeholder interviews, and so on and found that 75% of hazardous waste was untreated [25]. A medical solid waste study of private medical microbiology laboratories in Greece conducted by Komilis et al. found that 35% of medical waste on average was hazardous waste and that they were generated within a range of 11.5–32.5 g examinee−1day−1 [26]. Al-Khatib investigated medical waste management at hospitals in the governance of Jenin, Palestine and found that hazardous medical waste ranged from 31.2% to 43.6%, while the rest was similar to domestic waste [27]. Birpınar et al. conducted a survey on the status of medical waste management in 192 hospitals in Istanbul, Turkey, and found that about 83% of the recyclable materials were recycled separately, but about 25% of hospitals used unsuitable containers for medical waste recycling [28]. Mbarki et al. studied medical waste management in seven hospitals in the Souss-Massa-Drâa Region, Morocco. They found that the proportion of infectious and hazardous medical waste was about 30.5%, while the remaining 69.5% was similar to domestic waste [29]. These analyses regarding the proportion of various types of waste in medical waste further emphasizes the importance of strengthening the classification management of medical waste.
The recent research on classification management, generation rates, influencing factors, and composition of medical waste provided the theoretical basis and practical experiences for our work. In this study, a recovery business model of medical waste was designed and a simulation software was used for contrastive analysis of the mixed and classification models.
3. Case Study
3.1. Background
According to the 2016 Annual Report on the Prevention and Control of Solid Waste Environmental Pollution by Large and Medium-sized Cities promulgated by the Ministry of Environmental Protection of the People’s Republic of China, the generation of medical waste as reported in 246 large and medium-sized cities in 2015 was 697,000 tons [30].
Among them, the largest amount of medical waste was generated in Shanghai, with 41,000 tons. This was followed by Beijing, Guangzhou, Chengdu, and Hangzhou, with 30,000, 21,000, 20,000, and 19,000 tons, respectively [30]. It must be noted, however, that the figures do not represent the total amount of medical waste generated in China overall due to the limited number of cities included in the report.
Taking Beijing as a case study, according to the Beijing Municipal Health and Family Planning Development Statistical Bulletin in 2015, the number of healthcare institutions in Beijing reached 10,425 in 2015, the total number of authorized beds in medical institutions reached 118,384, while the actual number of total beds was 111,555 [31]. The number of authorized beds in medical institutions per thousand permanent residents was 5.5, and the number of actual beds was 5.1 for per thousand permanent residents [31]. In 2015, the number of visits and discharges in medical institutions in Beijing reached 235,016,000 and 3,381,000 persons-times, respectively [31]. This was an increase of 1.4% and 2.1%, respectively, compared with the previous year [31].
The number of beds, patients, the rate of hospital discharge, etc. directly affect the generation of medical waste. Another important factor is the hospital grade. Hospitals in Beijing are divided into several grades, including tertiary hospitals, secondary hospitals, primary hospitals, community hospitals, village clinics, etc. Among them, tertiary hospitals, secondary hospitals, and primary hospitals also have different levels, which differ in the number of beds and patients as well as the strict degree of medical waste classification. It is therefore very important to strengthen the classification management of medical waste, especially in small and medium-sized primary hospitals.
3.2. Problems
There are several problems in the classification management of medical waste.
- (1)
- Lack of strict classification of medical waste: Medical waste is not classified strictly according to different categories of waste during the recycling process, with recyclable waste often being mixed with other medical wastes.
- (2)
- Low recycling rate: In addition to direct recoverable medical wastes, such as metal, glass, and plastic, most of the recyclable wastes are disposed of as nonrecyclable wastes without careful classification.
- (3)
- Lack of strict supervision of medical waste classification data: Most business processes rely on manual work, lack effective supervision methods, and suffer from poor communication, meaning the disposal process of medical waste is opaque.
- (4)
- Insufficient awareness of environmental safety: Some small and medium-sized hospitals, health clinics, and other medical institutions collect, store, incinerate, and send medical waste to landfill as ordinary waste due to the high cost of medical waste treatment. Healthcare staff and cleaners are often injured by needles, blades, and other sharp tools. Cross-infection with various pathogens increases the risk of disease transmission and environmental pollution.
The problems relating to classification management of medical waste have not been well resolved in the real world. Therefore, the main aim of this paper was to quantify these problems and further verify the importance of strengthening the classification of medical waste. The research provides important data to support hospitals, supervision departments, and disposal plants in their decision-making.
3.3. Data
We used the annual generation of medical waste in Beijing in 2015 as the basis in this study. The data was mainly divided into two aspects: model simulation data and various medical waste occupation ratio data.
Model simulation data mainly came from (1) Beijing Municipal Bureau of Statistics, (2) Ministry of Environmental Protection of the People’s Republic of China, (3) National Health and Family Planning Commission of the People’s Republic of China.
Various medical waste occupation ratio data mainly from (1) World Health Organization, (2) reference data provided by research papers.
Note that due to the time it takes for the release of government data, the 2015 statistics data were released at the end of 2016, while start this study, the 2017 data has not yet been released. Therefore, the 2015 statistics was that available data for our study.
4. Design of Recycling Business Model
4.1. The Classification of Medical Waste
According to the Catalogue of Classified Medical Waste issued by the National Health and Family Planning Commission of the People’s Republic of China, medical waste can be classified into five categories: infectious waste, pathological waste, injured waste, drug-induced waste, and chemical waste [2].
As shown in Table 1, infectious waste generally refers to medical waste that easily causes the spread of infectious diseases. Pathological waste refers to human tissues and animal carcasses generated during surgery or experiments. Damaged waste refers to sharp waste that can easily stab or cut the body, such as needles, blades, etc. Drug-induced waste refers to outdated, deteriorated, or contaminated drugs, vaccines, etc. Chemical waste refers to waste chemicals that are toxic, corrosive, flammable, explosive, and so on. Recyclable waste refers to medical waste that is not seriously polluted and can be recycled. Domestic waste refers to uncontaminated ordinary rubbish produced by medical staff and patients [2].
According to the statistical standards of the World Health Organization, only about 15% of medical waste generated from healthcare activities is toxic and harmful, while the rest are mostly ordinary and harmless waste [3]. Factors such as the level of economic and medical conditions in the region have a great influence on the statistical standards. The proportion of toxic and harmful medical wastes also has a certain range of fluctuation. Ordinary and harmless medical waste can be divided into recyclable medical waste and domestic waste through classification.
Recyclable medical waste includes infusion bottles, paper packaging, needles, scalpels, and other plastic, metal, paper, and glass [2]. Recyclable medical waste should be stored and marked separately for transport to different waste recycling plants for disposal. After strict sterilization, crushing, dehydration, drying, and other procedures, different types of plastic and metal particles such as PP, PE, PS, PC, and PVC are decomposed to recycle the resources.
4.2. Medical Waste Recycling Business Model
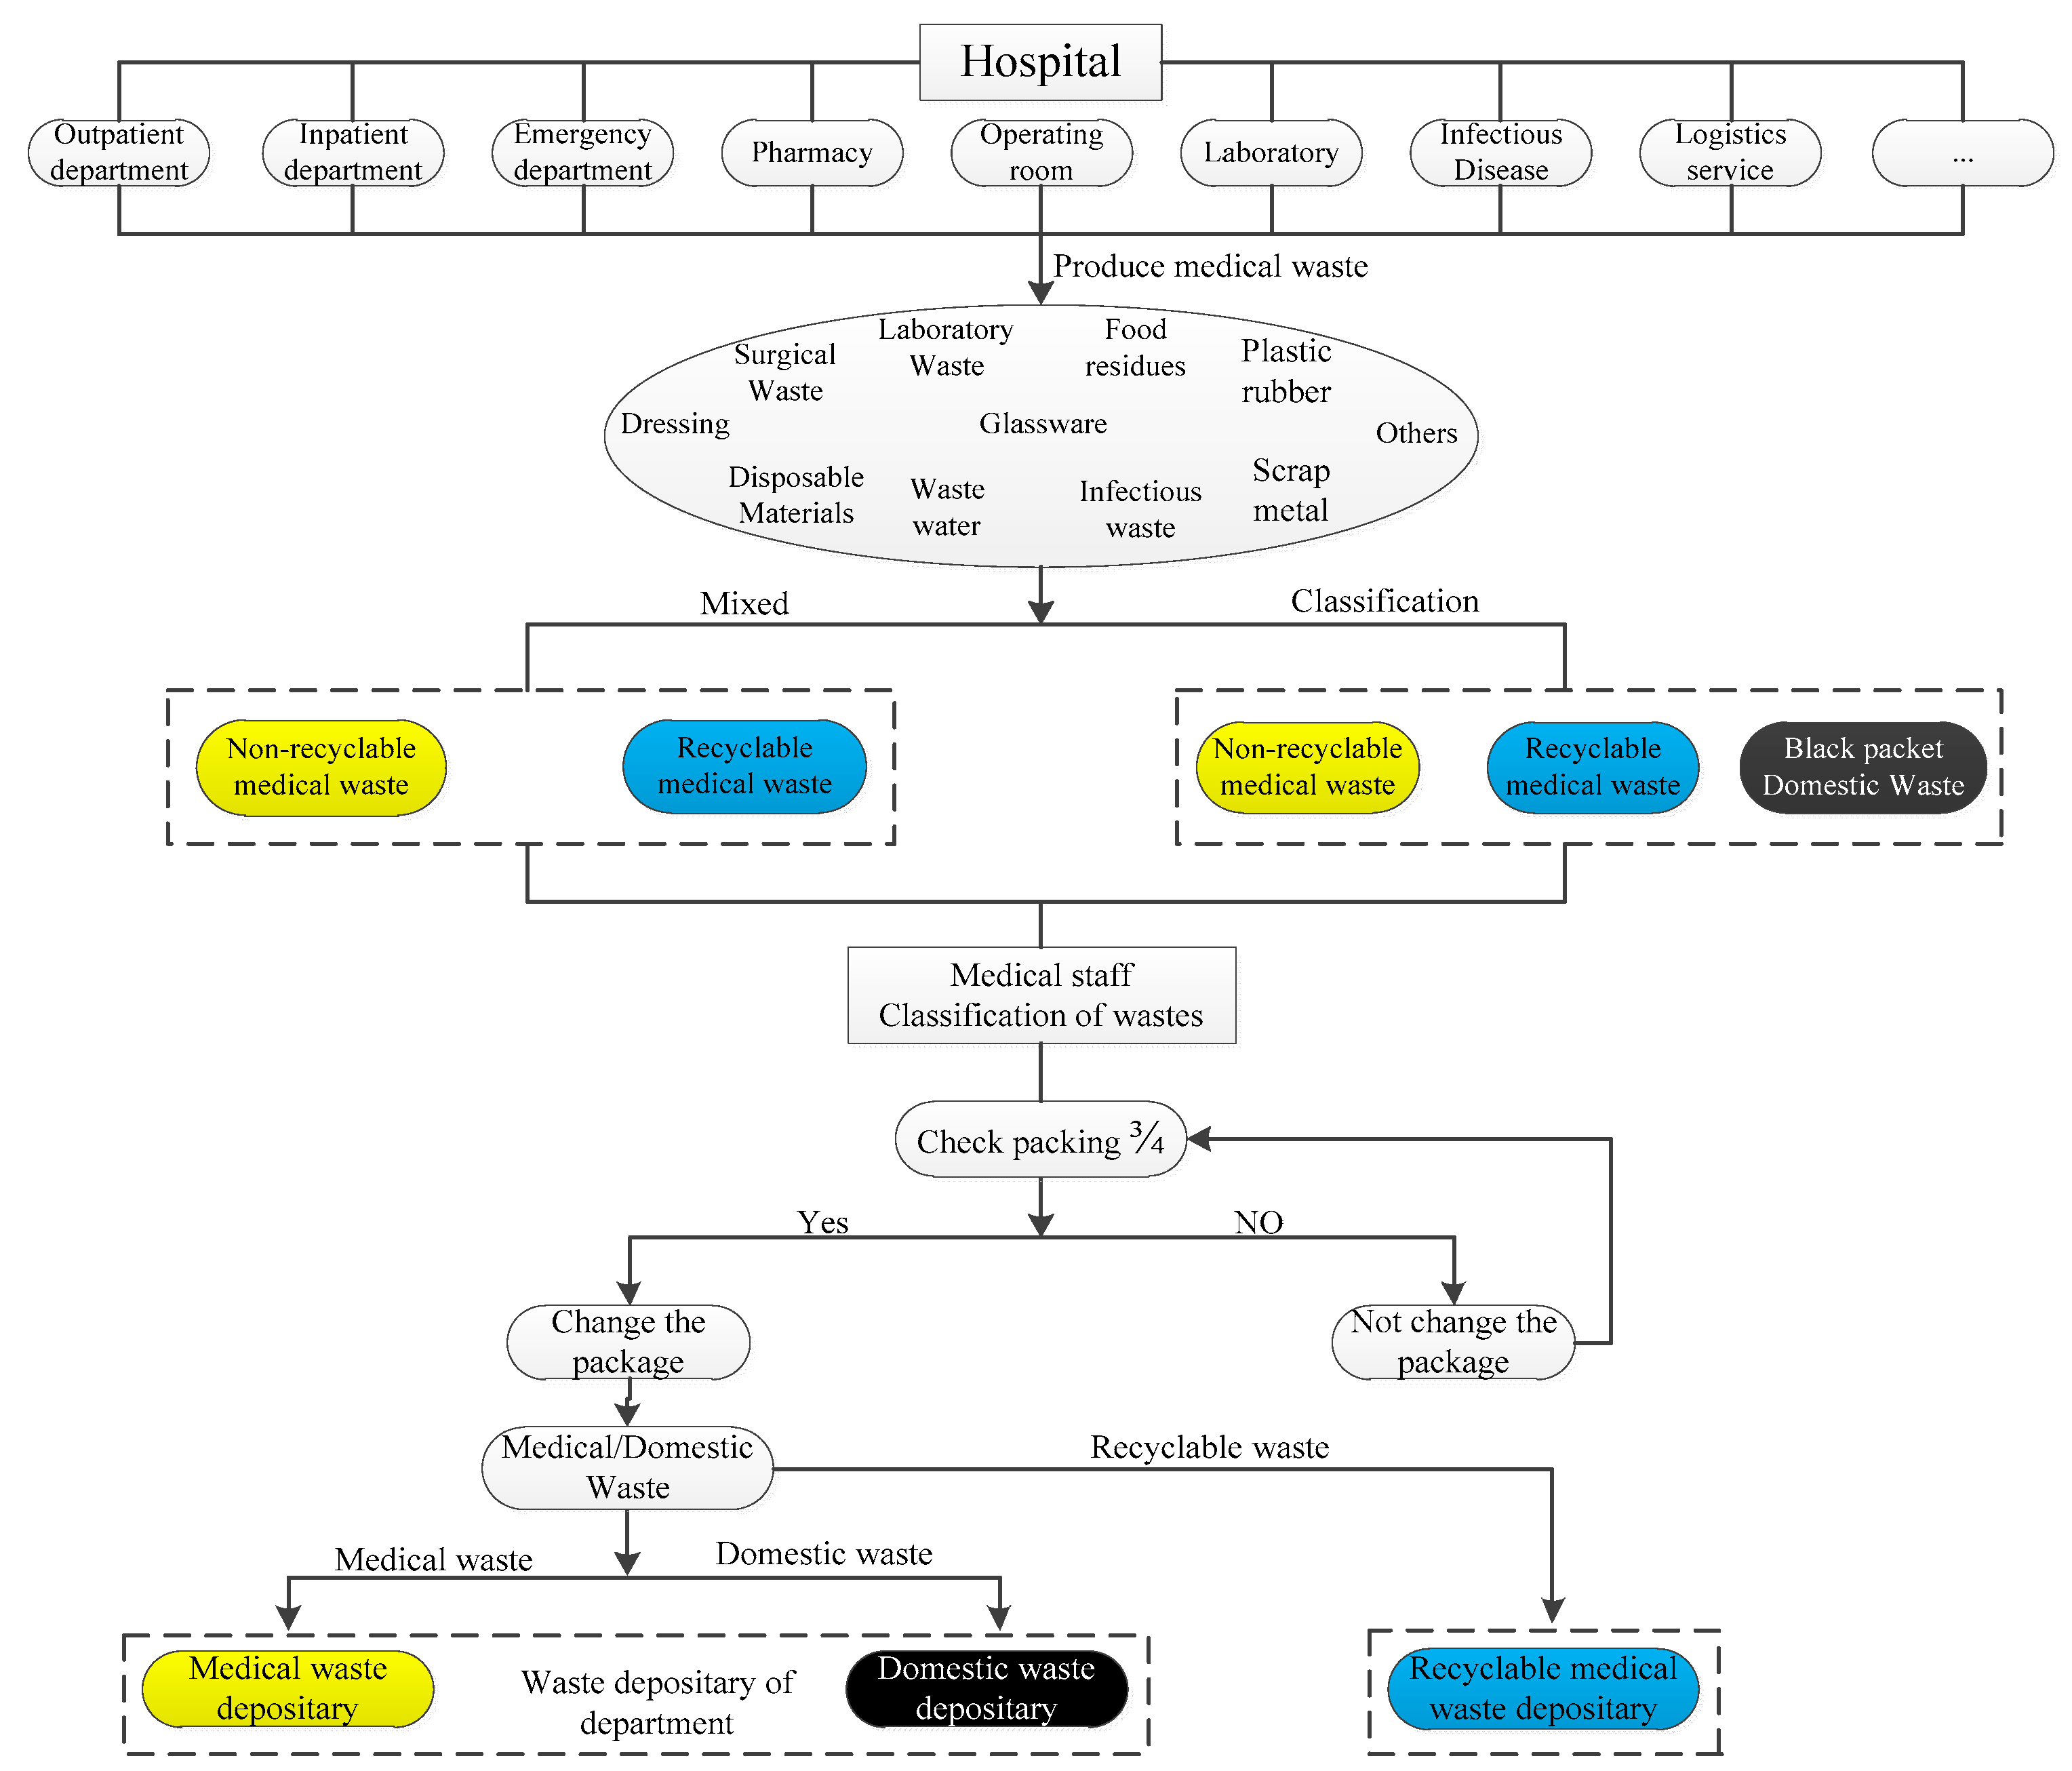
As shown in Figure 1, the medical waste recycling business model can be mainly divided into three parts: waste generation, waste classification, and temporary storage of waste.
- (1)
- Waste generation: Medical waste is generated in related activities such as medical care and preventive health care in various departments of the hospital. Medical waste includes waste water, surgical waste, laboratory waste, disposable consumables, dressings, food waste, infectious waste, glass, plastic, metal, and other wastes.
- (2)
- Waste classification: Medical waste has strict classification criteria. It can be classified as nonrecyclable medical waste, recyclable medical waste, and domestic waste according to the classification criteria of resource availability, and the yellow, blue, and black garbage bags are used for packaging them, respectively. Nonrecoverable medical waste is classified into infectious, pathological, injured, drug-induced, and chemical waste.In reality, some small and medium-sized hospitals and health clinics do not strictly carry out the classification standards for medical waste. Except for recyclable medical waste such as metals, plastics, paper, and glass, most of them are mixed together as nonrecyclable medical waste for disposal.
- (3)
- Temporary storage: Garbage bags for medical waste storage are generally made of polyethylene (PE), and the color is yellow. Medical waste is stored in the packaging bag and uniformly placed in the turnover box (bucket) in order to facilitate storage and transportation [32]. The turnover box (bucket) is generally made of high-density polyethylene (HDPE) [32], and the color is yellow. The medical waste marks should be printed.
When the medical waste reaches three-quarters of the bag’s capacity, the bag needs to be replaced, and the waste needs to be sealed, marked, and transferred to the storage at the site as nonrecyclable medical waste, recyclable medical waste, or domestic waste. Medical waste cannot be transported to the waste disposal plant immediately due to the actual conditions. It needs to be stored in the temporary storage room of the hospital, and the storage time cannot exceed 48 h.
5. Simulation Experiment
5.1. Basic Requirements for the Experiment
(1) Hardware Configuration
CPU: Intel core [email protected] Hz
Memory: 8G DDR3 1333 MHz
Hard disk: 128G SSD + 320G HDD
LCD: LG LGD03B1 1366*768
Motherboard: Lenovo 4291PA8 (Intel QM67)
Graphics card: Intel HD Graphic 3000 64M
(2) Software Configuration
System: Windows 7 Ultimate
Simulation: AnyLogic 8.2.3 Personal Learning Edition
5.2. Medical Waste: Mixed Simulation Model
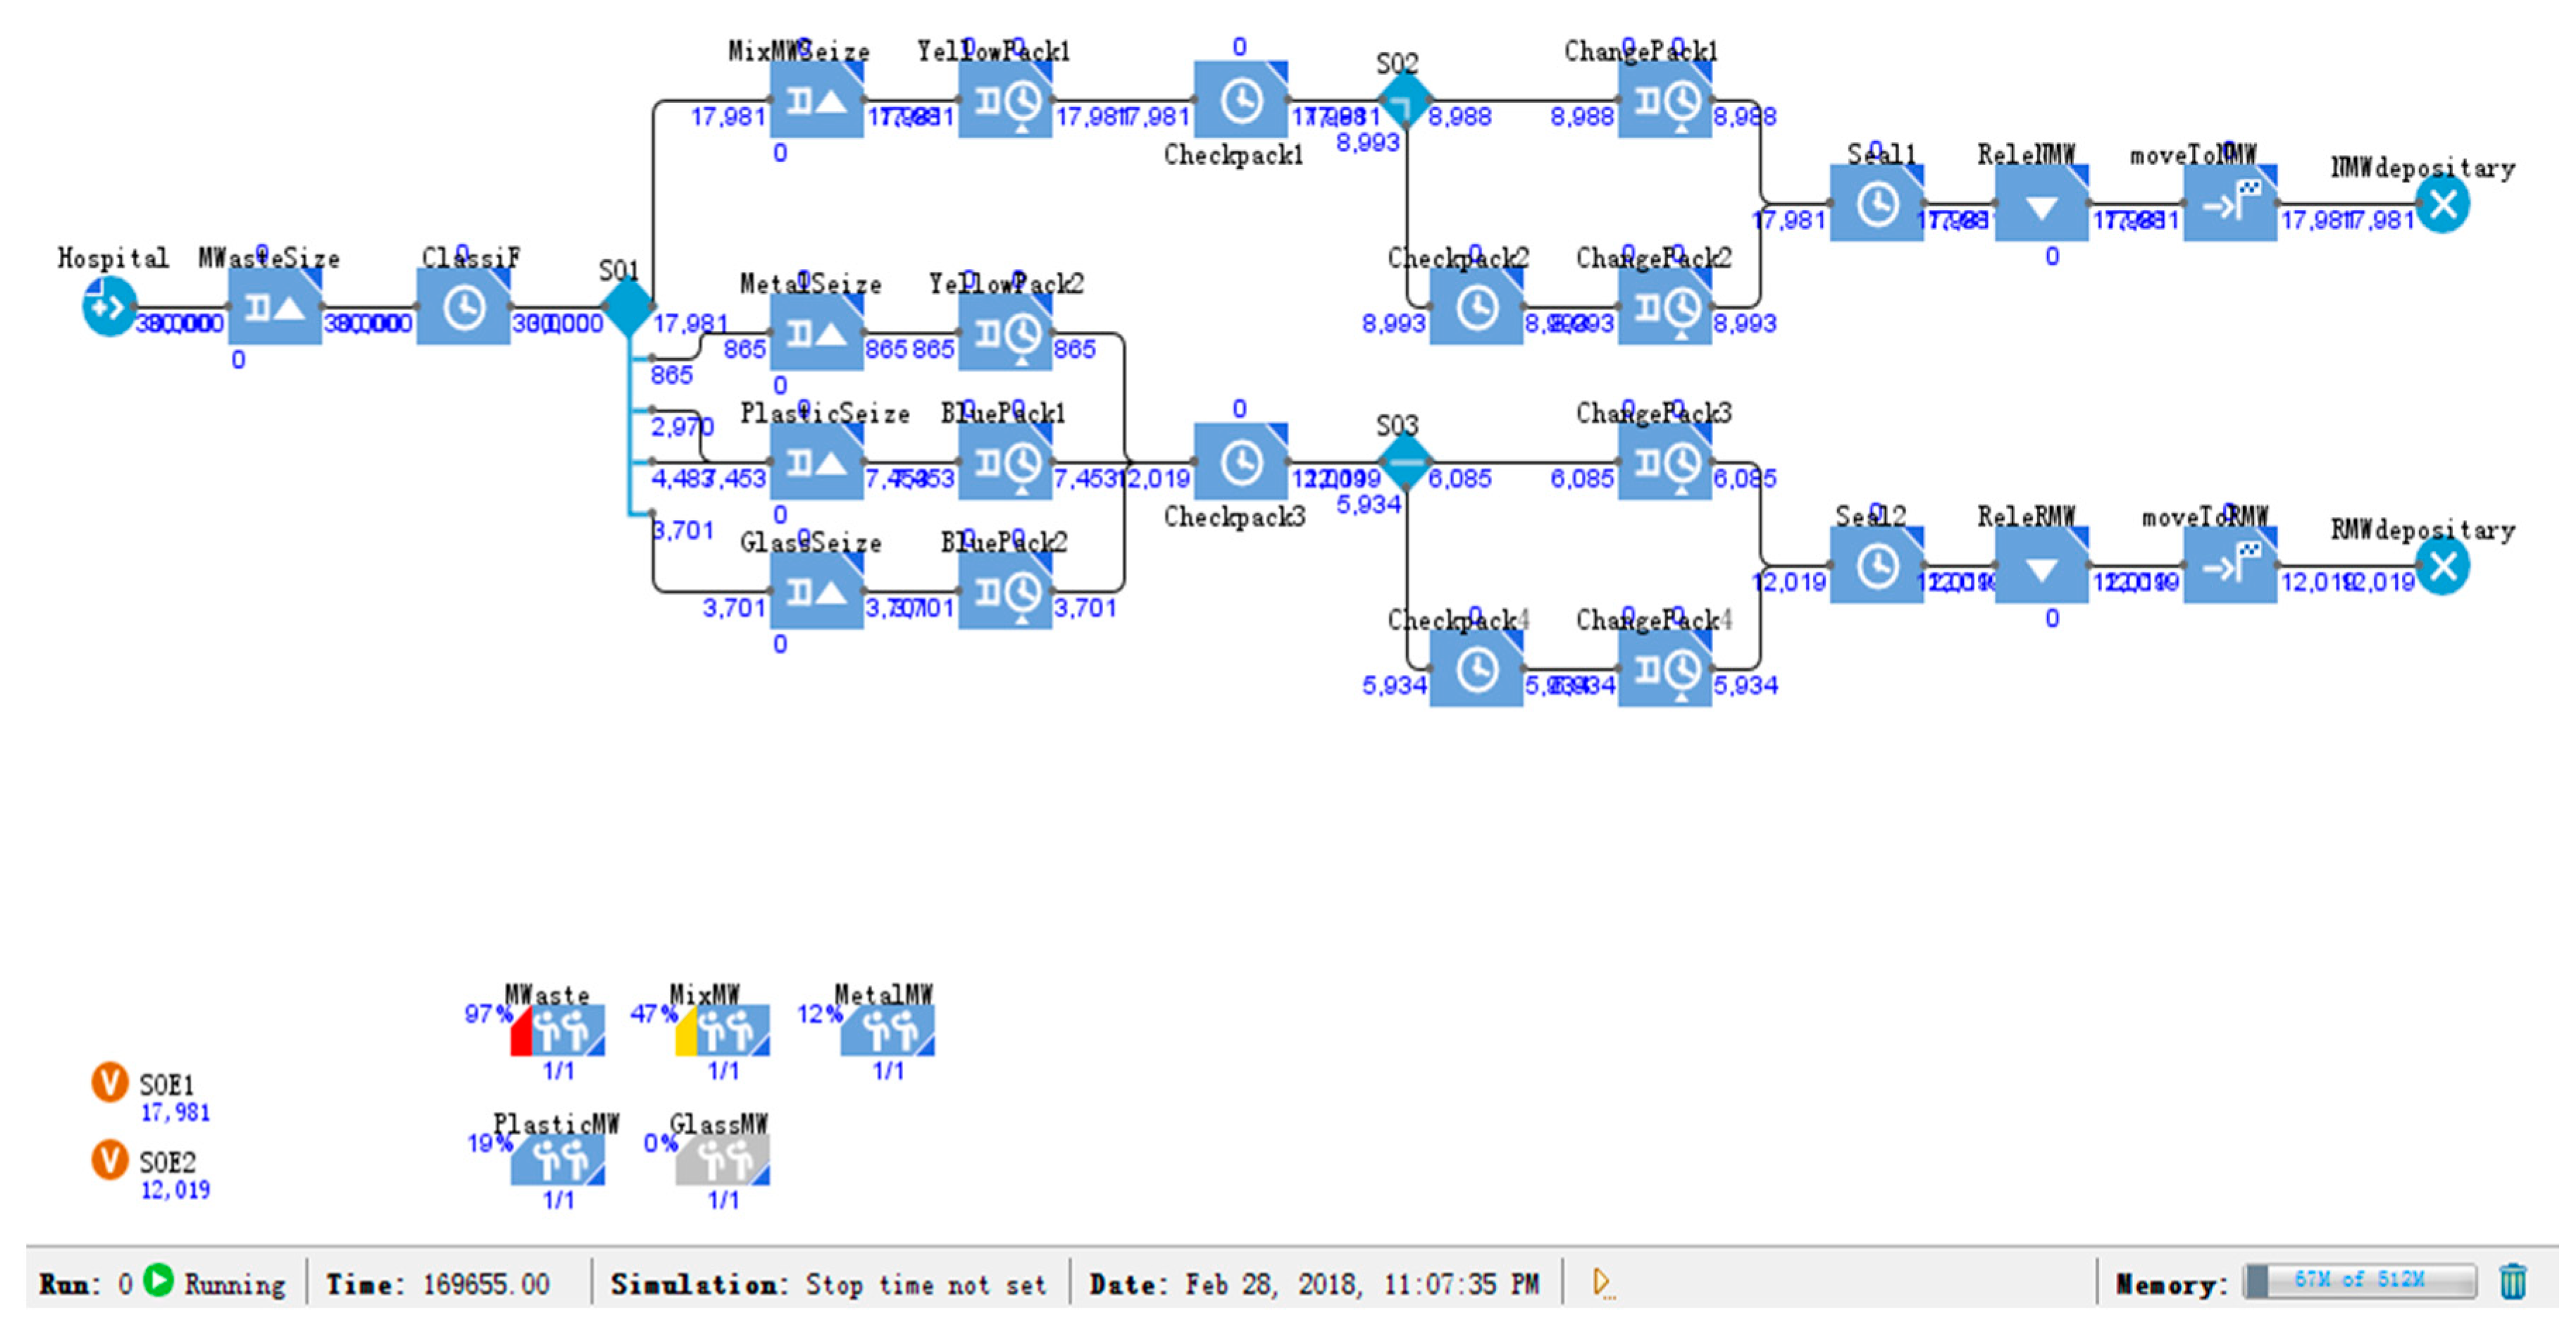
In China, medical waste can be divided into five categories: infectious, pathological, injured, drug-induced, and chemical [2]. However, in reality, medical waste is not strictly classified according to these categories. He et al. found that most medical wastes were mixed together as nonrecyclable medical waste for disposal, except recyclable medical waste such as glass, metal, and plastic. The proportion of these four types of waste was found to be 12% for glass, 3% for metal, 25% for plastic, and 60% for other waste [33].
In this research, we combined the medical waste recycling process and designed a mixed simulation model according to this proportional standard of medical waste. The waste was divided into four types: glass, metal, plastic, and other wastes. Through classification, packaging, and other processes, medical waste was is divided into recyclable and nonrecyclable medical waste.
As shown in Figure 2, the mixed simulation model was assigned according to the classification of medical waste by He et al. [33], and it was run based on the output of 30,000 tons of medical waste in Beijing in 2015. In order to shorten the running time of the model, we accelerated the simulation speed to 500 times and obtained the output of various types of wastes.
5.3. Medical Waste: Classification Simulation Model 1
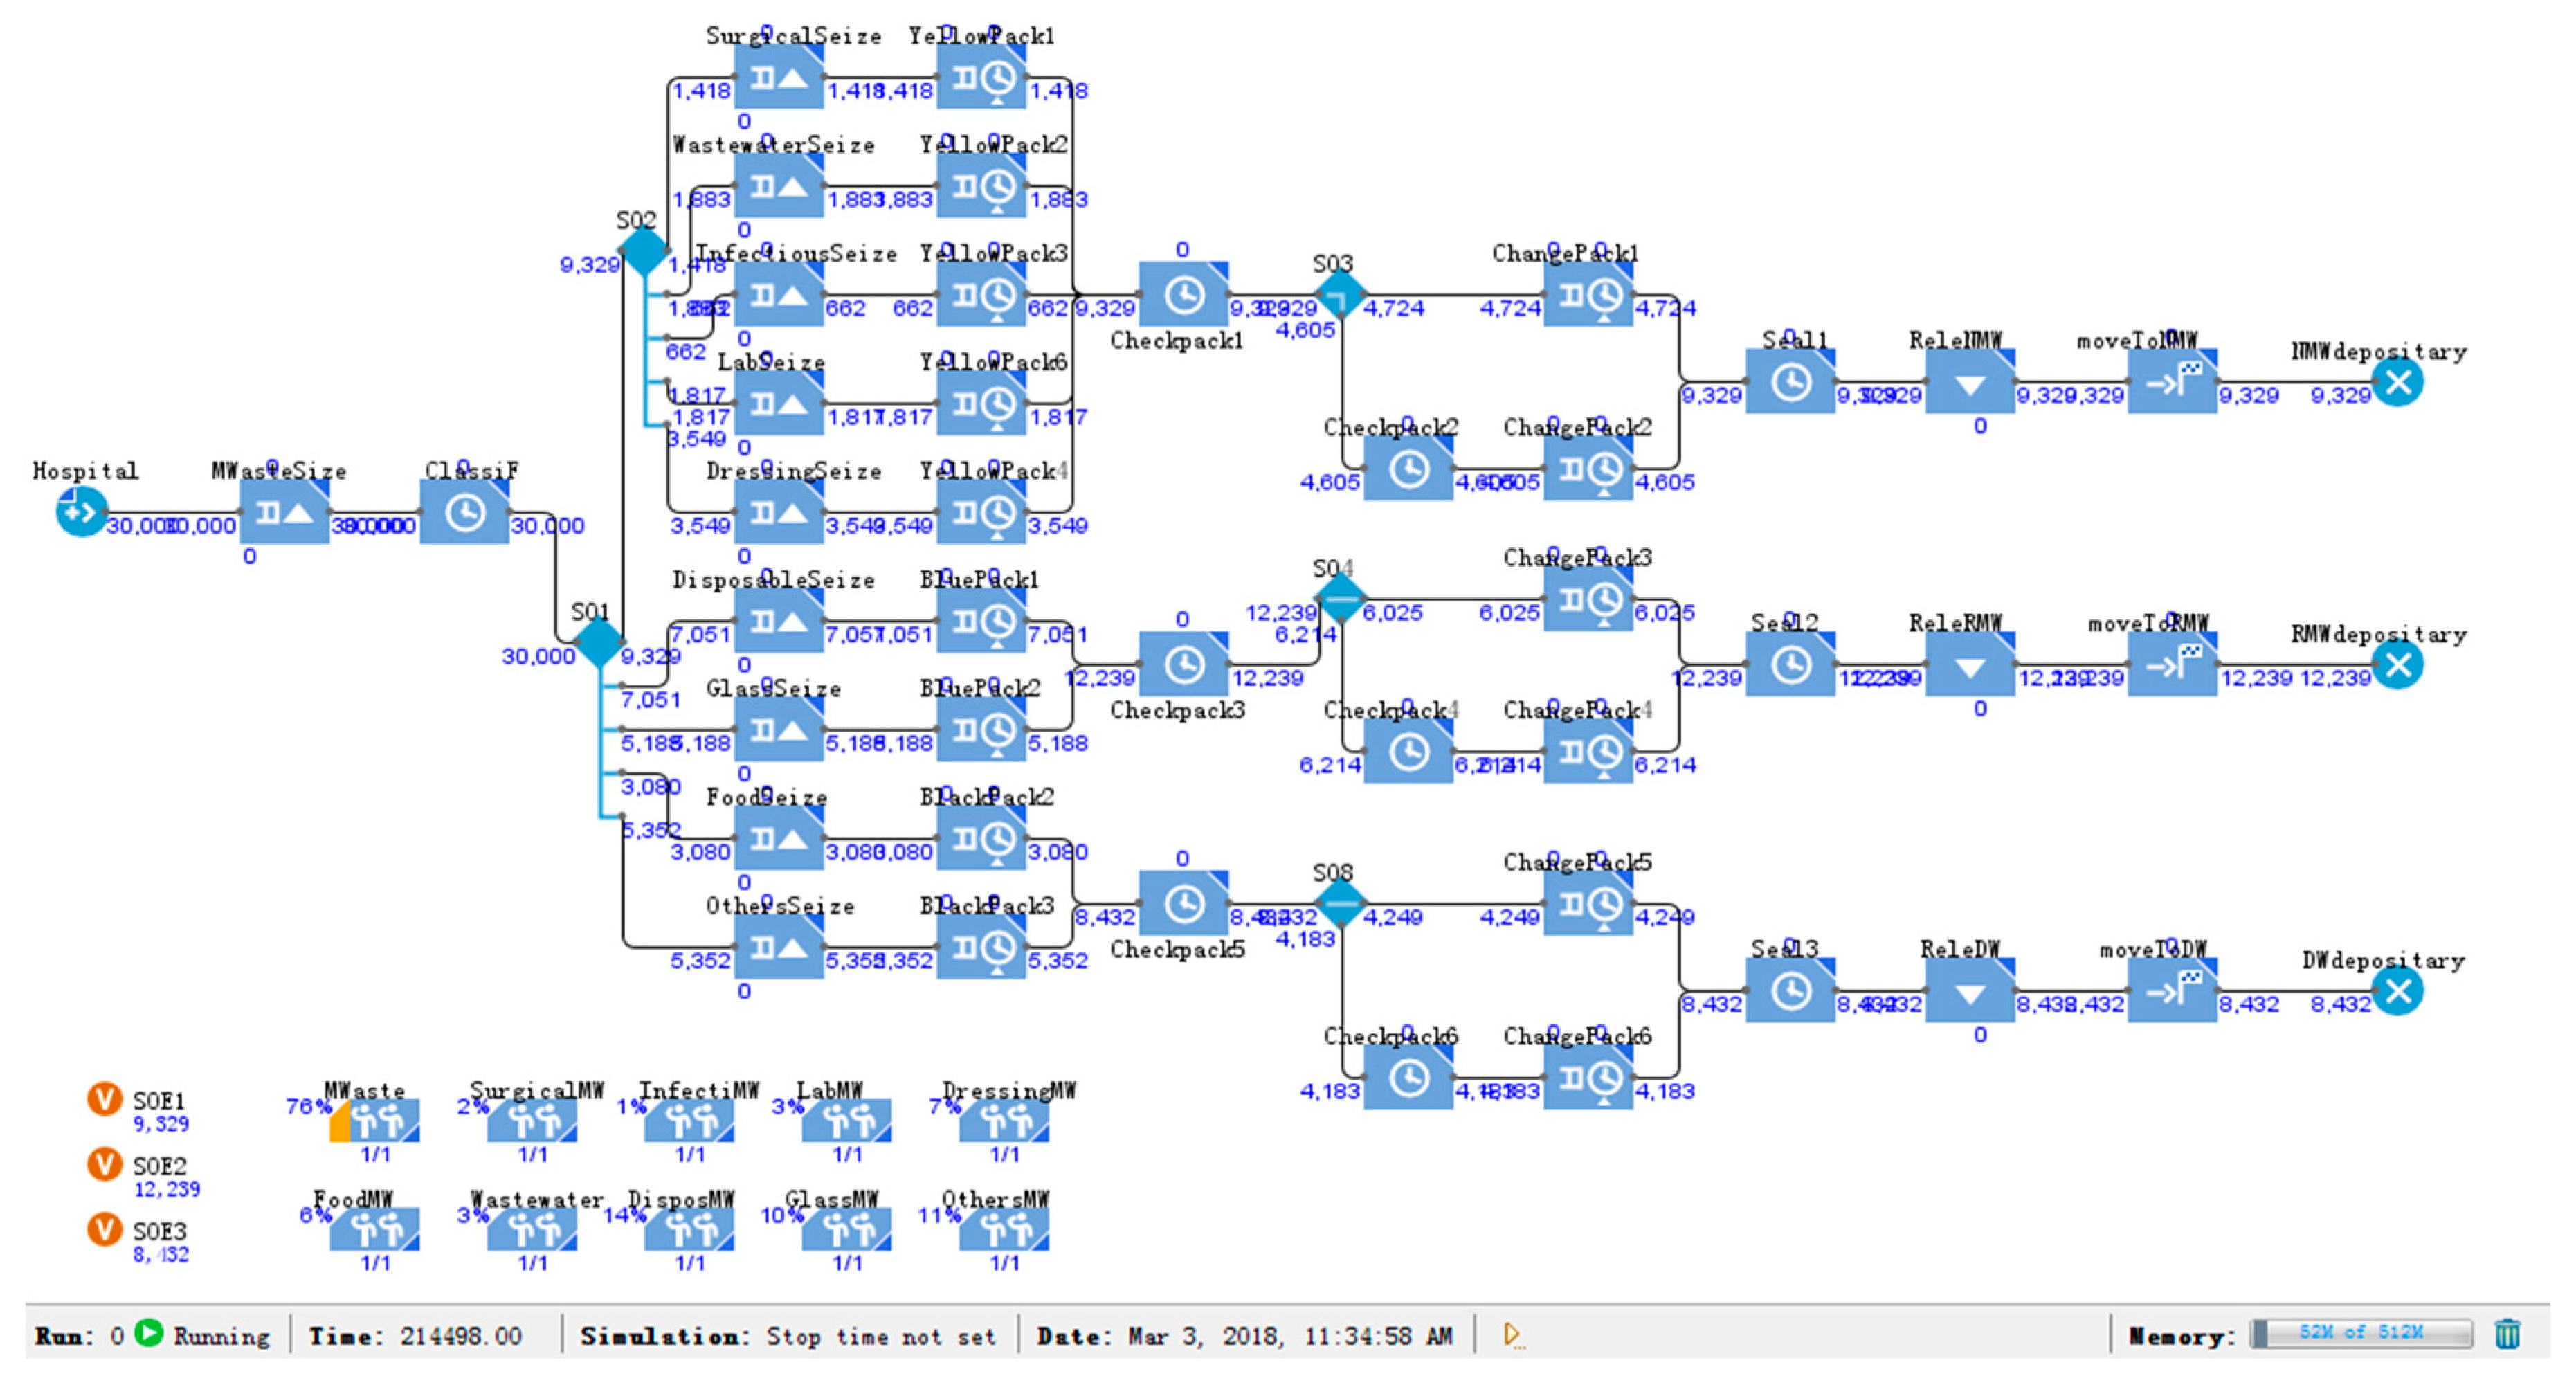
By researching the management of medical waste in various countries in Asia, Ananth et al. found that the current category and proportion of medical waste in China was 4.6% for surgical waste, 6.4% for wastewater treatment sludge, 11.7% for dressing, 2.3% for infectious waste, 10.1% for food residues, 17.6% for glassware, 6.2% for laboratory waste, 23.1% for disposable materials, and 17.9% for others [34].
For this study, we divided medical waste into nine types: surgical waste, wastewater treatment sludge, infectious waste, laboratory waste, dressing, glassware, disposable materials, domestic waste, and recyclable medical waste according to the classification of medical waste by Ananth et al. [34]. We then designed the medical waste classification simulation model 1 based on this classification.
Surgical waste, wastewater treatment sludge, infectious waste, laboratory waste, and dressing were classified as nonrecyclable medical wastes, which accounted for approximately 31.2% of the total waste. Glassware and disposable materials, which could be recycled as recyclable medical waste accounted for approximately 40.7% of the total waste. The others were divided into domestic waste and recyclable medical waste for disposal; food residues were not considered in most cases.
As shown in Figure 3, classification simulation model 1 was assigned according to the classification of medical waste by Ananth et al. [34]. Then, the simulation speed was accelerated to 500 times, and the simulation model was run based on the output of 30,000 tons of medical waste. Classification model 1 divided medical waste into recyclable medical waste, nonrecyclable medical waste, and domestic waste after classification, packaging and other processes.
5.4. Medical Waste: Classification Simulation Model 2
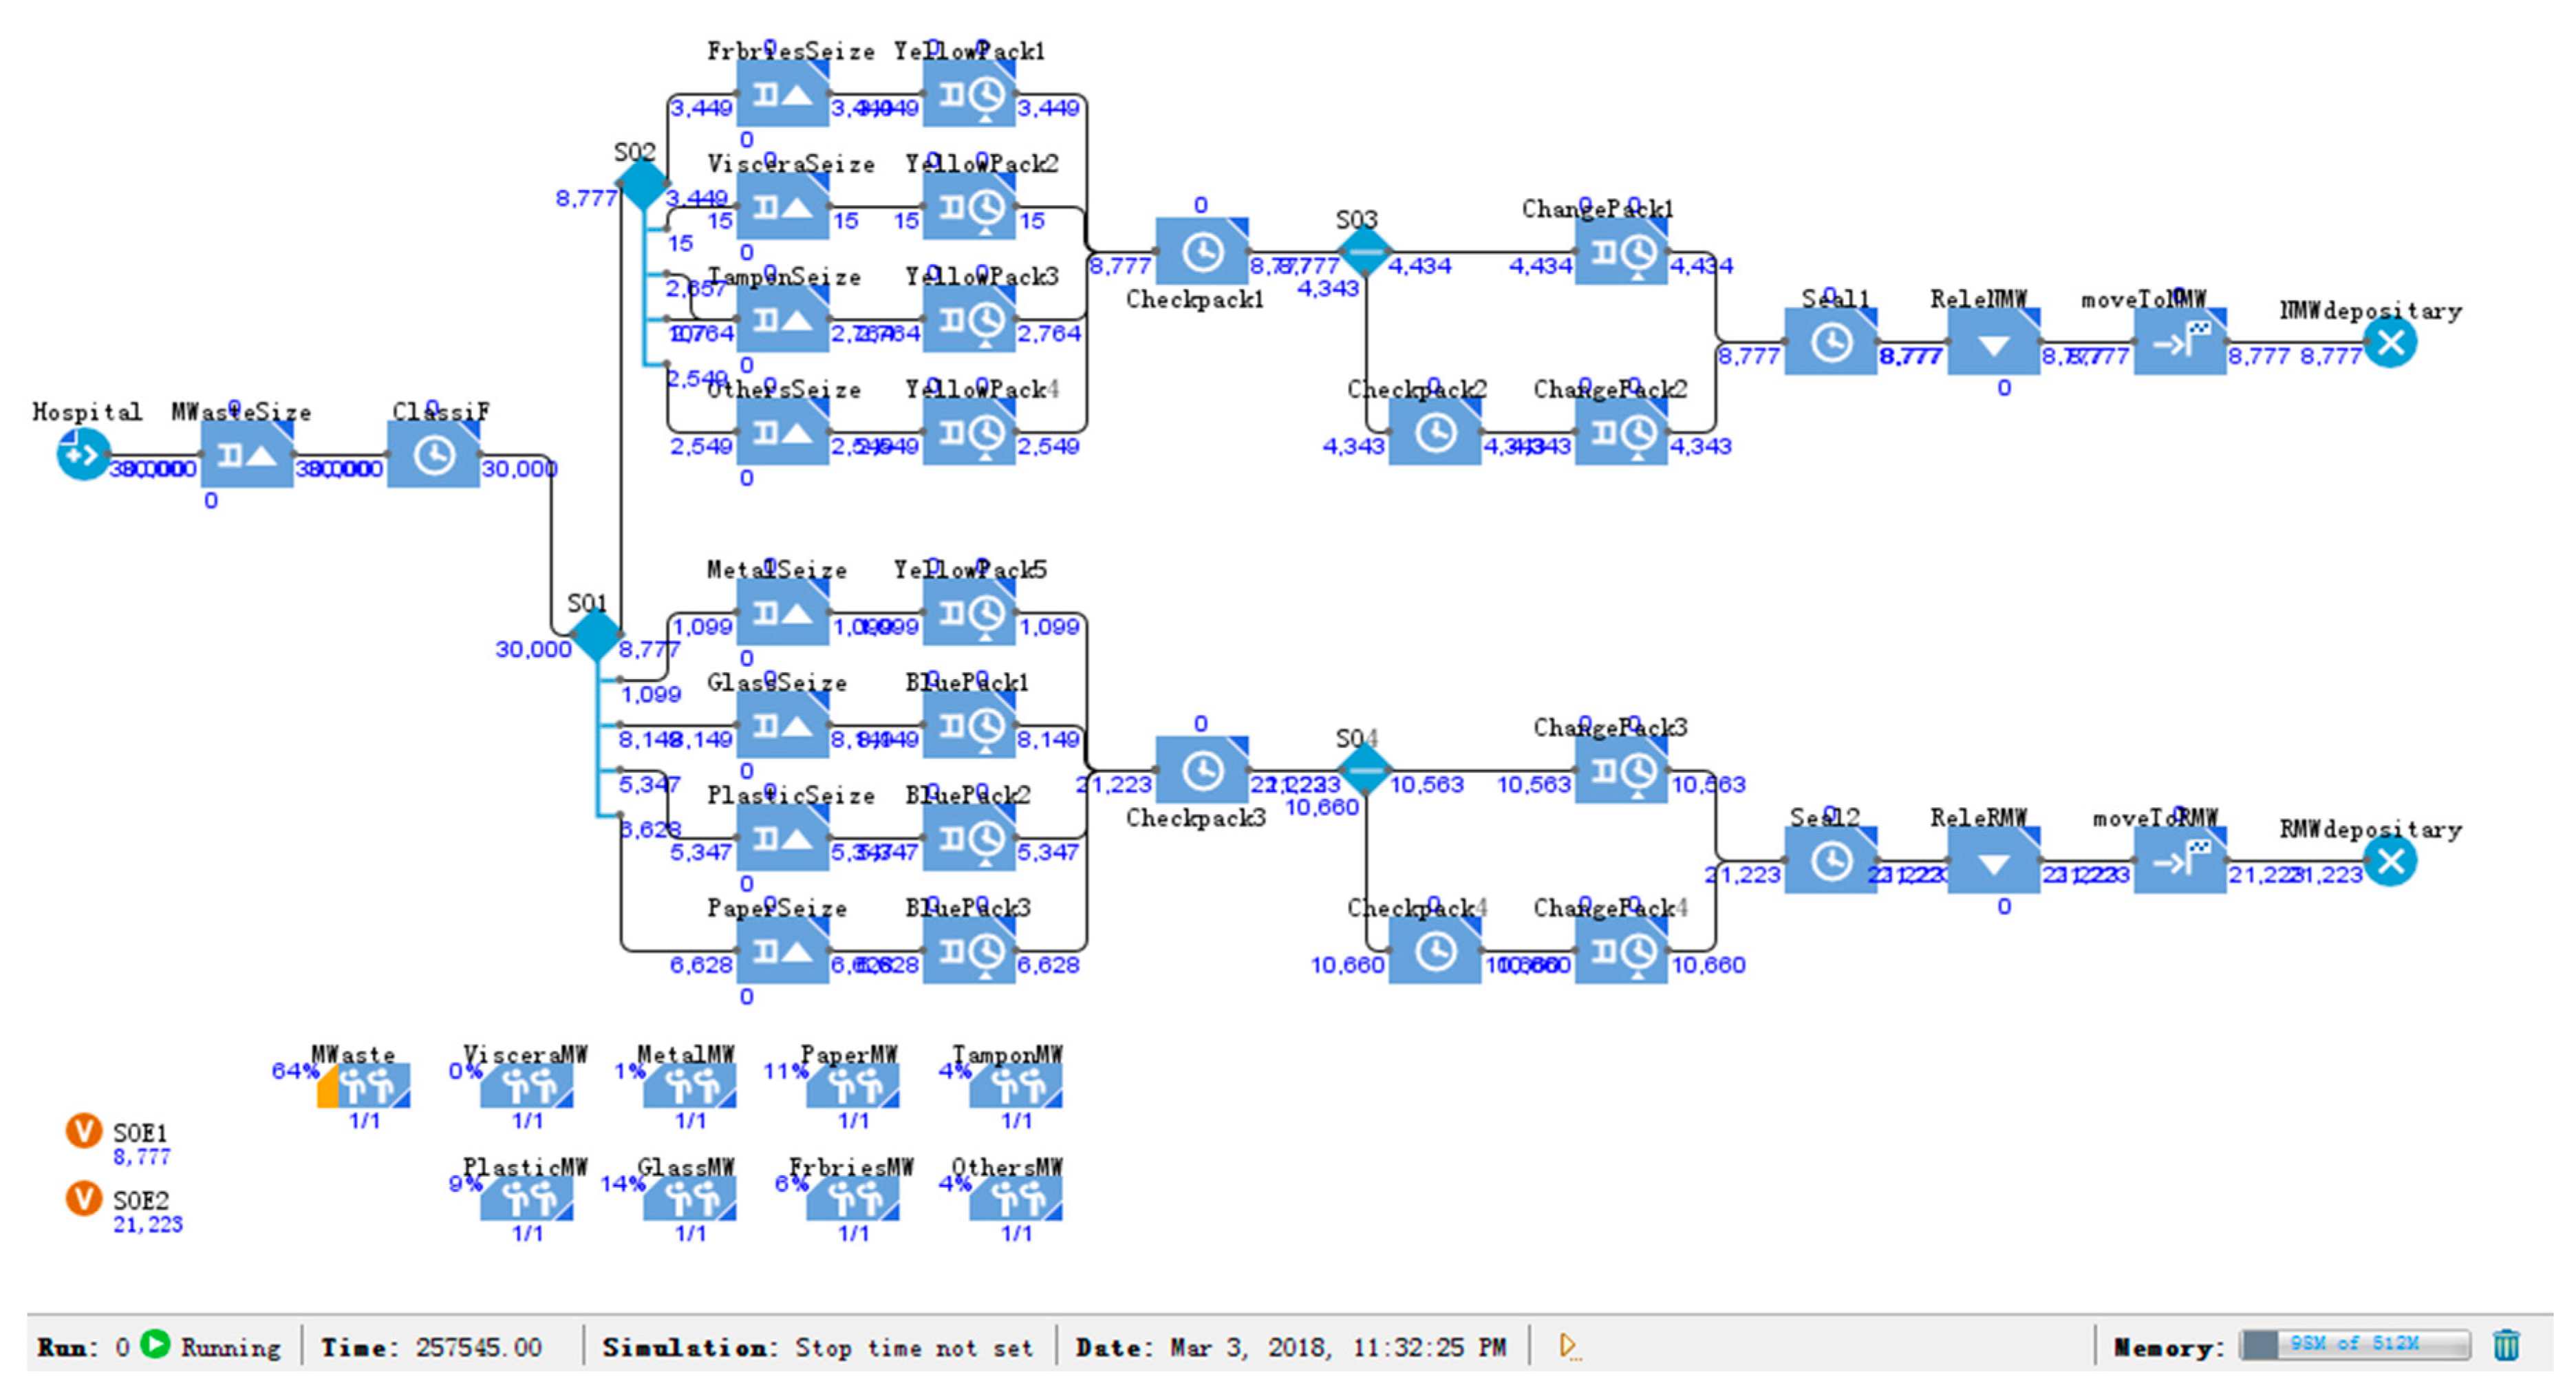
Geng et al. and Chen divided medical waste generated in China into 26.67% for glasses, 11.53% for fabrics, 22.08% for paper, 17.91% for plastics, 9.36% for tampons, 0.05% for viscera, 3.7% for metals, and 8.71% for others [35,36]. Among them, glasses, paper, plastics, and metals, could be recycled as recyclable medical waste, which accounted for 70.36% of the total waste, while the rest was nonrecyclable medical waste. Since paper, plastics, etc. are partially polluted in healthcare activities, the actual recycling rate was much lower than the standard.
According to the proportion of medical waste classification, we divided medical waste into eight types: glasses, paper, plastics, metals, fabrics, tampon, viscera, and others according to the classification of medical waste by Geng et al. and Chen [35,36] and then designed the classification simulation model 2.
As shown in Figure 4, in order to reduce the simulation time and improve computational efficiency, we then accelerated the simulation speed to 500 times. Finally, the classification model 2 divided medical waste into recyclable medical waste and nonrecyclable medical waste.
6. Results
6.1. Simulation Results of the Mixed Model
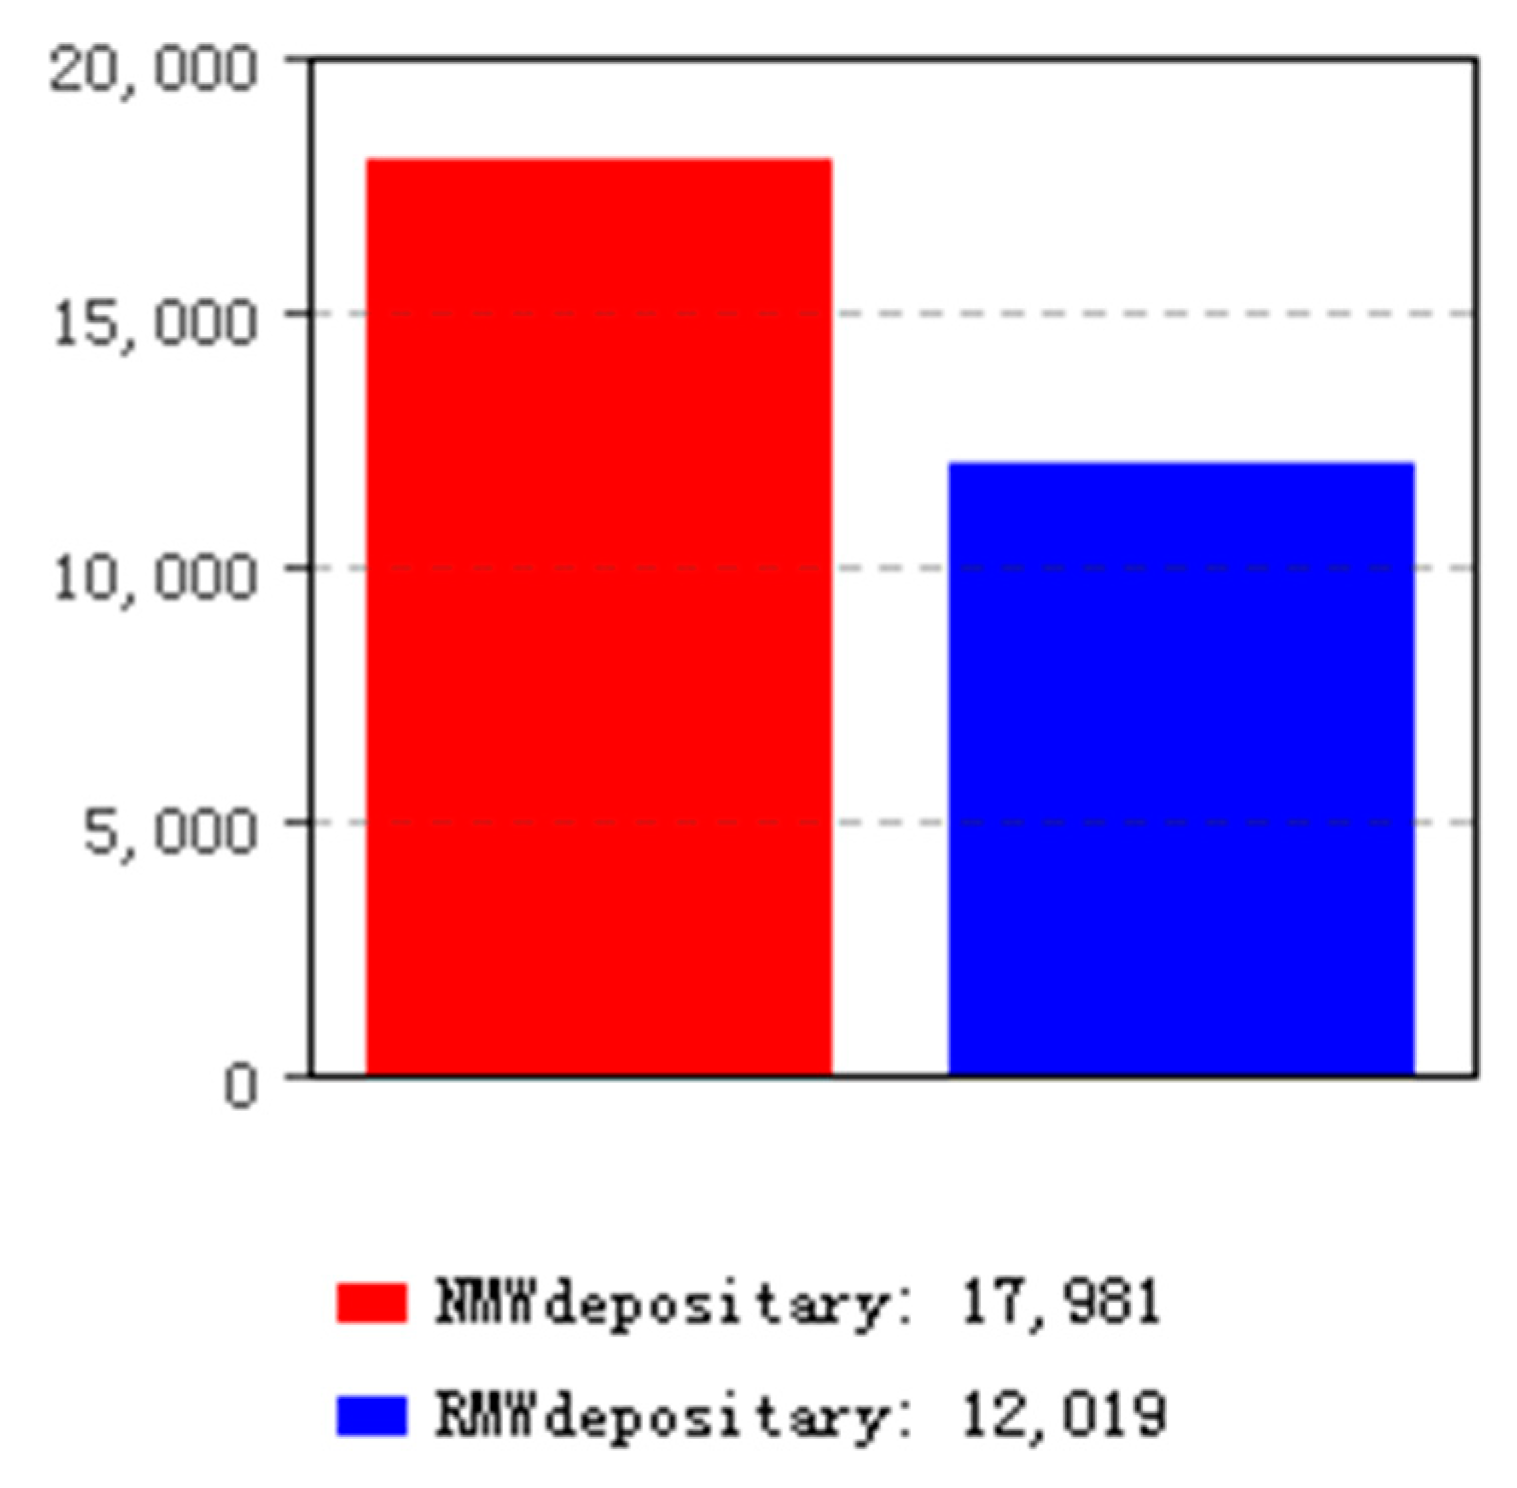
According to the classification of medical waste [33] and the generation of medical waste in Beijing in 2015, we accelerated the simulation speed of the mixed model to 500 times. The simulation results are shown in Figure 5, where the red column represents the nonrecyclable medical waste, and the blue column represents recyclable medical waste.
According to the calculations, 12,019 tons of medical waste could be recovered, and 17,981 tons of nonrecyclable medical wastes needed to be treated, accounting for approximately 40% and 60% of the total waste, respectively. We did not distinguish domestic waste strictly, but considered it as nonrecyclable medical waste.
6.2. Simulation Results of Classification Model 1
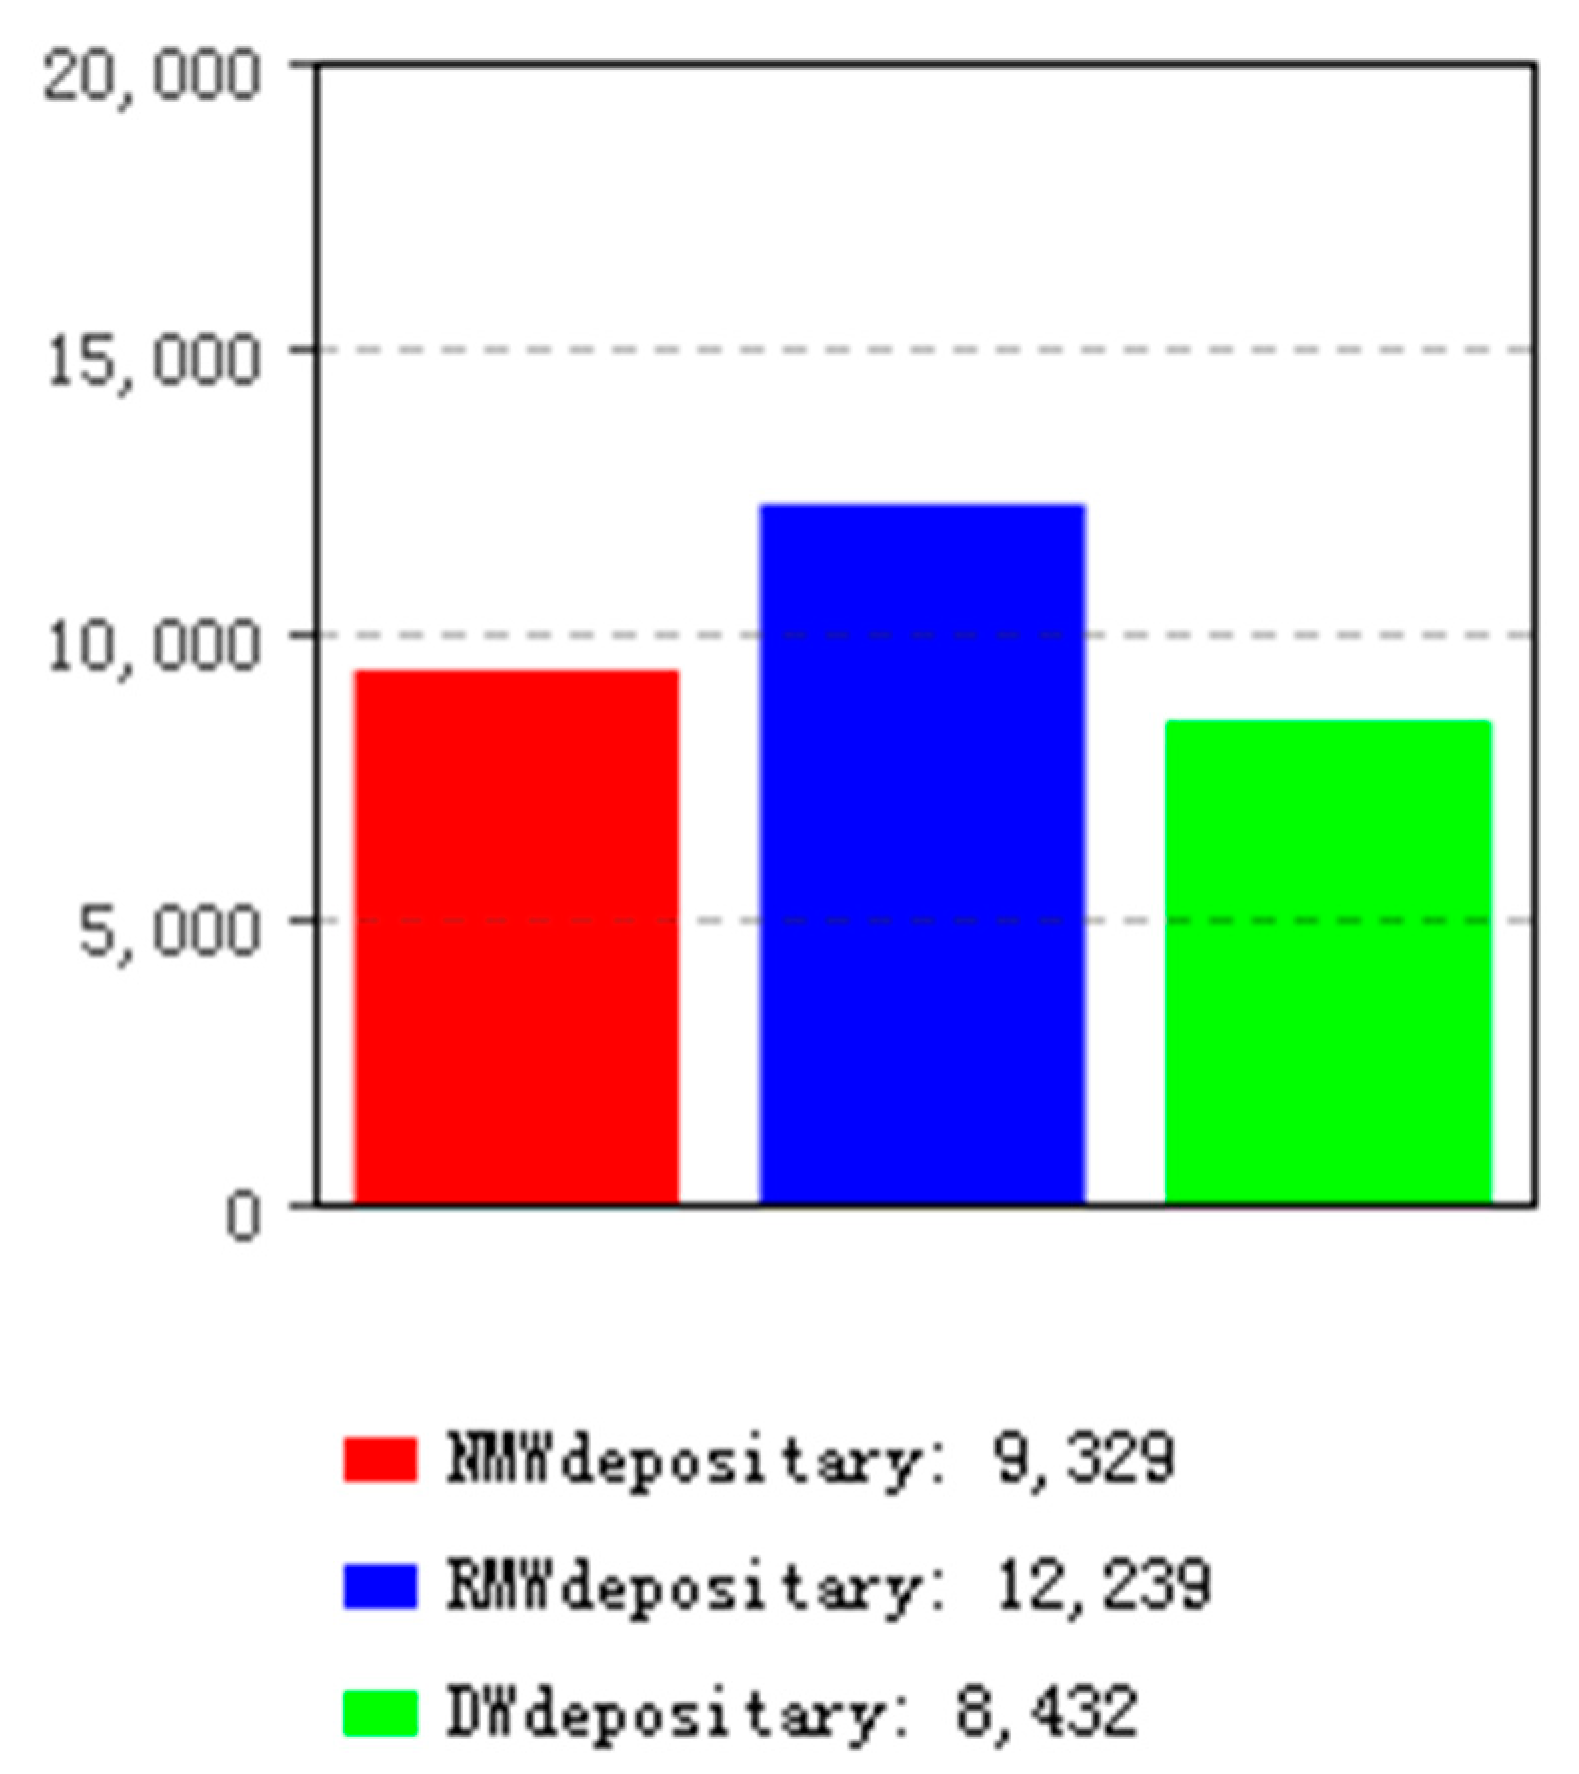
The generation of medical waste in Beijing in 2015 was 30,000 tons, according to the research into classification of medical waste in China [34]. For simulation model 1, we accelerated the simulation speed to 500 times. The simulation results are shown in Figure 6, where the red column represents the nonrecyclable medical waste, the blue column represents the recyclable medical waste, and the green column represents domestic waste.
Calculations showed that 9329 tons of medical wastes were nonrecyclable, accounting for approximately 31.1% of the total medical waste; 12,239 tons of medical wastes could be recycled, which account for approximately 40.8% of the total; and 8432 tons of was domestic waste, accounting for approximately 28.1% of the total.
6.3. Simulation Results of Classification Model 2
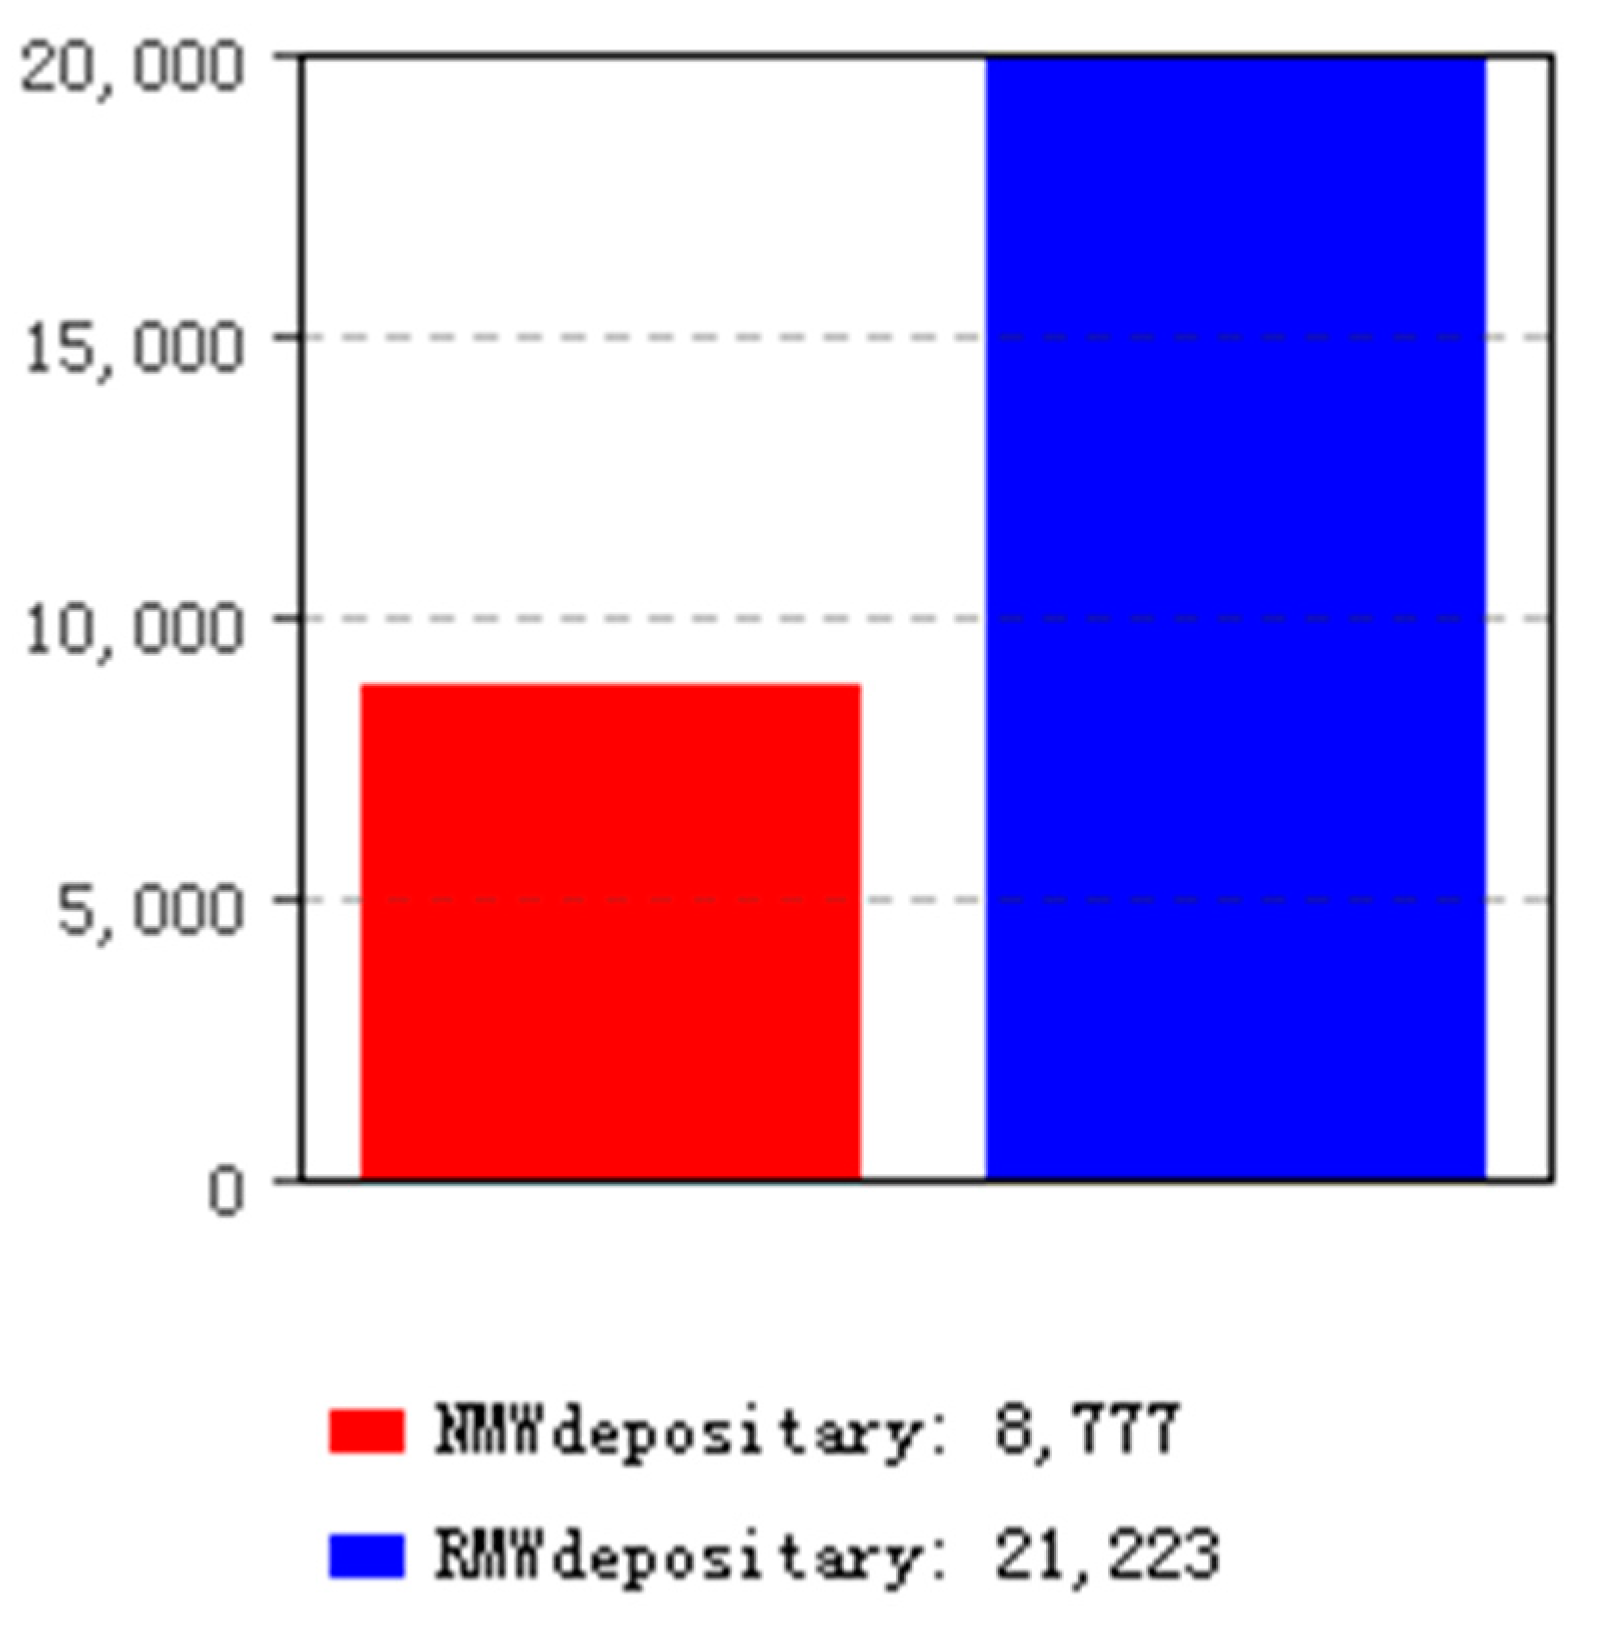
According to the classification of medical waste in China [35,36], we accelerated the simulation speed of classification model 2 to 500 times. The simulation results are shown in Figure 7, where the red column represents the nonrecyclable medical waste, and the blue column represents the recyclable medical waste.
Calculations showed that out of the 30,000 tons of medical waste in Beijing in 2015, 8777 tons was nonrecyclable medical waste, accounting for 29.25%, and 21,223 tons was recyclable medical waste, accounting for approximately 70.74%; we did not distinguish domestic waste for this model. The actual generation of recyclable medical waste was lower than the measured amount owing to the fact that some of the papers, plastics, etc. had been contaminated in healthcare activities.
7. Discussion
Our research compared and analyzed the mixed and classification models from the aspects of output, generation rate, disposal cost, and recycling revenue of various types of medical waste.
7.1. Output/Generation Rate
We collated and analyzed the simulation results for the mixed model, classification simulation model 1, and classification simulation model 2 and obtained the output and generation rate of recyclable medical waste, nonrecyclable medical waste, and domestic waste under the three models.
As shown in Table 2, calculations showed that the recyclable medical waste of the mixed model was 12,019 tons, accounting for approximately 40%; the nonrecyclable medical waste was 17,981 tons, accounting for approximately 60%. In classification model 1, the recyclable medical waste was 12,239 tons, accounting for approximately 40.8%; the nonrecyclable medical waste was 9329 tons, accounting for approximately 31.1%; and the domestic waste was 8432 tons, accounting for approximately 28.1%. In classification model 2, the recyclable medical waste was 21,223 tons, accounting for approximately 70.74%; the nonrecyclable medical waste was 8777 tons, accounting for approximately 29.25%.
Compared with the mixed model, the recyclable medical waste of classification model 1 increased by 220 tons, an increase of 1.83%; the nonrecyclable medical waste reduced by 8652 tons, which was a reduction rate of 48.12%; and 8432 tons of domestic waste was decomposed.
Compared with the mixed model, the recyclable medical waste of classification model 2 increased by 9204 tons, an increase of 76.58%; the nonrecyclable medical waste reduced by 9204 tons, which was a reduction rate of 51.19%. However, due to some errors in the statistical process and because the recyclable medical waste such as glass, paper, plastic, and metal had been contaminated in healthcare activities, the actual recyclable proportion was much lower.
7.2. Disposal Cost
According to the pricing documents of the Beijing Municipal Commission of Development and Reform—Beijing Price (charge) (2003) No. 303 [37] and Beijing Municipal Commission of Development and Reform (2011) No. 771 [38]—the disposal cost of medical waste in Beijing cannot exceed ¥3000/ton. The disposal cost of medical waste is set at ¥2873/ton for Beijing’s GaoAnTun Medical Waste Disposal Plant since in 2014 [39].
According to the pricing documents of the Beijing Municipal Commission of Development and Reform—Beijing Municipal Commission of Development and Reform (2013) No. 2662—the nonresidential domestic waste disposal charge in Beijing is ¥300/ton, and ¥100/ton for food waste disposal [40]. The disposal fee for domestic waste and food waste includes the cost of collection, transportation, and treatment.
We calculated the disposal cost of nonrecyclable medical waste, domestic waste, and total waste for the mixed model, classification model 1, and classification model 2.
As shown in Table 3, as per calculation, the disposal cost of medical waste for the mixed model worked out to be approximately ¥51,659,413. The disposal cost of nonrecyclable medical waste for classification model 1 was approximately ¥26,802,217; the disposal cost for food waste and domestic waste was approximately ¥1,913,600 (including 5352 tons for domestic waste and 3080 tons for food waste). The total disposal cost for classification model 1 was approximately ¥28,715,817, which was a reduction of approximately ¥22,943,596 compared with the mixed model, i.e., a reduction rate of approximately 44.41%.
The total disposal cost of medical waste for the classification model 2 worked out to be approximately ¥25,216,321, which was a reduction of approximately ¥26,443,092, or approximately 51.19%, compared with the mixed model. However, due to some errors in the statistical process and because the recyclable medical waste such as glass, paper, etc. had been contaminated in healthcare activities and could only be treated as nonrecyclable medical waste, the actual disposal cost was higher than the calculation results, while the reduction rate was lower than the existing standard.
7.3. Recycling Revenue
According to the China Renewable Resources Price Index released by the China Resource Recycling Association, the current recycling price of scrap steel is approximately ¥2227/ton, the recycling price of waste paper is approximately ¥2430/ton, the price of PP plastic pellets is approximately ¥6700–7000/ton, the price of white primary PE pellets is approximately ¥7800/ton, and the price of regenerated PET is approximately ¥7000/ton [41]. Due to the variety of plastic, each price is different. In this paper, we designated the price of plastic granules as ¥7000/ton for ease of calculation. There was also some glass in the medical waste. The recycling price of glass is approximately ¥400–500/ton, and we designated the price as ¥450/ton [41].
The recyclable medical waste mainly included glasses, paper, plastics, and metals. For disposable materials in classification model 1, there were three types of recyclable waste: paper, plastics, and metals. However, because the existing data lacked information on the proportion of each substance, it was allocated according to the proportion of each substance in the mixed model and classification model 2 in order to facilitate calculation.
The proportion of all kinds of recyclable medical waste in the mixed model was glass 12%, metal 3%, and plastic 25%. In classification model 2, the proportion was paper 22.08%, plastics 17.91%, metals 3.7%, and glasses 26.67%. There might have been some errors in the statistical data due to the statistical methods used, the regional economy, and other factors. In the mixed model, metal and plastic accounted for approximately 7.5% and 62.5% of the 40% total recyclable medical waste, respectively, and the percentage of paper in classification model 1 was approximately 31.4%. We removed the decimal point to make the proportions consistent; thus, the proportion of paper, metal, and plastic was noted as 31%, 7%, and 62%, respectively.
As shown in Table 4, simulation and calculation results showed that the quantity of glass, paper, plastic, and metal in the mixed model was 3701, 0, 7453, and 865 tons, respectively. According to the above proportions, the generation of paper, plastic, and metal in 7051 tons of disposable materials in classification model 1 were approximately 2186, 4371, and 494 tons, respectively. The generation of glass, paper, plastic, and metal in classification model 2 was 8149, 6628, 5347, and 1099 tons, respectively.
As shown in Table 5, simulation and calculation showed that the recycling revenues of glass, paper, plastic, and metal in the mixed model were approximately ¥1,665,450; ¥0; ¥52,171,000; and ¥1,926,355, respectively; the total revenue was approximately ¥55,762,805. For classification model 1, the recycling revenues of glass, paper, plastic, and metal were approximately ¥2,334,600; ¥5,311,980; ¥30,597,000; and ¥1,100,138, respectively; the total revenue was approximately ¥39,343,718. For classification model 2, the recycling revenues of glass, paper, plastic, and metal were approximately ¥3,667,050; ¥16,106,040; ¥37,429,000; and ¥2,447,473, respectively, the total revenue was approximately ¥59,649,563.
7.4. Cost–Benefit Comparison Analysis
According to Section 7.2 and Section 7.3, the cost–benefit comparison between mixed model, classification model 1, and classification model 2 could be made using the figures relating to disposal cost and recycling revenues.
As shown in Figure 8, the balance between the disposal cost of nonrecyclable medical waste and the recycling revenue was approximately ¥4,103,392 for the mixed model. For classification model 1, the balance between disposal cost and recycling revenue was approximately ¥10,627,901. In classification model 2, the balance between disposal cost and recycling revenue was approximately ¥34,433,242. However, due to possible some statistical errors and because the recyclable medical waste in classification model 2 such as glass, paper, etc. had been contaminated in healthcare activities these could only be treated as nonrecyclable medical waste. Therefore, the actual difference was also lower than the existing standards.
From the comparison and analysis of the three models in regard to generation, generation rate, disposal cost, recycling revenue, and other aspects of recyclable, nonrecyclable, and domestic waste, we deduced that the classification of medical waste could reduce the nonrecyclable medical waste and increase the proportion of recyclable medical waste. This is of great significance as it will help increase income, reduce disposal cost, reduce impact on the environment, and improve the recycling of resources.
Strict implementation of the recycling and classification standards for medical waste can greatly reduce the output of nonrecyclable medical waste and improve the utilization rate of recyclable medical waste. It can also solve the problems of nonstrict classification, such as low recovery rate and high disposal costs as well as reduce the risk of disease transmission and environmental pollution.
8. Conclusions
In this study, we mainly carried out the following tasks: (1) We used AnyLogic to design a mixed model and two classification models based on the standards of medical waste classification and composition in China. (2) We simulated the mixed model and classification models and then calculated the output of nonrecyclable medical waste, recyclable medical waste, and domestic waste. (3) We compared and analyzed the output, generation rate, disposal cost, recycling revenues, and cost–benefit based on the calculation results and relevant policy documents of the Beijing Municipal Commission of Development and Reform.
From comparative analysis, we could clearly see the differences between the mixed model, classification model 1, and classification model 2 in terms of output, generation rate, disposal cost, recycling revenue, and so on. The results further confirms the importance of strengthening the classification of medical waste, which can reduce the total amount of nonrecyclable medical waste, lower disposal cost, and reduce environmental pollution.
However, this research was limited to the analysis of existing data and models. Due to the lack of specific and effective classification data, there were some errors in the output of medical waste, disposal costs, recycling revenues, etc. Furthermore, the data was only simulated and analyzed at the macro level to verify the importance of strengthening the classification of medical waste. The shortcomings of the current research will be the subject of future research as we need to address these limitations in order to achieve a deeper level of understanding on medical waste classification management.
Author Contributions
Conceptualization, H.L.; Data curation, H.L.; Funding acquisition, Z.Y.; Investigation, H.L.; Methodology, H.L.; Project administration, Z.Y.; Resources, Z.Y.; Software, H.L.; Supervision, Z.Y.; Validation, H.L. and Z.Y.; Writing—original draft, H.L.; Writing—review & editing, H.L. and Z.Y.
Funding
This work has been supported by the Natural Science Foundation of China (Project No. 71671011, No. 71332003).
Acknowledgments
This work has been supported by the Natural Science Foundation of China (Project No. 71671011, No. 71332003). In addition, we would like to express our sincere gratitude for the constructive comments and suggestions from the editor and the reviewers to improve this paper.
Conflicts of Interest
The authors declare no conflict of interest.
References
- Decree of the State Council of the People’s Republic of China No. 380. Medical Waste Management Regulations. 2003. Available online: http://www.nhfpc.gov.cn/mohzcfgs/pfg/200804/18302.shtml (accessed on 16 April 2018).
- National Health and Family Planning Commission of the People’s Republic of China. Catalogue of Classified Medical Waste. 2013. Available online: http://www.moh.gov.cn/zwgkzt/mdml/201306/65605243db4e4635a9a4f819d8e6de5f.shtml (accessed on 16 April 2018).
- World Health Organization (WHO). Health-Care Waste. Fact Sheet. 2018. Available online: http://www.who.int/mediacentre/factsheets/fs253/en/ (accessed on 15 April 2018).
- Mathur, P.; Patan, S.; Shobhawat, S.A. Need of biomedical waste management system in hospitals—An emerging issue—A review. Curr. World Environ. 2012, 7, 117–124. [Google Scholar] [CrossRef]
- Liu, H.; Yao, Z.; Zhang, Q. A temporary storage systematic model for medical waste based on RFID technology. Fresenius Environ. Bull. 2018, 27, 6152–6161. [Google Scholar]
- Zhang, H.J.; Zhang, Y.H.; Wang, Y.; Yang, Y.H.; Zhang, J.; Wang, Y.L.; Wang, J.L. Investigation of medical waste management in Gansu Province, China. Waste Manag. Res. 2013, 31, 655–659. [Google Scholar] [CrossRef] [PubMed]
- Gai, R.Y.; Xu, L.Z.; Li, H.J.; Zhou, C.C.; He, J.J.; Yoshihisa, S.; Tang, W.; Chushi, K. Investigation of health care waste management in Binzhou District, China. Waste Manag. 2010, 30, 246–250. [Google Scholar] [CrossRef]
- Zhang, Y.; Xiao, G.; Wang, G.X.; Zhou, T.; Jiang, D.W. Medical waste management in China: A case study of Nanjing. Waste Manag. 2009, 29, 1376–1382. [Google Scholar] [CrossRef]
- Jang, Y.C.; Lee, C.; Yoon, O.S.; Kim, H. Medical waste management in Korea. J. Environ. Manag. 2006, 80, 107–115. [Google Scholar] [CrossRef] [PubMed]
- Windfeld, E.S.; Brooks, M.S.L. Medical waste management—A review. J. Environ. Manag. 2015, 163, 98–108. [Google Scholar] [CrossRef] [PubMed]
- Askarian, M.; Heidarpoor, P.; Assadian, O. A total quality management approach to healthcare waste management in Namazi Hospital, Iran. Waste Manag. 2010, 30, 2321–2326. [Google Scholar] [CrossRef] [PubMed]
- Kei Robert, M.; Njagi Ananias, N. Management of Health-Care Waste: A Case Study of Two National Teaching and Referral Hospitals in Kenya. JETEAS 2013, 4, 588–593. [Google Scholar]
- Hossain, M.S.; Santhanam, A.; Norulaini, N.N.; Omar, A.K.M. Clinical solid waste management practices and its impact on human health and environment—A review. Waste Manag. 2011, 31, 754–766. [Google Scholar] [CrossRef] [PubMed]
- El-Salam, M.M.A. Hospital waste management in El-Beheira Governorate, Egypt. J. Environ. Manag. 2010, 91, 618–629. [Google Scholar] [CrossRef] [PubMed]
- Mohamed, L.F.; Ebrahim, S.A.; Al-Thukair, A.A. Hazardous healthcare waste management in the Kingdom of Bahrain. Waste Manag. 2009, 29, 2404–2409. [Google Scholar] [CrossRef] [PubMed]
- Moreira, A.M.M.; Günther, W.M.R. Assessment of medical waste management at a primary health-care center in São Paulo, Brazil. Waste Manag. 2013, 33, 162–167. [Google Scholar] [CrossRef] [PubMed]
- Janagi, R.; Shah, J.; Maheshwari, D. Scenario of Management of Medical Waste in US and UK: A Review. JGTPS 2015, 6, 2328–2339. [Google Scholar]
- Minoglou, M.; Komilis, D. Describing health care waste generation rates using regression modeling and principal component analysis. Waste Manag. 2018, 78, 811–818. [Google Scholar] [CrossRef]
- Korkut, E.N. Estimations and analysis of medical waste amounts in the city of Istanbul and proposing a new approach for the estimation of future medical waste amounts. Waste Manag. 2018, 81, 168–176. [Google Scholar] [CrossRef]
- Xin, Y.T. Comparison of hospital medical waste generation rate based on diagnosis-related groups. J. Clean. Prod. 2015, 100, 202–207. [Google Scholar] [CrossRef]
- Graikos, A.; Voudrias, E.; Papazachariou, A.; Iosifidis, N.; Kalpakidou, M. Composition and production rate of medical waste from a small producer in Greece. Waste Manag. 2010, 30, 1683–1689. [Google Scholar] [CrossRef] [PubMed]
- Sharma, S.K.; Gupta, S. Healthcare waste management scenario: A case of Himachal Pradesh (India). CEGH 2017, 5, 169–172. [Google Scholar] [CrossRef]
- Kalogiannidou, K.; Nikolakopoulou, E.; Komilis, D. Generation and composition of waste from medical histopathology laboratories. Waste Manag. 2018, 79, 435–442. [Google Scholar] [CrossRef] [PubMed]
- Rabeie, O.L.; Miranzadeh, M.B.; Fallah, S.H.; Dehqan, S.; Moulana, Z.; Amouei, A.; Mohammadi, A.A.; Asgharnia, H.A.; Babaie, M. Determination of hospital waste composition and management in Amol city, Iran. Health Scope 2012, 1, 127–131. [Google Scholar] [CrossRef]
- Caniato, M.; Tudor, T.L.; Vaccari, M. Assessment of health-care waste management in a humanitarian crisis: A case study of the Gaza Strip. Waste Manag. 2016, 58, 386–396. [Google Scholar] [CrossRef] [PubMed] [Green Version]
- Komilis, D.; Makroleivaditis, N.; Nikolakopoulou, E. Generation and composition of medical wastes from private medical microbiology laboratories. Waste Manag. 2017, 61, 539–546. [Google Scholar] [CrossRef] [PubMed]
- Al-Khatib, I.A. Medical waste management practices in a Palestinian District hospitals, Palestine. In Proceedings of the International Conference on Agriculture, Environment and Biological Sciences (ICFAE’14), Antalya, Turkey, 4–5 June 2014; pp. 34–36. [Google Scholar]
- Birpınar, M.E.; Bilgili, M.S.; Erdoğan, T. Medical waste management in Turkey: A case study of Istanbul. Waste Manag. 2009, 29, 445–448. [Google Scholar] [CrossRef] [PubMed]
- Mbarki, A.; Kabbachi, B.; Ezaidi, A.; Benssaou, M. Medical waste management: A case Study of the Souss-Massa-Drâa Region, Morocco. J. Environ. Prot. 2013, 4, 914–919. [Google Scholar] [CrossRef]
- Ministry of Environmental Protection of the People’s Republic of China. Annual Report on Environmental Prevention and Control of Solid Waste Pollution in Large and Medium-Sized Cities in China in 2016. 2016. Available online: http://www.mee.gov.cn/gkml/sthjbgw/qt/201611/t20161122_368001.htm (accessed on 10 November 2017).
- Beijing Municipal Commission of Health and Family Planning. Beijing Municipal Health and Family Planning Development Statistical Bulletin in 2015. 2016. Available online: http://www.phic.org.cn/tonjixinxi/weishengtongjigongbao/201603/t20160325_134342.htm (accessed on 11 November 2017).
- The Environmental Protection Administration of the People’s Republic of China. Regulations on Special Packing, Vessel Standard and Warning Sign for Medical Waste. UNCED NO:188. 2003. Available online: http://www.zhb.gov.cn/gkml/zj/wj/200910/t20091022_172239.htm (accessed on 5 May 2018).
- He, Z.G.; Li, Q.; Fang, J. The solutions and recommendations for logistics problems in the collection of medical waste in China. Procedia Environ. Sci. 2016, 31, 447–456. [Google Scholar] [CrossRef]
- Ananth, A.P.; Prashanthini, V.; Visvanathan, C. Healthcare waste management in Asia. Waste Manag. 2010, 30, 154–161. [Google Scholar] [CrossRef] [PubMed]
- Geng, Y.; Ren, W.X.; Xue, B.; Fujita, T.; Xi, F.M.; Liu, Y.; Wang, M.L. Regional medical waste management in China: A case study of Shenyang. J. Mater. Cycles Waste Manag. 2013, 15, 310–320. [Google Scholar] [CrossRef]
- Chen, Y. Studies on Optimized Medical Waste Disposal Technology and Management Model for China. Ph.D. Thesis, Institute of Applied Ecology, Chinese Academy of Sciences, Shenyang, China, 2009; p. 25. (In Chinese). [Google Scholar]
- Charges Standard for Disposal of Medical Waste, Pricing Documents of the Beijing Municipal Commission of Development and Reform. Beijing Price (Charge). No. 303. 2003. Available online: http://www.bjpc.gov.cn/cxfw/jgsfcx/ylfwjg/201208/t9779282.htm (accessed on 12 June 2018).
- Price Adjustment Formula of Beijing’s GaoAnTun Medical Waste Disposal Plant, Beijing Municipal Commission of Development and Reform. No. 771. 2011. Available online: http://www.bjpc.gov.cn/cxfw/jgsfcx/ylfwjg/201208/t9779282.htm (accessed on 12 June 2018).
- Disposal Cost of Medical Waste at Beijing GaoAnTun Medical Waste Disposal Plant, Beijing Municipal Commission of Development and Reform. No. 2137. 2014. Available online: http://www.bjpc.gov.cn/cxfw/jgsfcx/ylfwjg/201208/t9779282.htm (accessed on 12 June 2018).
- Charges Standard for Sanitation, Pricing Documents of the Beijing Municipal Commission of Development and Reform. Beijing Municipal Commission of Development and Reform. No. 2662. 2013. Available online: http://www.bjpc.gov.cn/cxfw/jgsfcx/jzjg/201208/t9779300.htm (accessed on 12 June 2018).
- China Renewable Resources Price Index. Available online: http://www.crrainfo.org/ (accessed on 15 June 2018).
Figure 1.
Medical waste recycling business model.

Figure 2.
Mixed simulation model.

Figure 3.
Classification simulation model 1.

Figure 4.
Classification simulation model 2.

Figure 5.
Mixed model simulation results.

Figure 6.
Model 1 simulation results.

Figure 7.
Model 2 simulation results.

Figure 8.
Cost–benefit comparison analysis.


Table 1.
The classification of medical waste [2].
Table 1.
The classification of medical waste [2].
| Waste Category | Characteristics | Name and Composition of Waste |
|---|---|---|
| Infectious | Medical waste that easily causes infectious diseases. | It includes objects contaminated by patients’ blood, body fluids, and excretions; discarded medical specimens; disposable hygiene products; etc. |
| Pathological | Human tissues and animal carcasses generated during diagnosis. | It includes human tissues, organs, animals in medical experiments, the pathological section, etc. |
| Injured | Sharp medical waste that can easily stab or cut the body. | Needles, blades, glass tubes, slides, ampoules, etc. |
| Drug-induced | Medicines that are outdated, obsolete, spoiled, or contaminated. | Drugs, vaccines, etc. that are discarded or metamorphic. |
| Chemical | Chemical wastes that have toxic, corrosive, flammable, explosive, and other properties. | Chemical reagents, discarded contrast agents, chemical disinfectants, etc. |
| Recyclable | Waste that is not seriously polluted and can be recycled. | Infusion bottles, paper packaging, needles, scalpels, and other plastic, metal, paper, and glass. |
| Domestic | Uncontaminated ordinary rubbish produced by medical staff and patients. | Food waste, common household goods, etc. |
Table 2.
Waste comparison table of output/generation rate.
| Medical Waste Model | Recyclable Medical Waste (Tons/%) | Nonrecyclable Medical Waste (Tons/%) | Domestic Waste (Tons/%) |
|---|---|---|---|
| Mixed model | 12,019/40.06% | 17,981/59.94% | 0 |
| Classification model 1 | 12,239/40.8% | 9329/31.1% | 8432/28.1% |
| Classification model 2 | 21,223/70.74% | 8777/29.25% | 0 |
Table 3.
Waste disposal cost.
| Medical Waste Model | Nonrecyclable Medical Waste (CNY) | Domestic Waste (CNY) | Waste Disposal Fee (Total) (CNY) |
|---|---|---|---|
| Mixed model | 51,659,413 | 0 | 51,659,413 |
| Classification model 1 | 26,802,217 | 1,913,600 | 28,715,817 |
| Classification model 2 | 25,216,321 | 0 | 25,216,321 |
Table 4.
The quantity of all kinds of recyclable waste.
| Medical Waste Model | Glasses (Tons) | Paper (Tons) | Plastics (Tons) | Metals (Tons) | Disposable Materials (Tons) |
|---|---|---|---|---|---|
| Mixed model | 3701 | 0 | 7453 | 865 | 0 |
| Classification model 1 | 5188 | 0 | 0 | 0 | 7051 |
| Classification model 2 | 8149 | 6628 | 5347 | 1099 | 0 |
Table 5.
Recycling revenues of medical waste.
| Medical Waste Model | Glasses (CNY) | Paper (CNY) | Plastics (CNY) | Metals (CNY) | Earnings (Total) (CNY) |
|---|---|---|---|---|---|
| Mixed model | 1,665,450 | 0 | 52,171,000 | 1,926,355 | 55,762,805 |
| Classification model 1 | 2,334,600 | 5,311,980 | 30,597,000 | 1,100,138 | 39,343,718 |
| Classification model 2 | 3,667,050 | 16,106,040 | 37,429,000 | 2,447,473 | 59,649,563 |
© 2018 by the authors. Licensee MDPI, Basel, Switzerland. This article is an open access article distributed under the terms and conditions of the Creative Commons Attribution (CC BY) license (http://creativecommons.org/licenses/by/4.0/).
Share and Cite
MDPI and ACS Style
Liu, H.; Yao, Z. Research on Mixed and Classification Simulation Models of Medical Waste—A Case Study in Beijing, China. Sustainability 2018, 10, 4226. https://0-doi-org.brum.beds.ac.uk/10.3390/su10114226
AMA Style
Liu H, Yao Z. Research on Mixed and Classification Simulation Models of Medical Waste—A Case Study in Beijing, China. Sustainability. 2018; 10(11):4226. https://0-doi-org.brum.beds.ac.uk/10.3390/su10114226
Chicago/Turabian StyleLiu, Hao, and Zhong Yao. 2018. "Research on Mixed and Classification Simulation Models of Medical Waste—A Case Study in Beijing, China" Sustainability 10, no. 11: 4226. https://0-doi-org.brum.beds.ac.uk/10.3390/su10114226
Note that from the first issue of 2016, this journal uses article numbers instead of page numbers. See further details here.