Understanding Travelers’ Behavior for Sustainable Smart Tourism: A Technology Readiness Perspective


1
Royal Institute for Tourism and Hospitality, Tourism Council of Bhutan, 1147 Kawang, Dajo (Upper Motithang), 1147 Thimphu, Bhutan
2
Interdisciplinary Graduate Program in IT Law, Dankook University, 152 Jukjeon-ro, Suji-gu, 16890 Yongin-si, Gyeonggi-do 448-701, Korea
3
Department of Convergent Security, Dankook University, 152 Jukjeon-ro, Suji-gu, 16890 Yongin-si, Gyeonggi-do 448-701, Korea
*
Author to whom correspondence should be addressed.
Sustainability 2018, 10(11), 4259; https://0-doi-org.brum.beds.ac.uk/10.3390/su10114259
Submission received: 23 October 2018
/
Revised: 14 November 2018
/
Accepted: 15 November 2018
/
Published: 18 November 2018
(This article belongs to the Special Issue Business Model Innovation for Sustainability. Highlights from the Tourism and Hospitality Industry)
Abstract
:Smart tourism has contributed to making people’s travels easier and more enjoyable, but sometimes has a negative impact on their travel experience. The challenges travelers face while using smart devices have not been researched in detail and are relatively unknown. While most studies have considered the usefulness of smart devices in tourism, negative perceptions of smart tourism have rarely been discussed. Thus, this study investigates travelers’ risk perceptions of smart tourism from a technology readiness perspective. It examines the impact of optimism, innovativeness, insecurity, and discomfort on travelers’ usage intentions of smart devices through their perceived risks and benefits. To test the proposed model and corresponding hypotheses, a partial least squares analysis was performed on data collected from 250 survey respondents. The results showed that the perceived benefits of smart devices had a significant effect on usage intentions of smart devices while traveling. It was also confirmed that the influence of perceived risks depends on the characteristics of travelers. This study is significant as it is the first empirical study applying the TRI (Technology Readiness Index) model that examines the negative effects of smart devices on tourists during travel. The results of this study provide meaningful insights into smart tourism to companies and governments.
1. Introduction
Tourism is experiencing momentous change in operational approaches and processes with the introduction of online businesses through information and communication technology (ICT) [1]. Various tourism facilities are founded on ICT infrastructure and systems capabilities to provide an amazing traveler experience and to sustain market competition. In addition, new services (e.g., AirBnB, Uber, Velocity, Hotels.com, and Google Trips) have been developed to help smart travel and these have caused the behavior of travelers to evolve.
Smart tourism is “the ubiquitous tour information service received by tourists during a touring process” [2]. Smart devices (e.g., smartphones and tablet PCs) in smart tourism have contributed to making people’s travel easier and more enjoyable [3]. Smart devices help tourists acquire necessary information, save costs, and ensure their safety; these benefits are achieved with greater flexibility and a more personalized itinerary through smart devices [4]. Buhalis and Amaranggana [5] argued that information communication technologies like smart devices not only affect travel satisfaction but also affect life satisfaction. Smart devices have become essential tools in determining the quality of travel [6].
Tourism studies have mainly discussed the devices’ positive role in enhancing travel experiences, as their benefits in tourism are well understood. Tourists are often required to search for extensive information, compare prices, and book through relatively inaccessible mobile systems. Unexpected errors or inconveniences can occur during this process. Tourists may be worried about privacy because personal information can be accessed when using smart tourism services. These challenges, which travelers face while using smart devices, have not been researched in detail and are relatively unknown. Buhalis and Amaranggana [5] have investigated the negative experiences of ICT-based tourism, and results from interviews with technology-savvy tourists have identified various factors (e.g., navigation, security concerns, and poor broadband connections) that negatively impact the tourism experience. Park and Tussyadiah [7] examined the types of perceived risk in mobile travel booking and identified ways to influence the mobile booking behavior of tourists. However, no research exists that provides a balanced and comprehensive view of this negative perception, and there is a lack of empirical studies on the impact these negative factors have on the use of smart devices during travel. Furthermore, although negative perceptions of using smart devices may be very different depending on the characteristics of the travelers, the existing studies are insufficient for this discussion.
Thus, this study examines the negative perceptions of smart-device usage in smart tourism and explores users’ adaptability to smart technology. On the basis of the technology readiness model, this study builds a research model that includes positive and negative factors—which may differ depending on the travelers’ characteristics—and empirically tests how these factors affect the use of smart devices during travel. The technology readiness theory can explain an individual’s attitude and acceptance of new technology [8]. Thus, this study’s research model will show how tourists perceive smart technology in tourism. The main objective is to explore the characteristics of travelers that influence smart-device utilization and resistance in travel. This study is both significant and useful for the telecom industry, smart-device manufacturing companies, and tourism stakeholders as the incorporation of suitable new features into smart devices, and the creation of new services and products can promote the use of smart devices and make travel more enjoyable.
2. Literature Review
2.1. Smart Tourism
Smart tourism is considered to be a rational development from old-style tourism and e-tourism, featuring the extensive use of ICT [9,10]. Buhalis and Amaranggana [11] suggested that the smart tourism concept began with the growth of smart cities around the world and widespread internet connectivity. Smart tourism is the latest conceptual trend in tourism, both in theoretical and practical approaches. Wang et al. [4] defined smart tourism as an “ICT-integrated tourism platform”, integrating tourism services and the use of ICT, such as artificial intelligence, the Internet of Things (IoT) and cloud computing. According to Li et al. [2], smart tourism is defined as the receipt of ubiquitous traveling process information by tourists with individual requirements through any kind of medium. The incorporation of new and better technologies to improve the overall functioning of the tourism sector is taken as given, since information technology (IT) is dynamic in its evolution and soon becomes outdated. Therefore, keeping up with the changes in technology is the primary focus of tourism stakeholders, including travelers.
The growth of the internet and various technologies have helped the smart tourism industry evolve [2,12]. Recently, efforts have been made to utilize big data and augmented reality (AR) technology for smart tourism. Big data analysis is used to support traveler decision-making, establish tourism branding strategies, and promote visitor participation [13]. Various AR projects are also underway to help travelers acquire cultural information and experience their travel through smart phone apps, smart pens, smart glasses, and smartphone apps [14,15]. Smart tourism began with the development of smart cities, smart payments, and the use of smart devices. Smart tourism has brought modifications in tourist demands and behavior patterns [16]. The information required by tourists today is easily accessible via internet websites, short message services (SMS), portable devices, wearable devices, or the ubiquitous tour information services [2,17]. Acquiring ubiquitous information prepares a tourist both physically and mentally before reaching the desired destination. The main objective of using the smart tourism concept is to provide maximum tourist satisfaction and to help manage resources efficiently and effectively.
Market trends have transformed the approach to doing business in the tourism industry. Marketing in tourism has undergone immeasurable innovations through the concept of smart tourism. That concept has made tourism marketing possible anywhere and anytime, reaching out to millions of customers in the target market segment with the single click of a mouse [9]. For instance, Dubai is promoting the city with ”Smart Dubai”, a city image that enables smart travel based on the Smart City [18]. Smart tourism can be understood as comprising the tourism marketing industry, which is characterized by an interactive flow of information among stakeholders, such as tourists and tourism enterprises [2].
However, there has been insufficient research conducted on smart tourism for various academic and practical discussions [19]. The research has mainly focused on the perspective of tourism destinations, entertainment, hotels, deployment of complex technology platforms, and technology-related challenges. New discussions related to emerging technologies, such as social media and big data, have begun [20,21]. However, tourist behaviors in smart tourism have not been fully examined. Furthermore, there is no research on users’ perception of the negative effects of using smart devices during travel. Sensitive information, such as payment and location information, can be leaked while using a smart device in a foreign destination [5,22] and unwanted records, like digital footprints, can be stored depending on service usage [9]. As travelers become increasingly dependent on smart devices, it has been pointed out that they cannot enjoy their travels [5]. For those unfamiliar with smart devices, providing a smart service may have a negative impact on travel quality or satisfaction [9]. Therefore, there is a need to study tourists’ use of smart devices while traveling to understand their behavior and the perceived benefits and risks related to their use of smart devices. Such devices have become essential items, and their ubiquitous nature makes them a vital necessity for today’s smart travelers. Identifying the benefits and risks accompanying smart-device use offers important insights into tourist behavior vis-à-vis the use of smartphones while traveling. Through such studies, tourism stakeholders, the telecom industry, smart tourism stakeholders (hoteliers, transport companies, restaurants, and tour agents), and governments can develop suitable services to meet tourists’ needs and desires.
2.2. Benefits and Risks of Smart Devices in Tourism
“Perceived value” is a multidimensional concept, influenced by benefits and risks, which has a very dynamic nature [23]. Perceived value is “the consumer’s overall assessment of the utility of a product (or service) based on perceptions of what is received and what is given” [24]. It is a broader and richer trade-off between perceived benefits and perceived costs [25]. Perceived value can be measured using a one-dimensional [26] or a multidimensional measure [27]. It is considered a better predictor of behavioral intentions than satisfaction or quality are [28,29]. Thus, perceived value can explain a smart device’s value under the conditions of benefit and risk for a tourist while traveling. In smart tourism research, various scholars have used the perceived value theory perspective to discuss the perceived benefit factors (e.g., [17,30]). However, there are very few studies discussing perceived risks in smart tourism [5,31].
There are various benefits of using smart devices in tourism. Tourists using smart devices can access information through the internet in the search for further details, the best prices, and alternative tour packages. With smart devices, tourists can be better informed even while on the move [32]. Tourists undergo three phases in the touristic experience: the anticipatory, the experiential, and the reflective [33]. In all these phases, tourists use smart devices to search for information, plan, make reservations, shop, dine, share moments, and reflect on memories, using a range of media [34]. These activities, through the use of ICT and smart tourism, have helped to make the tourist experience more fascinating and pleasurable. In addition, smart devices can provide tourists with the virtual reality of a destination or attraction, thus preparing them psychologically for the destination [2]. This psychological preparation facilitates tourists’ decision-making about destinations and makes their experience more enjoyable. Tourists do not have to worry while on holiday about the hassle of pre-tour arrangements as these can be scheduled well before departure [2].
On the other hand, the risks from the use of smart devices in tourism have not been fully discussed. Only a few studies have argued that there are negative factors in the use of smart devices for tourism [35]. Wang and Wang [31] showed that technological effort and perceived risks can affect the perceived value and usage intentions of online hotel reservations. Buhalis and Amaranggana [5] argued that navigation issues, security concerns, and poor broadband connectivity can be risk factors negatively affecting the tourist experience. Park and Tussyadiah [7] showed that perceived risk of smart devices empirically affect perceived usefulness, attitude, and behavioral intention in mobile travel booking. However, the risks vary depending on the user. Those who are familiar with smart devices may enjoy a variety of benefits that those unfamiliar with them cannot.
2.3. Technology Readiness Index (TRI)
Parasuraman [36] developed the technology readiness model, noting that technology plays a significant part in service marketing. The Technology Readiness Index (TRI) measures an individual’s readiness to accept and use new technologies [37]. The model indicates people’s attitudes and feelings toward new technologies. It does not indicate a person’s competence in using a technology but their acceptance of it [8]. A multifaceted concept, the TRI uses two factor components: motivators, or drivers, of new technology use and inhibitors [37]. It can help in analyzing the benefits and risks of smart-device use by tourists while traveling.
Parasuraman and Colby [38] suggested four dimensions to the TRI through extensive empirical investigations. The first dimension is optimism. This is the belief in flexible control and efficiency in life due to a positive view of technology. The second is innovativeness, which is the tendency to be the first user of new technologies. The third is insecurity, which arises as a result of privacy concerns and a mistrust of technology. The fourth is discomfort, which is the result of an urge to control and a sense of being overwhelmed. The four dimensions explain individual’s mental readiness to accept new technologies. Optimism and innovativeness are enablers of new technology use, whereas discomfort and insecurity are inhibitors [39].
TRI has been used to understand the technology readiness of tourist and explain the adoption behavior of new ICT service in tourism. Victorino et al. [40] used the TRI to improve the effectiveness of hotel customer profiling and for market segmentation, as TRI was found to be a useful segmentation tool. It helped managers to form segments with particular attitudes toward demographic characteristics and technology usage patterns, making it possible to provide services according to the needs and preferences of different segments on the basis of their comfort with technology. Verma et al. [41] found that hotel guests with high TRI scores were relatively young and likely to patronize upscale hotels. Thus, TRI can help hoteliers to differentiate their hotels using technology, in light of the response to high-tech innovations that will be received from their target guest segments.
Studies on tourist behavior based on TRI have been mainly focused on self-service technologies (see Table 1). Research currently has been on the rise due to the emergence of innovative technologies such as mobile applications and AR for tourism. For instance, Chung, Han, and Joun [39] have used the TRI model to determine the readiness of state of mind for the use of augmented reality (AR) in heritage sites, and to determine whether AR will help to motivate a tourist to visit a destination. However, most of the existing studies have considered TR as a personal trait but have not discussed other personal factors together. As a result, the significance of TR has been confirmed, but it was limited to a discussion of the difference in influence according to individual characteristics.
3. Research Model and Hypothesis
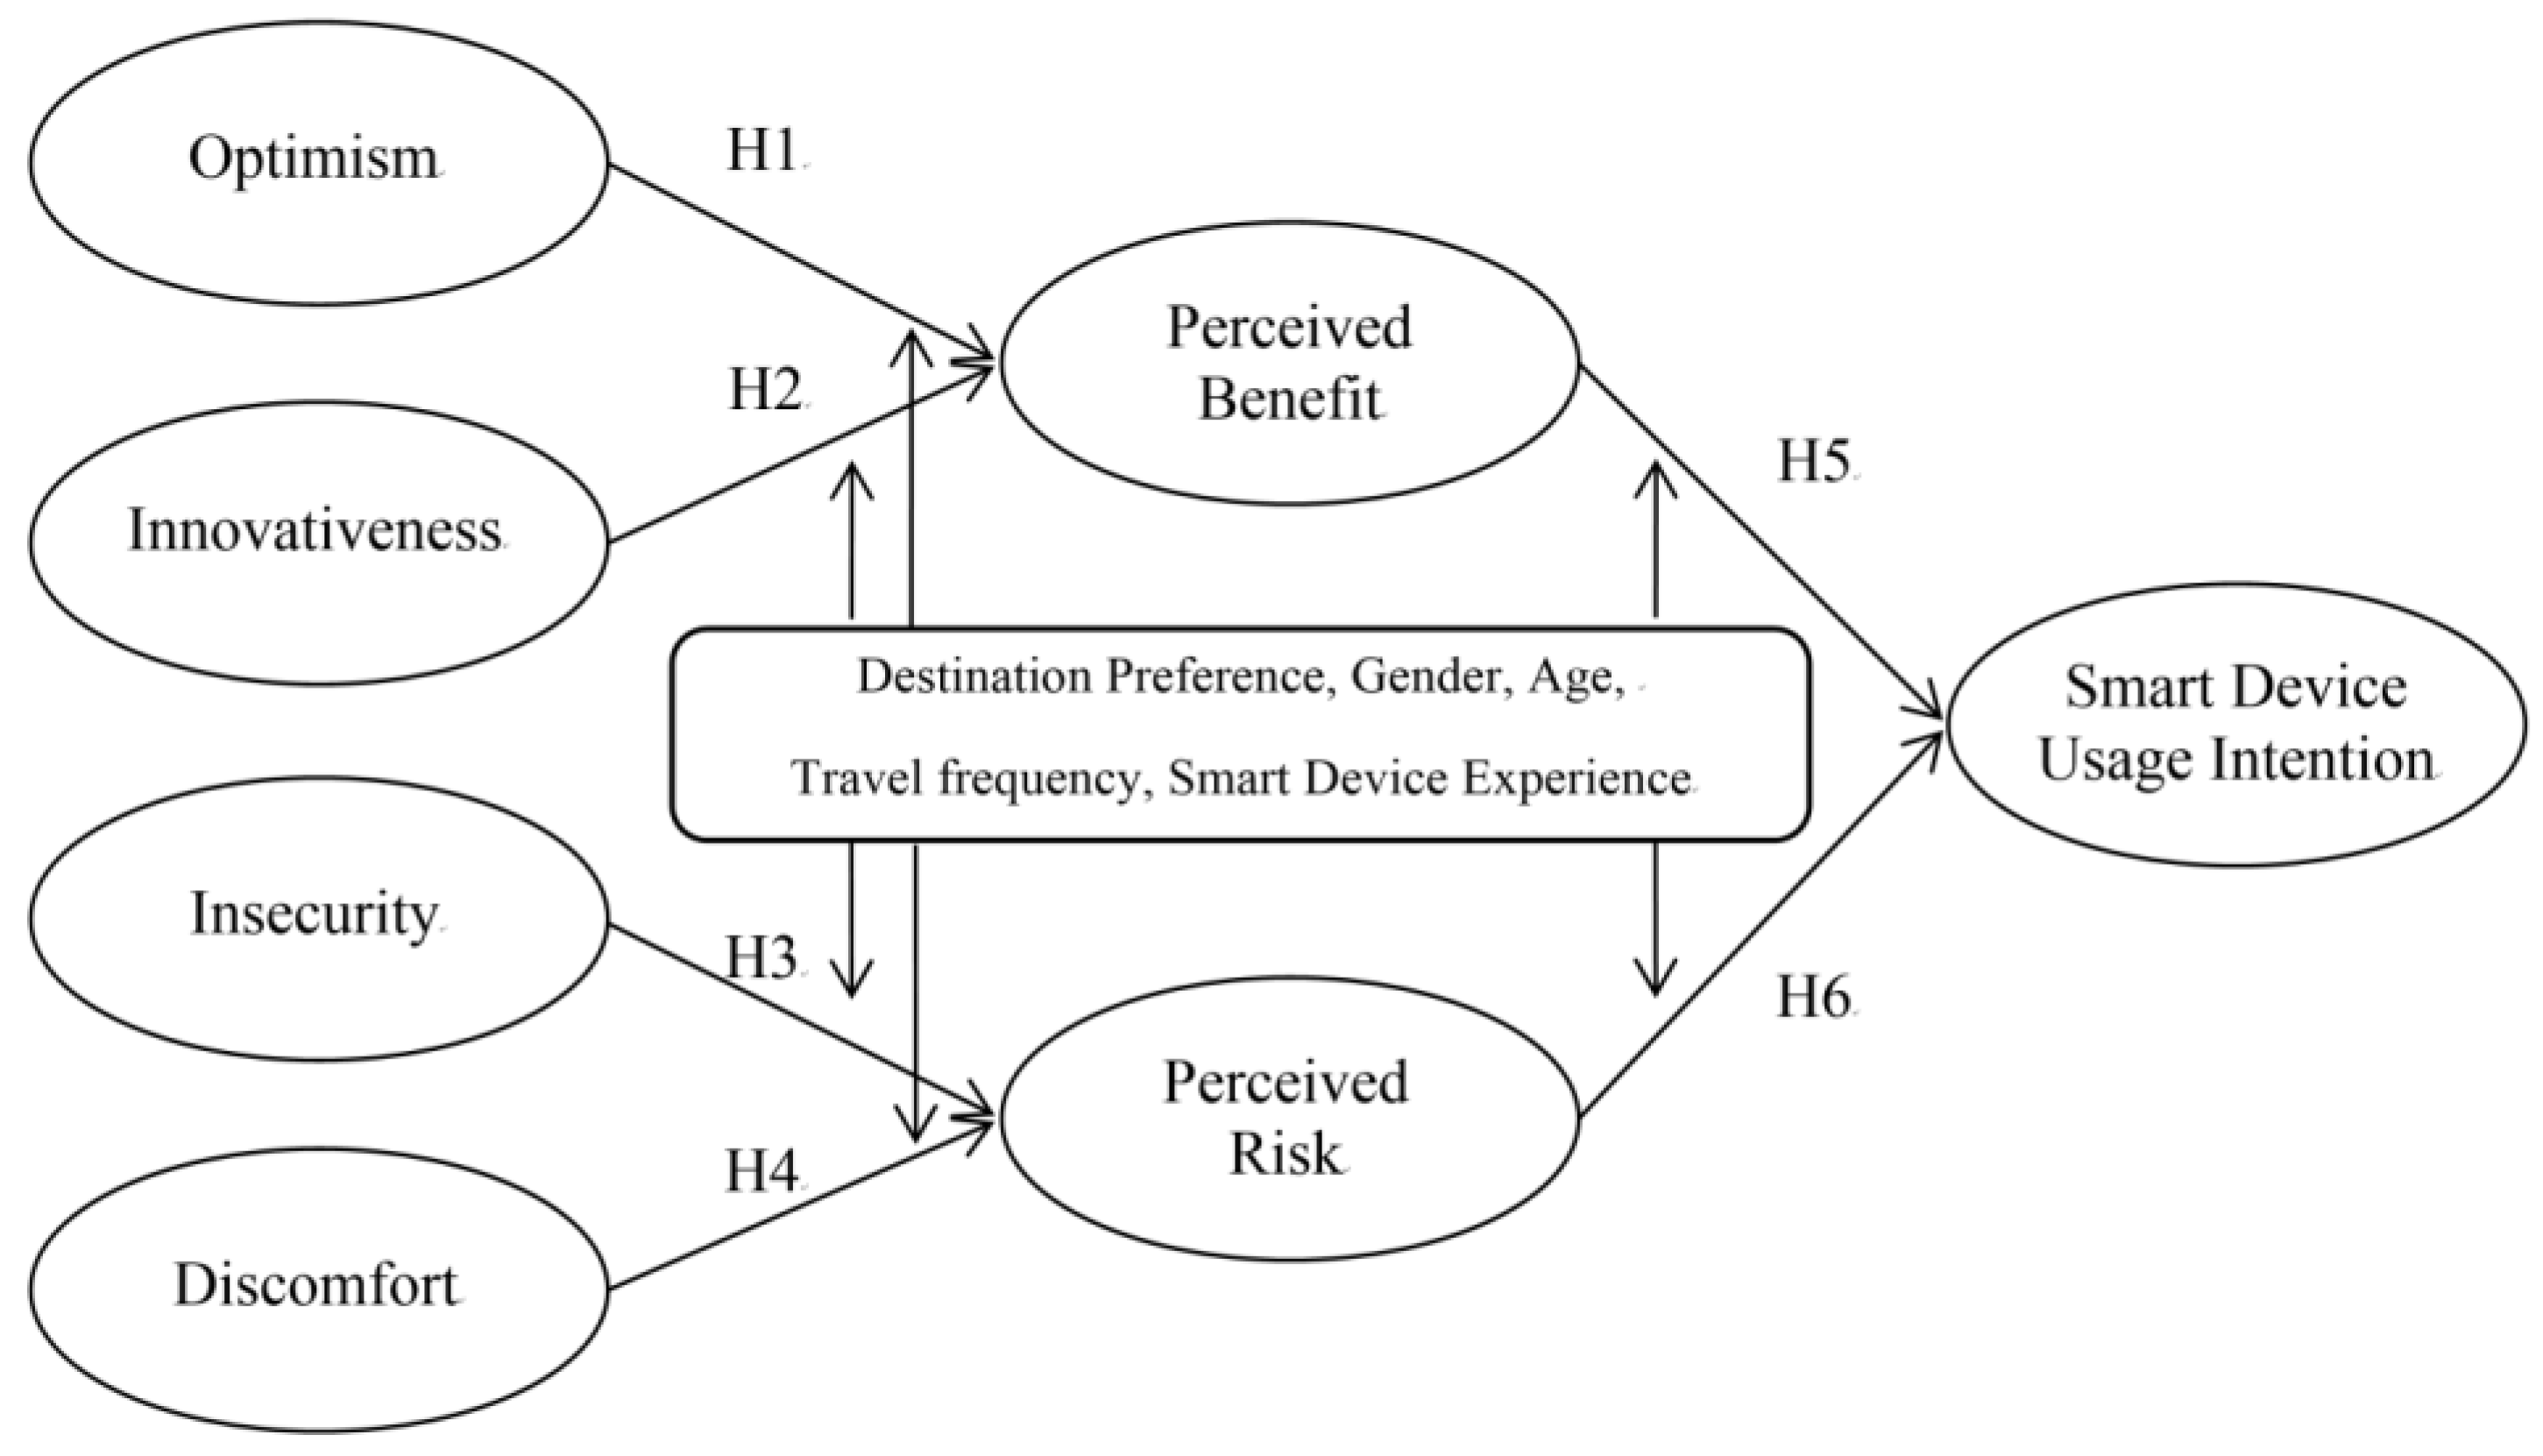
This study proposes a research model (Figure 1) incorporating TRI and perceived value theory to analyze the perceived benefits and perceived risks from the use of smart devices by tourists while traveling. There are four dimensions in the TRI: two positive and two negative. The research model examines how these four dimensions affect perceived benefits and risks, which may influence smart-device usage intention while traveling. As the effect of perceived benefits and risks on usage intention may differ, personal differences, such as age, gender, and tour frequency, are considered as the moderating factors between them.
Optimism is “the tendency to believe that one will generally experience good versus bad outcomes in life” [48]. The optimist accepts the challenge of using new smart devices while traveling and makes efficient use of them. The optimist also considers smart devices to be more convenient, offering the user greater mobility while traveling. Optimism leads to constructive attitudes and feelings toward smart devices. Hence, we assume that an optimist perceives a smart device as a beneficial as well as a convenient device to be used by tourists and that there is no need to be apprehensive about any negative outcomes [8].
Hypothesis 1 (H1).
Optimism is positively associated with the perceived benefits of smart devices for travel.
Innovativeness is “the degree to which an individual or other unit of adoption is relatively earlier in adopting new ideas than other members of a social system” [49]. Midgley and Dowling [50] also defined it as the “willingness of an individual to try out any new information technology.” Given these two definitions, the acceptance level of smart devices by tourists can be analyzed. If acceptance of and adaptability to smart devices are high, then, innovativeness is positively linked with perceived benefits.
Hypothesis 2 (H2).
Innovativeness is positively associated with the perceived benefits of smart devices for travel.
According to Kwon and Chidambaram [51], some individuals do not use new technology or smart devices because of their innate fear of new smart devices/technology. This fear leads individuals to refrain from using the perceived benefits of smart devices for travel. Personal security and privacy are some of the challenges that discourage people from using smart devices while traveling [17]. Smart devices can be easily tracked and can intrude on the privacy of travelers [52]. Some tourists like to travel in an undisturbed manner. This can result in personal insecurity to be positively related to perceived risks.
Hypothesis 3 (H3).
Insecurity is positively associated with the perceived risks of smart devices for travel.
Discomfort refers to “a perceived lack of control over technology and a feeling of being overwhelmed by it” [36]. Smart devices are not easy for everyone to use because they provide various and complex functions. Therefore, for those who are not familiar with the use of smart devices, there may be a risk of misuse. Sometimes there is a risk of loss or damage. Such personal discomfort can be the reason for tourists not using smart devices during travel. Therefore, personal discomfort is positively associated with the perceived risk of smart devices.
Hypothesis 4 (H4).
Discomfort is positively associated with perceived risk of smart devices for travel.
Previous studies have shown that perceived benefits are positively associated with the intention to use smart devices during travel. Perceived benefits refers to the positive consequences perceived as having been caused by specific actions [53]. It is an individual’s motive to perform a behavior or adopt an intervention. Smart devices are ubiquitous and provide travelers with positive benefits in communicating, booking online, searching for information, locating, documenting, and sharing experiences, and on-site decision-making [54]. Therefore, the perceived benefits of smart devices are positively associated with the intention to use smart devices while traveling.
Hypothesis 5 (H5).
The perceived benefits of smart devices are positively associated with the intention to use smart devices while traveling.
Gidron [55] defined perceived risk as an “individual’s subjective evaluation of his or her risk of an adverse outcome.” Using smart devices also brings risks, such as safety, security, bugging, and privacy issues [52]. Although the use of smart devices has perceived risks, they are outweighed by the perceived benefits. Therefore, the perceived risks of smart devices are negatively associated with the intention to use smart devices.
Hypothesis 6 (H6).
The perceived risks of smart devices are negatively associated with the intention to use smart devices while traveling.
Differences in age, gender, or tour type can affect the use of smart devices even when they are perceived as a benefit. Young people use smart devices to listen to music, share photos, search for information, and chat, among other things, whereas older people will mostly use them to communicate. Smart-device use will also depend on the tour type, such as business, leisure, or family holiday. If the tour type is a business trip, individuals will be busy with work, which may hamper the use of smart devices. If the tour is a leisure trip, individuals are more likely to want to share photos and chat with their families and friends. However, age is also a determinant; an adult is more likely to want their own privacy. The younger generation may not have a fear of the perceived risks of smart devices while traveling, whereas older people may not want to experience any of the perceived risks while traveling. Therefore, the effect of perceived risks is moderated by gender, age, and tour type or frequency.
Hypothesis 7 (H7).
The effect of perceived benefits and risks on the intention to use smart devices while traveling is moderated by tour type, gender, age, travel frequency, and smart-device experience.
4. Research Methodology
4.1. Research Procedure
A survey method was used to collect the research data. Data collection was accomplished using Open Survey in the second week of May 2017. Open Survey is the dominant mobile research provider in the Republic of Korea. The company collects research data through a smartphone application, which is especially suitable for this study. The survey company randomly selected respondents from the member database. A reward of about $2.00 had been paid to respondents for their honest responses. The questionnaire contained thirty-seven (37) questions, including demographic questions. The PLS-SEM (partial least squares-structural equation modeling) technique was applied to evaluate the measurement and structural model. PLS-SEM is a powerful multivariate technique that evaluates both measurement and structural models simultaneously in an optimal approach [56]. The structural equation model is divided into (covariance-based) CB-SEM and PLS-SEM. CB-SEM is used to identify systematic relationships among multivariate variables that can be empirically verified. It also focuses on how well the proposed theoretical model can be estimated from the covariance [57]. On the other hand, PLS-SEM is a technique that focuses on explaining and predicting dependent variables and is more suitable for theory development or exploratory study. PLS-SEM can be effectively applied to a small sample size and a complex model, and makes no assumptions about the distribution of the sample [57]. The proposed research model in this study focuses on the effect of TRI variables on the mediators rather than the overall relationship between all of the variables. As the number of samples is also relatively small, this study applied PLS-SEM to the analysis. Internal consistency reliability, convergent validity, and discriminant validity were assessed. The goodness-of-fit (GoF) was checked for the overall fitness of the research model. This study uses self-reported data, and common method bias (CMB) was also confirmed. After this rigorous validation procedure, the research hypotheses were tested. All analytical procedures were conducted through Smart PLS 3.0 software.
4.2. Measurement Items
All measurement items for the seven constructs were developed on the basis of previous studies. The measurement model included 31 items for the latent constructs: optimism, innovativeness, insecurity, discomfort, perceived benefits, perceived risks, and smart-device usage intention. Items from research [39] were applied to develop constructs for optimism, innovativeness, and smart-device usage intention while traveling. The insecurity and discomfort items were adapted from Walczuch, Lemmink and Streukens [8]. Perceived benefits were developed on the basis of research by Kim et al. [58] and Lee [59]. The measurement items utilized to examine perceived benefits and risks were adapted from Kim et al. [60] and from Kim, Ferrin and Rao [58]. All items were modified to accommodate the context of our study and employed a 7-point Likert scale ranging from 1 (“strongly disagree”) to 7 (“strongly agree”). Table 2 shows the measurements of each construct.
4.3. Research Sample
A total of two hundred and fifty (250) responses were collected for analysis. Table 3 shows the demographic characteristics of the respondents. The participants consisted of 49.6% males and 50.4% females, with an even age distribution among its population. More than half (69.6%) of the respondents had a college or university-level education. Experience of using smart devices was evenly distributed. The highest proportion (34.8%) of respondents answered that they traveled once every six months, followed by travel once a year (28.8%). Most respondents (73.66%) preferred domestic travel.
5. Results
5.1. Measurement Model
An evaluation of the measurement model can be conducted by examining its reliability, convergent validity, and discriminant validity. Cronbach’s alpha, Dijkstra-Henseler’s rho (ρA), and composite reliability (CR) were tested to determine reliability. The recommended cut-off value of all reliability tests is 0.70 [61,62]. The minimum value of Cronbach’s alpha, ρA, and CR were 0.741, 0.750, and 0.840, respectively (see Table 3). For the convergent validity, Average Variance Extracted (AVE) and factor loadings of each construct were evaluated. The acceptable threshold of AVE is over 0.5 [63], and 0.60 is a preferred cut-off value for factor loading [64]. After discarding four items (INN1, INS4, DIS5, and PER 4), which had relatively low factor loading, AVE and loadings of the measurement model satisfied this standard (see Table 4).
Discriminant validity is shown when each measurement item correlates weakly with all other constructs. The square root of AVE, Hetero-Trait Mono-Trait Ratio (HTMT), and the cross-loading table help to evaluate the convergent validity of a measurement model. For the discriminant validity, the square root of AVE of each construct should be much higher than the correlation of other constructs, or cross-loading coefficients within the construct should be larger than coefficients of other constructs [65]. The HTMT ratio is an alternative way of checking the discriminant validity. It is recommended that the HTMT ratio be lower than 0.85 [61]. It was confirmed that the measurement model of this study satisfied all these criteria (see Table 5 and Table 6).
In order to test multicollinearity and common method bias (CMB), the full collinearity test was applied. Kock and Lynn [66] identify the full collinearity test as a new approach that captures the possibility of CMB in the PLS-SEM model analysis. The lateral collinearity value from the full collinearity test can indicate whether the research data has a CMB issue, while the vertical collinearity value can check the multicollinearity issue. Multicollinearity and CMB can be serious problems if the variance inflation factor (VIF) from the full collinearity test is higher than 3.3. In this study, the highest value of vertical collinearity was 2.022, and 1.435 was the maximum among lateral collinearity values. In addition, Harman’s single-factor analysis was conducted. No evidence of a CMB issue was found.
5.2. Structural Model
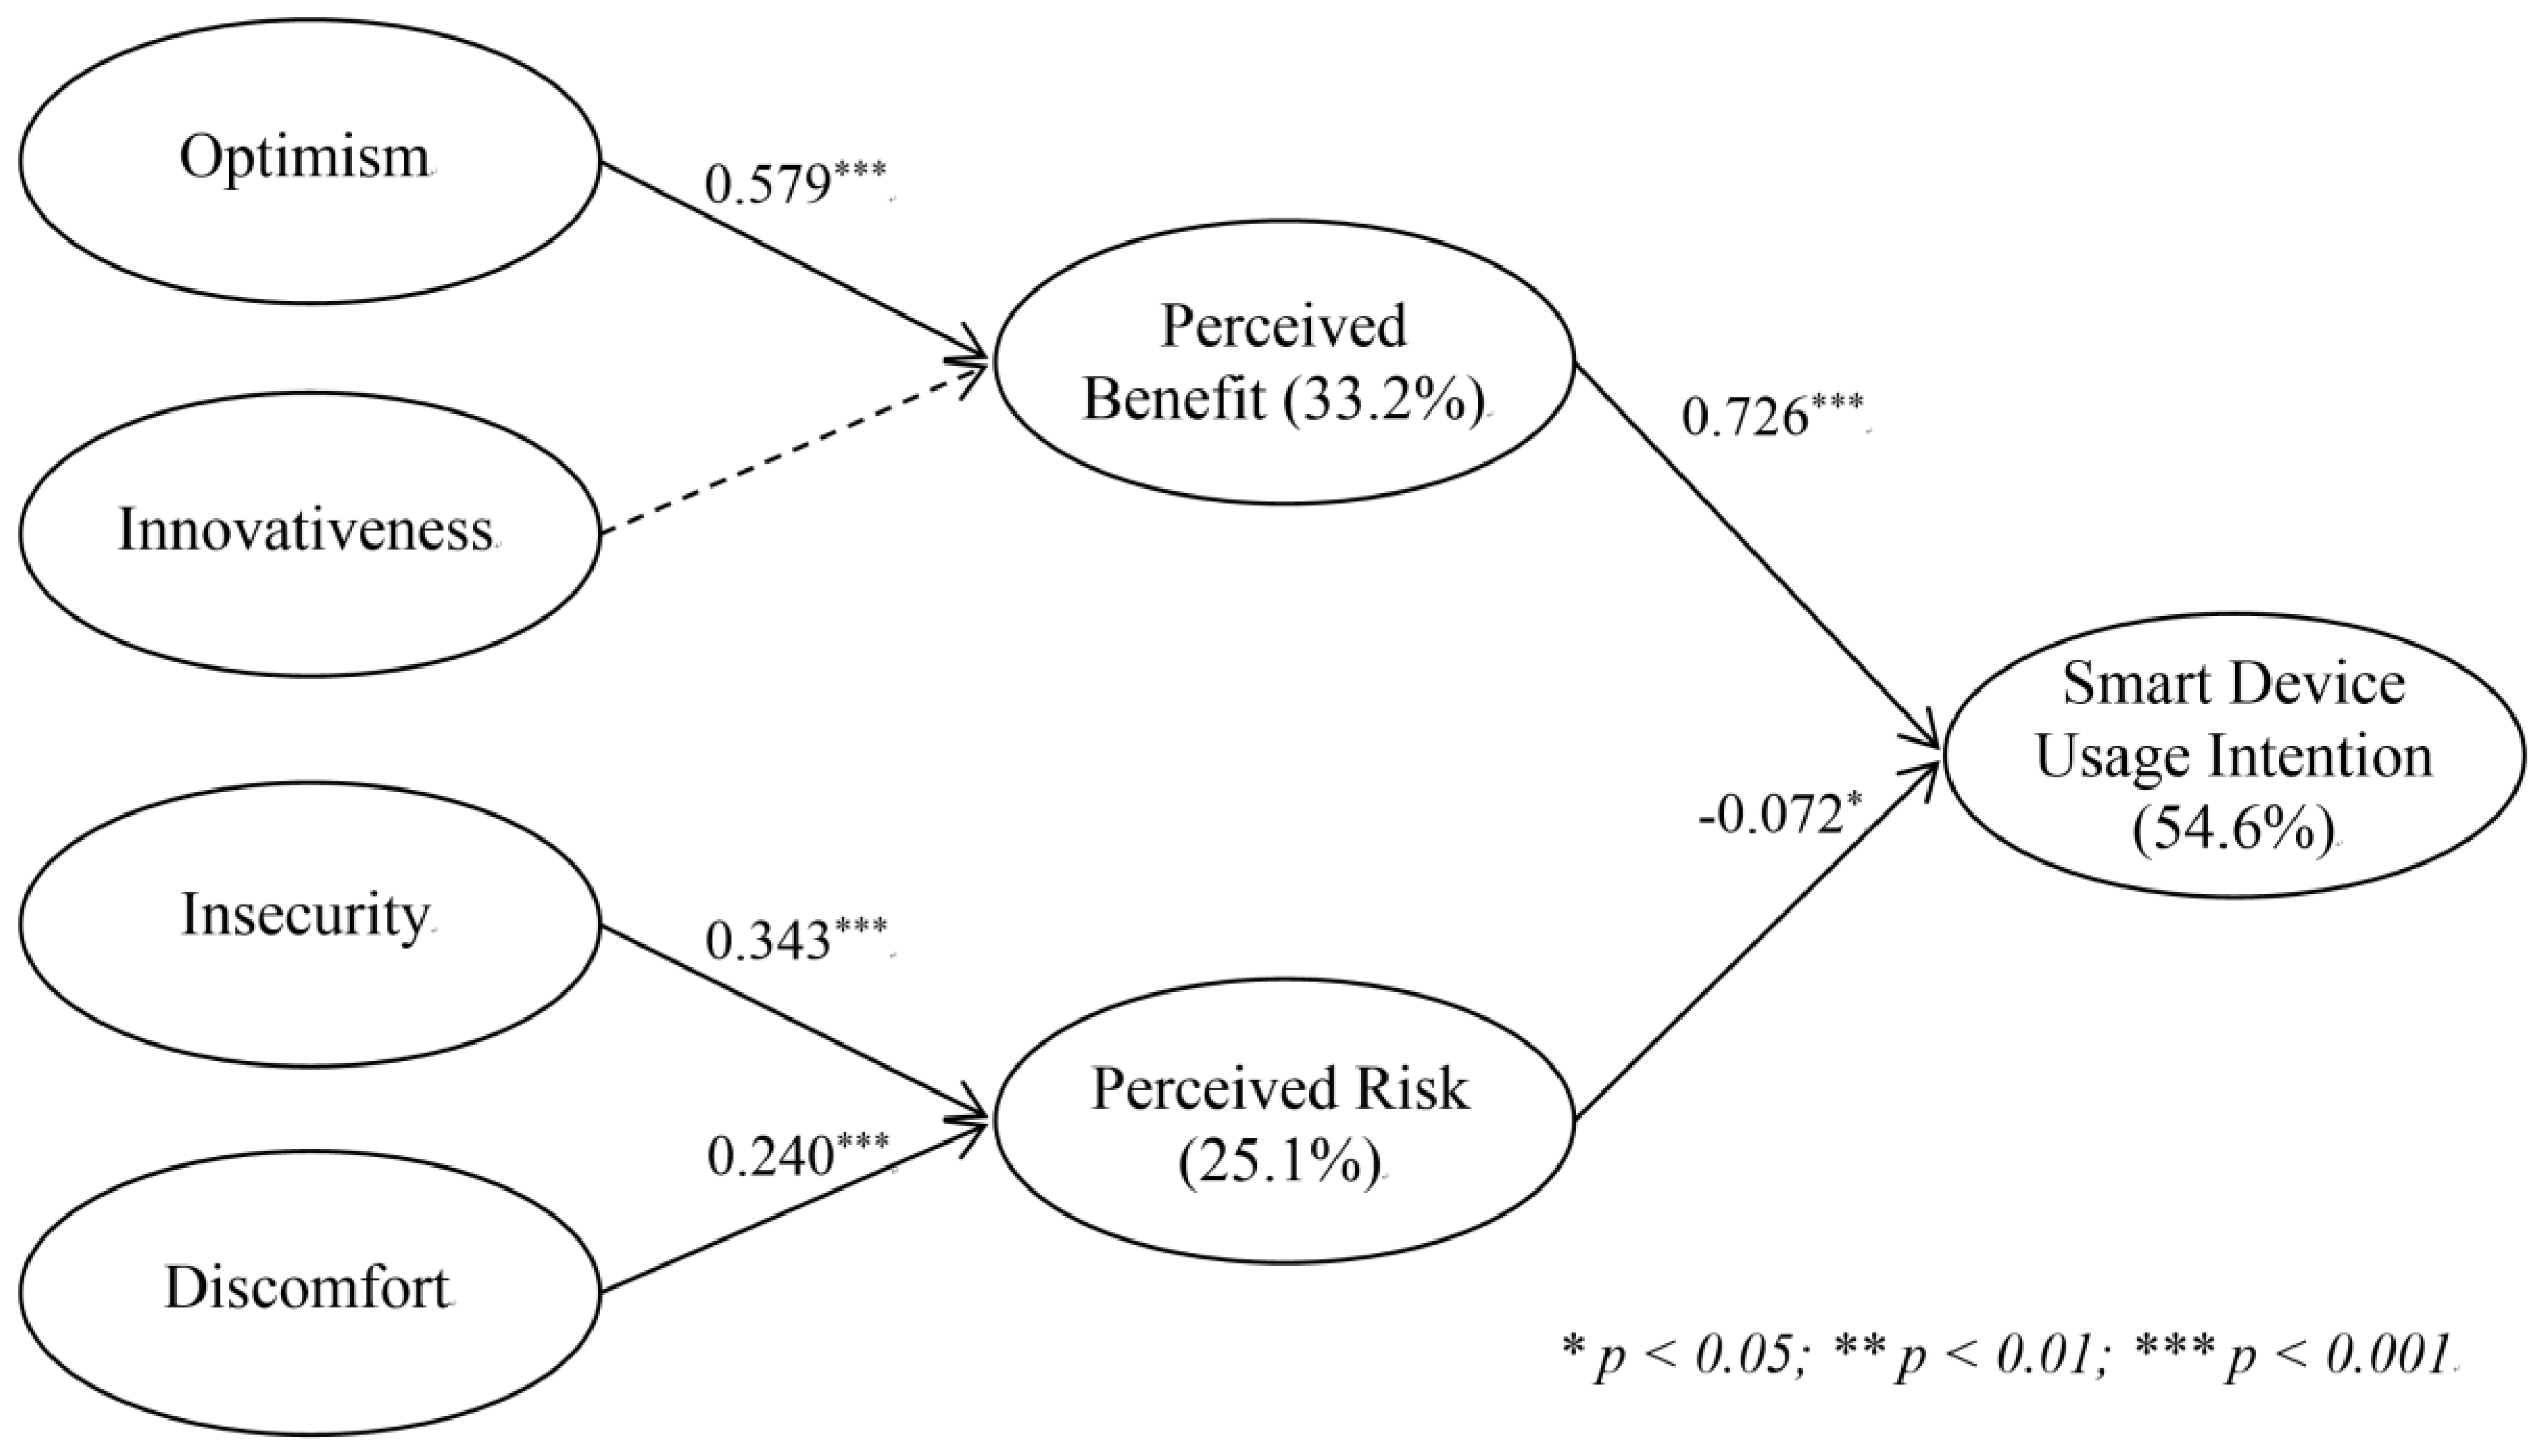
This study employed a bootstrapping technique in order to test the significance of the hypotheses. The structural model results are summarized in Figure 2. Of the six proposed hypotheses, five are supported. Optimism, insecurity, and discomfort are significant among the TRI constructs. Optimism has a significant positive impact on perceived benefits but not innovativeness (H1: β = 0.579, t-value = 9.754, p < 0.001; H2: β = −0.005, t-value = 0.086, not significant). Both insecurity and discomfort significantly affect perceived risks (H3: β = 0.343, t-value = 5.211, p < 0.001; H4: β = 0.240, t-value = 0.086, p < 0.001). Perceived benefits and perceived risks have significant impacts on smart-device usage intentions (H5: β = 0.726, t-value = 18.820, p < 0.001; H6: β=−0.072, t-value = 1.627, p < 0.05). The R square of smart-device usage intention is 54.6%, while other R square values are 33.2% (perceived benefits) and 25.1% (perceived risks).
As perceived benefits and risks have a mediating role in the research model, a mediation analysis was conducted following Nitzl et al. [67]. T-statistics and confidence intervals (CIs) of perceived benefits and risks were evaluated through 5000 bootstrap re-samples. Full mediating effects were confirmed in all paths except for the relationship between optimism and smart-device usage intention. Optimism has a significant direct impact on usage intention. Hence, perceived benefits partially mediate between them. In PLS–SEM, the GoF from Tenenhaus et al. [68] is used for the overall fitness of the research model. According to Wetzels et al. [69], the baseline values for GoF are 0.1 (small), 0.25 (medium), and 0.36 (large). The GoF value of this study is 0.512, which exceeds the cut-off value for large effect sizes. Thus, the overall fitness of the research model is considered high enough.
5.3. Comparative Analysis
This research also examined differences in perceptions and usage behavior on smart devices between various groups. Comparative analysis of the research model was conducted by examining the path coefficients between multiple groups (see Table 7). Significant differences between groups were not found for Hypotheses 1 and 5. The impact of innovativeness on perceived benefits was significant and strong in the overseas group and in the less-experienced group of smart-device users. In males, the security factor was a stronger antecedent to perceived risks than in females. People who have used their smart devices for a long time considered discomfort to be the more important antecedent than did those with little experience. Perceived risks more strongly affected smart-device usage intention for the old, male, domestic, frequent, and smart-device-experienced traveler.
6. Discussion
6.1. Findings
The research results show that the perceived benefits of smart devices have a greater impact on usage intention than do perceived risks. It can be seen in Figure 2 that perceived benefits have a significant impact on smart-device usage intention (H5: β = 0.726). Prentice et al. [70] argued that perceived benefits determine the formation of tourist positive experience. The use of smart devices while traveling has proved to be beneficial for travelers in terms of cost savings for such activities as booking, browsing, planning, and deciding on a trip. Moreover, travelers have found that smart devices provide better accessibility to relevant information regarding travel and make their travel smoother and more convenient. Consequently, the overall travel experience provides immense happiness and is enjoyable.
Perception of risks exists and affects usage intention, although its effect is weak (H6: β = −0.072, t-value = 1.627, p < 0.05). This result is consistent with Park and Tussyadiah [7]’s study. Park and Tussyadiah [7] confirmed that perceived risks of tourist actually exist in smart tourism context and the risks significantly influence to tourist behavior in mobile travel booking. According to information adoption studies, perceived risk causes negative behavioral responses to using advanced technology [71]. As smart devices can show a traveler’s location, and tourists feel insecure about providing sensitive information and processing financial transactions, they may not use the devices during travel. Despite the technology readiness of smart devices, tourists are not able to trust the technology because there are still apprehensions regarding privacy and security of personal information. Smart devices are too advanced to be adapted by all age groups and are complicated to use because the instructions provided are limited.
Previous studies have confirmed the importance of optimism in new technology adoption [39]. High levels of optimism give tourists a positive mindset to accept new technology [8]. Previous studies have examined the relationship between optimism and overall attitude and usefulness of new technologies. This study shows that optimism also has a positive effect on the perception of technology benefits.
As advanced services and information technologies requires more intensive interaction between users and them, user innovativeness plays an important role in recognizing the benefits of service or technology [72]. In this study, innovativeness was not a significant antecedent for perception of the perceived benefits of smart technology use on tour. This is interpreted to be because most people have a good understanding of smart devices and the devices have already become popular. Otherwise, it may be because the benefits of smart devices are not limited to smart travel, but rather innovative users think the benefits are common.
Insecurity and discomfort are positively associated with perceived risk. This characteristic is thus a controlling factor that does not allow people to adopt and make use of smart devices. The security of smart devices is not yet stable. Smart devices are still limited and too technical for old and users who are not familiar with smart technology. Tourists also feel that using smart devices causes various health, security, and privacy risks. Therefore, insecurity and discomfort has a strong impact on the perceived risk of using smart devices.
People who enjoy traveling abroad tend to be innovative, which has a positive effect on perceived benefits, while the effect with people who have used smart devices for shorter periods is negative (see Table 7). According to Plog [73], adventurers who prefer unfamiliar places such as other countries are curious and innovative. Because smart devices play the role of an assistant in these unfamiliar places, innovative people who enjoy traveling abroad perceive the benefits of smart devices more clearly. On the other hand, people with little experience in using smart devices find it difficult to determine the functionality that fits their purpose. Our result shows that even when people are innovative, a lack of experience is a factor that can weaken the perception of benefits.
Males who are insecure with new technology feel more at risk with smart device use during travel. This is an interesting finding. In general, women tend to be more anxious about travel, food, and culture [74]. The reason for the opposing results in relation to the use of smart devices may be the purpose of travel. Males tend to travel for business purposes, while females travel for vacation [75]. Since males often travel more frequently for business or official purposes, they may consider it risky to give out sensitive information that may hamper their official work, safety, or security. Therefore, smart devices for males are important business tools to conduct their work. For this reason, men who are insecure with smart devices may look upon their use at the destination as dangerous.
Experience using smart devices was found to have an impact on discomfort and perceived risk. People who have used smart devices for a long time tend to be more reliant on the devices, and have familiarity with advanced functions and high expectations for technology [76]. The reason that H4 is stronger in people who have used smart devices for a long time may be due to their sensitivity to minor inconveniences.
Plog [73]’s model of tourist behavior explains why people who prefer domestic travel are more risk-conscious and therefore less likely to use smart devices. According to this theory, a “dependable” is a type of traveler who tends to prefer short, familiar destinations because of a sensitivity to risk and a desire for stability. As these travelers do not want to cause problems by using smart devices at destinations, they may not use the devices. Older males who travel frequently and have a long experience of smart device usage tend to be aware of the risk and hesitate to use them as a result. Older people tend to avoid the risk of using smart devices, because they have low self-efficacy and high anxiety and distrust of using them [77]. In the case of males, this is likely to be related to the purpose of travel, as mentioned above. People who travel frequently are clearly aware of the risks and consequences of using smart devices, and this risk perception affects usage behavior of smart devices in travel. People who have a long experience of using smart devices have a lot of important and sensitive information on their own smart devices, which influences their risk perception of smart device usage.
6.2. Contribution
6.2.1. Academic Contribution
This research is the first empirical study on the concept of smart tourism that examines the negative effects of smart devices for tourists during travel. Most studies have only shown the benefits of smart devices for smart tourism.
The TRI theory has seen limited use in smart tourism research. Chung et al. (2015) used only two constructs of the TRI, namely, optimism and discomfort. This research is the first to make use of the TRI theory in smart tourism research to analyze the positive and negative traits of smart devices while traveling. We were able to design and modify the TRI for the smart tourism context, which had not been achieved before. This study provides a breakthrough for other researchers in the use of the TRI in the smart tourism context and as a reference for further research. Integration of the TRI and perceived value theory proved to be a suitable combination to analyze the positive and negative effects of smart devices on smart tourism, as well as the perceived benefits and perceived risks of smart devices for tourists while traveling.
Various moderating factors, such as gender, age, and travel frequency, were analyzed to confirm the individual difference of smart technology’s effect on smart tourism. It has been found that age and gender differences have an effect on smart tourism. Older people, especially males who are frequent travelers, prefer not to use smart devices while traveling—perhaps they avoid them to enjoy their trip or for safety, privacy, and security reasons.
6.2.2. Practical Contribution
Our findings can be put to various practical uses. Tourism stakeholders should develop apps for tourism sites, such as attractions, hotels, restaurants, transport systems, and other related services, integrating the concepts of augmented reality, virtual reality, and artificial intelligence. The apps and user guidance should be easily available on official tourism sites with tourist reviews. The apps should include non-disclosure contracts, guarantees of confidentiality, and other best practices in human-computer interface design for tourists.
The hospitality industry (hotels, airlines, and restaurants) should work with software developers to expedite apps that make services easier for travelers in terms of security and trustworthiness, as most apps require the user’s location or access to personal details during use. Furthermore, because smart tourism can also help in branding destinations [18], the hospitality industry should also try to develop new destinations using smart tourism. The telecom industry can set reasonable roaming fees and introduce business strategy packages (SIM cards with internet packages) for travelers with suitable fees and promotions. The telecom industry should also address the privacy and security concerns of travelers and build trust through proper marketing strategies. This will allow travelers to feel safe and secure enough to use their smart devices wherever they travel. Establishing and promoting uniform charges or fees for tourism services, thereby limiting price wars and encouraging service-related competition, will help the tourists to trust the smart tourism system more. In addition, non-disclosure contracts between tourists and service providers must be ensured.
Manufacturers should consider our valuable findings while producing smart devices, considering factors such as user-friendliness, language use in manuals, and the message that everyone can use smart devices easily. Another essential factor is the health risk posed by smart devices. Manufacturers can also look into ways to reduce health risks. Manufacturing companies should create settings for privacy and security so that travelers are not tracked if they do not want to be. The companies should enable individual user-customized encryption keys to allow the securing of data and other related services on mobile devices. This should apply to apps and related smart devices, and only the necessary information should be requested, maintaining the confidentiality of all parties involved (service providers and tourists).
The government should work with tourism stakeholders and the telecom industry in areas such as network connectivity and personal services for older foreigners and frequent visitors. The government can formulate policies and guidelines for the use of smart devices, thereby helping travelers to feel a sense of trust in their destination. As smart tourism can contribute to tourism activation in rural areas [78], it can play an important role as a tool for new developments in the destination. The government can also establish emergency tourism centers to handle and resolve emergency situations, providing 24-h help, feedback, and redress of complaints with support for translation in the major tourist languages. The tourism ministry should launch discounts and award points for frequent travelers or for the most law-abiding travelers upon submission of individual reviews about their stay. These points or discounts could be accumulated for a certain period of time, thus encouraging the traveler to visit again. The government can also use the collected data to improve future planning in smart tourism services for higher tourist satisfaction.
6.3. Limitations and Further Study
This is a survey-based study and is based entirely on perceptions and intentions. The sample was taken from one country—the Republic of Korea—and this may have reduced the chances of collecting diverse and different perceptions. Therefore, one should be careful when attempting to generalize the findings to the use of smart devices in smart tourism as such. The study would have been able to provide more accurate and authentic results had the survey included both developing and developed countries in different regions. The results would have given perceived risk factors that were more specific and that could have been used by the tourism industry to minimize the negative effects for smart tourism. Even smart devices such as smartphones, tablets, and iPads, may cause different behaviors and attitudes toward the intention to use smart devices. Some travelers may prefer smartphones to other smart devices. Thus, smart-device usage may differ with a traveler’s preferences. The literature related to technology readiness and perceived value in smart tourism research is very limited, which leaves us without any existing literature on which to base our work.
Future research could provide data from various countries, and cross-national research is encouraged to investigate whether the results presented in this paper can be generalized to other countries. Further research could also explore additional factors likely to influence the intention to use smart devices for smart tourism while traveling. It may be useful to investigate the existence of rules and regulations regarding smart devices in various countries, as well as their facilities, advantages, and usage patterns, to help further in the development of services for smart tourism.
7. Conclusions
This study used the TRI and the perceived theory model for the first time in smart tourism research. The constructs of the TRI—optimism, insecurity, and discomfort—are found to be significant factors in the perceived benefits and perceived risks of smart-device use. These three factors are indicative of the usefulness of smart devices. The differences between smart devices, such as tablets, iPads, and smartphones, cause dissimilar behaviors and attitudes with regard to usage intention of smart devices. This study has made the unique discovery that people prefer domestic travel to overseas travel. The smart tourism concept is prevalent in Korea thanks to its high internet connectivity and speed. Can internet connectivity be the only reason for Korea’s smart tourism? It was found that innovativeness has an impact on the perceived benefits of smart devices among the less-experienced group of smart-device users. Older males with smart devices experienced perceived risk more strongly, which affected the intention of smart-device usage; they are well aware of the security, health, and privacy issues of smart devices. This research being the first of its kind to use the TRI and the perceived value model, the approach should be developed further, using the smart tourism concept in other countries to achieve accurate results.
Author Contributions
Writing-Original Draft Preparation, M.K.P.; Writing-Review & Editing, H.L., J.O.
Funding
This research received no external funding.
Conflicts of Interest
The authors declare no conflicts of interest.
References
- Colby, C.; Bell, K. The On-Demand Economy Is Growing, and Not Just for the Young and Wealthy. Available online: https://hbr.org/2016/04/the-on-demand-economy-is-growing-and-not-just-for-the-young-and-wealthy (accessed on 23 October 2018).
- Li, Y.; Hu, C.; Huang, C.; Duan, L. The concept of smart tourism in the context of tourism information services. Tour. Manag. 2017, 58, 293–300. [Google Scholar] [CrossRef]
- Liu, T.; Wei, B. Digital Publishing to Create “Smart Tourism”. In LISS 2014; Springer: Berlin, Germany, 2015; pp. 1733–1738. [Google Scholar]
- Wang, X.; Li, X.R.; Zhen, F.; Zhang, J. How smart is your tourist attraction? Measuring tourist preferences of smart tourism attractions via a FCEM-AHP and IPA approach. Tour. Manag. 2016, 54, 309–320. [Google Scholar] [CrossRef]
- Buhalis, D.; Amaranggana, A. Smart tourism destinations enhancing tourism experience through personalisation of services. In Information and Communication Technologies in Tourism 2015; Springer: Berlin, Germany, 2015; pp. 377–389. [Google Scholar]
- Koo, C.; Gretzel, U.; Hunter, W.C.; Chung, N. The role of IT in tourism. Asia Pac. J. Inf. Syst. 2015, 25, 99–104. [Google Scholar]
- Park, S.; Tussyadiah, I.P. Multidimensional facets of perceived risk in mobile travel booking. J. Travel Res. 2017, 56, 854–867. [Google Scholar] [CrossRef]
- Walczuch, R.; Lemmink, J.; Streukens, S. The effect of service employees’ technology readiness on technology acceptance. Inf. Manag. 2007, 44, 206–215. [Google Scholar] [CrossRef]
- Gretzel, U.; Sigala, M.; Xiang, Z.; Koo, C. Smart tourism: Foundations and developments. Electron. Mark. 2015, 25, 179–188. [Google Scholar] [CrossRef]
- Yoo, C.; Kwon, S.; Na, H.; Chang, B. Factors Affecting the Adoption of Gamified Smart Tourism Applications: An Integrative Approach. Sustainability 2017, 9, 2162. [Google Scholar] [CrossRef]
- Buhalis, D.; Amaranggana, A. Smart tourism destinations. In Information and Communication Technologies in Tourism 2014; Springer: Berlin, Germany, 2014; pp. 553–564. [Google Scholar]
- Kim, D.; Kim, S. The role of mobile technology in tourism: Patents, articles, news, and mobile tour app reviews. Sustainability 2017, 9, 2082. [Google Scholar] [CrossRef]
- Del Vecchio, P.; Mele, G.; Ndou, V.; Secundo, G. Creating value from social big data: Implications for smart tourism destinations. Inf. Process. Manag. 2018, 54, 847–860. [Google Scholar] [CrossRef]
- Garau, C. Emerging technologies and cultural tourism: Opportunities for a cultural urban tourism research agenda. In Tourism in the City; Springer: Berlin, Germany, 2017; pp. 67–80. [Google Scholar]
- Boletsis, C.; Chasanidou, D. Smart Tourism in Cities: Exploring Urban Destinations with Audio Augmented Reality. In Proceedings of the 11th PErvasive Technologies Related to Assistive Environments Conference, Corfu, Greece, 26–29 June 2018; ACM: New York, NY, USA, 2018; pp. 515–521. [Google Scholar]
- Buhalis, D.; Law, R. Progress in information technology and tourism management: 20 years on and 10 years after the Internet—The state of eTourism research. Tour. Manag. 2008, 29, 609–623. [Google Scholar] [CrossRef] [Green Version]
- Chen, Y.-C.; Shang, R.-A.; Li, M.-J. The effects of perceived relevance of travel blogs’ content on the behavioral intention to visit a tourist destination. Comput. Hum. Behav. 2014, 30, 787–799. [Google Scholar] [CrossRef]
- Khan, M.S.; Woo, M.; Nam, K.; Chathoth, P.K. Smart City and Smart Tourism: A Case of Dubai. Sustainability 2017, 9, 2279. [Google Scholar] [CrossRef]
- Hew, J.-J.; Tan, G.W.-H.; Lin, B.; Ooi, K.-B. Generating travel-related contents through mobile social tourism: Does privacy paradox persist? Telemat. Inf. 2017, 34, 914–935. [Google Scholar] [CrossRef]
- Brandt, T.; Bendler, J.; Neumann, D. Social media analytics and value creation in urban smart tourism ecosystems. Inf. Manag. 2017, 54, 703–713. [Google Scholar] [CrossRef]
- Miah, S.J.; Vu, H.Q.; Gammack, J.; McGrath, M. A big data analytics method for tourist behaviour analysis. Inf. Manag. 2017, 54, 771–785. [Google Scholar] [CrossRef]
- Huang, C.D.; Goo, J.; Nam, K.; Yoo, C.W. Smart tourism technologies in travel planning: The role of exploration and exploitation. Inf. Manag. 2017, 54, 757–770. [Google Scholar] [CrossRef]
- Snoj, B.; Pisnik Korda, A.; Mumel, D. The relationships among perceived quality, perceived risk and perceived product value. J. Prod. Brand Manag. 2004, 13, 156–167. [Google Scholar] [CrossRef]
- Zeithaml, V.A. Consumer perceptions of price, quality, and value: A means-end model and synthesis of evidence. J. Mark. 1988, 52, 2–22. [Google Scholar] [CrossRef]
- Lovelock, C.H.; Lovelock, C.H. Services Marketing; Prentice Hall: Englewood Cliffs, NJ, USA, 1991. [Google Scholar]
- Sánchez-Fernández, R.; Iniesta-Bonillo, M.Á. The concept of perceived value: A systematic review of the research. Mark. Theory 2007, 7, 427–451. [Google Scholar] [CrossRef]
- Petrick, J.F.; Backman, S.J. An examination of the construct of perceived value for the prediction of golf travelers’ intentions to revisit. J. Travel Res. 2002, 41, 38–45. [Google Scholar] [CrossRef]
- Cronin, J.J.; Brady, M.K.; Hult, G.T.M. Assessing the effects of quality, value, and customer satisfaction on consumer behavioral intentions in service environments. J. Retail. 2000, 76, 193–218. [Google Scholar] [CrossRef] [Green Version]
- Yu, J.; Lee, H.; Ha, I.; Zo, H. User acceptance of media tablets: An empirical examination of perceived value. Telemat. Inf. 2015, 34, 206–223. [Google Scholar] [CrossRef]
- Pihlström, M.; Brush, G.J. Comparing the perceived value of information and entertainment mobile services. Psychol. Mark. 2008, 25, 732–755. [Google Scholar] [CrossRef]
- Wang, H.-Y.; Wang, S.-H. Predicting mobile hotel reservation adoption: Insight from a perceived value standpoint. Int. J. Hosp. Manag. 2010, 29, 598–608. [Google Scholar] [CrossRef]
- Chung, N.; Lee, S.; Han, H. Understanding communication types on travel information sharing in social media: A transactive memory systems perspective. Telemat. Inf. 2015, 32, 564–575. [Google Scholar] [CrossRef]
- Jennings, G.; Nickerson, N. Quality Tourism Experiences; Routledge: Abingdon, UK, 2006. [Google Scholar]
- Wang, D.; Park, S.; Fesenmaier, D.R. The role of smartphones in mediating the touristic experience. J. Travel Res. 2012, 51, 371–387. [Google Scholar] [CrossRef]
- González-Reverté, F.; Díaz-Luque, P.; Gomis-López, J.M.; Morales-Pérez, S. Tourists’ Risk Perception and the Use of Mobile Devices in Beach Tourism Destinations. Sustainability 2018, 10, 413. [Google Scholar] [CrossRef]
- Parasuraman, A. Technology Readiness Index (TRI) a multiple-item scale to measure readiness to embrace new technologies. J. Serv. Res. 2000, 2, 307–320. [Google Scholar] [CrossRef]
- Lee, W.; Castellanos, C.; Chris Choi, H. The effect of technology readiness on customers’ attitudes toward self-service technology and its adoption; the empirical study of US airline self-service check-in kiosks. J. Travel Tour. Mark. 2012, 29, 731–743. [Google Scholar] [CrossRef]
- Parasuraman, A.; Colby, C. Techno-Ready Marketing: How and Why Consumers Adopt Technology; Free Press: Detroit, MI, USA, 2001. [Google Scholar]
- Chung, N.; Han, H.; Joun, Y. Tourists’ intention to visit a destination: The role of augmented reality (AR) application for a heritage site. Comput. Hum. Behav. 2015, 50, 588–599. [Google Scholar] [CrossRef]
- Victorino, L.; Karniouchina, E.; Verma, R. Exploring the use of the abbreviated technology readiness index for hotel customer segmentation. Cornell Hosp. Q. 2009, 50, 342–359. [Google Scholar] [CrossRef]
- Verma, R.; Victorino, L.; Karniouchina, K.; Feickert, J. Segmenting hotel customers based on the technology readiness index. Cornell Hosp. Rep. 2007, 7, 4–16. [Google Scholar]
- Liljander, V.; Gillberg, F.; Gummerus, J.; Van Riel, A. Technology readiness and the evaluation and adoption of self-service technologies. J. Retail. Consum. Serv. 2006, 13, 177–191. [Google Scholar] [CrossRef]
- Elliott, K.M.; Meng, J.; Hall, M.C. Technology readiness and the likelihood to use self-service technology: Chinese vs. American consumers. Mark. Manag. J. 2008, 18, 20–31. [Google Scholar]
- Wang, Y.; So, K.K.F.; Sparks, B.A. What technology-enabled Services do air travelers value? Investigating the role of technology readiness. J. Hosp. Tour. Res. 2017, 41, 771–796. [Google Scholar] [CrossRef]
- Chen, S.-C.; Jong, D.; Lai, M.-T. Assessing the relationship between technology readiness and continuance intention in an E-appointment system: Relationship quality as a mediator. J. Med. Syst. 2014, 38, 76. [Google Scholar] [CrossRef] [PubMed]
- Hemdi, M.; Rahman, S.; Hanafiah, M.; Adanan, A. Airport Self-Service Check-in: The Influence of Technology Readiness on Customer Satisfaction. In Proceedings of the 3rd International Hospitality and Tourism Conference & 2nd International Seminar on Tourism, Bandung, Indonesia, 10–12 October 2016; CRC Press/Balkema: Leiden, The Netherlands, 2016. [Google Scholar]
- Wang, Y.; So, K.K.F.; Sparks, B.A. Technology readiness and customer satisfaction with travel technologies: A cross-country investigation. J. Travel Res. 2017, 56, 563–577. [Google Scholar] [CrossRef]
- Scheier, M.F.; Carver, C.S. Effects of optimism on psychological and physical well-being: Theoretical overview and empirical update. Cognit. Ther. Res. 1992, 16, 201–228. [Google Scholar] [CrossRef]
- Rogers, E.M. Diffusion of preventive innovations. Addict. Behav. 2002, 27, 989–993. [Google Scholar] [CrossRef]
- Midgley, D.F.; Dowling, G.R. Innovativeness: The concept and its measurement. J. Consum. Res. 1978, 4, 229–242. [Google Scholar] [CrossRef]
- Kwon, H.S.; Chidambaram, L. A test of the technology acceptance model: The case of cellular telephone adoption. In Proceedings of the 33rd Annual Hawaii International Conference on System Sciences, Maui, HI, USA, 4–7 January 2000; IEEE: Piscataway, NJ, USA, 2000. [Google Scholar]
- Wolfe, H.B. The Insecurity of Mobile Phones. In Proceedings of the Informing Science & Information Technology Education Conference, Cassino, Italy, 19–24 June 2010; pp. 119–131. [Google Scholar]
- Leung, Y. Perceived benefits. In Encyclopedia of Behavioral Medicine; Springer: Berlin, Germany, 2013; pp. 1450–1451. [Google Scholar]
- Wang, D.; Xiang, Z.; Fesenmaier, D.R. Smartphone use in everyday life and travel. J. Travel Res. 2016, 55, 52–63. [Google Scholar] [CrossRef]
- Gidron, Y. Perceived risk. In Encyclopedia of Behavioral Medicine; Springer: Berlin, Germany, 2013; p. 1453. [Google Scholar]
- Hair, J.F.; Sarstedt, M.; Ringle, C.M.; Mena, J.A. An assessment of the use of partial least squares structural equation modeling in marketing research. J. Acad. Mark. Sci. 2012, 40, 414–433. [Google Scholar] [CrossRef]
- Hair, J.; Hollingsworth, C.L.; Randolph, A.B.; Chong, A.Y.L. An updated and expanded assessment of PLS-SEM in information systems research. Ind. Manag. Data Syst. 2017, 117, 442–458. [Google Scholar] [CrossRef]
- Kim, D.J.; Ferrin, D.L.; Rao, H.R. A trust-based consumer decision-making model in electronic commerce: The role of trust, perceived risk, and their antecedents. Decis. Support Syst. 2008, 44, 544–564. [Google Scholar] [CrossRef]
- Lee, M.-C. Factors influencing the adoption of internet banking: An integration of TAM and TPB with perceived risk and perceived benefit. Electron. Commer. Res. Appl. 2009, 8, 130–141. [Google Scholar] [CrossRef]
- Kim, L.H.; Kim, D.J.; Leong, J.K. The effect of perceived risk on purchase intention in purchasing airline tickets online. J. Hosp. Leisure Mark. 2005, 13, 33–53. [Google Scholar] [CrossRef]
- Henseler, J.; Hubona, G.; Ray, P.A. Using PLS path modeling in new technology research: Updated guidelines. Ind. Manag. Data Syst. 2016, 116, 2–20. [Google Scholar] [CrossRef]
- Seol, S.; Lee, H.; Zo, H. Exploring factors affecting the adoption of mobile office in business: An integration of TPB with perceived value. Int. J. Mob. Commun. 2016, 14, 1–25. [Google Scholar] [CrossRef]
- Bagozzi, R.P.; Yi, Y. On the evaluation of structural equation models. J. Acad. Mark. Sci. 1988, 16, 74–94. [Google Scholar] [CrossRef]
- Hair, J.F.; Black, W.C.; Babin, B.J.; Anderson, R.E.; Tatham, R.L. Multivariate Data Analysis; Prentice Hall: Upper Saddle River, NJ, USA, 1998; Volume 5. [Google Scholar]
- Gefen, D.; Straub, D. A practical guide to factorial validity using PLS-Graph: Tutorial and annotated example. Commun. Assoc. Inf. Syst. 2005, 16, 5. [Google Scholar] [CrossRef]
- Kock, N.; Lynn, G. Lateral collinearity and misleading results in variance-based SEM: An illustration and recommendations. J. Assoc. Inf. Syst. 2012, 13, 40. [Google Scholar] [CrossRef]
- Nitzl, C.; Nitzl, C.; Roldan, J.L.; Roldan, J.L.; Cepeda, G.; Cepeda, G. Mediation analysis in partial least squares path modeling: Helping researchers discuss more sophisticated models. Ind. Manag. Data Syst. 2016, 116, 1849–1864. [Google Scholar] [CrossRef]
- Tenenhaus, M.; Vinzi, V.E.; Chatelin, Y.-M.; Lauro, C. PLS path modeling. Comput. Stat. Data Anal. 2005, 48, 159–205. [Google Scholar] [CrossRef]
- Wetzels, M.; Odekerken-Schröder, G.; Van Oppen, C. Using PLS path modeling for assessing hierarchical construct models: Guidelines and empirical illustration. MIS Q. 2009, 33, 177–195. [Google Scholar] [CrossRef]
- Prentice, R.C.; Witt, S.F.; Hamer, C. Tourism as experience: The case of heritage parks. Ann. Tour. Res. 1998, 25, 1–24. [Google Scholar] [CrossRef]
- Wu, J.-H.; Wang, S.-C. What drives mobile commerce? An empirical evaluation of the revised technology acceptance model. Inf. Manag. 2005, 42, 719–729. [Google Scholar] [CrossRef]
- Dai, H.; Luo, X.R.; Liao, Q.; Cao, M. Explaining consumer satisfaction of services: The role of innovativeness and emotion in an electronic mediated environment. Decis. Support Syst. 2015, 70, 97–106. [Google Scholar] [CrossRef]
- Plog, S. Why destination areas rise and fall in popularity: An update of a Cornell Quarterly classic. Cornell Hotel Restaur. Adm. Q. 2001, 42, 13–24. [Google Scholar] [CrossRef]
- Lepp, A.; Gibson, H. Tourist roles, perceived risk and international tourism. Ann. Tour. Res. 2003, 30, 606–624. [Google Scholar] [CrossRef]
- Collins, D.; Tisdell, C. Gender and differences in travel life cycles. J. Travel Res. 2002, 41, 133–143. [Google Scholar] [CrossRef]
- Park, N.; Kim, Y.-C.; Shon, H.Y.; Shim, H. Factors influencing smartphone use and dependency in South Korea. Comput. Hum. Behav. 2013, 29, 1763–1770. [Google Scholar] [CrossRef]
- Czaja, S.J.; Charness, N.; Fisk, A.D.; Hertzog, C.; Nair, S.N.; Rogers, W.A.; Sharit, J. Factors predicting the use of technology: Findings from the center for research and education on aging and technology enhancement (CREATE). Psychol. Aging 2006, 21, 333–352. [Google Scholar] [CrossRef] [PubMed]
- Garau, C. Perspectives on cultural and sustainable rural tourism in a smart region: The case study of Marmilla in Sardinia (Italy). Sustainability 2015, 7, 6412–6434. [Google Scholar] [CrossRef] [Green Version]
Figure 1.
Research model.

Figure 2.
Hypotheses testing results.


Table 1.
TRI-based studies in tourism areas.
| Author | Domain | TRI Variable | Dependent Variable | Findings |
|---|---|---|---|---|
| Liljander et al. [42] | Airline check-in | Optimism, Innovativeness, Discomfort, Insecurity | Attitudes, Adoption, | TR had little impact on customer attitudes towards self-service technologies, on adoption behavior, and on self-service technologies evaluations. |
| Elliott et al. [43] | e-Ticket | Optimism, Innovativeness, Discomfort, Insecurity | Willingness to use new technology | American consumers are more likely than Chinese consumers to use self-service technologies to complete retail transactions. |
| Lee, Castellanos and Chris Choi [37] | Kiosk | Technology Readiness (Second Order) | Attitudes, Intention to use | TR has a positive effect on attitudes toward kiosks and intentions to use a kiosk. |
| Wang et al. [44] | Airline technology enabled services(TES) | Optimism, Innovativeness | Established Network Access, New TESs | Optimism and Innovativeness were significantly associated with the perceived importance of TESs. |
| Chen et al. [45] | e-appointment system | Optimism, Innovativeness, Discomfort, Insecurity | Satisfaction, Trust, Continuance intention | Optimism and innovativeness positively influenced continuance intention through the mediating effect of satisfaction and trust. |
| Chung, Han and Joun [39] | Augmented reality (AR) application for tour | Technology Readiness (Second Order) | Perceived usefulness, Attitude, Usage intention, Destination visit intention | Tourist TR is a predictor of perceived usefulness which affected intention to use AR and to visit a destination. |
| Hemdi et al. [46] | Airport self-service check-in | Optimism, Innovativeness, Discomfort, Insecurity | Satisfaction | Optimism, innovativeness, and discomfort are significant factors of satisfaction towards the continuous use of self-service technology, but insecurity is not. |
| Wang et al. [47] | Technology-enabled services for tourist | Technology Readiness (Second Order) | Satisfaction, Future behavior | Optimism and innovativeness have moderating effect between perceived quality of technology-enabled services, satisfaction, and future behavior. |
Table 2.
Measurement Items.
| Construct | Measurement Items | References | |
|---|---|---|---|
| Optimism | OPT1 | Smart devices (e.g., smartphone, and tablet) gives you more control over daily lives. | Chung, Han, and Joun [39] |
| OPT2 | The smart devices are much more convenient to use. | ||
| OPT3 | I prefer to use the most advanced available smart device. | ||
| OPT4 | Smart device makes you more efficient in daily activities. | ||
| OPT5 | Smart device gives you more freedom of mobility. | ||
| Innovativeness | INN1 | In general, I am among the first in my circle of friends to acquire new smart device when it appears in the market. | Chung, Han, and Joun [39] |
| INN2 | I can usually figure out new smart device without help from others. | ||
| INN3 | I keep up with the latest smart device developments in my areas of interest. | ||
| INN4 | I enjoy the challenge of figuring out smart-tech gadgets. | ||
| INN5 | I find I have fewer problems than other people in using smart device. | ||
| Insecurity | INS1 | I do not consider it safe using smart device as people can easily know about my whereabouts. | Walczuch, Lemmink, and Streukens [8] |
| INS2 | I do not consider it safe giving out sensitive information over a smart device. | ||
| INS3 | I do not consider it safe to do any kind of financial business through smart device. | ||
| INS4 | I prefer to talk to a person rather than through a smart device. | ||
| INS5 | If I provide information through a smart device, I can never be sure if it really reaches to right place. | ||
| Discomfort | DIS1 | Technological supports related to smart device are not helpful because they do not explain things in terms you understand. | Walczuch, Lemmink, and Streukens [8] |
| DIS2 | Sometimes, I think that smart devices are not designed for use by ordinary people. | ||
| DIS3 | There is no such thing as a manual for smart devices that is written in simple plain language. | ||
| DIS4 | I prefer to have the basic model smart devices than with plenty of extra features. | ||
| DIS5 | Sometimes, smart devices are inconvenient. | ||
| Perceived Benefits | PEB1 | Using smart device while travelling can save the cost related to travel activities (searching, booking, planning a trip, etc.). | Kim, Ferrin, and Rao [58], Lee [59] |
| PEB2 | Using smart device while travelling provides better access to useful information relate to travel. | ||
| PEB3 | Using smart device while travelling provides more enjoyable travel experience. | ||
| PEB4 | Using smart device while travelling makes travel convenient. | ||
| Perceived Risks | PER1 | Using smart device while travelling has financial risks (internet fee, device loss, etc.) | Kim, Kim, and Leong [60], Kim, Ferrin, and Rao [58] |
| PER2 | Using smart device while travelling may interfere the enjoyment of the trip. | ||
| PER3 | Using smart device while travelling would involve security or privacy risk. | ||
| PER4 | Smart device may not work well depending on the area you visit. | ||
| Smart device usage intention while traveling | SUI1 | I intend to use smart device while traveling in the future. | Chung, Han, and Joun [39] |
| SUI2 | I predict I will use smart device while traveling in the future. | ||
| SUI3 | I plan to use smart device while traveling in the future. | ||
Table 3.
Sample characteristics.
| Criteria | N = 250 | Ratio | |
|---|---|---|---|
| Gender | Male | 124 | 49.6% |
| Female | 126 | 50.4% | |
| Age | 20s | 62 | 24.8% |
| 30s | 63 | 25.2% | |
| 40s | 62 | 24.8% | |
| 50s | 63 | 25.2% | |
| Education | High school | 37 | 14.8% |
| Undergraduate | 174 | 69.6% | |
| Graduate | 39 | 15.6% | |
| Smart Device Experience | ~2 years | 53 | 21.2% |
| 3~4 years | 60 | 24.0% | |
| 5~6 years | 71 | 28.4% | |
| 7 years~ | 66 | 26.4% | |
| Travel Frequency | Once a year | 72 | 28.8% |
| Once in six months | 87 | 34.8% | |
| Once in three months | 63 | 25.2% | |
| More than once a month | 28 | 11.2% | |
| Travel Preferences | Domestic | 184 | 73.6% |
| Overseas | 66 | 26.4% | |
Table 4.
Measurement model evaluation.
| Construct | Item | Loading | Mean | Standard Deviation | Cronbach’s Alpha | rho_A (ρA) | Composite Reliability | AVE |
|---|---|---|---|---|---|---|---|---|
| OPT | OPT1 | 0.785 | 5.424 | 1.247 | 0.830 | 0.834 | 0.880 | 0.596 |
| OPT2 | 0.797 | |||||||
| OPT3 | 0.727 | |||||||
| OPT4 | 0.827 | |||||||
| OPT5 | 0.718 | |||||||
| INN | INN2 | 0.840 | 4.891 | 1.388 | 0.890 | 0.898 | 0.924 | 0.752 |
| INN3 | 0.861 | |||||||
| INN4 | 0.871 | |||||||
| INN5 | 0.895 | |||||||
| INS | INS1 | 0.806 | 4.297 | 1.355 | 0.746 | 0.750 | 0.840 | 0.569 |
| INS2 | 0.765 | |||||||
| INS3 | 0.773 | |||||||
| INS5 | 0.666 | |||||||
| DIS | DIS1 | 0.770 | 3.785 | 1.371 | 0.750 | 0.761 | 0.843 | 0.576 |
| DIS2 | 0.822 | |||||||
| DIS3 | 0.808 | |||||||
| DIS4 | 0.620 | |||||||
| PEB | PEB1 | 0.878 | 5.386 | 0.998 | 0.921 | 0.922 | 0.944 | 0.808 |
| PEB2 | 0.900 | |||||||
| PEB3 | 0.899 | |||||||
| PEB4 | 0.918 | |||||||
| PER | PER1 | 0.752 | 4.412 | 1.308 | 0.741 | 0.755 | 0.853 | 0.661 |
| PER2 | 0.786 | |||||||
| PER3 | 0.894 | |||||||
| SUI | SUI1 | 0.935 | 5.827 | 1.189 | 0.948 | 0.951 | 0.966 | 0.905 |
| SUI2 | 0.954 | |||||||
| SUI3 | 0.966 |
Table 5.
Correlations (HTMT) and square root of AVE.
| OPT | INN | INS | DIS | PEB | PER | SUI | |
|---|---|---|---|---|---|---|---|
| OPT | 0.772 | ||||||
| INN | 0.551 (0.649) | 0.867 | |||||
| INS | −0.073 (0.169) | −0.009(0.079) | 0.754 | ||||
| DIS | −0.289 (0.372) | −0.343(0.420) | 0.459(0.614) | 0.759 | |||
| PEB | 0.576 (0.654) | 0.313(0.341) | −0.139(0.202) | −0.315(0.378) | 0.899 | ||
| PER | −0.171 (0.216) | −0.184(0.219) | 0.454(0.598) | 0.398(0.534) | −0.136(0.163) | 0.813 | |
| SUI | 0.554(0.621) | 0.373(0.402) | −0.127(0.147) | −0.284(0.334) | 0.736(0.785) | −0.171(0.203) | 0.952 |
Table 6.
Cross-loading.
| OPT | INN | INS | DIS | PEB | PER | SUI | |
|---|---|---|---|---|---|---|---|
| OPT1 | 0.785 | 0.350 | −0.028 | −0.190 | 0.505 | −0.135 | 0.483 |
| OPT2 | 0.797 | 0.461 | 0.010 | −0.212 | 0.458 | −0.143 | 0.428 |
| OPT3 | 0.727 | 0.597 | −0.054 | −0.289 | 0.386 | −0.145 | 0.427 |
| OPT4 | 0.827 | 0.463 | −0.130 | −0.257 | 0.417 | −0.151 | 0.401 |
| OPT5 | 0.718 | 0.287 | −0.092 | −0.184 | 0.439 | −0.086 | 0.390 |
| INN2 | 0.474 | 0.840 | −0.083 | −0.369 | 0.307 | −0.195 | 0.335 |
| INN3 | 0.456 | 0.861 | 0.060 | −0.229 | 0.219 | −0.153 | 0.277 |
| INN4 | 0.481 | 0.871 | 0.015 | −0.279 | 0.270 | −0.140 | 0.361 |
| INN5 | 0.493 | 0.895 | 0.001 | −0.288 | 0.275 | −0.143 | 0.308 |
| INS1 | 0.006 | 0.036 | 0.806 | 0.316 | −0.074 | 0.387 | −0.084 |
| INS2 | 0.060 | 0.033 | 0.765 | 0.257 | 0.051 | 0.277 | 0.001 |
| INS3 | −0.059 | −0.018 | 0.773 | 0.367 | −0.106 | 0.331 | −0.139 |
| INS5 | −0.211 | −0.074 | 0.666 | 0.427 | −0.258 | 0.352 | −0.145 |
| DIS1 | −0.194 | −0.272 | 0.354 | 0.770 | −0.122 | 0.312 | −0.109 |
| DIS2 | −0.283 | −0.241 | 0.336 | 0.822 | −0.374 | 0.332 | −0.303 |
| DIS3 | −0.190 | −0.189 | 0.331 | 0.808 | −0.209 | 0.297 | −0.227 |
| DIS4 | −0.205 | −0.355 | 0.382 | 0.620 | −0.245 | 0.261 | −0.222 |
| PEB1 | 0.525 | 0.296 | −0.078 | −0.255 | 0.878 | −0.082 | 0.663 |
| PEB2 | 0.491 | 0.295 | −0.118 | −0.309 | 0.900 | −0.149 | 0.634 |
| PEB3 | 0.540 | 0.259 | −0.157 | −0.273 | 0.899 | −0.158 | 0.617 |
| PEB4 | 0.514 | 0.276 | −0.145 | −0.295 | 0.918 | −0.102 | 0.726 |
| PER1 | −0.069 | −0.076 | 0.335 | 0.285 | −0.071 | 0.752 | −0.099 |
| PER2 | −0.217 | −0.185 | 0.313 | 0.365 | −0.124 | 0.786 | −0.196 |
| PER3 | −0.124 | −0.178 | 0.450 | 0.320 | −0.131 | 0.894 | −0.120 |
| SUI1 | 0.493 | 0.344 | −0.094 | −0.262 | 0.679 | −0.126 | 0.935 |
| SUI2 | 0.509 | 0.350 | −0.120 | −0.273 | 0.677 | −0.190 | 0.954 |
| SUI3 | 0.575 | 0.368 | −0.147 | −0.276 | 0.741 | −0.170 | 0.966 |
Table 7.
Comparative Analysis.
| Destination Preference | Travel Frequency | Gender | Age | Smart Device Experience | ||||||
|---|---|---|---|---|---|---|---|---|---|---|
| Domestic (N = 184) | Overseas (N = 66) | Low (N = 159) | High (N = 91) | Male (N = 124) | Female (N = 126) | Young (N = 125) | Old (N = 125) | Short (N = 113) | Long (N = 137) | |
| H1 | 0.628 *** | 0.460 *** | 0.588 *** | 0.500 *** | 0.569 *** | 0.659 *** | 0.516 *** | 0.638 *** | 0.641 *** | 0.527 *** |
| H2 | −0.043 | 0.096 * | 0.027 | −0.050 | 0.014 | −0.091 | −0.018 | 0.016 | −0.094 * | 0.048 |
| H3 | 0.335 *** | 0.375 *** | 0.329 *** | 0.377 *** | 0.478 *** | 0.169 ** | 0.371 *** | 0.303 *** | 0.378 *** | 0.334 *** |
| H4 | 0.252 *** | 0.242 *** | 0.299 *** | 0.182 ** | 0.275 *** | 0.228 *** | 0.269 *** | 0.235 *** | 0.158 * | 0.305 *** |
| H5 | 0.722 *** | 0.744 *** | 0.724 *** | 0.717 *** | 0.745 *** | 0.709 *** | 0.740 *** | 0.706 *** | 0.754 *** | 0.685 *** |
| H6 | −0.085 * | −0.038 | −0.054 | −0.111 ** | −0.152 *** | 0.025 | −0.023 | −0.131 ** | 0.005 | −0.159 *** |
* p < 0.05; ** p < 0.01; *** p < 0.001.
© 2018 by the authors. Licensee MDPI, Basel, Switzerland. This article is an open access article distributed under the terms and conditions of the Creative Commons Attribution (CC BY) license (http://creativecommons.org/licenses/by/4.0/).
Share and Cite
MDPI and ACS Style
Pradhan, M.K.; Oh, J.; Lee, H. Understanding Travelers’ Behavior for Sustainable Smart Tourism: A Technology Readiness Perspective. Sustainability 2018, 10, 4259. https://0-doi-org.brum.beds.ac.uk/10.3390/su10114259
AMA Style
Pradhan MK, Oh J, Lee H. Understanding Travelers’ Behavior for Sustainable Smart Tourism: A Technology Readiness Perspective. Sustainability. 2018; 10(11):4259. https://0-doi-org.brum.beds.ac.uk/10.3390/su10114259
Chicago/Turabian StylePradhan, Meena Kumari, Jungjoo Oh, and Hwansoo Lee. 2018. "Understanding Travelers’ Behavior for Sustainable Smart Tourism: A Technology Readiness Perspective" Sustainability 10, no. 11: 4259. https://0-doi-org.brum.beds.ac.uk/10.3390/su10114259
Note that from the first issue of 2016, this journal uses article numbers instead of page numbers. See further details here.