A Microeconomic Methodology to Evaluate Energy Efficiency by Consumption Behaviors and Strategies to Improve Energy Efficiency

1
Faculty of Maritime and Transportation, Ningbo University, 169 Qixinnan Road, Meishan Bonded Area, Ningbo 315832, China
2
National Traffic Management Engineering & Technology Research Centre, Ningbo University Sub-Center in China, 169 Qixinnan Road, Meishan Bonded Area, Ningbo 315832, China
3
Jiangsu Province Collaborative Innovation Centre for Modern Urban Traffic Technologies, 169 Qixinnan Road, Meishan Bonded Area, Ningbo 315832, China
*
Author to whom correspondence should be addressed.
Sustainability 2018, 10(11), 4327; https://0-doi-org.brum.beds.ac.uk/10.3390/su10114327
Submission received: 9 October 2018
/
Revised: 12 November 2018
/
Accepted: 14 November 2018
/
Published: 21 November 2018
(This article belongs to the Collection Sustainable Built Environment)
Abstract
:The present paper highlights a quantitative method to maximize energy efficiency based on the minimum energy consumption and maximum quality of life from consumption behaviors. Quality of life is expressed by utility, which is a Constant Elasticity of Substitution (CES) function of demands for composite goods, car trips and public transport trips. Individual energy consumption is estimated by the demand of goods and we applied this method to Nagasaki to evaluate energy efficiency. Our results showed that 28,154 kcal of energy is needed to support the life of one individual per day in Nagasaki. Furthermore, we found that 76% of energy was used for composite goods and 24% was used for mobility goods. To achieve maximum energy efficiency, our results highlight that energy should be reduced by increasing the consumption of composite goods and public transport trips, while simultaneously decreasing the consumption of car trips. Compared to residents in urban and suburban areas, individuals in Central Business Districts (CBD) were found to have higher energy efficiency. Findings in Nagasaki suggest three policy implications: First, eco-energy consumption patterns should be encouraged to decrease energy use, while maintaining quality of life. Second, mixed land use is attributed to increased energy efficiency. Lastly, the energy efficiency of mobility could be improved though increasing the attraction of public transport.
1. Introduction
Accompanying the rapid growth of energy consumption, extreme weather, such as floods and storms, has become increasingly regular events. These extreme weather and climate events have had a significant economic impact. In 2017, weather and climate disaster events led to losses exceeding $1.5 trillion in the United States and more than $330 billion worldwide [1]. Behind rapid urbanization in developing countries, is high energy consumption. Such consumption in cities has been blamed for extreme weather events, as cities have become the center of energy consumption and carbon emission. In China, the urban population is 7.93 billion, accounting for 57.3% of the total population in 2016 [2]. Carbon emission reduction and energy saving have become an urgent issue in cities [3].
Four end-use sectors, namely, transportation, industrial, residential and commercial, are noted as the main consumption sectors of energy. The industrial sector, which was the largest source of CO2 emissions in 1990s, has declined over the last five years [4]. The energy use of the transportation, residential and commercial sectors, known collectively as living sectors of residents, has become the main energy users and carbon emission contributors [4]. According to data from EIA (Energy Information Administration), energy for building and transportation accounts for 52% of the total energy use in 2014 [5]. Alongside an 8% annual increase in the rate of consumption, the energy used by resident living has been the fastest contributor to the increased energy use in developing countries [6]. According to the experience of developed countries, this trend will continue with the growth of GDP. Thus, it is important to consider energy reduction in the residential sector when discussing potential energy saving issues in cities.
There are many approaches that can be adopted in order to reduce energy consumption in the residential sector. ‘ASIF’ decomposition approach introduces three elements for reducing energy consumption. Under this approach, energy use and carbon emissions could be reduced through changing activity consumption structure (S), energy intensity (I) and fuel carbon intensity (F) [7]. Energy use and carbon emission mitigation are realized through reducing activities, changing consumption structure, improving energy efficiency and reducing fuel carbon intensity. There is a close relationship among factors in ‘ASIF.’ For example, energy efficiency could be improved through the change of consumption structures and activities [8]. According to the International Energy Agency, energy efficient building and consumption behaviors are expected to reduce energy needs and control global emissions of greenhouse gas [9]. Strategies for improving energy efficiency in the residential sector have been attempted by updating energy utilization of buildings, reducing energy intensive activities and increasing efficient consumption structures [10]. More effort should focus on exploring the features of consumption structures and the relationship between building and human consumption behaviors.
2. Literature Review
Research related to energy efficiency improvement in the residential sector is divided into two groups based on the target: Physical objects and activities. Buildings, as physical objects, have received a lot of attention from researchers interested in improving energy efficiency. [11,12,13]. According to the lifecycle of a building, researchers analyzed building energy efficiency from the aspects of material, architectural design, construction and operational systems. Studies of building materials have focused on the potential energy efficiency of alternative materials for building construction [14]. Palme et al. presented a simulation study by monitoring the thermal performance of four different types of house material in San Pedro [15]. A lifecycle energy (LCEA) and carbon (LCCO2A) analysis was performed by Florentin to evaluate the potential benefits of an alternative, bio-composite building material, which is mixed with a lime binder [16]. Architectural design covers issues such as building shape, orientation, building envelope, shading, cooling and heating systems, glazing and integration of renewable energy systems into buildings. Zhu et al. developed a new method to optimize building envelope design by using Orthogonal Experimental Design (OED). The study suggests that building orientation, shape and the surface-area-to-volume-ratio are the most important factors of building energy efficiency [17]. Studies on building structure are concerned with energy efficiency evaluation of different structural engineering solutions. Lydon et al. assessed the energy demand and carbon emission of a lightweight shell roof, a funicular floor and an adaptive solar façade [18].
The energy usage of operation systems dominates the main percentage of energy use of buildings. The primary energy of a building in operational phase compared to the embodied phase is 85% versus 15% [19]. Thus, an increasing number of studies have focused on the energy efficiency of operational systems. Energy for operation of buildings includes heating, cooling, lighting, ventilation and electricity. The latest energy standards, pertaining to buildings, mainly focus on improving energy efficiency of operational system through two ways. The first way is to transfer operational energy to embodied energy. Sartori found most energy efficient buildings have a relatively higher share of embodied energy [20]. The other is by reducing the energy demand through change of consumption patterns. For example, more energy efficient appliances and energy saving behaviors are encouraged. Alencar et al. found buildings on a public university campus could be more energy efficient by improving the efficiency of lighting and air-conditioning systems and reducing excessive inputs [21].
Activity, which is considered as the origin of energy demand, is another target for improving energy efficiency. The intensity of activities is the major factor determining energy consumption. Lots of literatures have shown approaches to increase the energy efficiency of production activities [22,23]. Zhang et al. modeled and estimated the benefits of energy efficiency and emission mitigation in China’s cement industry at provincial level [24].
Although the emphasis on production acts as the main driver of transition to high energy efficiency society, consumption behaviors have been attracted growing attention from wide economic and political viewpoints. Reducing energy demands are not only the developing energy efficiency technologies but also changing behaviors. Based on analysis of trade integration and regional cooperation in 89 countries in China’s One Belt and One Road region, Han et al. found trade integration and regional cooperation can promote energy efficiency [25]. Meanwhile, Aste et al. analyzed the effects of policies that installation of renewable energy sources on consumption behaviors and energy efficiency in Lombardy Region in Italy [26]. These studies developed useful methods and provided valuable suggestions for evaluating and improving energy efficiency. However, most of these studies focus on the total amount of energy consumption. Other influential elements of energy efficiency, such as consumption behaviors in building environments, are less considered.
Generally, it is difficult to take actions to improve energy efficiency based on consumption behaviors because energy demand of consumption strongly related to quality of life, which is the general well-being of individuals. Several methods are developed to measure the quality of life in terms of health care, wealth and materialistic goods [27]. In purely economic terms, quality of life is closely related to consumption of goods [28]. The total energy consumption is determined by personal consumption behaviors, which are closely related with quality of life. Aoyama et al. proposed a microeconomic model to find a representative traffic pattern that minimizes energy consumption under the condition of current mobility level [29]. While, other researchers attempt to analyze the problem based on all end-use energy data [30,31]. These studies investigate the relationship between consumption behaviors and energy use. However, they did not demonstrate much about the behavior mechanism.
What kind of consumption behaviors contributes to less energy consumption and how to persuade people to do so are the main two issues that should be answered for energy efficiency improvement. This study aims to answer the questions from the viewpoint of consumption behaviors and provide strategies for energy efficiency improvement. Considering the driver of consumption behaviors is keeping quality of life in reality, a further investigation of consumption behaviors which attribute to minimum energy use under the restrictive condition of quality of life is meaningful.
3. Methodology
According to economic theory, quality of life is closely related to consumption of goods. Due to the consumption, energy is needed. To discuss energy efficiency issue based on consumption behaviors, three key problems should be addressed. First, what types of consumption behaviors should be analyzed. Second, what is the relationship between consumption behaviors and quality of life. Third, what is the relationship between consumption behaviors and energy consumption. Based on these problems, the content of the section is organized as three parts: (1) to express the quality of life based on consumption behaviors, (2) to estimate the energy use based on consumption behaviors, (3) to maximize energy efficiency based on consumption behaviors.
3.1. Quality of Life and Consumption Behaviors
Revealed-preference has been used to measure quality of life in purely economic terms [27]. In this study, utility is applied to reflect quality of life. Utility represents satisfaction of consumption.
Consumption behaviors are very important elements of utility. There are many types of goods in reality. Considering the big energy share of transport, all goods are classified to mobility goods and composite goods in this study. Mobility goods are goods related to transport services, including car trips and public transport trips. Trips by bicycle and walking are not included as mobility goods because they attribute to little energy consumption. Trips by motorcycle are also not considered due to low mode share in the studied area. Composite goods are all other goods except mobility goods, including goods in residential and commercial sectors, such as heating, cooling, food and recreation.
Following assumptions are essential to describe consumption behaviors: (a) individuals are supposed to consume two types of goods called composite goods and mobility goods; (b) mobility goods includes car trips and public transport trips; (c) individuals achieve maximum utility and maximum mobility; (d) all income is used for consumption of composite goods and mobility goods.
Based on these assumptions, a utility function is applied to express the relationship among consumption behaviors. Individuals spend all income on consumption of composite goods and mobility goods, which indicates individuals just have two choices of consumption. Increasing consumption of composite goods has passive influence on consumption of mobility goods because income is fixed. A substitution relationship exists between the demand of composite goods and mobility goods. Meanwhile, individuals choose private cars or public transport to achieve their mobility. A substitutive relationship also exists between car trips and public transport trips.
A two order Constant Elasticity of Substitution (CES) function is applied to express two types of substitutive relationships [32]. ui indicates utility (Equation (1)). x1i, x2i are demand of composite goods and mobility goods, respectively. x2i is a function of x2Ci, x2Mi (Equation (2), which are demand of car trips and public transport trips, respectively. σ1 represents substitution elasticity between composite goods and mobility goods. σ2 is substitution elasticity between car trips and public transport trips. α1, α2 are expenditure share of composite goods and mobility goods to income, respectively. α2C, α2M are expenditure share of car trips and public transport trips to traffic budget, respectively.
3.2. Energy Consumption and Consumption Behaviors
Energy consumption is estimated based on demand of goods, energy units and trip time (Equation (3)). Ei indicates the energy consumption by one resident per day in zone i. x1i, x1Ci, x1Mi, are demand of composite goods, car trips and public transport trips, respectively. e1, e2 and e3, are energy units of composite goods, car trip and mass transit trip, respectively. Energy unit evaluates the amount of energy for consuming one unit of goods. In this study, e1 (kcal/yen) evaluates the energy for per unit of composite goods, that is one yen in residential and commercial sector. e2 (kcal/trip·min) represents the amount of energy needed for one minute in a car trip, including energy for oil, tire, tube, maintenance, vehicle depreciation. e3 (kcal/trip·min) indicates how much energy is needed for one minute in a public transport trip, including energy for oil, tire, tube, maintenance, vehicle depreciation. t2Ci and t2Mi are trip time of car trips and mass transit trips, which reflect the influence of traffic congestions.
3.3. Maximization of Energy Efficiency
Maximization of energy efficiency (UEi) is shown as the ratio of maximum utility to minimum energy use (Equation (4))
According to Equation (4), it needs to find the optimal consumption behaviors, which contribute to least energy consumption on the maximum utility level. It is essential to solve two problems. One problem is maximizing mobility based on car trips and public transport trips (Equation (5)). The other problem is maximizing utility based on maximum mobility and demand of composite goods (Equation (6)).
The mathematical expression of minimization of energy consumption is indicated as Equation (7).
The optimal consumption behaviors for maximum energy efficiency are explained by optimal demand of composite goods (x1i*), optimal demand of car trips (x2ci*) and optimal demand of public transport trips(x2mi*) (Equations (8)–(10)).
4. Application Case in Nagasaki Metropolitan Region
We applied the method to Nagasaki metropolitan region. Nagasaki metropolitan region locates in Kyusyu island of Japan. The region has three cities (Nagasaki, Isahara, Omura) and four towns. Nagasaki city has population of 0.42 million and area of 241 km2 in 2015.
4.1. Data
• Energy consumption units
According to the statistical data by Agency of Natural Resources and Energy, METI, energy consumption unit of residential and commercial sector is 3.51 kcal/yen in Nagasaki prefecture [33]. It includes energy for residential, water supply, sewage and waste disposal, trade and finance service, public service, commercial service and retail servicers. Composite goods are goods in residential and commercial sector. Thus the energy unit of composite goods is set as 3.51 kcal/yen. Referring to energy consumption unit of trip distance (kcal/trip·km) from Japanese Road Bureau, Ministry of Land, Infrastructure and Transport [34], the energy consumption unit of trips is calculated as Energy consumption unit of trip (kcal/trip·min) = energy consumption unit of trip distance (kcal/trip·min) × average speed (km/min). Energy consumption unit of car trip and mass transit trip are 249 kcal/trip·min and 16 kcal/trip·min, respectively.
• Trip time
Trip time of car trip and mass transit trip in each zone are estimated through trip assignment by software Strada. The trip data is from Personal Trip Survey (PTS) in Nagasaki metropolitan region, which is provided by Nagasaki Metropolitan Regional Urban Transport Planning and Consultation Organization.
• Price of goods
Price of composite goods is set to one as a benchmark. Price of car trips is determined by the operation cost, which includes fees related oil, tire, tube, maintenance, vehicle depreciation and so on. The operation cost is determined by running fee unit (yen/km·vehicle), which is from a statistical report by MLIT [34]. We transferred running fee unit to the price of car trips by following equation: p2Cij (yen/trip) = (running fee unit (yen/km·vehicle) × minimum distance from zone i to j (km))/average passengers (trips/vehicle). The number of passengers in a car is 1.21 according to the same report. The price of mass transit trip (p2Mij) is determined by the mass transit fare.
• Income
4.2. Procedure for Estimating Optimal Consumption Behaviors and Minimum Energy Consumption
Five steps are included in the procedure. Step 1: to calculate maximum utility based on consumption data of PTS. Step 2: to calculate the optimal demand of goods by Equations (8)–(10). Step 3: to build origination-destination (OD) matrixes by a destination choice model. Step 4: to assign car trips and public transport trips by software Strata. Step 5: to calculate energy consumption of composite goods based on expenditure of composite goods and energy unit e1. Step 6: to calculate energy consumption of car trips and public transport trips based on energy units, trip time and number of trips. Step 7: to calculate the minimum energy consumption based on energy consumption of composite goods, car trips and public trips.
4.3. Results of Energy Consumption
The minimum energy consumption is estimated. Meanwhile we calculate actual energy consumption by Equation (3) as a comparison. Results are shown in Table 1. For the actual energy consumption, more than 73% of energy is used for composite goods and over 24% of energy is for car trips in Nagasaki. Only 2.1% of energy is for public transport trips. Compared to the actual energy consumption, more than 12.8% of energy could be saved in minimum energy consumption case. This means nearly 3600 kcal could be cut by one resident per day in Nagasaki. Minimum energy consumption could be achieved by decreasing approximately 75.9% of energy by car trips, whilst simultaneously increasing 131% of energy by public transport trips and 3.3% of energy by composite goods. Higher energy share of composite goods and public transport trips but lower energy share of car trips, contribute to less energy consumption.
4.4. Results of Energy Efficiency
Weighted by the population, we estimate the actual and maximum energy efficiency. As shown in Table 2, data is summarized to three groups to compare the difference among CBD, urban and Suburban. Compared to 9395 in CBD, lower maximum utility is shown in urban, which is indicated as 4939. However, the difference of utility between urban and suburban is small. For an individual in CBD, 51,830 kcal of energy is needed for one resident per day. In urban and suburban, the value of energy reduces to 27,814 kcal and 27,627 kcal, respectively. The actual energy efficiency is 0.181, 0.178 and 0.171 in CBD, urban and suburban, respectively.
In the case of maximum energy efficiency, energy consumption reduces by 8770 kcal from the actual case. 43,060 kcal of energy is needed for utility of 9757 in CBD. The maximum energy efficiency is 0.227, which means 4.4 kcal for each unit of utility in CBD. The maximum energy efficiency is 0.223 in urban and 0.219 in suburban. Energy efficiency should be improved by 0.048 to realize the maximum energy efficiency in suburban. However, it just needs to improve the value by 0.046 in CBD to realize maximum energy efficiency.
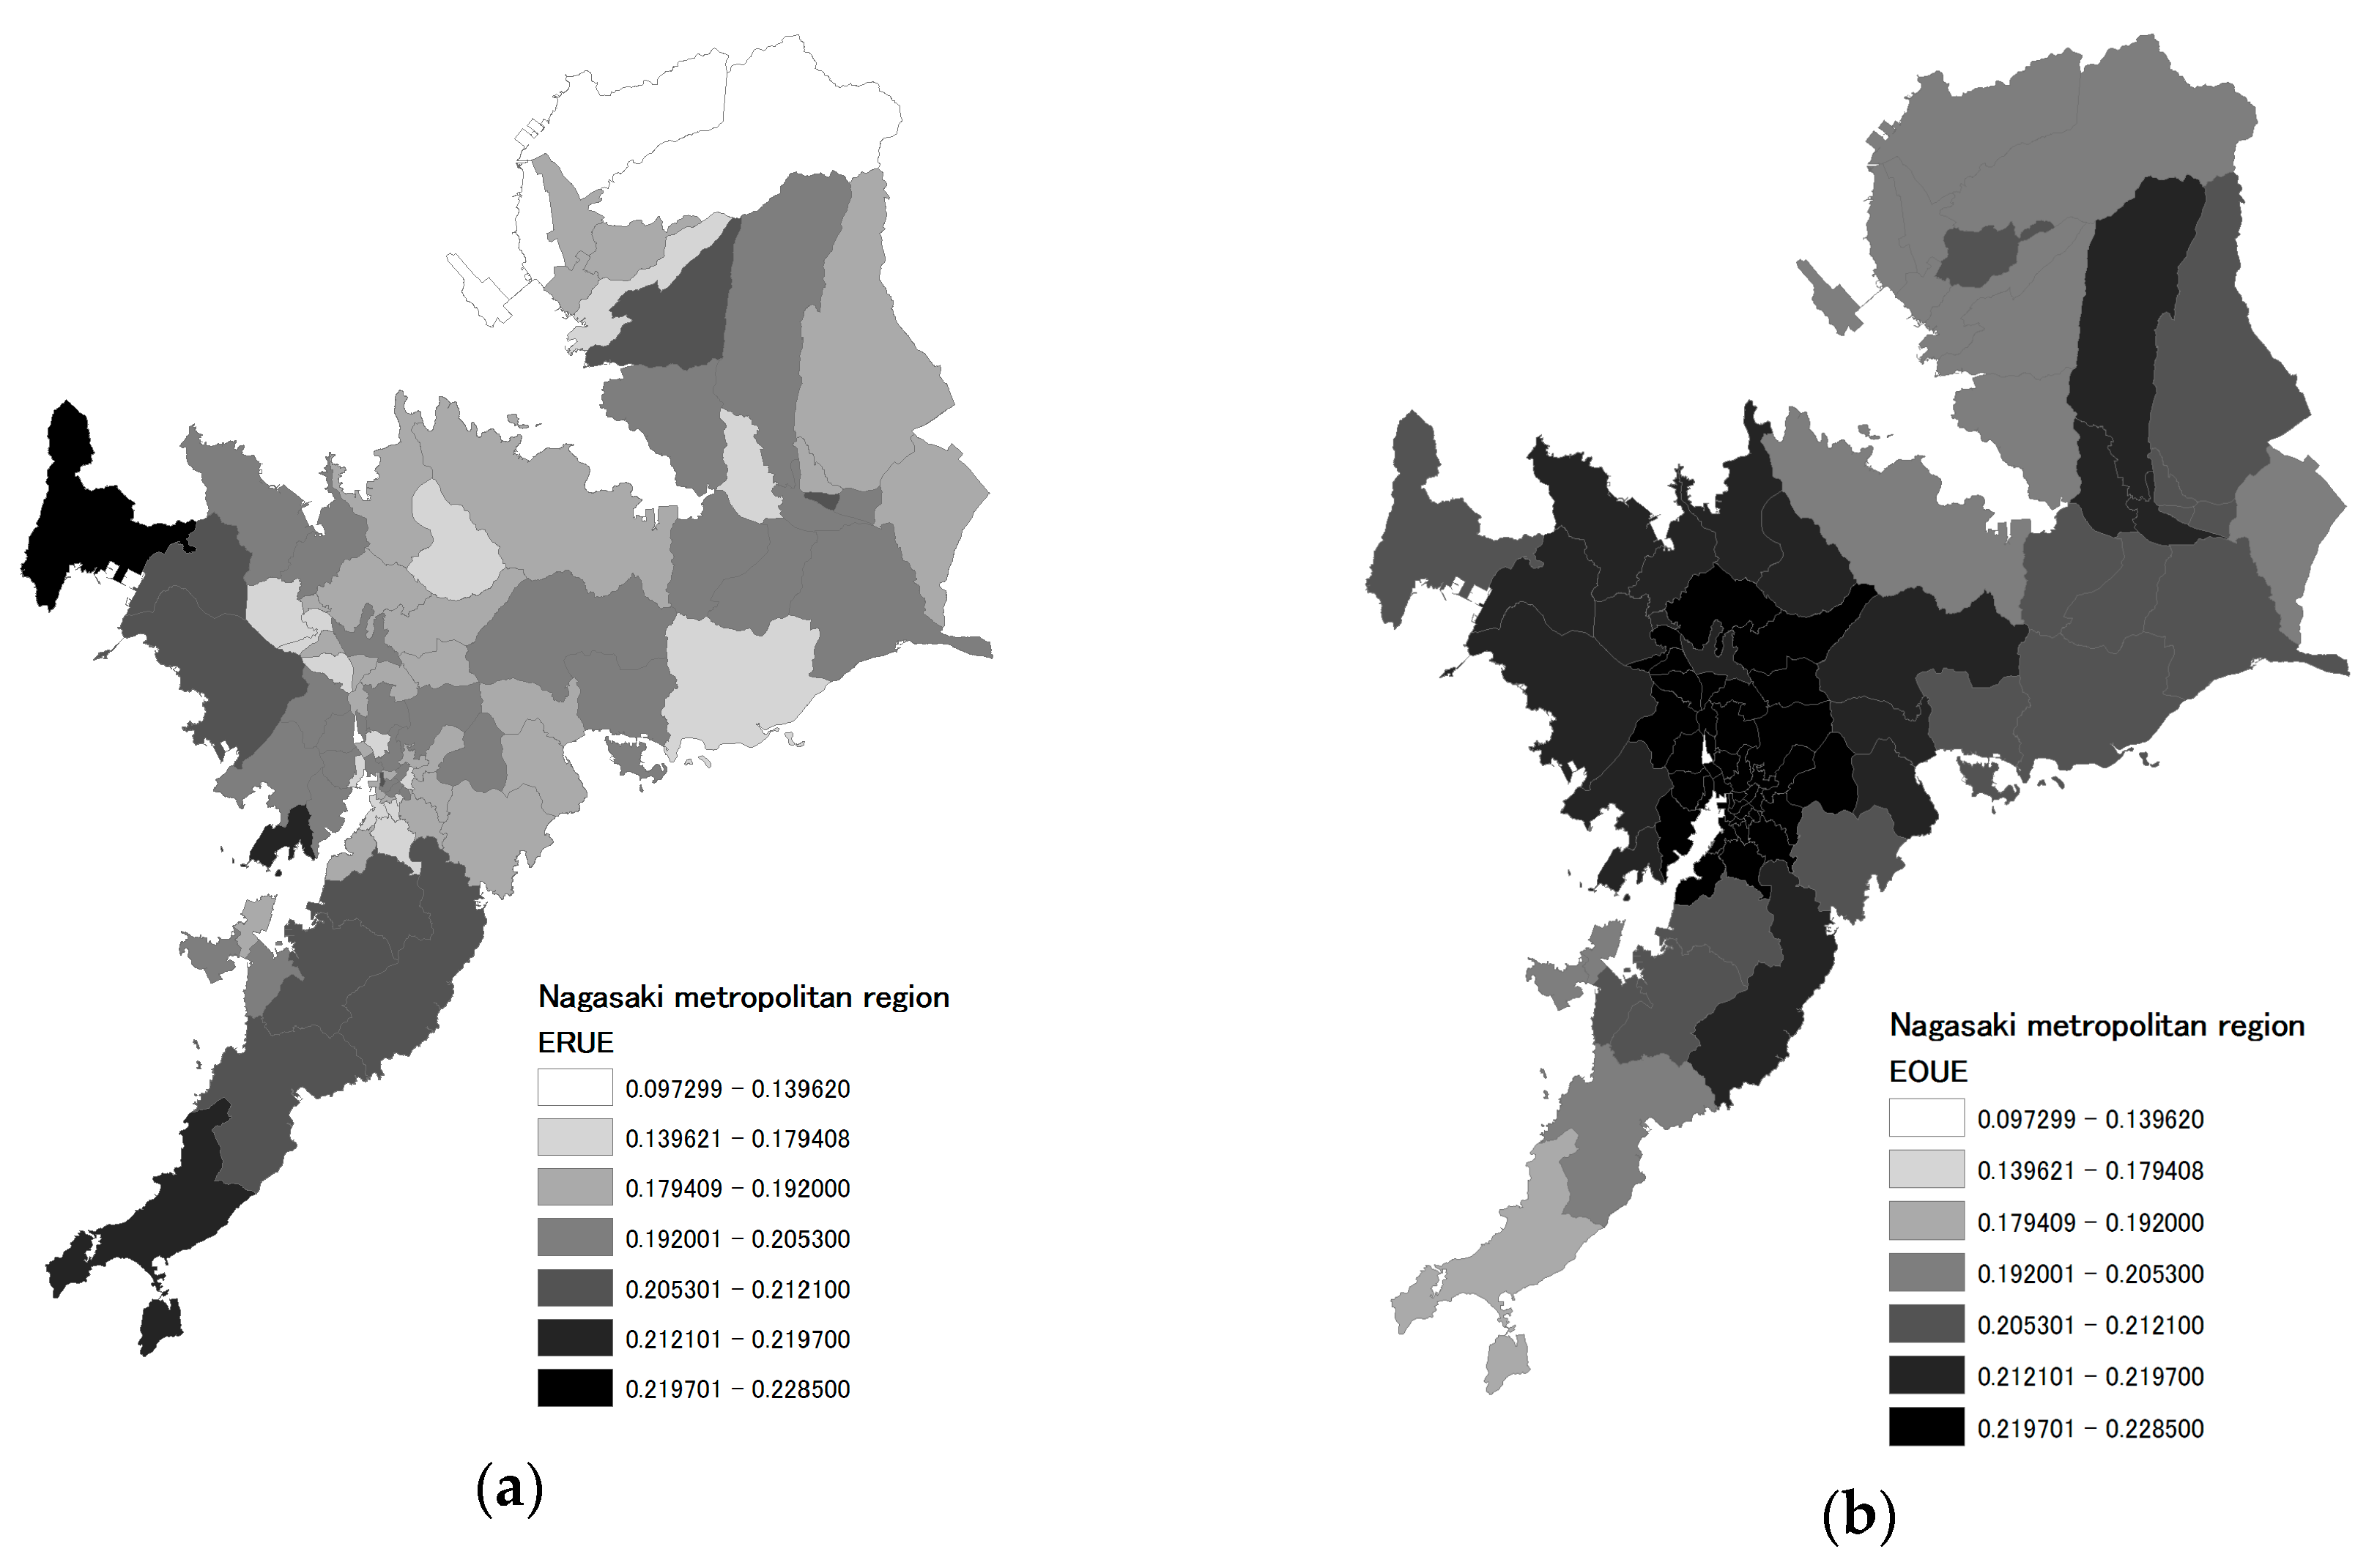
Energy efficiency at zonal level is also analyzed (Figure 1). Figure 1a indicates the estimated actual energy efficiency. Although high energy efficiency zones are indicated in CBD, it is interesting to find a few zones with high energy efficiency locate in suburban, especially in the south part of the region. Zones in the north area have the lowest energy efficiency. The difference of energy efficiency among zones in urban area is significant. Compared to the actual energy efficiency, it indicates that there has significant improvement of energy efficiency in urban area in case of maximum energy efficiency (Figure 1b). Zones with higher estimated maximum energy efficiency are concentrated in CBD. Analyzing the relationship between energy efficiency and geographic feature of zones (Figure 2), maximum energy efficiency has a decreasing trend with the distance to CBD.
5. Discussion
Growing concerns about energy security and greenhouse gas emission require to minimize the use of resources, reduce spatial displacement of environment and improve energy efficiency for urban development. In order to reduce energy consumption, policies that encourage eco living style in urban area are made to improve energy efficiency. Success of policies depends on reactions of individuals, who attempts to keep quality of life. It is believed that higher quality of life is supported by more energy consumption. Reducing energy consumption has huge influence on the achievement of quality of life. To realize the goal of energy consumption reduction, it is essential to make strategies from viewpoints of energy consumption and quality of life.
Different from most studies which focus on technologies to improve energy efficiency, this study proposed a strategy to improve energy efficiency based on consumption behaviors. By investigating consumption behaviors of residents in Nagasaki, we found more than 74% of energy is used for composite goods, 24% of energy is used for car trips. The energy percentage of public transport trips is 2%. People spend most of money on composite goods. Public transport is not popular as automobiles in Nagasaki. It is true that residents prefer to private cars in a developed country like Japan, which has a high ownership rate of automobiles.
Two interesting findings are observed based on the simulation results of minimum energy consumption in Nagasaki. First, energy efficiency could be improved through changing consumption behaviors. Eco consumption behaviors of individuals attribute to higher energy efficiency. More consumption of composite goods and public transport trips contribute to less energy use. Meanwhile, reducing car trips is helpful to improve energy efficiency. Increasing consumption of composite goods does not mean decreasing the mobility level. Individuals could maintain the mobility level through usage of more energy efficient models, such as mass transit. Thus it is important to increase the attraction of public transport to residents. The other interesting finding is that energy efficiency is influenced by land use attributes. Energy efficiency is different among CBD, urban and suburban. Highest energy efficiency is found in CBD in Nagasaki. Two reasons may explain it. First, available jobs are concentrated in CBD. Meanwhile short distance between home and working place make people have less and shorter commuter trips. Individuals spend less money and energy on mobility goods. Therefore, they could spend more money on composite goods. Second, higher accessibility of public transport in CBD attributes to high energy efficiency. There are many choices of public transport modes in CBD, such as trolley car, bus and railway. High accessibility of public transport makes residents to choose mass transit. Moreover, limited parking place and high parking fee restrict the use of automobiles in CBD. Conversely, residents in suburban have no choice but using automobiles for transportation. As the budget of public transport decreasing, the density of mass transit decrease in urban and suburban, especially in suburban area. It definitely increases the individual cost of transport
6. Conclusions
Unlike previous studies which evaluated energy efficiency from technology point, this study focuses on energy efficiency based on energy consumption and quality of life. The study provides deep insights into consumption behaviors and energy use of individuals by evaluating energy efficiency through personal consumption behaviors. A model was built for maximizing energy efficiency based on consumption behaviors. It extends the concept of energy efficiency analysis to a very small aggregated level from a microeconomic viewpoint. Meanwhile it allows a more quantitative comparison of energy efficiency across different economy development backgrounds.
Three implications for the future policy making to improve energy efficiency in the residential sector are indicated based on present study. Firstly, it is possible to improve energy efficiency through consumption behaviors. Shift to low energy density consumption pattern will decrease the energy use. Therefore, eco consumption behaviors should be encouraged by policies to develop green consumption habit of residents. Secondly, attributes of building environment are important influential factors of energy efficiency. Mixture of job and living space attributes to shorter commuter trips and thus high energy efficiency. Planning for communities with compact and mixture land use should be encouraged. Lastly, it is important to increase the usage of public transport by increasing attraction of it through accessibility and service. These findings of the study could not only provide suggestions for urban planners in Nagasaki but also expand the field of analysis tool of policy making for governments aiming for high energy efficiency.
Author Contributions
Z.X. and Y.Y. dealt with literature review and article writing. Z.X. and Y.H. analyzed the data. Y.Y. conceived the research idea and the structure of the model. All authors contributed to the structure and aims of the manuscript, paper drafting, editing and review.
Funding
This research was funded by Zhejiang Provincial Natural Science Foundation of China, grant number Q19D010012. This work was supported by the K.C. Wong Magna Fund.
Acknowledgments
The authors are grateful to Shoshi Mizokami for his contribution to this analysis. We also gratefully acknowledge the data support from his lab at Kumamoto University.
Conflicts of Interest
The authors declare no conflict of interest.
References
- Billion-Dollar Weather and Climate Disasters: Overview. NOAA’s National Centers for Environmental Information (NCEI). Available online: https://www.ncdc.noaa.gov/billions/ (accessed on 23 March 2018).
- The Statistics Portal: Urban and Rural Population of China from 2006 to 2016 (in Million Inhabitants). Available online: https://0-www-statista-com.brum.beds.ac.uk/statistics/278566/urban-and-rural-population-of-china/ (accessed on 1 October 2017).
- Lundström, L. Adaptive Weather Correction of Energy Consumption Data. Energy Procedia 2017, 105, 3397–3402. [Google Scholar] [CrossRef]
- U.E. Energy Information Administration: How the United States Uses Energy. Available online: https://www.eia.gov/energyexplained/index.php?page=us_energy_use (accessed on 29 May 2018).
- Energy Related Carbon Dioxide Emissions. U.S. Energy Information Administration, 2014. Available online: http://www.eia.gov/environment/emissions/carbon/pdf/2014_co2analysis.pdf (accessed on 23 November 2015).
- Wu, Y.; Chen, J.; Song, X.; Shan, L. Relationship Between the Energy Consumption for Urban Residential Buildings and Residents’ Living Standards—A Case Study of the Four Municipalities in China. In Proceedings of the 20th International Symposium on Advancement of Construction Management and Real Estate; Wu, Y., Zheng, S., Luo, J., Wang, W., Mo, Z., Shan, L., Eds.; Springer: Singapore, 2017. [Google Scholar]
- Kumar, G.K.; Saboor, S.; Ashok Babu, T.P. Study of Various Glass Window and Building Wall Materials in Different Climatic Zones of India for Energy Efficient Building Construction. Energy Procedia 2017, 138, 580–585. [Google Scholar] [CrossRef]
- Yeo, Y.; Shim, D.; Lee, J.D.; Altman, J. Driving Forces of CO2 Emissions in Emerging Countries: LMDI Decomposition Analysis on China and India’s Residential Sector. Sustainability 2015, 7, 16108–16129. [Google Scholar] [CrossRef]
- Sophie, H. Invest in Clean Technology Says IEA Report. Available online: https://www.scidev.net/global/biofuels/news/invest-in-clean-technology-says-iea-report.html (accessed on 16 July 2010).
- Hao, H.; Liu, Z.; Zhao, F. An overview of energy efficiency standards in China’s transport sector. Renew. Sustain. Energy Rev. 2017, 67, 246–256. [Google Scholar] [CrossRef]
- Perea-Moreno, M.A.; Manzano-Agugliaro, F.; Perea-Moreno, A.J. Sustainable Energy Based on Sunflower Seed Husk Boiler for Residential Buildings. Sustainability 2018, 10, 3407. [Google Scholar] [CrossRef]
- Zhen, M.; Zhang, B. Energy Performance of a Light Wood-Timber Structured House in the Severely Cold Region of China. Sustainability 2018, 10, 1501. [Google Scholar] [CrossRef]
- Valinejad, S.M.; Shoubi, M.V.; Bagchi, A. Reducing the operational energy demand in buildings using building information modeling tools and sustainability approaches. Ain Shams Eng. J. 2015, 6, 41–55. [Google Scholar]
- Ouyang, X.; Lin, B. Analyzing energy savings potential of the Chinese building materials industry under different economic growth scenarios. Energy Build. 2015, 109, 316–327. [Google Scholar] [CrossRef]
- Palme, M.; Guerra, J.; Alfaro, S. Thermal Performance of Traditional and New Concept Houses in the Ancient Village of San Pedro De Atacama and Surroundings. Sustainability 2014, 6, 3321–3337. [Google Scholar] [CrossRef] [Green Version]
- Florentin, Y.; Pearlmutter, D.; Givoni, B.; Gal, E. A life-cycle energy and carbon analysis of hemp-lime bio-composite building materials. Energy Build. 2017, 156, 293–305. [Google Scholar] [CrossRef]
- Zhu, J.; Chew, D.A.S.; Lyu, S.; Wu, W. Optimization method for building envelope design to minimize carbon emissions of building operational energy consumption using orthogonal experimental design (OED). Habitat Internatl. 2013, 37, 148–154. [Google Scholar] [CrossRef]
- Lydon, G.P.; Hofer, J.; Svetozarevic, B.; Schlueter, A. Coupling energy systems with lightweight structures for a net plus energy building. Appl. Energy 2017, 189, 310–326. [Google Scholar] [CrossRef]
- Sharma, A.; Saxena, A.; Sethi, M.; Shree, V. Lifecycle assessment of buildings: A review. Renew. Sustain. Energy Rev. 2011, 15, 871–875. [Google Scholar] [CrossRef]
- Sartori, I.; Hestnes, A.G. Energy use in the lifecycle of conventional and low energy buildings: A review article. Energy Build. 2007, 39, 249–257. [Google Scholar] [CrossRef]
- Bezerra, S.A.; Santos, F.J.; Pinheiro, P.R.; Barbosa, F.R. Dynamic Evaluation of the Energy Efficiency of Environments in Brazilian University Classrooms Using DEA. Sustainability 2017, 9, 2373. [Google Scholar] [CrossRef]
- Biel, K.; Glock, C.H. Systematic literature review of decision support models for energy-efficient production planning. Comput. Ind. Eng. 2016, 101, 243–259. [Google Scholar] [CrossRef]
- Giannetti, C.; Ransing, R.S. Risk based uncertainty quantification to improve robustness of manufacturing operations. Comput. Ind. 2016, 101, 70–80. [Google Scholar] [CrossRef]
- Zhang, S.; Worrell, E.; Wina, C.G. Mapping and modeling multiple benefits of energy efficiency and emission mitigation in China’s cement industry at the provincial level. Appl. Energy 2015, 155, 35–58. [Google Scholar] [CrossRef]
- Han, L.; Han, B.; Shi, X.; Lei, X. Energy efficiency convergence across countries in the context of China’s Belt and Road initiative. Appl. Energy 2018, 213, 112–122. [Google Scholar] [CrossRef]
- Aste, N.; Buzzetti, M.; Caputo, P.; Del Pero, C. Regional policies toward energy efficiency and renewable energy sources integration: Results of a wide monitoring campaign. Sustain. Cities Soc. 2018, 36, 215–224. [Google Scholar] [CrossRef]
- Gregory, D.; Ron, J.; Geraldine, P.; Wats, M.; Whatmore, S. “Quality of Life”. Dictionary of Human Geography, 5th ed.; Wiley-Blackwell: Oxford, UK, 2009; ISBN 978-1-4051-3287-9. [Google Scholar]
- Gasper, D. Understanding the diversity of conceptions of well-being and quality of life. J. Socio-Econ. 2010, 39, 351–360. [Google Scholar] [CrossRef] [Green Version]
- Aoyama, Y.; Doi, S.; Nagkagawa, D.; Karatani, Y.; Chikanari, J. A study on traffic policy focused on mobility and energy efficiency. Infrastruct. Rev. 2006, 23, 887–894. [Google Scholar] [CrossRef]
- Sarkodie, S.A.; Crentsil, A.O.; Owusu, P.A. Does energy consumption follow asymmetric behavior? An assessment of Ghana’s energy sector dynamics. Sci. Total Environ. 2019, 651, 2886–2898. [Google Scholar] [CrossRef]
- Zhou, K.; Yang, S. Understanding household energy consumption behavior: The contribution of energy big data analytics. Renew. Sustain. Energy Rev. 2016, 56, 810–819. [Google Scholar] [CrossRef]
- Yin, Y.; Mizokami, S.; Maruyama, T. An analysis of the influence of urban form on energy consumption by individual consumption behaviors from a microeconomic viewpoint. Energy Policy 2013, 61, 909–919. [Google Scholar] [CrossRef]
- Agency for Natural Resources and Energy, Ministry of Economy, Trade and Industry. Statistic of prefecture energy consumption in Japan. Available online: http://www.enecho.meti.go.jp/info-/statistics/regional-energy.htm (accessed on 1 September 2016).
- Japanese Road Bureau, Ministry of Land, Infrastructure and Transport. The Method of Calculating Time Value and Running Fare Unit. Available online: http://www.mlit.go.jp/road/ir/iinkai/1pdf/s1-56.pdf/ (accessed on 2 April 2006).
- Japanese Statistics Bureau of Ministry of Internal Affairs and Communications. Available online: http://www.estat.go.jp/SG1/estat/eStatTopPortal (accessed on 23 March 2016).
- Japanese National Tax Agency HP, The Price of Land Fronting Major Roads and Railways. Available online: http://www.rosenka.nta.go.jp (accessed on 4 August 2012).
Figure 1.
Estimated zone energy efficiency in Nagasaki, (a) estimated actual energy efficiency, (b) estimated maximum energy efficiency.
Figure 1.
Estimated zone energy efficiency in Nagasaki, (a) estimated actual energy efficiency, (b) estimated maximum energy efficiency.

Figure 2.
CBD, urban and suburban in Nagasaki.


Table 1.
Actual and minimum energy consumptions (kcal/person·day).
| Actual | Estimated Minimum | |
|---|---|---|
| Total energy consumption | 2.81 × 10⁴ | 2.45 × 10⁴ (−12.8%) |
| Energy for composite goods | 2.08 × 10⁴ | 2.15 × 10⁴ (+3.3%) |
| Energy for car trips | 6.79 × 10³ | 1.63 × 10³ (−75.9%) |
| Energy for public transport trips | 5.92 × 10² | 1.37 × 10³ (+131%) |
Note: the data in () shows change rate of minimum energy compared to actual energy.
Table 2.
Estimated actual and maximum energy efficiency in Nagasaki.
| Estimated Actual | Estimated Maximum | |||||
|---|---|---|---|---|---|---|
| CBD | Urban | Suburban | CBD | Urban | Suburban | |
| Maximum utility | 9395 | 4939 | 4727 | 9757 | 5233 | 5063 |
| Energy consumption (kcal/person·day) | 51,830 | 27,814 | 27,627 | 43,060 | 23,458 | 23,120 |
| Energy efficiency | 0.181 | 0.178 | 0.171 | 0.227 | 0.223 | 0.219 |
© 2018 by the authors. Licensee MDPI, Basel, Switzerland. This article is an open access article distributed under the terms and conditions of the Creative Commons Attribution (CC BY) license (http://creativecommons.org/licenses/by/4.0/).
Share and Cite
MDPI and ACS Style
Xiang, Z.; Yin, Y.; He, Y. A Microeconomic Methodology to Evaluate Energy Efficiency by Consumption Behaviors and Strategies to Improve Energy Efficiency. Sustainability 2018, 10, 4327. https://0-doi-org.brum.beds.ac.uk/10.3390/su10114327
AMA Style
Xiang Z, Yin Y, He Y. A Microeconomic Methodology to Evaluate Energy Efficiency by Consumption Behaviors and Strategies to Improve Energy Efficiency. Sustainability. 2018; 10(11):4327. https://0-doi-org.brum.beds.ac.uk/10.3390/su10114327
Chicago/Turabian StyleXiang, Zixia, Yanhong Yin, and Yuanwen He. 2018. "A Microeconomic Methodology to Evaluate Energy Efficiency by Consumption Behaviors and Strategies to Improve Energy Efficiency" Sustainability 10, no. 11: 4327. https://0-doi-org.brum.beds.ac.uk/10.3390/su10114327
Note that from the first issue of 2016, this journal uses article numbers instead of page numbers. See further details here.