Exploring the Role of Mountain Origin and Autochthonous Breed on Urban Consumers’ Acceptability


1
Department of Agriculture and Agricultural Economics, University of Zaragoza, C/ Miguel Servet, 177, 50013 Zaragoza, Spain
2
Agrifood Institute of Aragón (IA2), University of Zaragoza-CITA, 50013 Zaragoza, Spain
3
Agrifood Research and Technology Centre of Aragon (CITA), Agro-Food Economics and Natural Resources Department, Avda Montañana 930, 50059 Zaragoza, Spain
*
Author to whom correspondence should be addressed.
Sustainability 2018, 10(12), 4423; https://0-doi-org.brum.beds.ac.uk/10.3390/su10124423
Submission received: 26 September 2018
/
Revised: 5 November 2018
/
Accepted: 9 November 2018
/
Published: 26 November 2018
(This article belongs to the Special Issue Local Food Initiatives in the World’s Cities)
Abstract
:In the last decades, the European Union (EU) agricultural policy has encouraged extensive livestock farming systems as a sustainable way of production, while more recently, voluntary certification schemes on mountain origin and autochthonous breeds have been put in place to further contribute to the preservation of biodiversity and economic activity in mountainous areas. The aim of this study is twofold: first, to investigate the role of the mountain origin and local autochthonous breed certification on urban consumer’s acceptability; and second, to compare consumer’s overall acceptability at central location versus home-based. These two specific objectives are designed to better ascertain the suitability of these voluntary certifications as a marketing tool that helps to bridge the gap between urban consumers’ beef choices and rural sustainability. Main methods of analysis included internal preference mapping and cluster analysis. Findings suggested that both claims, mountain origin (Pyrenean in particular) and autochthonous breed conveyed relevant information to consumers at the moment of testing, while the former played a stronger role on hedonic valuations. We have found that the environmental setting significantly influences acceptability with higher ratings obtained in the home test. A small niche market for Pyrenean cattle breeders was also detected, while reaching the larger and more product involved segment of urban consumers would require further marketing actions.
1. Introduction
A potential rise in urban demand for pre-packaged and labelled fresh meat (and beef in particular) could be expected accompanying the current trends in purchasing habits, where the traditional channel (i.e., butcher’s) is losing weight in favor of super/hypermarkets or online shopping. Thus, providing information in the labelling about specific key attributes could help the choice of sustainable meat in urban markets. Examples of such key attributes are mountain farming and autochthonous breeds, and respective voluntary certification schemes have been put in place in the European Union (EU) to contribute to the preservation of biodiversity and economic activity in mountain areas. This paper contributes to the scarce literature in the context of (sensory) acceptability and the role of information, and to the authors’ knowledge, this is the first paper investigating whether urban consumers’ (hedonic) preferences move towards more differentiated fresh meat, and to what extent, sustainable claims linked to the origin and breed, have an impact on acceptability. Central location tests are the usual approach to analyze consumers’ acceptability, and in this paper, we explore if moving to an environmental setting closer to a daily consumption situation has an impact on the hedonic preferences and the response shift elicited following the information display. This last aspect is relevant as it allows a closer approximation to the potential performance of the products in the market place.
In the last decades, the EU policies have given support to extensive livestock farming systems in general, and more recently, to mountain farming areas in particular, as a sustainable way of production. These systems may satisfy urban consumer demands related not only to the provision of food products but also of a wide range of public goods and positive externalities, such as the preservation of the rural cultural heritage, landscape, biodiversity, and the development and maintenance of rural communities and its population. Likewise, most of these livestock systems are also linked to the preservation of mountain areas and autochthonous breeds [1,2]. The Aragonese region, where this study is carried out, is located in the Northeast of Spain. This region has a long tradition of beef production and consumption, with the presence of autochthonous breeds (e.g., ‘Parda de Montaña’ and ‘Pirenaica’). More specifically, there are extensive cattle farming systems based on local breeds in the Pyrenean valleys of this region, which are characterized by the abundance of pastures. Despite these breeds are still not endangered, the continuity of local livestock systems could be better guaranteed by developing calves’ production systems according to the new market demands.
Traditionally, consumers have based their decisions on what can be considered as search and experience attributes, depending on if they can be assessed either prior (e.g., color) or after consumption (e.g., tenderness), respectively [3]. In absence of further guarantees, the high variability in generic meat quality makes consumers’ perception difficult at the moment of choice. In this sense, recent studies report that consumers are increasingly relying on non-sensory attributes, which cannot even be evaluated at the consumption stage and may not necessarily improve their sensorial valuation [4,5]. This is the case of credence attributes [6], which may provide information to the consumer through a certification or guaranty usually included in the label, turning this attribute into a search cue. The geographical origin is considered a relevant credence attribute, ranging from country, region to local definitions. Consumers’ ethnocentrism favors preference for food originating from the consumers’ own provenance [7], while quality associations with specific producing areas may also be reinforced the narrower the area limits are. Thus, the regional [8] and local origins [9] have been found to trigger a more powerful credence signal than the country of origin in specific food products.
Despite the European Union has recently regulated the requirements for a voluntary quality scheme of mountain food products [10], it is still not clear the role that this information plays on consumers’ choice. Although we may expect a positive influence when considered isolated, its relevance is unknown when it is presented in combination with other attributes (such as the breed versus the origin), or varying levels of origins (national, regional or Pyrenean origin). Thus, the literature on the influence of the Pyrenean origin, in particular, or any other mountainous area in consumers’ preferences for beef (or other meats) has been scarcely analyzed to the authors’ knowledge. A relevant exemption is Sanjuán and Khliji [11], who found, however, a prevalence of regional over Pyrenean origin. In addition, despite the literature supports that the breed information by itself is not crucial in determining consumers’ meat choices, the implicit local or regional origin connotation of the autochthonous breed claim may well reinforce the breed impact [2,12]. In this sense, some EU countries, including Spain, have recently implemented national programs to promote this differentiation tool [13]. Moreover, mountain farming and autochthonous breed quality schemes can also be combined with earlier figures, such as Protected Geographical Indications (PGI) [11] (PDO and PGI guarantee the origin and the compliance of the product with specific standards of quality regulated by a Code of Practice. The EU established these quality labels in 1992 (last update is Regulation (EU) 1151/2012 [14]).
Most of the sensory studies on beef focus on the comparison between trained panels versus untrained consumers, on the analysis of different sensory attributes, and blind tests carried out in a laboratory or central location setting [15]. However, in order to mimic a more real-life consuming experience, and for marketing purposes in general, it is especially valuable to investigate not only blind but also identified valuations, as well as the impact of non-sensory attributes information on consumers’ likings [16]. Note that non-sensory attributes can be observable by the consumer, not only at the moment of consumption, but also of purchasing as they can be printed in the label (e.g., EU mountain farming or autochthonous breed logos). Moreover, the experimental environment and the tasting conditions are likely to influence these ratings. Thus, in a usual consumption context, several factors are simultaneously interacting, such as the way of preparing the beef at home with the preferred degree of doneness, the possibility to add any seasoning, as well as the consumption of the product in a more familiar atmosphere. Accordingly, in this paper the ratings elicited in a central location test are compared with the ones obtained with a home-based test, allowing the consumer to choose the aforementioned items within certain parameters.
The aim of this study is twofold: first, to investigate the role of the mountain origin and the autochthonous breed claim on urban consumer’s acceptability; and second, to compare consumer’s overall acceptability at central location versus home-based. These two specific objectives are designed to better ascertain the suitability of the voluntary certification of local autochthonous breeds and mountain labelling as a marketing tool that helps to bridge the gap between urban consumers’ beef choices and the sustainability of autochthonous livestock production systems.
2. Materials and Methods
2.1. Products
As Table 1 shows, five beef loin samples were compared under blind and identified conditions. The samples were characterized according to: (i) origin, as being produced either in a well-known area for beef production (the Pyrenees in the region of Aragon), or the region of Aragon (which is the region where the study was carried out) or in the country of Spain; and (ii) breed, either autochthonous (Parda de Montaña), not autochthonous (Limousine), or without providing breed information.
2.2. Consumer Selection and Test Procedure
Between the end of 2012 and the beginning of 2013, 277 consumers participated in the hedonic tests. Tests were carried out in the main city of Aragon (Spain). This medium-size city is equally-distant from the Spanish main cities, and it has been identified within the literature as representative of the national population trend in terms of both, urban purchasing and consumption habits of a wide range of food products, and consumer’s socio-economic profile [17,18,19]. Consequently, it has been frequently used for testing novel food products before launching them to the urban markets. In this study, the tests were carried out in a familiar setting named central location, mainly civic centers and citizen associations’ headquarters, in different locations of the city. Sessions were organized from Monday to Saturday with a flexible schedule. Consumers received 10€ for participating in the study. The recruitment process and the test procedure followed mainly Sanjuán-López et al. [16], adapting them to the peculiarities of the product evaluated (beef). The sampling method was a stratified one. Thus, individuals were randomly selected to ensure that at least gender, age, income, and education levels of the participants in the sample were representative of those of the regional population (Aragon). Additionally, the respondents had to meet three criteria: being over 18 years old, consume beef, and regularly participate in food shopping. The tests lasted between 35–45 min. Each consumer was asked to evaluate five samples of beef in two experimental settings: first, blind, and second, informed. The identified test was performed in two different environments: 144 consumers evaluated the samples at the central location (CL) and 133 at home (H). In a real-consuming experience, information about the product is available to the consumer and therefore the identified test is closer to a real consumption situation. Besides, the home environment adds an extra layer of reality, not only because the consumer can feel more at ease but also because he/she can add the seasoning and choose the level of beef doneness according to his/her own taste (within certain limits imposed by the experiment, see later).
Consumers were asked to report their overall liking of the samples using a structured line scale (0–100 mm), with hedonic references ranging from 0 = ‘I do not like it at all’ to 10 = ‘I like it very much’. The samples were placed on a plastic plate and served following William’s Latin squares balanced for order and first-order carry over effects [20,21] in a monadically sequential order of presentation. In the blind test, the presentation order changed across consumers, while in the informed test, the order changed across sessions. Water and toasts were available and recommended in order to clean the palate after each sample. Each sample of strip loin was cooked on a grill at 200 °C until reaching an internal temperature of 70 °C according to the American Meat Science Association Guidelines (AMSA) [22], to a medium degree of doneness [23] and divided after cooking into 2.5 × 2.5 cm portions. Then, they were covered in aluminum foil and labeled with a three-digit code. Samples were directly served to consumers just after cooking.
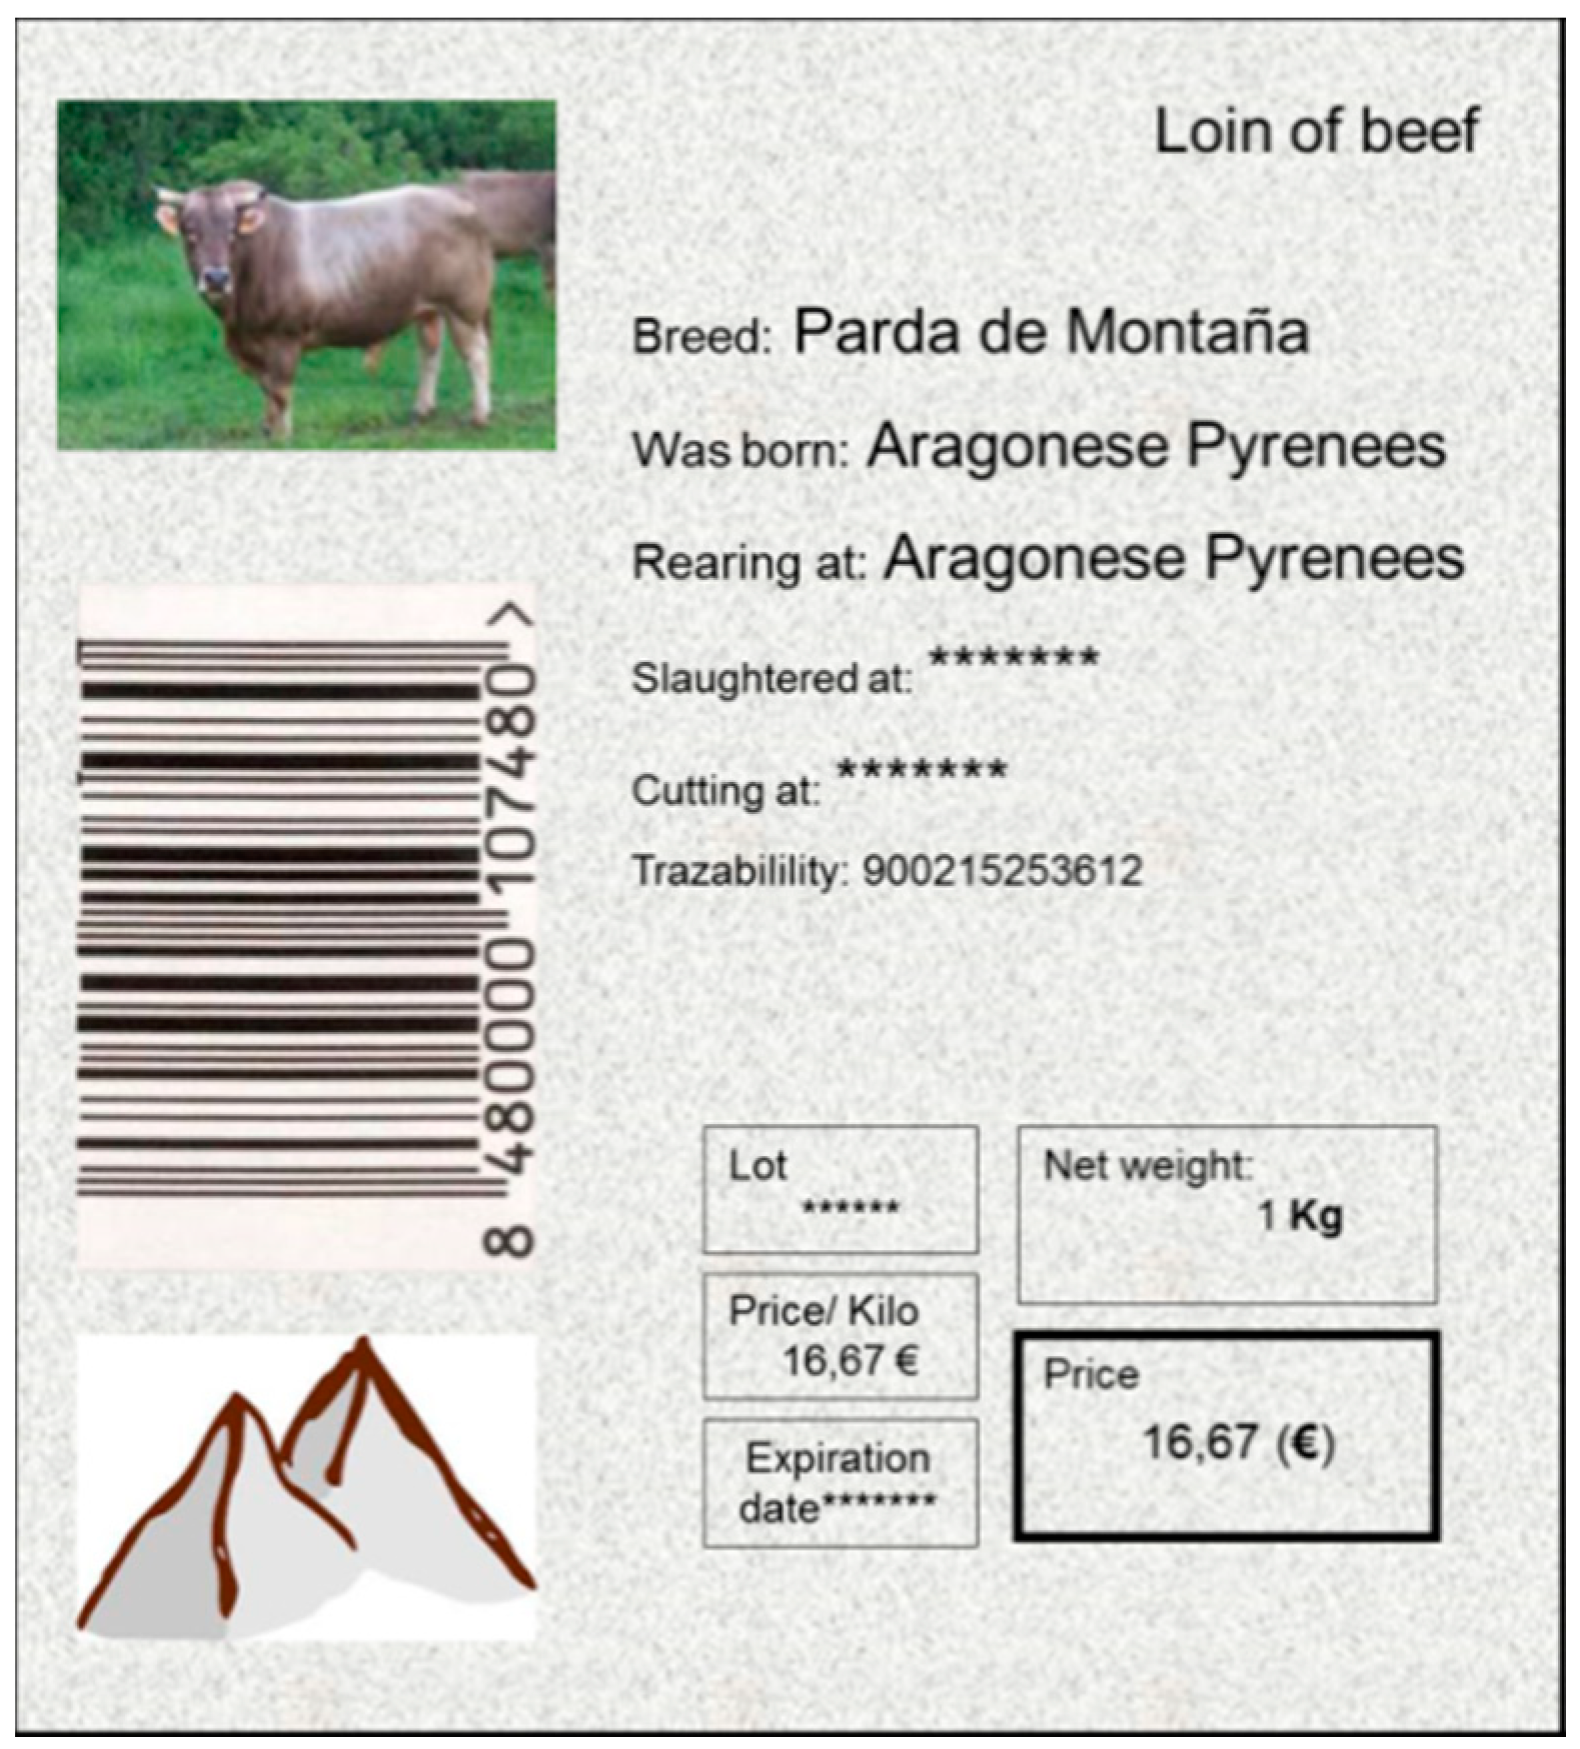
Before the first (blind) test and as part of the decision framing [24], consumers were asked to imagine themselves having their own cooked meal at home in order to put them in a more familiar consuming context. Between blind and identified tests there was a 15 min break during which a questionnaire was administered. The questionnaire was structured in the following order: first, beef purchasing and consumption habits; second, cattle breed awareness; and third, socio-demographics. In the identified tests, each participant was provided with a set of printed labels visually resembling real ones aiming at mimicking a real consumption situation, where the label can be found attached to the packaged fresh beef. The label only contains the corresponding level of the origin and breed attributes, without a full description of these items. The picture included in the label was common for all samples and its goal was purely esthetic. These labels were ordered in the same sequence as the samples to test (see Figure 1).
Those consumers who evaluated the samples at home were provided with a vacuum-packaged steak of each sample (60 g) coming from the same muscle than in the CL test. Consumers received some instructions to guide them on how to develop the home test. They were contacted by phone to get their ratings and responses; the phone contact was also useful for detecting if they had correctly followed all the indications. More specifically, they had to respect the order of samples presentation provided, drink water between each of the samples, and not to drink soft drinks or alcoholic beverages before the test. Despite they could share the sample with their relatives, they had to express their own valuation to reduce the family halo effect [25]. They had freedom to add any seasoning or accompaniment, as well as to choose the level of doneness, although the same recipe had to be used for all samples. In fact, given the format presentation, grill was the most obvious cooking option. Information concerning the use of any seasoning or garnish, and the degree of beef doneness was also recorded through the questionnaires.
2.3. Statistical Evaluation
2.3.1. Univariate and Bivariate Statistics
Average overall liking scores for each sample in each environmental setting were compared using standard statistical tests. Applying the central limit theorem, a ‘normal’ sampling distribution was assumed and therefore parametric tests were applied. Two-way ANOVA with interaction was applied to investigate if consumer scores differed across testing conditions and samples (p ≤ 0.05). A one-way ANOVA test was also conducted to evaluate the statistical difference in means across the whole set of product samples (p ≤ 0.05). After conducting the Levene test for equal variances, and in the presence of homogenous variances, Tukey’s Honestly Significant Difference (HSD) test was used to detect the presence of differences in means across specific pairs of samples. In contrast, Games—Howell test was applied under non-homogenous variance.
A paired-samples t-test statistic was applied to evaluate the statistical differences between mean scores for each of the five common samples under different information conditions (informed and blind test), within each of the experimental settings. Besides, the chi-square test statistic (p ≤ 0.05) was applied to evaluate the presence of statistical differences between socio-demographic characteristics of consumers in different clusters defined in terms of informed ratings (see below). Statistical analyses in this section were carried out with IBM SPSS Statistics 22 (IBM, New York, USA) and STATA 14 (StataCorp, Texas, USA).
2.3.2. Multivariate Statistics
In this section, we first apply an internal preference mapping to find hedonic preference patterns; and second, we classify consumers with similar patterns through a cluster analysis. The goal is first, to evaluate the presence of heterogeneity in informed scores, and second, if such a heterogeneity exists, to group consumers into segments that could become relevant for marketing purposes of the Pyrenean and autochthonous breeds, in particular. As such, we will focus on the informed scores elicited at home as a closer context to a usual consumption situation.
Internal Preference Mapping
The internal preference mapping (MDPREF) is a bi-dimensional map that helps to show the presence of heterogeneity in consumers’ scores, analyzing individual hedonic ratings instead of average ones. This technique allows a visual representation of consumers with similar hedonic patterns and the identification of their most preferred samples. Unlike other mapping techniques (external preference or projective mappings), the internal preference mapping does not focus on identifying the sensory descriptors that drive consumers (or trained panels) preferences. Therefore, the internal preference mapping can be more suitable to explore the influence of non-sensory attributes (including varying levels of origin and breed) on consumer’s acceptability. It may also be helpful at providing a whole picture of consumer’s acceptability before grouping consumers through a cluster analysis. Previous to further analysis, consumer’s ratings were standardized to remove the scale effect. Then, a Principal Component Analysis (PCA) was applied to the identified ratings. For each beef sample, the coordinates on the preference space determined by the first two components were kept. Next, consumer’s ratings were regressed onto these coordinates, and plot into the MDPREF. XLSTAT 2018 (Addinsoft, New York, USA) statistical package was used for this purpose. Further information concerning internal preference mapping can be consulted in [26]. Some applications for meat products include [27,28], who also explained the advantages, from the marketing perspective of conducting a MDPREF versus the external preference mapping (i.e., based on trained panel evaluation).
Cluster Analysis
Finally, using only informed ratings recorded at home, a cluster analysis was conducted in order to classify consumers into groups with distinct sensory patterns. In particular, an Agglomerative Hierarchical Clustering (AHC) test based on Wards’ agglomerative method was used [29]. The number of clusters was chosen from the dendrogram. This technique, comparing to k-means clustering, has the advantage of not requiring the user to specify the number of clusters a priori. XLSTAT 2018 statistical package was used for this purpose.
3. Results and Discussion
3.1. Participants Profile
Table 2 shows the absence of statistically significant differences between either our consumers’ sample or each of the subsamples and the population in terms of gender, age, and level of income and education. In this sense, they are representative of the population. As Table 2 shows, slightly more than half of the participants were female (53%), between 35 and 64 years old (56%), with a household’s net income between 1150 and 3000 €/month (55%), which can be considered a low-medium interval, and almost half of the respondents have achieved secondary studies (46%). Moreover, no significant differences were found between participants in the two experimental settings where the identified test was conducted (CL and H tests), except for age. In this way, 31% (versus 15% in the H test) of consumers only evaluating beef in the central location were older than 65 years old, while 40% (versus 56% in the H test) were between 35–64 years old.
3.2. Consumers’ Acceptability: The Role of Origin and Breed
The two-way ANOVA test shows that there are significant differences across average scores assigned to the five samples in the two information conditions (F-ratio: 13.15, p ≤ 0.001, whilst the one-way ANOVA test reveals the presence of significant differences in each information condition (blind: F-ratio: 6.54, p ≤ 0.001; identified: 7.20, p ≤ 0.001). After confirming the presence of equal variances, the subsequent application of the Tukey test detected significant differences for the full sample of consumers between pairs of meat samples.
Table 3 presents average acceptability scores across the different information conditions and environmental settings. In the two first columns of Table 3, results show that the ratings assigned to each of the samples in the two information conditions (blind and identified test) are above the central point of the scale. Therefore, we conclude that all the samples are characterized by presenting a good acceptability.
In the blind test, findings suggest the presence of roughly three groups of samples with relatively homogeneous ratings. In general terms, the national origin got the highest ratings (NNS), followed by the regional one (RNA and RNS), while the lowest scores were assigned to the Pyrenean sourced beef (PA and PNS).
In the identified test, the Pyrenean samples were clearly distinguished from the remaining ones. Noticeably, the lowest scores attached to the Pyrenean sourced beef in the blind test turned to be the highest in the identified test. Thus, the general ranking was inverted. Notwithstanding, in both testing conditions, there was a certain degree of heterogeneity. This issue will be revisited in Section 3.3. In the following subsections, the role that origin and breed play on consumer’s acceptability is analyzed first, in combination with the impact of the environmental setting (see next subsection), and second, considering the difference between the blind and identified rates (see Section 3.2.2).
3.2.1. The Impact of the Environmental Setting
The identified evaluations can also be analyzed distinguishing between the central location and home tests results (the third and fourth columns in Table 3, respectively). Thus, while in the central location the results show the absence of significant differences across average scores (F-ratio: 1.57, p: 0.180), significant differences were found on the five samples when evaluated at home (F-ratio: 9.63, p ≤ 0.001). This result points out the influence of the experimental setting on consumers hedonic valuations.
Average informed scores for each of the five meat samples elicited at home were significantly higher than those elicited at the central location. This result is in line with previous studies evaluating meat [15], or other products such as chocolate bars [32]. More specifically, this difference ranged from 0.529 points in the autochthonous breed coming from the Aragonese Pyrenees (PA) to 1.338 in the unspecified breed sharing the same origin (PNS). Similarly, although evaluating goat meat in a blind test, Guerrero et al. [15] obtained that the home-blind test scores were between 0.15 and 0.96 points higher than in the laboratory test. In our study, the difference is even higher (on the same scale), which could be explained, among other factors, by the more flexible way of preparing beef at home or the possibility to add different seasonings. In the study carried out by Guerrero et al. [15], only salt was suggested as flavoring, and an easy way of preparing the meat was recommended. In the same way, Karin et al. [32] found a difference ranging between 0.8–1.1, when significant. In this case, the scale was a 9-point hedonic one. It seems reasonable to expect bigger differences when the product needs to be cooked and personal taste on seasoning among other factors can contribute to make a product more likeable, as well as when a longer scale is employed.
Summing up, this paper contributes to the existing literature confirming that the closer the testing situation developed at home to an usual consumption one, the higher the gap between the laboratory test and the home use test ratings, as well as providing relevant factors which may influence this difference, which have been scarcely analyzed within the literature. Thus, the hedonic valuations were, in general, influenced by the seasoning and end-point preferences. While the ranking of meat samples was practically not altered, the ratings were clearly higher when moving to an environmental context more in accordance with consumers’ tastes and familiarity. In those cases where the seasoning or the degree of doneness does not seem to have had an impact on the valuation, the higher values assigned at home with respect to the central location, could still be explained by a more relaxed and familiar atmosphere.
3.2.2. The Impact of Information
In the last three columns of Table 3, the average difference between identified and blind likings (In - Bn) in the full sample (fifth column) and in each of the subsamples (sixth and seventh columns) is listed. According to these results, the provision of non-sensory information affected significant and positively consumers’ hedonic valuations (see below), but to a different extent depending on the environmental setting (see Section 3.2.2.2).
3.2.2.1. The General Impact of Information
Considering the whole sample of consumers, the difference between the identified and blind ratings ranged from 0.412 in the regional sample (RNS) to 1.412 in the Pyrenean sourced beef (PA and PNS), with significant differences in three out of the five samples. Previous studies reported a minor difference between these two information scenarios, when adding information concerning the farming system (conventional or ecological) [33], the production system (grazing or feedlot) and the level of marbling [34], and the slaughtering age [35]. Thus, Napolitano et al. [33] found a discrepancy of 0.45 using a 9-point hedonic scale, Morales et al. [34] showed a similar discrepancy of 0.46, but using a 7-point scale, while Beriain et al. [35] failed to find any significant impact of slaughtering age information. Notwithstanding, the impact of origin information on consumer acceptability has been shown to be strong also in other meat products, such as dry-cured ham [8].
3.2.2.2. The Impact of Information in a Specific Environmental Setting
Informing about the Aragonese Pyrenees origin raised a significant effect in the central location test (PA and PNS), while information on both, origin and breed (or lack of breed), affected hedonic ratings in the home test (the impact being only weak when combining regional and non-autochthonous breed—RNA—though). This fact suggests that the impact of information plays a more relevant role in the home test and, in particular, this impact is significantly sharper in the breeds reared in the Pyrenees. Taking into account the scarcity of the literature, the closest reference is Sanjuán and Khliji [11], which, however, is not about hedonic valuations but rather about choice and willingness to pay. Interestingly, the authors found a moderate impact of the Pyrenean origin on consumers’ choice while the explicit recognition of the breed triggered a more substantial impact on final choices. Our findings, however, appear to be more favorable to the Pyrenean origin, at least as a trigger for acceptability, while if acceptability is a precursor of final purchase needs to be furtherly investigated, since is out of the scope of the current paper.
3.3. Internal Preference Mapping and Clustering
So far, mean scores have been analyzed, while the standard deviations suggested the presence of a certain degree of heterogeneity across consumers. In this section, first, we will confirm such heterogeneity in informed scores through an internal preference mapping and second, after confirmation, we will group consumers into clusters and describe their profile, to inform stakeholders about the most interesting urban markets’ segment to target a promotion campaign of both quality schemes, mountain farming and autochthonous breed.
3.3.1. Internal Preference Mapping
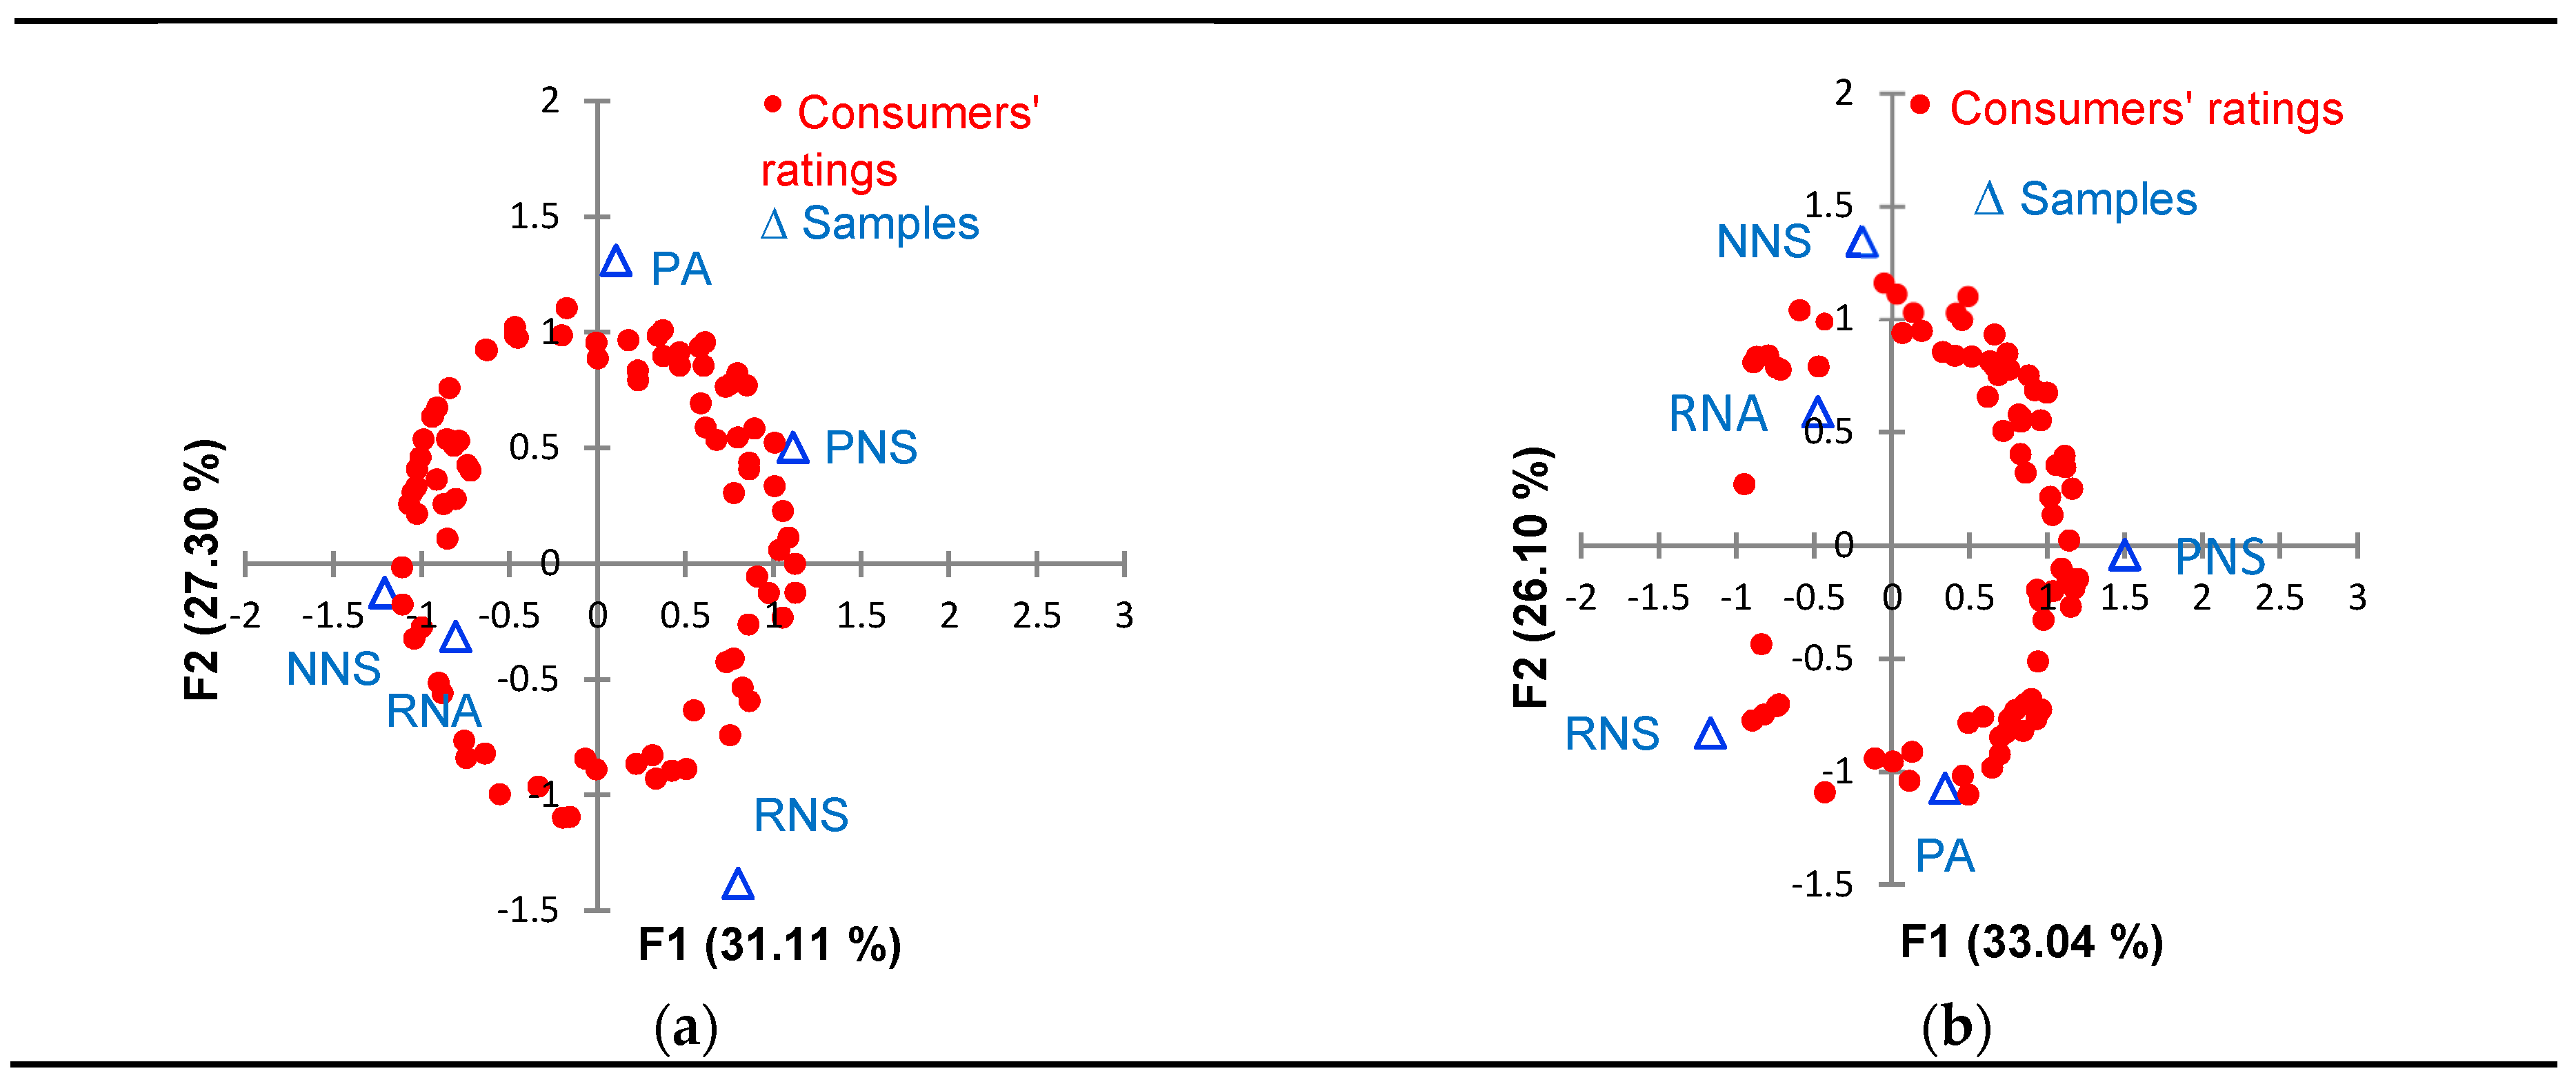
The internal preference map for the five samples evaluated in the central location test is shown in Figure 2a. In this identified test map, the two first factors accounted for 58.41% of the explained variance, accounting for 59.14% in the home use test (Figure 2b). Consumers are scattered differently depending on the experimental setting. Thus, in the central location test, consumers are more equally distributed across the four quadrants of the map than in the home-based test, reflecting more heterogeneous hedonic preferences. In other words, there is a substantial number of consumers with clear preferences towards each of the five products analyzed. In the home-test, however, acceptability is clearly more concentrated in the right quadrants, where the samples of Pyrenean origin are located (PA and PNS), implying that these are the most preferred samples.
3.3.2. Cluster Analysis
The heterogeneity observed in identified scores motivated the search for segments of consumers. Thus, after applying an AHC, two clear segments emerged.
Consumer’s Segment Profile: Hedonic Preferences
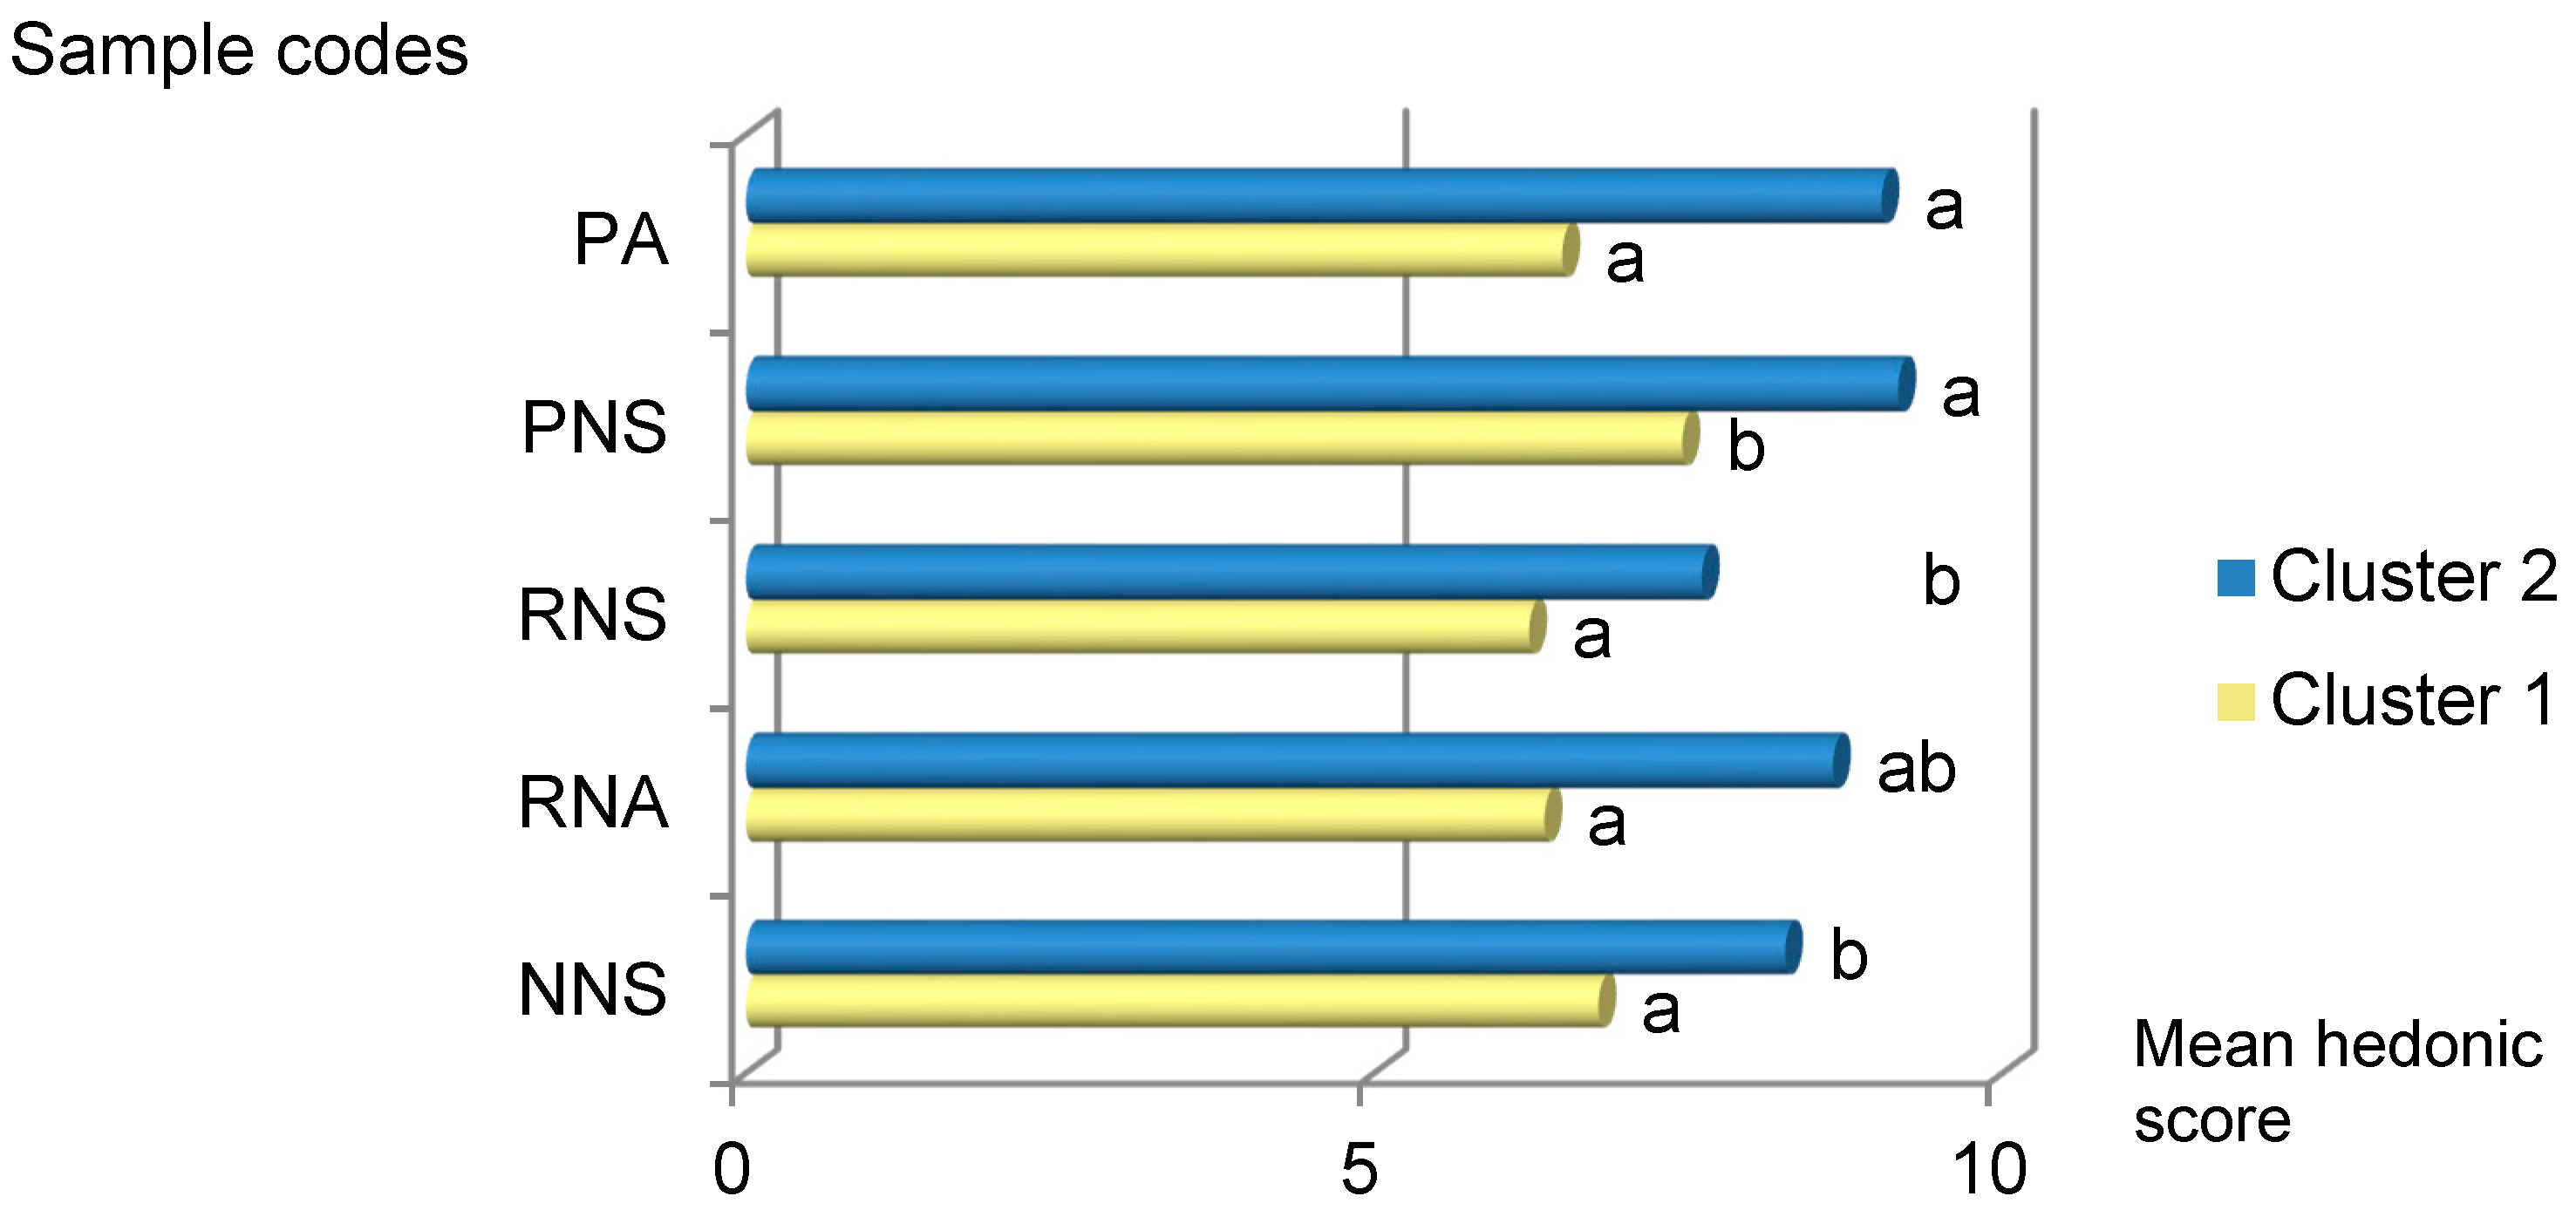
In order to gain insight into the clusters’ hedonic profile, one-way ANOVA was applied to test if average scores for the five samples differed significantly within each cluster. The F-ratio test for each of the two clusters is 9.930 (p-value: 0.001), and 8.924 (p-value: 0.001), respectively, confirming the presence of significant effects across samples. A pair-wise t-test was then applied to ascertain between which specific pairs of samples the averages differed. Tukey HSD was applied in cluster 1, and Games-Howell, which does not assume equal variances, in cluster 2 (following the results of the Levene statistic). Average scores per cluster in Figure 3 indicate a clear split into two groups of samples: in cluster 1, acceptability of the sample coming from the Aragonese Pyrenees with an unspecified breed (PNS) is significantly different from (and higher than) the remaining samples; in cluster 2, the split is between samples with Pyrenean origin (PA and PNS) and the remaining (with higher acceptability of the former), although the average acceptability of the regional non-autochthonous breed product (RNA) is statistically indistinguishable from both groups.
Summing up, considering the information provided by Figure 3, one segment was favoring the Pyrenean non-specified breed product (PNS) (cluster 1), and the second one, favored both Pyrenean sourced samples over the rest (PA and PNS). Figure 3 also shows that cluster 1 assigned a lower rating than cluster 2 to each of the samples. Taking into account these features, we tentatively named cluster 1 as “Hedonically demanding” and cluster 2 as “Pyrenean sourced prone”. It is also interesting to note that the second cluster, with a clear hedonic preference towards the Pyrenean beef, is much smaller (16% of the consumers), and in this sense, it agrees with the results by Sanjuán and Khliji [11], where only a small segment in Aragon was really willing to pay a premium for such origin.
Consumer’s Segment Profile: Socio-Demographics and Tasting Preferences
The socio-profile, as well as the tasting preferences differs between both clusters. In Table 4, the two clusters and the whole sample profile are described in these terms. The chi-square test reveals a significant association between the cluster membership and some of the consumer characteristics. Nevertheless, non-significant characteristics are kept in Table 4 to provide more information concerning each segment. In relation to socio-demographic characteristics, the second cluster identified as “Pyrenean sourced prone” is composed in a larger proportion by women (62% vs. 52%, although not statistically significant), older (with a less percentage of medium-age consumers, being 38% vs. 59% between 35 and 64 years old, and a higher percentage of older than 65 years old, 33% vs. 12%); which had achieved a lower level of education (with a higher percentage of primary studies (29% vs. 12%), and a lower percentage with a university degree (24 vs. 39%).
Regarding the tasting preferences of the whole sample (see the third column), the results indicate that all the consumers added at least one seasoning to enhance the taste of beef at home. In particular, all of them added salt or oil at the moment of consumption or cooking (not shown in Table 4), while the majority of them added at least two condiments. For instance, 80% added salt and oil (Table 4). Moreover, those consumers who added any spice, they added it in combination with salt (86% of them) or oil (86% of them). The use of similar condiments could be expected, taking into account the culinary skills of participants, and their cultural roots with the Mediterranean diet. By order of importance, the most common seasoning was oil (91%), followed by salt (89%) (not shown in Table 4), and spices (16%), mainly ground pepper and garlic. In addition, 31% of consumers added a side dish (mainly French fries or salad), while 26% of them preferred samples at higher or lower temperature than the medium one. Moreover, the highest identified ratings were assigned when the consumer added some condiment, although this difference was not always significant, therefore it was not finally included in last version of the paper. Details are available upon request.
Cluster analysis has been demonstrated within the literature to be effective at grouping consumers following their preferences of beef tested with different seasoning or culinary practices, such as using coatings with different seasoning [36] or at different end-point temperatures [37]. Thus, consumers belonging to the first cluster named “Hedonically demanding” enhanced less the natural flavor of beef by adding salt and oil (76% of them), whereas almost all the consumers (95%) in the second cluster identified as “Pyrenean sourced prone” had added this seasoning to the samples. In contrast, there were not significant differences between clusters regarding the use of spices, that nevertheless, were used little in comparison to salt and oil (18% vs. 76%; 10% vs. 95% in the first and second clusters, respectively). Concerning the level of doneness, cluster 1 preferred less tasting a rare or well done cut of beef at home than cluster 2, while in the second cluster, approximately half of the consumers showed a preference for a specific degree of doneness different to the medium one (22% in the first cluster versus 48% in the second one). In other words, cluster 1 doneness preference was more in line with the medium degree of doneness provided at the central location, while cluster 2 had more extreme preferences that could be better accommodated in the home test experiment. As a result, the possibility of adapting doneness to personal taste may affect those consumers who are more sensitive to this characteristic in a favorable way, probably being less demanding at the moment of rating. Following the consumer behavior literature, under this assumption, consumers’ judgements are influenced by their attempt to be self-consistent with their previous choice, reflecting a post-rationalization of the previous behavior [38]. This fact may explain, at least to a certain extent, that the second cluster gave higher ratings than the first one.
Consumption frequency reveals that consumers in the “Hedonically demanding” cluster consumed more frequently beef at home (83% consumed at least once a week) than in the “Pyrenean sourced prone “cluster (70%). A higher consumption frequency could imply a higher experience with the product [39], and higher taste sensitivity [40]. This factor may also help to explain that consumers in the first cluster were more demanding compared with the second cluster.
Results also show that consumers in the first cluster knew more cattle breeds in general (66% versus 48% in the second cluster), and in particular the non-autochthonous breed “Limousine” (27% versus 10% in the second cluster), whereas no significant differences were found in the case of the local autochthonous breed “Parda de Montaña”. A higher level of cattle breed awareness may be related to a higher experience and involvement with beef, which may imply assigning more demanding ratings in general.
In addition, consumers in the “Hedonically demanding” cluster knew more (55% versus 33%) and purchased more regional quality certified labelled beef (33% versus 14%). This fact may be linked to a certain extent to the rooting of the consumer to their region of origin, since 71% in the first cluster (vs. 55% in the second one) had spent all their lives in Aragon, the region where the study was carried out. Combining this result with the previous one, we can infer that despite the link of the consumer with the own region of origin can be interpreted as a possible source of ethnocentrism, it does not necessarily imply a higher local autochthonous breed awareness, and neither have a strong hedonically positive impact over its ratings.
4. Conclusions
In the European Union, the autochthonous breed and mountain labelling are voluntary schemes available for farmers and processors to identify and differentiate their meat products in the market, with the final goal of contributing to the sustainability of rural communities as providers, not only of high quality food but also of ecosystem services. This paper represents a first step into analyzing the impact of the mountain and autochthonous breed claim on consumers’ acceptability of beef. A second novelty of the paper lies on comparing informed ratings under two alternative environmental settings, home-base, and central location. In contrast, most of the previous studies focus either on other beef attributes, on trained panels, and blind tests. The rationale behind our approach responds to reduce the gap between experimental and real consumption situations, in order to get a closer approximation to the potential performance of the products in the market place.
Our results suggest that the claims of Pyrenean origin and autochthonous breed convey relevant information to consumers, and hedonic valuations are raised accordingly in the identified test. Therefore, the currently under-used quality schemes could be successful in promoting mountain and autochthonous beef breeds consumption. Nevertheless, the intrinsic quality properties of the meat need to be maintained or even improved to motivate future consumption, as blind acceptability reveals a close competition with other regional or national products.
Interestingly, we also find significant differences in the ratings between the two environmental settings where the identified test was carried out, with higher ratings obtained in the home test than in the central location setting. In previous literature on home use tests to evaluate consumers’ acceptability, the degree of testing discretion is still highly constrained. Consequently, home and central location ratings obtained are relatively close to each other, probably because consumers still perceive this home test as a laboratory experiment. In contrast, in our study, we gave more freedom to adapt cooking to the consumer’s personal taste, and as a result, a higher divergence with blind scores is obtained, and the impact of information on origin and breed is reinforced. These results indicate that laboratory data based on the central location test could be used but only partially as a predictor of consumer liking at home.
Our analysis has also detected a small niche market (16%) for Pyrenean cattle breeders composed by a bigger proportion of older people, women, who do not like medium doneness, with relatively less knowledge of breeds, less consumption frequency and less purchase of regional quality certified beef. Nevertheless, the other segment of the market could also be interesting, due to its larger size and higher frequency of consumption, but might be difficult to reach because of their relatively worse valuation and lower awareness of the autochthonous breed. Therefore, in order to increase the potential market for urban consumers, and helping to the adaptation of the local calves’ production systems to the new market requirements, the development of some marketing strategies could be advisable.
Thus, findings suggest that improving the Pyrenean autochthonous breed awareness constitutes a relevant tool. Moreover, promoting the still scarcely used EU mountain farming labelling, or even adopting a joint strategy of adding this label to the autochthonous breed claim may provide satisfactory results. However, further investigation is needed in order to assess to what extent a favorable hedonic rating may trigger the final purchase of the product. Likewise, further confirmation on the acceptability of Pyrenean and autochthonous breeds would be obtained with a larger number of samples. Finally, consumers’ evaluation can be clearly influenced by their food consumption habits and culture. In this sense, the impact of the regional claim disclosure needs to be read in the context of a common regional origin, of the product and the consumer, and accordingly, the region of origin (alone or in combination with the Pyrenees) is not expected to evoke a response shift of the same magnitude amongst consumers from other regions. Therefore, analyzing the influence of the Pyrenean origin on consumers from neighboring regions across the Pyrenees or comparing the influence of this origin on rural and urban consumers within the same region could also be relevant. Exploring these issues may constitute a future extension of this avenue of research.
Author Contributions
The two authors designed the research, contributed to the data analysis, and participated in the preparation and revision of the manuscript.
Funding
The authors gratefully acknowledge financial support from the EU-FEDER Operative Program of Territorial Cooperation Spain France Andorra, 2007–2012(POCTEFA), Project OTRAC.
Acknowledgments
The authors gratefully acknowledge the help provided by Gabriela Zeballos in the collection of data.
Conflicts of Interest
The authors declare no conflict of interest.
References
- Bernués, A.; Ruiz, R.; Olaizola, A.; Villalba, D.; Casasús, I. Sustainability of pasture-based livestock farming systems in the European Mediterranean context: Synergies and trade-offs. Livest. Sci. 2011, 139, 44–57. [Google Scholar] [CrossRef]
- Resano, H.; Olaizola, A.M.; Dominguez-Torreiro, M. Exploring the influence of consumer characteristics on veal credence and experience guarantee purchasing motivators. Meat Sci. 2018, 141, 1–8. [Google Scholar] [CrossRef] [PubMed]
- Nelson, P. Information and consumer behaviour. J. Polit. Econ. 1970, 78, 311–329. [Google Scholar] [CrossRef]
- Viegas, I.; Nunes, L.C.; Madureira, L.; Fontes, M.A.; Santos, J.L. Beef credence attributes: Implications of substitution effects on consumers WTP. J. Agr. Econ. 2014, 65, 600–615. [Google Scholar] [CrossRef]
- Johnson, M.D.; Miller, R.K.; Morrill, J.C.; Anderson, D.P.; Wickersham, T.A.; Sawyer, J.E.; Richardson, J.W.; Palma, M.A. The influence of taste in willingness-to-pay valuations of sirloin steaks from post-extraction algal residue-fed cattle. J. Anim. Sci. 2016, 94, 3072–3083. [Google Scholar] [CrossRef] [PubMed]
- Darby, M.R.; Karni, E. Free competition and the optimal amount of fraud. J. Law Econ. 1973, 16, 67–88. [Google Scholar] [CrossRef]
- Hersleth, M.; Næs, T.; Rødbotten, M.; Monteleone, E. Lamb meat—Importance of origin and grazing system for Italian and Norwegian consumers. Meat Sci. 2012, 90, 899–907. [Google Scholar] [CrossRef]
- Resano, H.; Sanjuán, A.I.; Albisu, L.M. Consumers’ acceptability of cured ham in Spain and the influence of information. Food Qual. Prefer. 2007, 18, 1064–1076. [Google Scholar] [CrossRef]
- Kar, H.L.; Wuyang, H. How local is local? A reflection on Canadian local food labelling policy from consumer preference. Can. J. Agr. Econ. 2016, 64, 71–88. [Google Scholar]
- European Commission. EU Regulation 665/2014 of the European Parliament and of the Council with regard to conditions of use of the optional quality term ‘mountain product’. Off. J. Eur. Union 2014, 665, L179/23. [Google Scholar]
- Sanjuán, A.I.; Khliji, S. Urban consumers’ response to the EU food mountain labelling: An empirical application in Southern Europe. New Medit 2016, 15, 72–80. [Google Scholar]
- Scozzafava, G.; Casini, L.; Contini, C. Analysis of Italian consumer preferences for beef. New Medit 2014, 1, 66–72. [Google Scholar]
- Spanish Official Gazette (BOE). Royal Decree 505/2013, Which Regulates the Use of the ‘Autochthonous Breed’ Logo in the Products of Animal Origin; Spanish Official Gazette: Madrid, Spain, 2013. [Google Scholar]
- European Commission. EU Regulation 1151/2012 of the European Parliament and of the Council on quality schemes for agricultural products and foodstuffs. Off. J. Eur. Union 2014, 1151, L179/36. [Google Scholar]
- Guerrero, A.; Campo, M.M.; Cilla, I.; Olleta, J.L.; Alcalde, M.J.; Horcada, A.; Sañudo, C. A comparison of laboratory-based and home-based tests of consumer preferences using kid and lamb meat. J. Sens. Stud. 2014, 29, 201–210. [Google Scholar] [CrossRef]
- Sanjuán-López, A.I.; Philippidis, G.; Resano-Ezcaray, H. How useful is acceptability to explain economic value? An application on the introduction of innovative saffron products into commercial markets. Food Qual. Prefer. 2011, 22, 255–263. [Google Scholar]
- Camarena, D. The Ethnic Food Consumption and Its Main Determinants: Empirical Application to the Aragonese Market. Ph.D. Thesis, Public University of Navarre, Pamplona, Spain, 2010. [Google Scholar]
- Camarena, D.; Sanjuán, A.I. The food neophobia scale: The case of ethnic food. Economía Agraria Recursos Naturales 2008, 8, 93–104. [Google Scholar] [CrossRef]
- Martínez, E.; Polo, Y. Family purchasing behaviour cuadernos de CC. Económicas Empresariales 1997, 33, 85–110. [Google Scholar]
- Lange, C.; Rousseau, F.; Issanchou, S. Expectation, liking and purchase behaviour under economical constraint. Food Qual. Prefer. 1999, 10, 31–39. [Google Scholar] [CrossRef]
- MacFie, H.J.H.; Bratchell, N.; Greenhoff, K.; Vallis, L.V. Designs to balance the effect of order of presentation and first-order carry-over effects in hall tests. J. Sens. Stud. 1989, 4, 129–148. [Google Scholar] [CrossRef]
- AMSA, American Meat Science Association. Meat Evaluation Handbook, 2nd ed.; AMSA: Savoy, IL, USA, 1978. [Google Scholar]
- Van Wezemael, L.; Stefaan De Smet, S.; Ueland, Ø.; Verbeke, W. Relationships between sensory evaluations of beef tenderness, shear force measurements and consumer characteristics. Meat Sci. 2014, 97, 310–315. [Google Scholar] [CrossRef]
- Tversky, A.; Kahneman, D. Rational choice and the framing of decisions. J. Bus. 1986, 59, S251–S278. [Google Scholar] [CrossRef]
- Banović, M.; Grunert, K.G.; Barreira, M.M.; Fontes, M.A. Consumers’ quality perception of national branded, national store branded, and imported store branded beef. Meat Sci. 2010, 84, 54–65. [Google Scholar] [CrossRef] [PubMed]
- Schlich, P. Preference mapping: Relating consumer preferences to sensory or instrumental measurements. In Bioflavour’95: Analysis/Precursor Studies/Biotechnology; Etiévant, P., Schreier, P., Eds.; INRA Editions: Versailles, France, 1995; pp. 231–245. [Google Scholar]
- Borgogno, M.; Corazzin, M.; Saccà, E.; Bovolenta, S.; Piasentier, E. Influence of familiarity with goat meat on liking and preference for capretto and chevon. Meat Sci. 2015, 106, 69–77. [Google Scholar] [CrossRef] [PubMed] [Green Version]
- Resano, H.; Sanjuán, A.I.; Albisu, L.M. Consumers’ acceptability and actual choice. An exploratory research on cured ham in Spain. Food Qual. Prefer. 2009, 20, 391–398. [Google Scholar] [CrossRef]
- Murray, J.M.; Delahunty, C.M. Mapping consumer preferences for the sensory and packaging attributes of cheddar cheese. Food Qual. Prefer. 2000, 11, 419–435. [Google Scholar] [CrossRef]
- Aragonese Statistical Institute. Living Conditions Survey 2012. Available online: http://www.aragon.es/DepartamentosOrganismosPublicos/Institutos/InstitutoAragonesEstadistica/pcaxis/ci.Aplicacion_axis_Encuesta_Condiciones_Vida_Definitivos.detalleDepartamento (accessed on 20 September 2018).
- Municipal Statistical Observatory. Socio-Demographic Data 2012. Available online: http://demografia.zaragoza.es/ (accessed on 20 September 2018).
- Karin, W.; Annika, A.; Anna, S. Exploring differences between central located test and home use test in a living lab context. Int. J. Consum. Stud. 2015, 39, 230–238. [Google Scholar] [CrossRef]
- Napolitano, F.; Braghieri, A.; Piasentier, E.; Favotto, S.; Naspetti, S.; Zanoli, R. Effect of information about organic production on beef liking and consumer willingness to pay. Food Qual. Prefer. 2010, 21, 207–212. [Google Scholar] [CrossRef] [Green Version]
- Morales, R.; Aguiar, A.P.S.; Subiabre, I.; Realini, C.E. Beef acceptability and consumer expectations associated with production systems and marbling. Food Qual. Prefer. 2013, 29, 166–173. [Google Scholar] [CrossRef]
- Beriain, M.J.; Sánchez, M.; Insausti, K.; Sarries, M.V.; Soret, B. A comparison of sensory acceptance, purchase intention, and willingness to pay for Pirenaica beef from two different slaughter weight groups, under different consumer information scenarios. J. Sens. Stud. 2016, 31, 453–464. [Google Scholar] [CrossRef]
- Vital, A.; Guerrero, A.; Kempinski, E.; Monteschio, J.; Sary, C.; Ramos, T.; Campo, M.M.; Prado, I. Consumer profile and acceptability of cooked beef steaks with edible and active coating containing oregano and rosemary essential oils. Meat Sci. 2018, 143, 153–158. [Google Scholar] [CrossRef]
- Gomes, C.L.; Pflanzer, S.B.; Bolini, H.M.A. Use of cluster analysis to evaluate consumer acceptability of beef strip loin steaks. Meat Sci. 2015, 101, 106. [Google Scholar] [CrossRef]
- Engel, J.E.; Blackwell, R.D.; Miniard, P.W. Consumer Behavior, 8th ed.; The Dryden Press: Chicago, IL, USA, 1995. [Google Scholar]
- Resano, H.; Perez-Cueto, F.J.A.; Sanjuán, A.I.; De Barcellos, M.D.; Grunert, K.G.; Verbeke, W. Consumer satisfaction with dry-cured ham in five European countries. Meat Sci. 2011, 87, 336–343. [Google Scholar] [CrossRef]
- Rawson, N.E. Age-related changes in perception of flavor and aroma. Generations 2003, 27, 20–26. [Google Scholar]
Figure 1.
Example of a card showed to consumers at the identified test.

Figure 2.
Internal preference mapping based on identified test ratings. (a) central location; (b) home use.
Figure 2.
Internal preference mapping based on identified test ratings. (a) central location; (b) home use.

Figure 3.
Mean hedonic rating for the two clusters identified in the home use test. The hedonic scale was ranging from 0 (I do not like at all) to 10 (I like it very much). The mean rate for products with the same letter are not significantly different according to the Tukey Honestly Significant Difference (HSD) statistic (cluster1) and Games–Howell statistics (cluster 2), at 5% significance level.


Table 1.
Name and description of the samples evaluated under the different information conditions.
| Sample Codes | Origin | Breed |
|---|---|---|
| PA | Aragonese Pyrenees | Autochthonous (Parda de Montaña) |
| PNS | Aragonese Pyrenees | Non specified |
| RNS | Regional (Aragonese) | Non specified |
| RNA | Regional (Aragonese) | Non autochthonous (Limousine) |
| NNS | National (Spanish) | Non specified |
Table 2.
Description of the sample in the two experimental settings and the population.
| (%) | Sample (Chi-Square Statistic in Parentheses) A | Population B | ||
|---|---|---|---|---|
| CL Test CD | H test | Total | ||
| Gender: Female | 52 (1.000) | 53 (0.887) | 53 (0.887) | 52 |
| Age **: | (0.320) | (0.286) | (0.384) | |
| 18–34 | 29 | 29 | 28 | 20 |
| 35–64 | 40 | 56 | 56 | 60 |
| ≥65 | 31 | 15 | 16 | 20 |
| Net income: | (0.282) | (0.697) | (0.525) | |
| <1150 €/month | 34 | 29 | 32 | 30 |
| 1150–3000 €/month | 55 | 56 | 55 | 51 |
| >3000 €/month | 11 | 15 | 13 | 19 |
| Level of studies: | (0.225) | (0.289) | (0.183) | |
| Primary | 22 | 26 | 19 | 28 |
| Secondary | 42 | 39 | 46 | 47 |
| University | 36 | 35 | 35 | 25 |
| N. individuals | 144 | 133 | 277 | 1,300,000 |
Note: A Chi-square statistics between each subsample/the full sample and Aragon population were calculated. B Source: [30,31]. C ** reveals the presence of statistical significant differences between subsamples at 5%, (p ≤ 0.05) according to the chi-square test. D CL: Central Location test; H: Home use test.
Table 3.
Mean liking scores: statistical comparison across beef samples and between information conditions.
Table 3.
Mean liking scores: statistical comparison across beef samples and between information conditions.
| Sample Codes | Average Liking Score 0–10 Scale (Standard Deviation in Parentheses) | Comparison of Mean Scores Between Identified and Blind Test (p-Values in Parentheses) | |||||
|---|---|---|---|---|---|---|---|
| B | I | I CL B, C | I H | I-B D | I-B CL | I-B H | |
| PA | A5.655 a (2.116) | 6.621 a,b (2.019) | 6.371 ** (2.076) | 6.900 a,** (1.923) | 0.926 (0.000) | 0.760 (0.001) | 1.111 (0.000) |
| PNS | 5.553 a (2.138) | 7.021 a (1.983) | 6.387 *** (2.139) | 7.725 b,*** (1.518) | 1.412 (0.000) | 0.909 (0.000) | 1.969 (0.000) |
| RNS | 5.765 a,b (2.171) | 6.170 b (1.921) | 5.913 ** (2.032) | 6.452 a,** (1.755) | 0.412 (0.007) | 0.311 (0.164) | 0.523 (0.012) |
| RNA | 6.158 b,c (2.223) | 6.321 b (2.065) | 5.964 *** (2.203) | 6.720 a,*** (1.825) | 0.166 (0.200) | −0.045(0.841) | 0.402 (0.076) |
| NNS | 6.334 c (2.304) | 6.532 b (1.939) | 6.099 *** (2.103) | 7.020 a,*** (1.609) | 0.223 (0.197) | −0.154 (0.495) | 0.646 (0.014) |
Note: A Means within a column with different lowercase letters are significantly different at 5% (p ≤ 0.05) according to the statistic Tukey. B ***, and ** stand for statistical significant differences at 1% (p ≤ 0.01) and 5%, (p ≤ 0.05) respectively, according to the independent samples test. C B: Blind acceptability, I: Informed acceptability; CL: Central Location test, H: Home use test. D p-values corresponding to the paired-samples t-test.
Table 4.
Consumers’ segment profiles of the two clusters identified in the home use test.
| (%) Socio-Demographics and Other Consumer Characteristics | Hedonically Demanding (84%) | Pyrenean Sourced Prone (16%) | Total (N = 133) |
|---|---|---|---|
| Gender: Female | 52 | 62 | 53 |
| Age ***: | |||
| 18–34 | 29 | 29 | 28 |
| 35–64 | 59 | 38 | 56 |
| ≥65 | 12 | 33 | 16 |
| Net income: | |||
| <1150 €/month | 30 | 29 | 32 |
| 1150–3000 €/month | 56 | 52 | 55 |
| >3000 €/month | 14 | 19 | 13 |
| Level of studies ***: | |||
| Primary | 12 | 29 | 19 |
| Secondary | 49 | 47 | 46 |
| University | 39 | 24 | 35 |
| Evaluated sample: Adding salt & oil *** | 76 | 95 | 80 |
| Adding spices | 18 | 10 | 16 |
| Degree of doneness: rare or well done Done *** | 22 | 48 | 26 |
| Frequency of beef consumption at home: At least once a week ** | 83 | 70 | 81 |
| Knowledge of: any cattle breed *** | 66 | 48 | 63 |
| ‘Parda de Montaña’ | 49 | 52 | 49 |
| ‘Limousine’ *** | 27 | 10 | 24 |
| Knowledge ***/Purchase *** of a regional quality certified beef | 55/33 | 33/14 | 52/30 |
| All their lives living in Aragon ** | 71 | 55 | 68 |
Note: ***, and ** reveal the presence of statistical significant differences between clusters at 1% (p ≤ 0.01) and 5%, (p ≤ 0.05) respectively, according to the chi-square test.
© 2018 by the authors. Licensee MDPI, Basel, Switzerland. This article is an open access article distributed under the terms and conditions of the Creative Commons Attribution (CC BY) license (http://creativecommons.org/licenses/by/4.0/).
Share and Cite
MDPI and ACS Style
Resano, H.; Sanjuán, A.I. Exploring the Role of Mountain Origin and Autochthonous Breed on Urban Consumers’ Acceptability. Sustainability 2018, 10, 4423. https://0-doi-org.brum.beds.ac.uk/10.3390/su10124423
AMA Style
Resano H, Sanjuán AI. Exploring the Role of Mountain Origin and Autochthonous Breed on Urban Consumers’ Acceptability. Sustainability. 2018; 10(12):4423. https://0-doi-org.brum.beds.ac.uk/10.3390/su10124423
Chicago/Turabian StyleResano, Helena, and Ana Isabel Sanjuán. 2018. "Exploring the Role of Mountain Origin and Autochthonous Breed on Urban Consumers’ Acceptability" Sustainability 10, no. 12: 4423. https://0-doi-org.brum.beds.ac.uk/10.3390/su10124423
Note that from the first issue of 2016, this journal uses article numbers instead of page numbers. See further details here.