Influence of Size on the Economic Feasibility of Floating Offshore Wind Farms


1
Departamento de Enxeñaría Naval e Industrial, Escola Politécnica Superior, Universidade da Coruña, Esteiro, 15471 Ferrol, Spain
2
Departamento de Química, Escola Politécnica Superior, Universidade da Coruña, Esteiro, 15471 Ferrol, Spain
*
Author to whom correspondence should be addressed.
Sustainability 2018, 10(12), 4484; https://0-doi-org.brum.beds.ac.uk/10.3390/su10124484
Submission received: 24 October 2018
/
Revised: 18 November 2018
/
Accepted: 27 November 2018
/
Published: 28 November 2018
Abstract
:This paper uses a method to analyze the economic influence of the size of floating offshore wind farms. The economic aspects analyzed, LCOE (Levelized Cost Of Energy) and costs, depend on the number of floating offshore wind turbines, which establishes the effect of the size of the farm. This influence has been carried out for a map in a specific location. Regarding the case study, 18 alternatives have been considered taking into account the total power of the farm and the types of floating platforms. These aspects have been studied for the location of Galicia (Spain). Results indicate how LCOE and costs vary when the size of the floating offshore wind farm is increased for the studied kinds of offshore structures. Results are useful for planning an offshore wind farm in deep waters in future investments.
1. Introduction
Renewable energies have been used for centuries [1]. The European Union believes in these types of energies, representing 86% of the new power installations in this area and generating 21.1 GW [2]. Spain has the second position of wind energy installed power, following Germany, which stays at the first position [2]. The UE has 153.7 GW installed of wind power at the end of 2016, of which 12.6 GW are offshore and 141.1 GW are onshore [2]. In addition, there are other types of offshore energies, such as tidal stream energy, whose presence in the world is mainly in UK, with twenty-two projects operating or in development since 2016 to 2022 [3].
Considering the onshore wind power cumulative capacity to 2030, there are three scenarios: low, central and high considering the “Wind energy in Europe: Scenarios for 2030” Report of Wind Europe [4]. In this context, Germany is the first country, followed by France and Spain. However, considering offshore wind power cumulative capacity to 2030, the firsts positions are occupied by United Kingdom, Germany and Netherlands [4]. In this study, Spain is not in the forecasts for the future of offshore wind.
The study of Wind Europe indicates that the North Sea will have the highest quantity of offshore wind farms by 2030, with a central value closed to 50 GW, higher than the 10 GW of 2016 [4]. The second location is the Baltic Sea with 1.5 GW connected to the grid in 2016 and with values of 10 GW for 2030. The Atlantic Sea did not have capacity installed in 2016, but previsions give a value close to 10 GW for 2030. The selected area of study to install a floating offshore wind farm in the present paper is region of Galicia (Spain), located in the Atlantic Sea.
However, one of the most important issues in terms of an offshore wind farm is to be competitive in economic terms. In this sense, the LEANWIND project studied how to reduce the costs of farms analyzing their installation, operation and maintenance, and logistics and supply-chain [5].
Europe is the most important area in terms of offshore wind energy around the world [6,7]. It represents 3589 offshore wind generators connected to the grid by the end of 2016. In addition, European offshore wind energy industry has grown in 338 offshore wind generators installed in 2016 [6]. Offshore wind farms are installed in a mean water depth of 29 m and in a mean distance from the offshore farm to shore of 44 km [6].
Regarding the type of offshore wind platforms installed in the offshore farms, there are several types of platforms [8,9,10,11,12,13], such as monopiles, jackets, and semisubmersible. However, the majority are monopiles (81%). Nevertheless, there also are gravity based foundations (7.5%), jackets (6.6%), tripods (3.2%), and tripiles (1.9%) [6]. Therefore, all the offshore wind farms located in Europe are composed of fixed structures (monopiles, jackets, tripiles, etc.) [14], which are mainly installed in the North Sea [6,15]. These platforms are joined to an offshore wind generator with an average rated power of 4.8 MW [6]. Recently, Navantia Fene shipyard, located in Fene (A Coruña, Spain), is building five spar platforms which will be installed in the first floating offshore wind farm, located in Scotland.
Regarding floating offshore wind, there are three main types of platforms [16]: spar, such as the Hywind concept [17,18]; Tensioned Leg Platform (TLP) [19,20], such as the concept developed by Blue H Technologies; and semisubmersible platforms [21,22,23], such as the WindFloat structure. Spar and semisubmersible concepts are the most developed technologies. In fact, a floating offshore wind farm of 5 Hywind structures has been installed in UK and a floating offshore wind farm of semisubmersible platforms is planned to be installed in Portugal in the future. These floating platforms have an advantage regarding the fixed structures: the installation in deep waters. Therefore, they can be installed in more locations than the platforms that fix to the seabed, which can only be installed in shallow waters. Floating offshore wind technology is being developed to create new solutions for deep waters. In this sense, there are many studies about the design of the floating platforms [10,24], but there is less information about the economic aspects of the farms [19,25]. Therefore, this paper aims to introduce some economic aspects of floating offshore wind that are useful for planning this type of farms.
Some authors have considered the influence that noise has on the layout of an offshore farm [26], the environmental impacts [27,28], policies [29], evaluate the best offshore locations [30]; and to analyze the financing and risks of offshore wind [31] and other marine uses [32], or the influence of the compressed air energy storage in an offshore farm [33]. Others explain the influence of optimizing the site of wind turbines [34], but without considering offshore locations, or its electric lines [35]. The influence on costs and the total power of the farms has been also analyzed [36], but for the case of monopile foundations, which are located in shallow waters. On the other hand, it is important to notice the relevance of the size an offshore wind farm during recent years, which has increased from 46.3 MW in 2006 to 379.5 MW in 2016 [6]. This last value has increased in 12% the total power of the farm regarding the previous year [6]. It represents that the mean number of offshore wind turbines per offshore wind farm was 79 in 2016 in Europe. Ulla et al. analyzed the impact that offshore and onshore wind has on the property prices homes in Denmark [37]. Sokosloski et al. consider the influence that the public opinion has in terms of offshore wind farms [38]. They analyzed the results of two surveys: one general survey about the aspects related to the offshore wind (without disaggregating fixed of floating offshore farms) considering the New England resident, and other one considering a particular offshore wind farm. They also consider the influence of the political outlook (Republicans or Democrats) in the opinion of the people. Their results indicate the importance of where and how politicians should carry out policies related to offshore wind farms in order to satisfy the public opinion of the citizens of the area where the farm will be installed. On the other hand, Ho et al. analyze a method to locate an offshore wind farm considering its profitability, social aspects, security, and environmental issues of the farm [39] taking into account the Delphi method. They consider their influence in the marine policy that Governments should develop. In terms of the profitability, they identify the following criteria: “distance from grid connections, the optimum wind turbine spacing for minimal energy loss, the ocean waves challenging offshore wind farm construction/maintenance, the suitable ocean depth for a wind turbine foundation, the distance from ocean structures, the wind speeds and directions, the wind turbine sizes, the proximity to energy demand, the proximity to ports and services, the investment incentives, the production incentives, the feed-in-tariff for offshore wind energy, the distance from oil and gas fields, the distance from commercial fishing areas, the distance from shipping and flight risks”. Regarding the social aspects, they considered: “the visual impact, the presence of tourist aspects, the local acceptance and the employment opportunities”. Considering the security issues, they take into account: “the distance from maritime borders, the conflict of the farm with Navy use and the Air Force navigational risks from wind turbines”. Finally, taking into account the environmental issues, they analyze: “the distance from marine parks or marine protected areas, the distance from habitats for endangered species or coral reefs, the distance from wildlife habitat, the distance from bird’s paths, the impact of noise pollution”.
Castro-Santos et al. [40] describes a methodology to calculate the costs of a floating offshore wind farm following the main stages of its life-cycle: “definition, design, manufacturing, installation, exploitation, and dismantling”. This method presented for a floating offshore wind farm has been generalized for a floating offshore renewable energy farm in Castro-Santos et al. [41]. The present paper analyzes the influence of size in the offshore wind farms. This work resulted from these two previous papers, where the methodology has been developed (for the case studies of the Galician region in Castro-Santos et al. [40] and for Portugal in Castro-Santos et al. [41]), and the conclusions of a sensitivity study carried out in a previous paper [42]. It explains that the size of the farm is an important parameter of an offshore wind farm. This is the reason why this paper was made, in order to analyze how is this influence.
In this context, the objective of this paper is to analyze the importance of the size of the farm in the economic aspects (LCOE (Levelized Cost Of Energy) and costs) of a floating offshore wind farm installed in deep waters (more than 50–60 m) [24,43]. These economic parameters depend on the number of wind turbines, which determines the size of the farm [42]. This influence has been calculated considering a particular area, which is represented using the correspondent map of the location. Eighteen alternatives have been studied in terms of the global power of the offshore wind farm (100, 200, 300, 400, 500, and 600 MW) and the types of substructures considered (spar, semisubmersible and Tensioned Leg Platform). The location selected to analyze the case of study is Galicia, a Spanish Northwest region. Results obtained show the influence that the size of the farm has in the LCOE and costs of a floating wind farm. It is useful for Governments to develop marine special policies in order to plan the marine spaces where offshore wind farms can be installed in the future of this technology.
2. Methodology
The method proposed analyzes the influence that the size of a floating offshore wind farm has in two economic aspects of the farm: the LCOE and the costs.
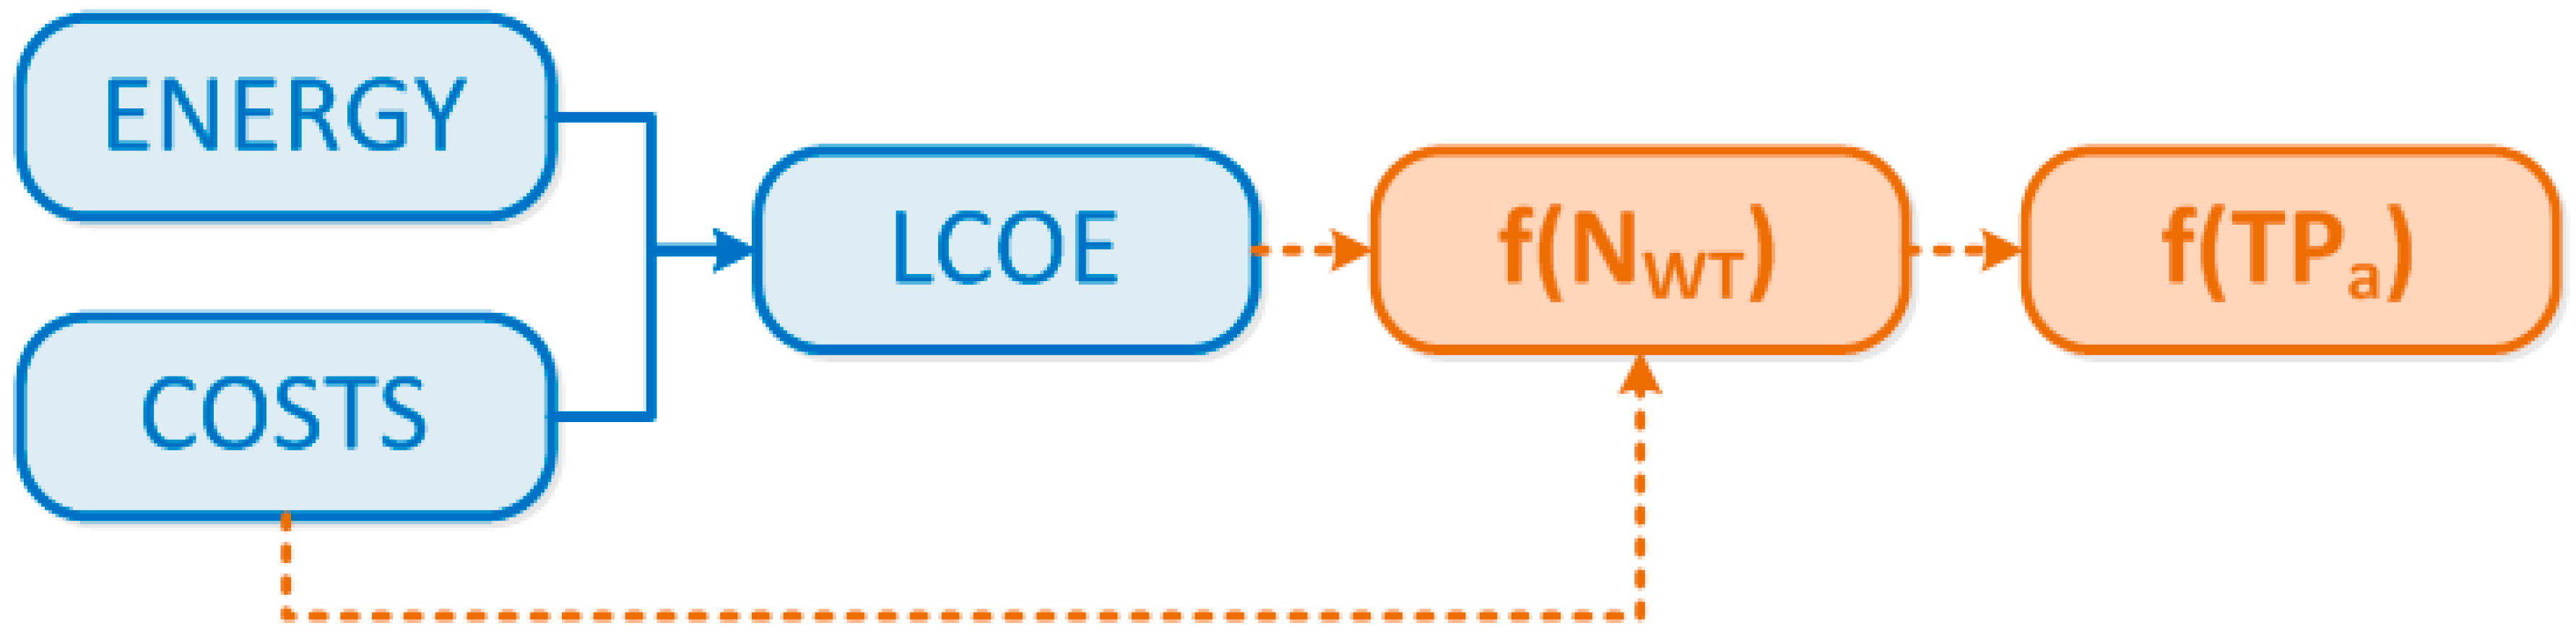
The calculation of the LCOE of a floating offshore farm depends on several variables [42] (see Figure 1): the wind scale factor related to wind speed, the cost of the wind turbine, the capital cost and the number of offshore wind turbines. In addition, the costs of a floating offshore farm depend on the number of wind turbines, the cost of the offshore generator, the distance from shore to the offshore location and the diameter of the wind turbine [42]. Consequently, the number of offshore wind generators is a piece of great importance to establish the economic aspects of a floating offshore wind installation. The method to calculate LCOE and costs of the farm has been developed in previous studies [40,41,44].
The Levelized Cost Of Energy (LCOE) depends on the life-cycle costs of the floating offshore wind farm (), the energy produced by the farm (), the capital cost () and the number of years of the project (), such as Equation (1) is shown [45].
Moreover, the influence of the size of the farm has been calculated for a group of points (a map) of a specific location, not only for a single value, such as other studies have previously developed.
The total number of offshore wind turbines () has been calculated considering the farm size, which is an input, and turbine size, which is fixed at 5.075 MW. However, it has been considered that a limitation in the number of wind turbines per row () and the number of lines of the farm (). In this sense, three turbines have been considered per each row of the network of the offshore farm taking into consideration the power supported by a particular type of offshore electric cable. It is because the manufacturer limits the size of the electric cable. Therefore, the number of offshore wind turbines is calculated using Equation (2):
On the other hand, the total number of lines considering as an input is given by , as Equation (3) is shown.
Being:
- : nominal power of the farm (MW).
- : turbine’s rated power (MW).
- : Number of wind turbines per row in the farm.
On the other hand, the actual farm size () is calculated considering Equation (4). It has been assumed as an input to analyze the influence of the size in the economic aspects of the farm.
3. Case of Study
Several alternatives have been studied in this paper. Considering different total power of the farm and different floating offshore wind structures. A previous study [42] has established the importance of the number of offshore wind turbines in order to determine the economic aspects of a floating wind farm. Therefore, in this article six different values for the total power of the farm have been considered (see Table 1): 100 MW, 200 MW, 300 MW, 400 MW, 500 MW, and 600 MW. However, all of them have the same type of offshore turbine of 5.075 MW of power per unit. It makes that the number of wind generators, calculated using Equation (2), were 18, 39, 57, 78, 96, and 117 offshore wind generators, depending on the total power of the farm. Furthermore, the real total power of the farm will be 91.35, 197.93, 289.28, 395,85, 487.20, and 593.78 MW respectively for the farms of 100, 200, 300, 400, 500 and 600 MW.
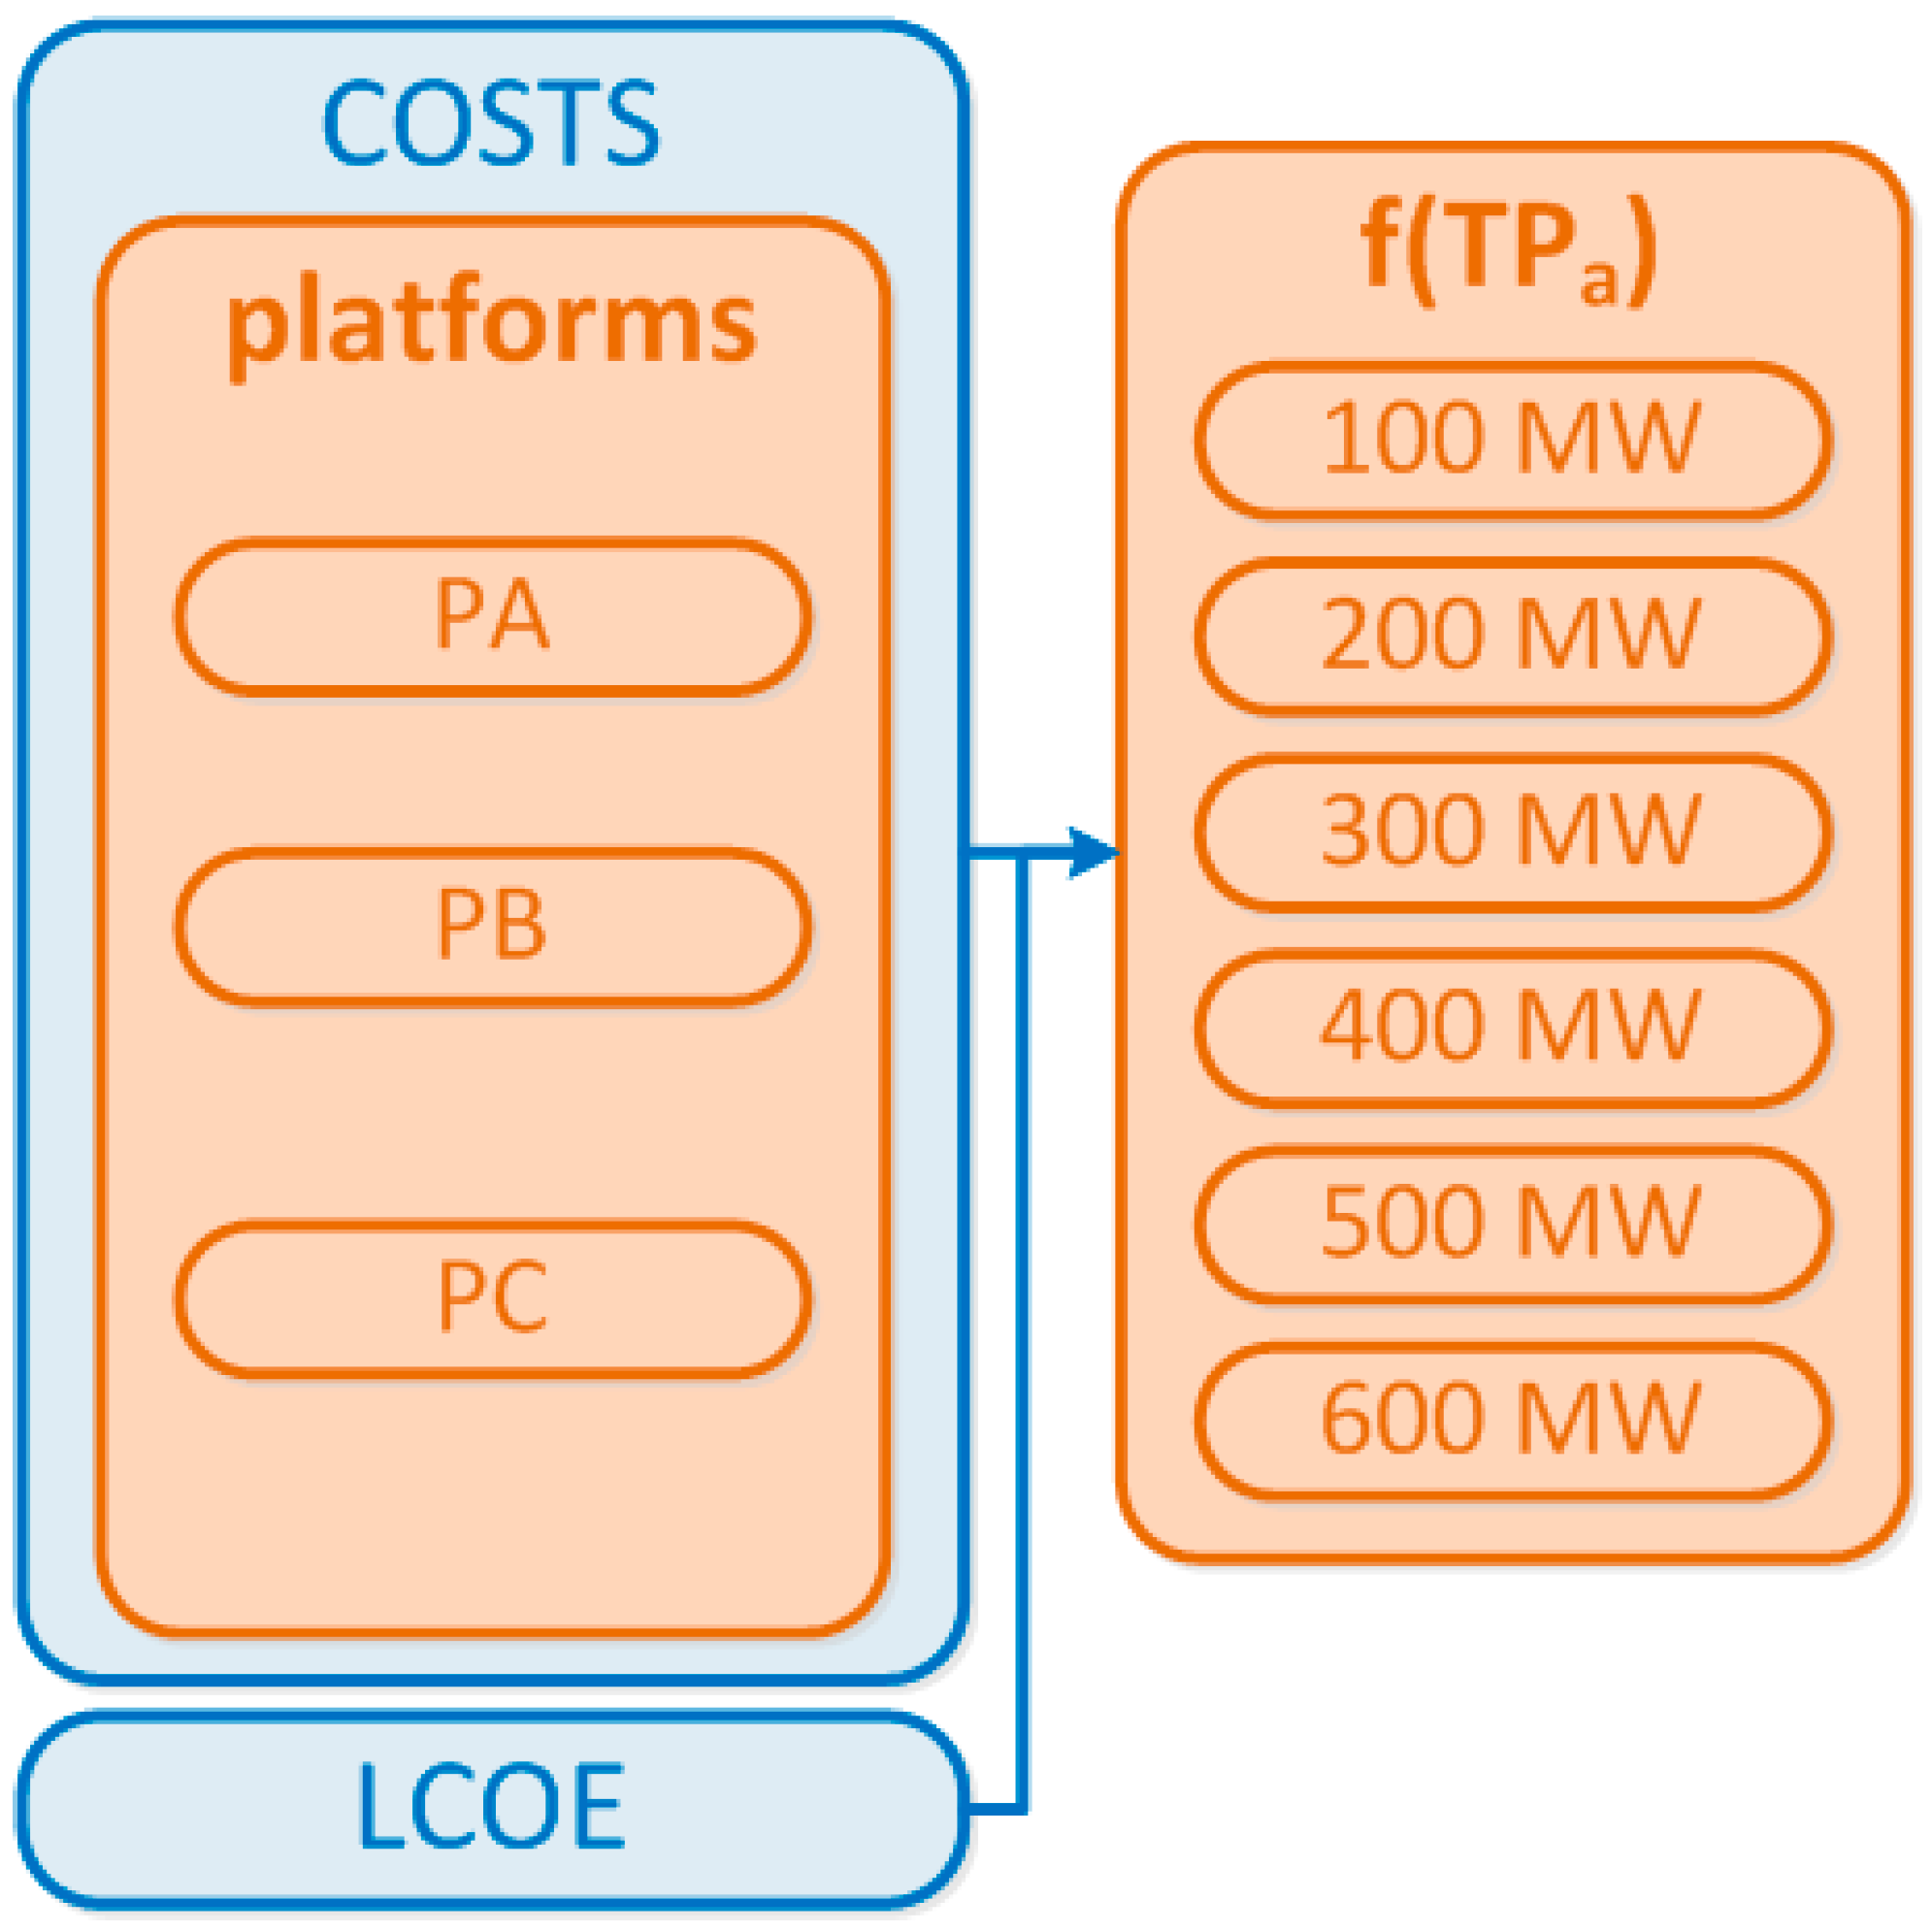
In addition, three types of floating platforms have been taken into consideration: semisubmersible or PA [46], Tensioned Leg Platform (TLP), or PB [10] and a spar platform or PC) [10] (see Figure 2).
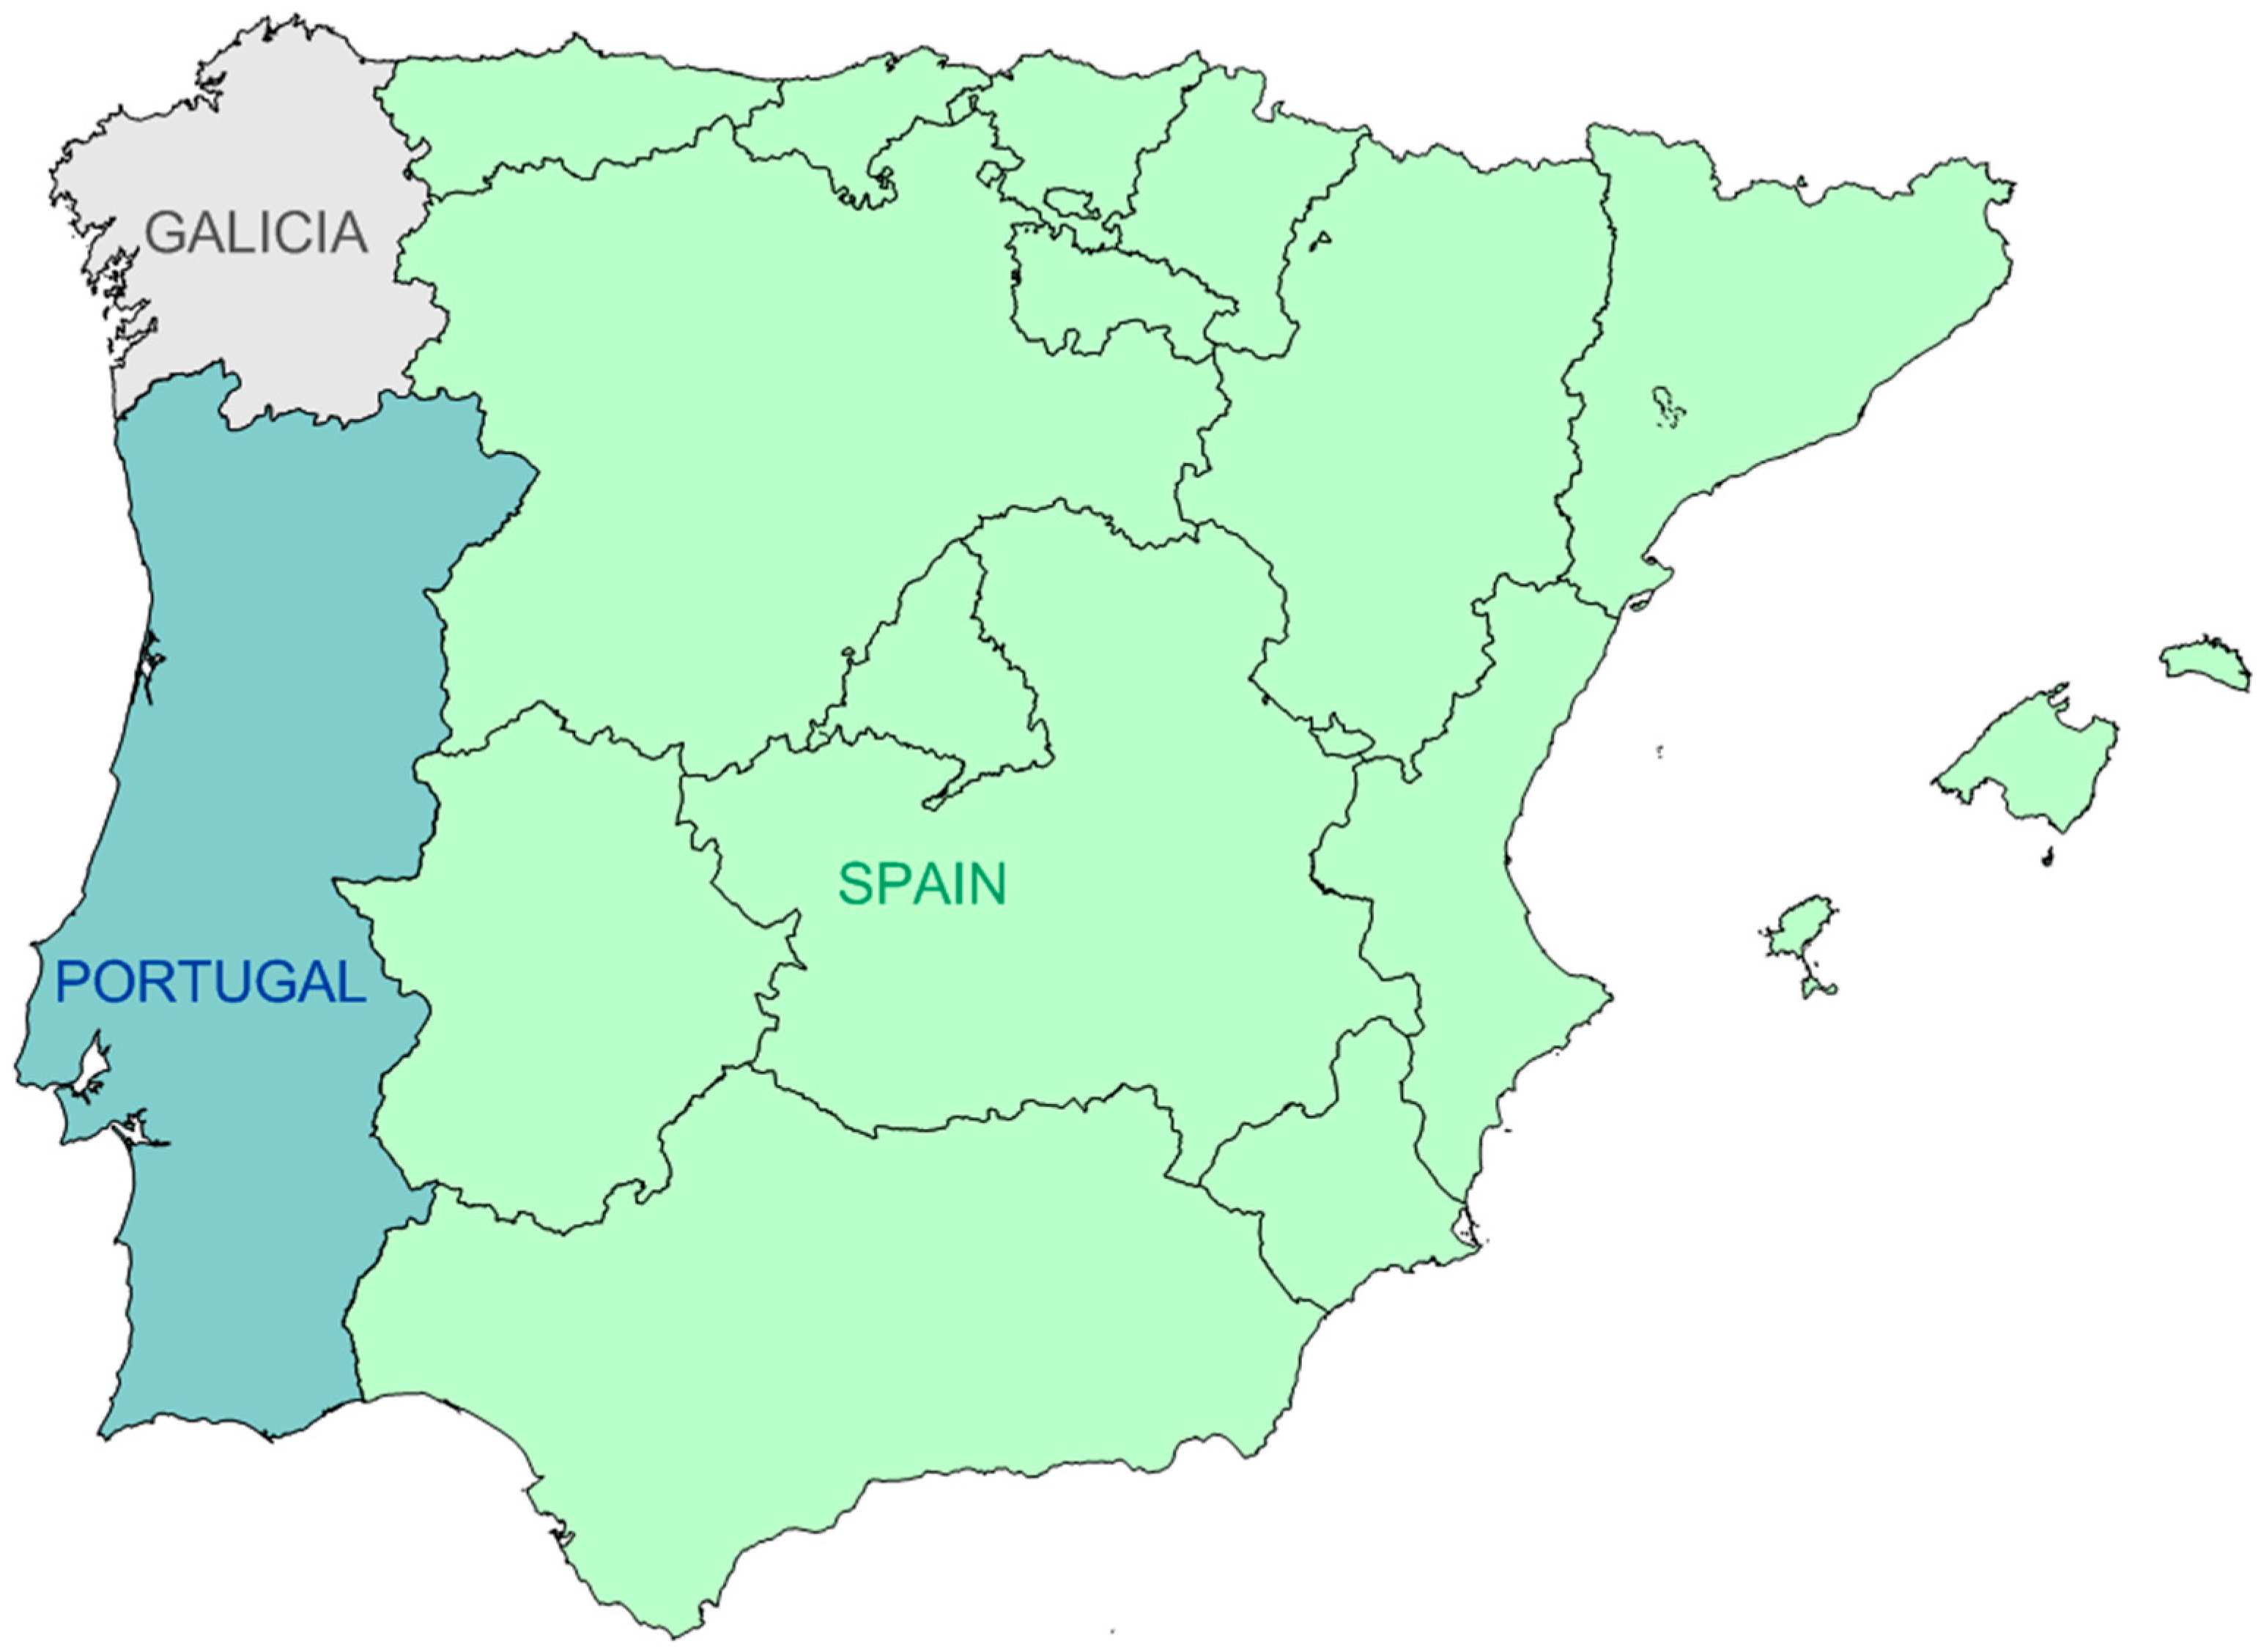
All these options have been studied for the area of Galicia (Figure 3), located in the Northwest of Spain, where the wind resource is optimum for these types of technologies. This region has the best values of offshore wind speed of the Iberian Peninsula.
Finally, two economic aspects are calculated, the LCOE and the costs, for the previous alternatives regarding the total power of the farm and the types of platforms. Their objective is to visualize into the corresponding map, the influence of the size of the farm for reducing the cost of the offshore farm. Therefore, LCOE and costs have been calculated for a total of 18 alternatives.
4. Results
4.1. Costs
Considering the results of the costs, the highest variations are regarding the cost of manufacturing and installing each of the components of the farm: platforms, wind generators, anchoring, electrical system and mooring.
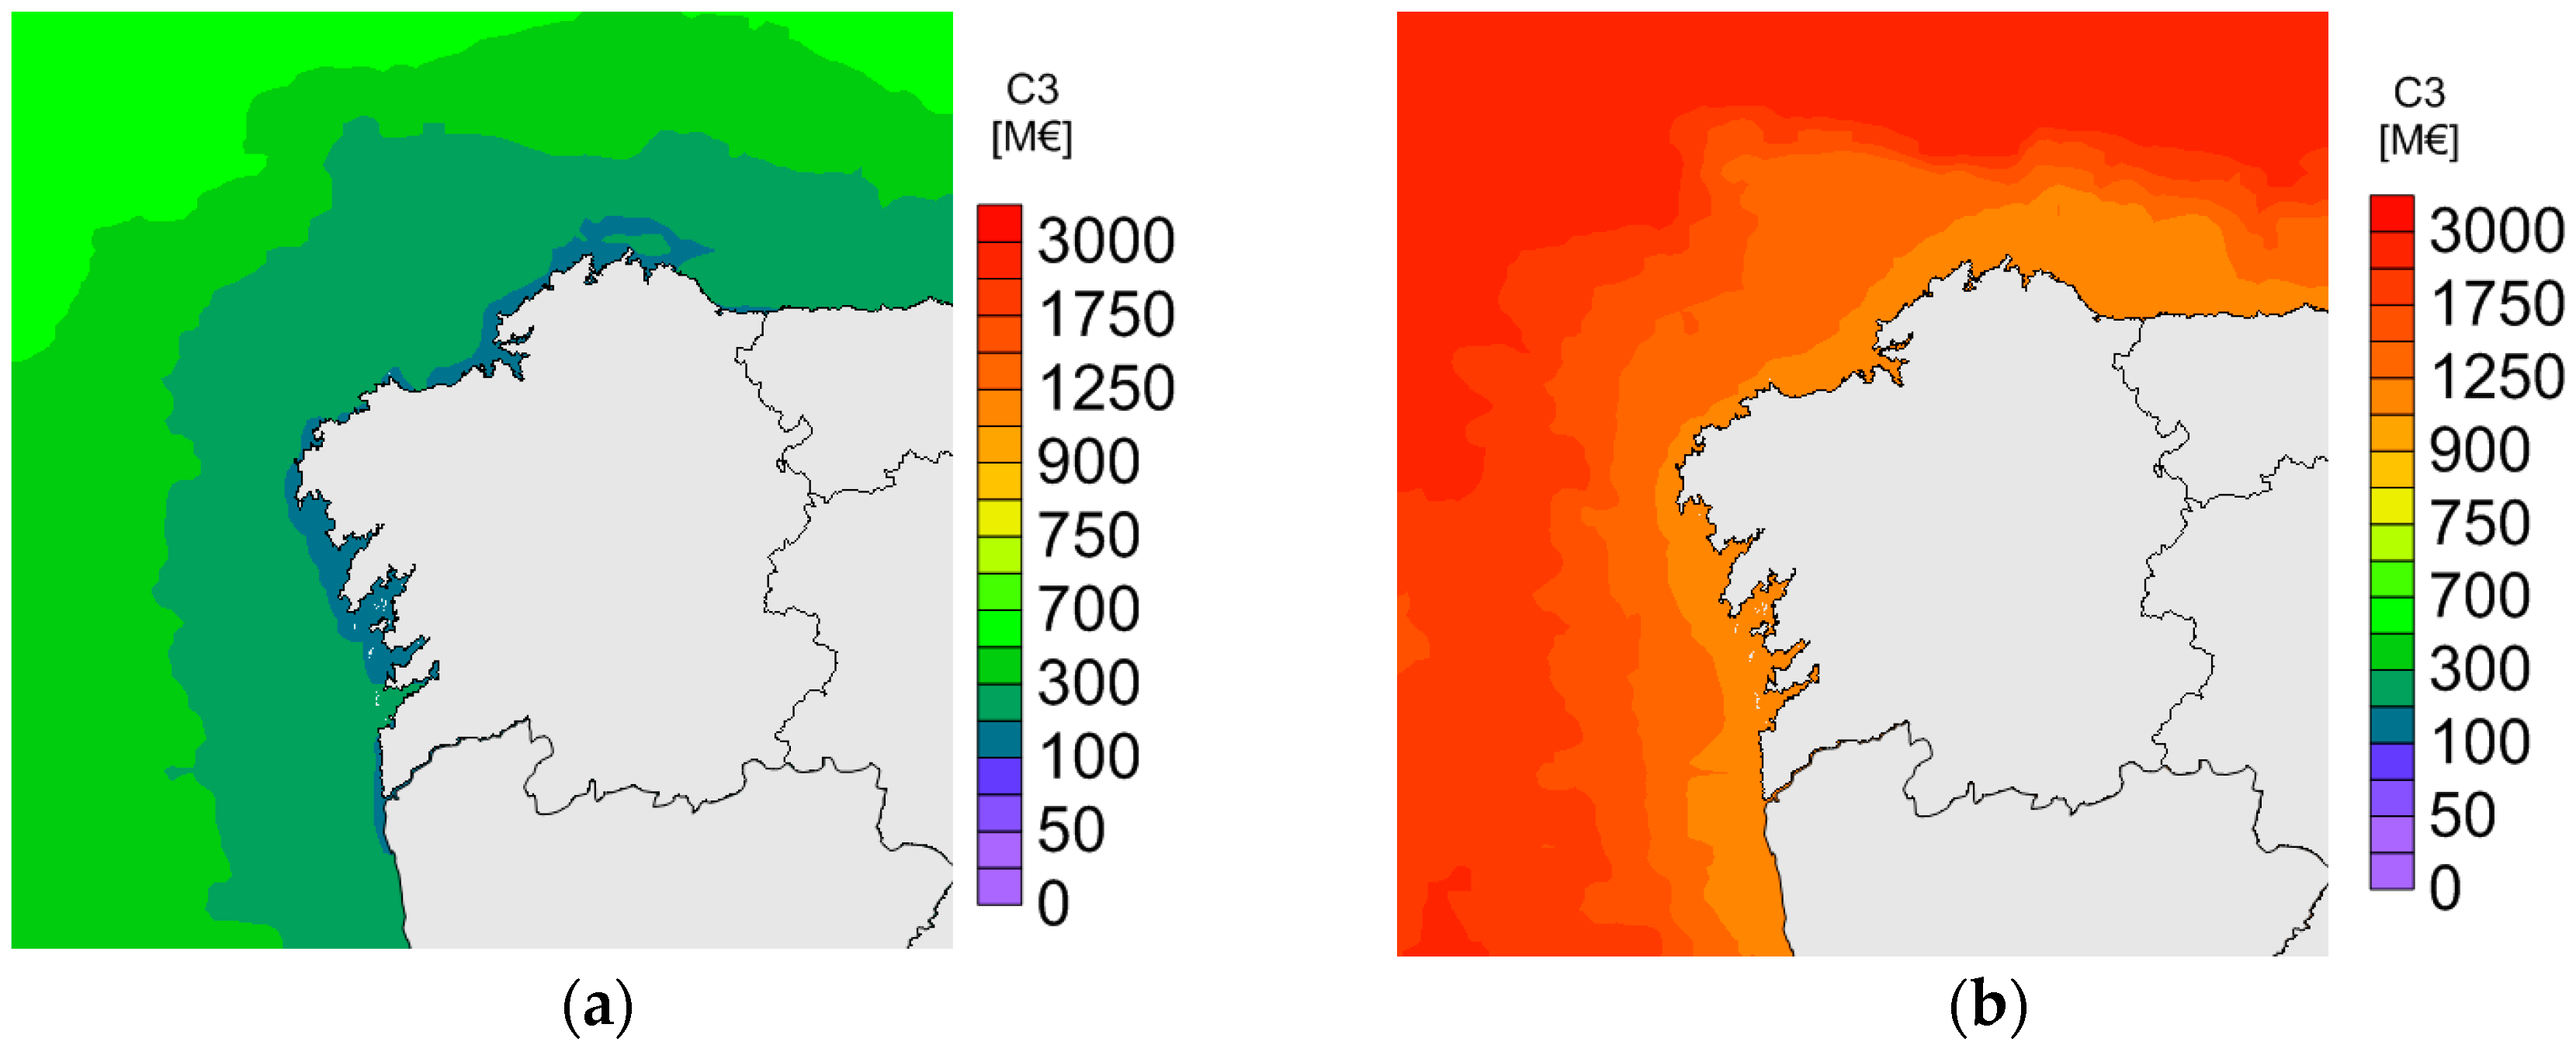
Figure 4 shows the variation of the manufacturing cost (C3) of the small and the large farm, 100 MW and 600 MW respectively. It goes from 192.98 to 439.62 M€ for a small farm of 100 MW (Figure 4a) and from 1188.9 to 2371.4 M€ for the big farm of 600 MW (Figure 4b). Obviously, this highest cost for the big farm is compensated by the highest value of the energy generated in this case.
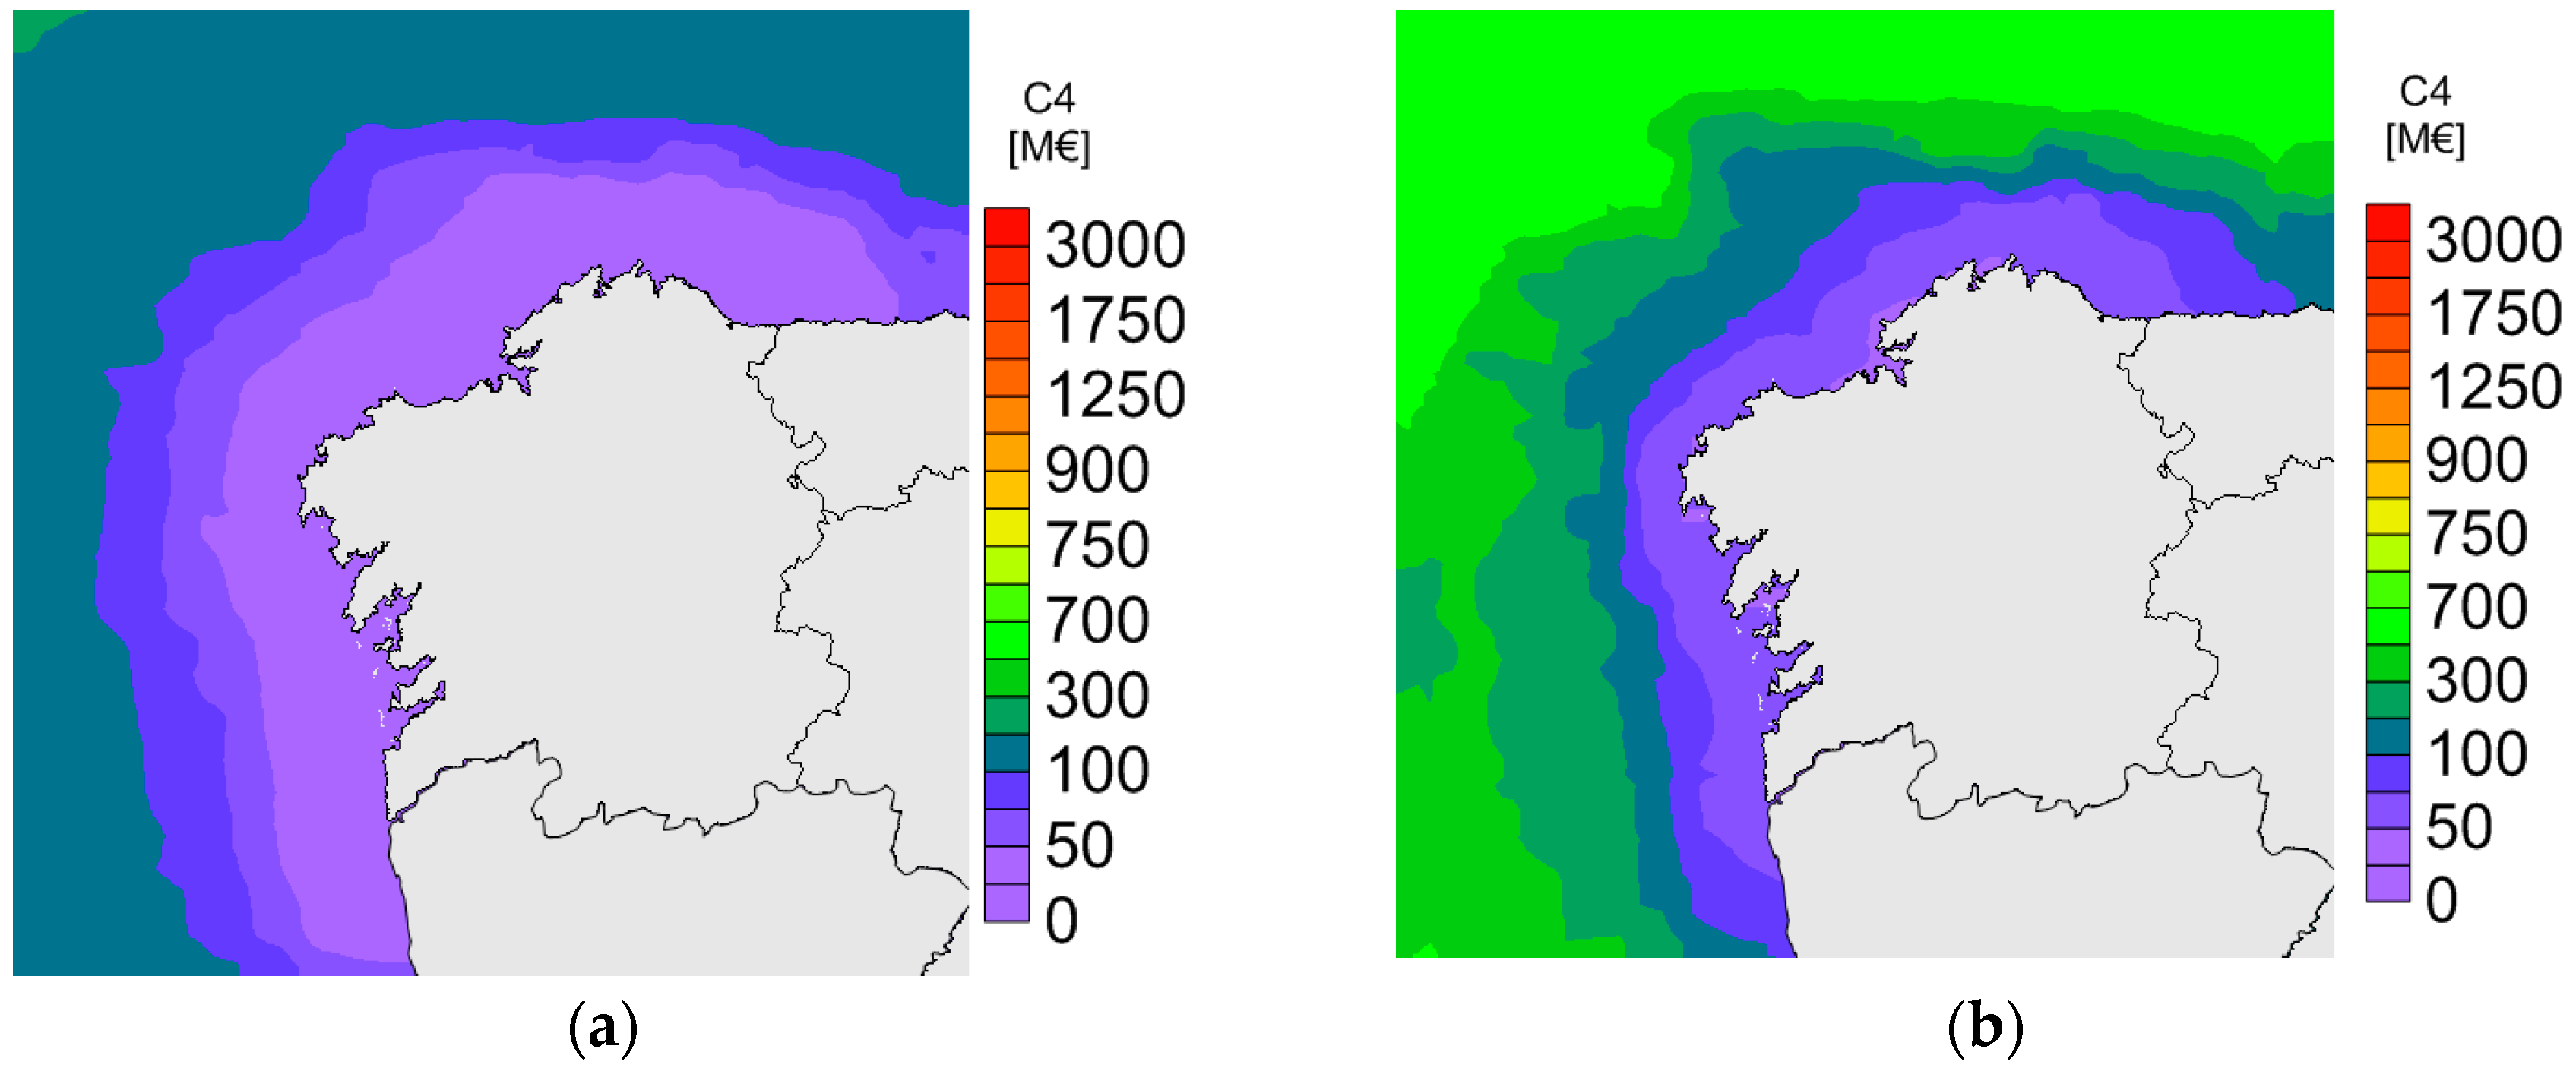
On the other side, the cost of installing the farm (C4) differs from 9.46 to 208.34 M€ for a small farm of 100 MW (Figure 5a) to 39.23 to 518.35 M€ for a big farm of 600 MW (Figure 5b).
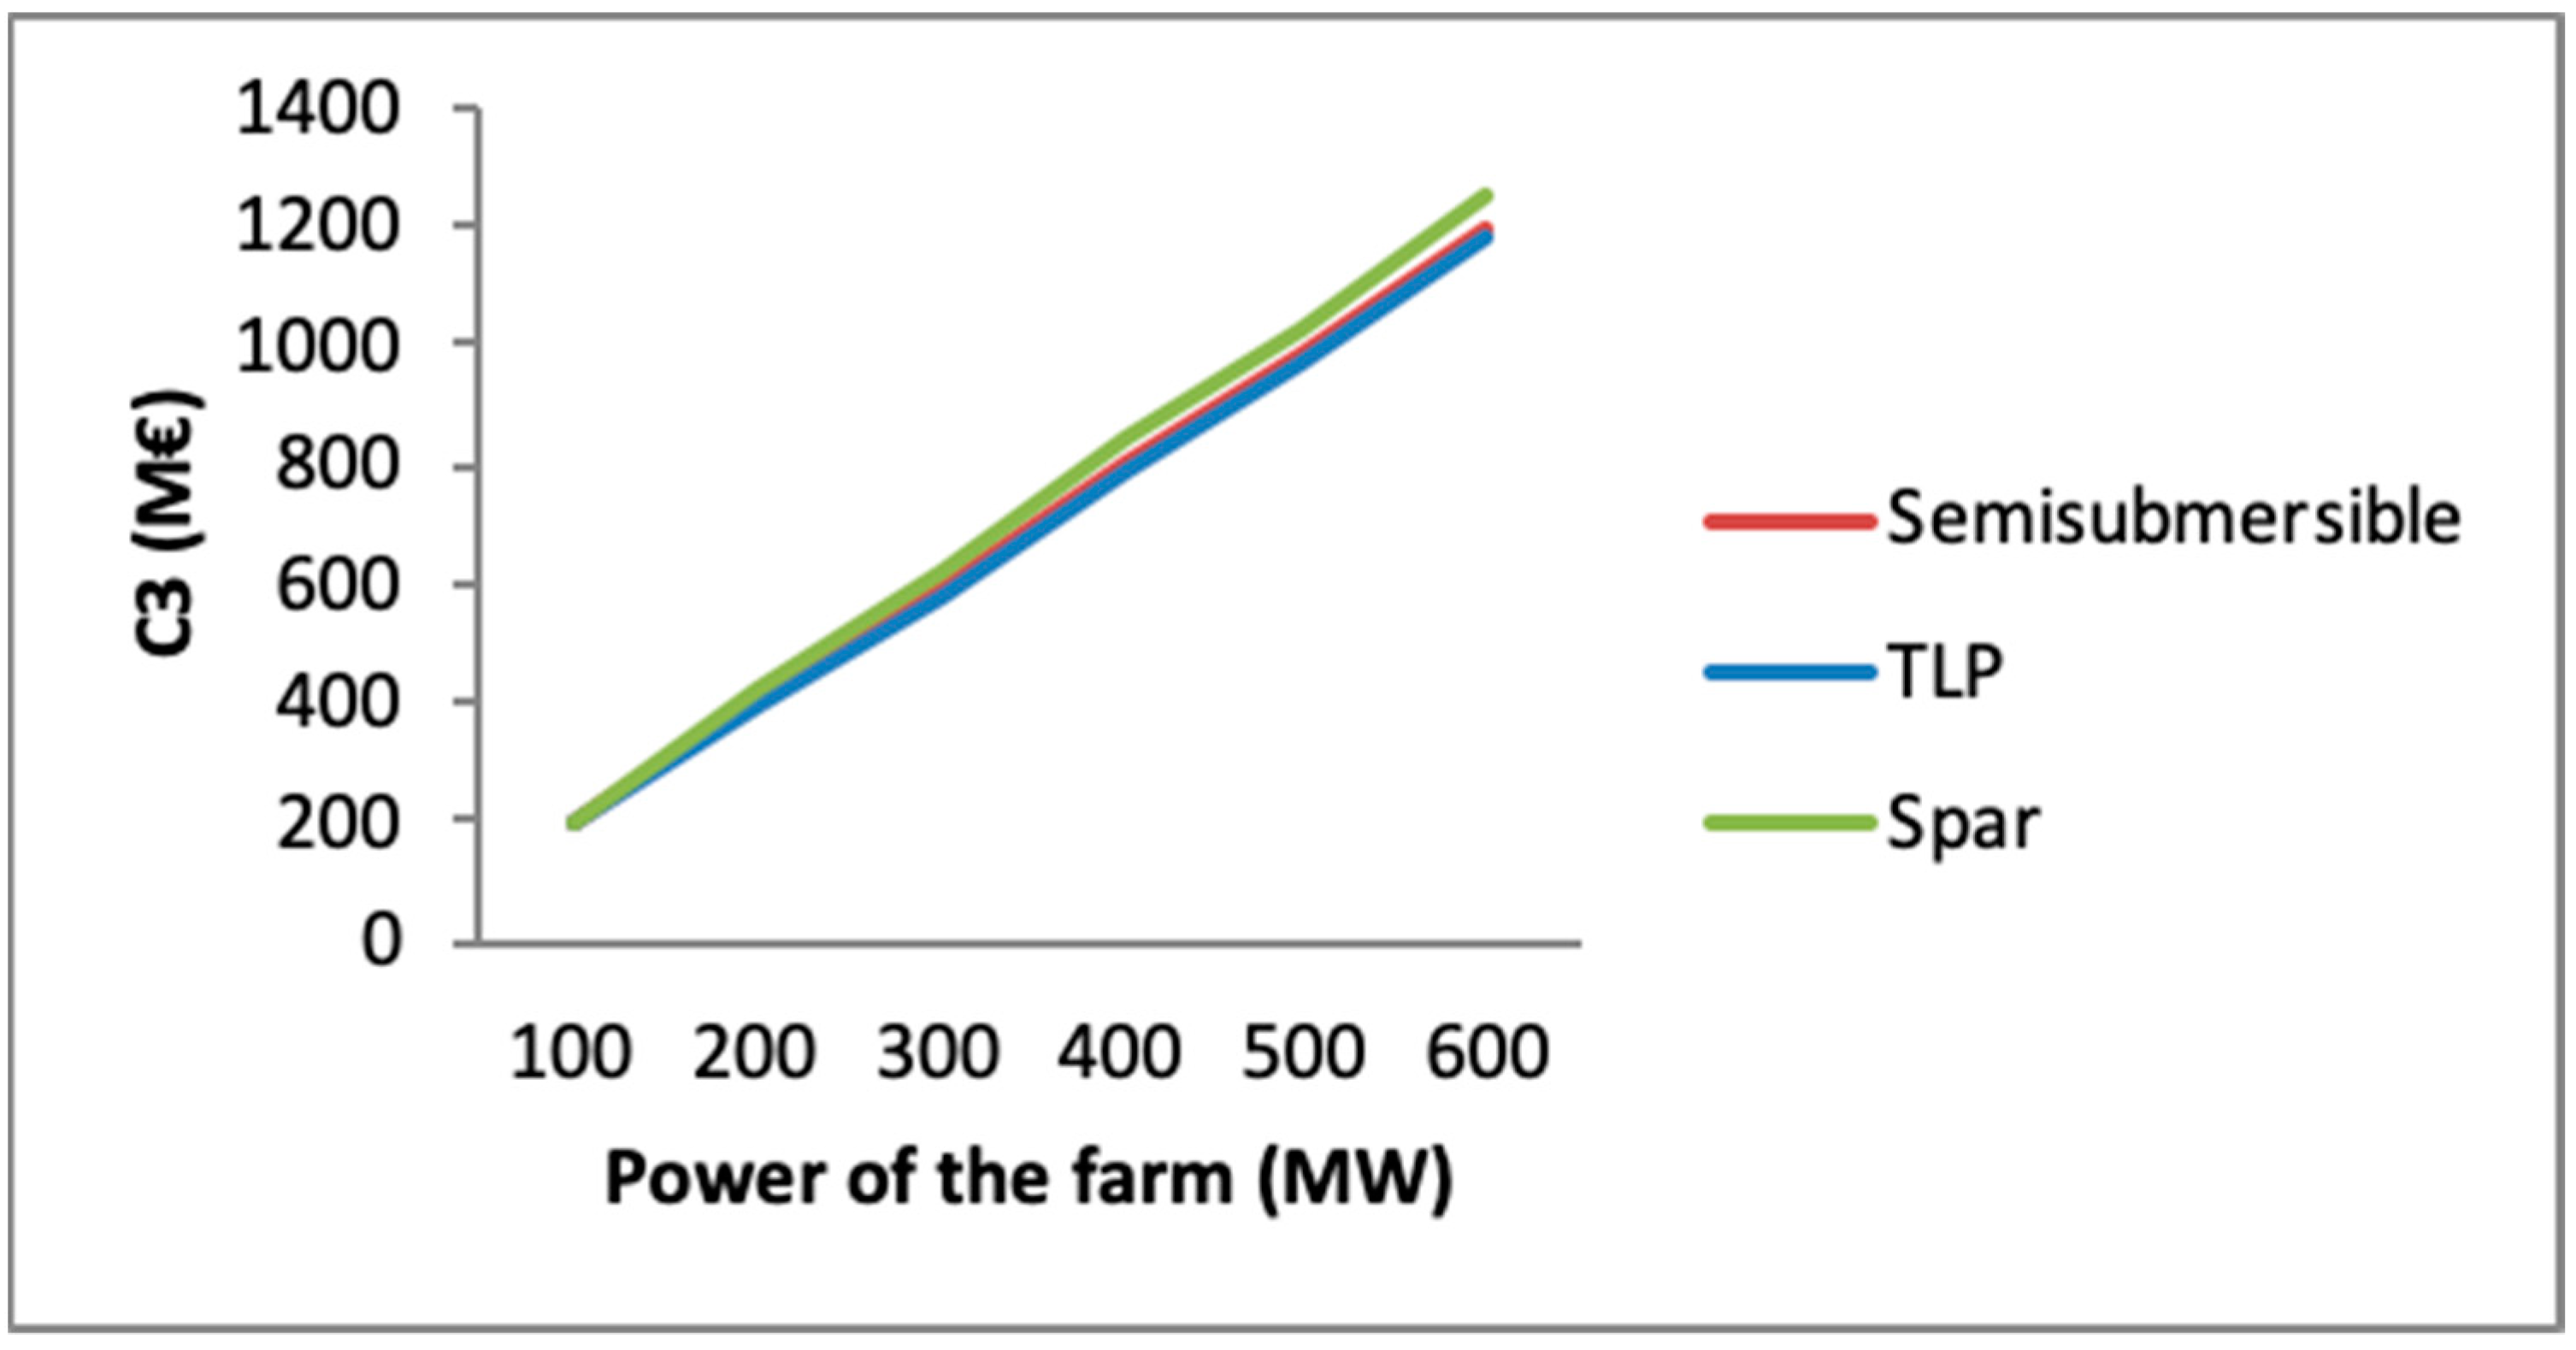
Considering the only the best point of the geography for all the scenarios, Figure 6 shows the variation of the cost of manufacturing regarding the power of the farm. More power of the farm indicates more cost of manufacturing.
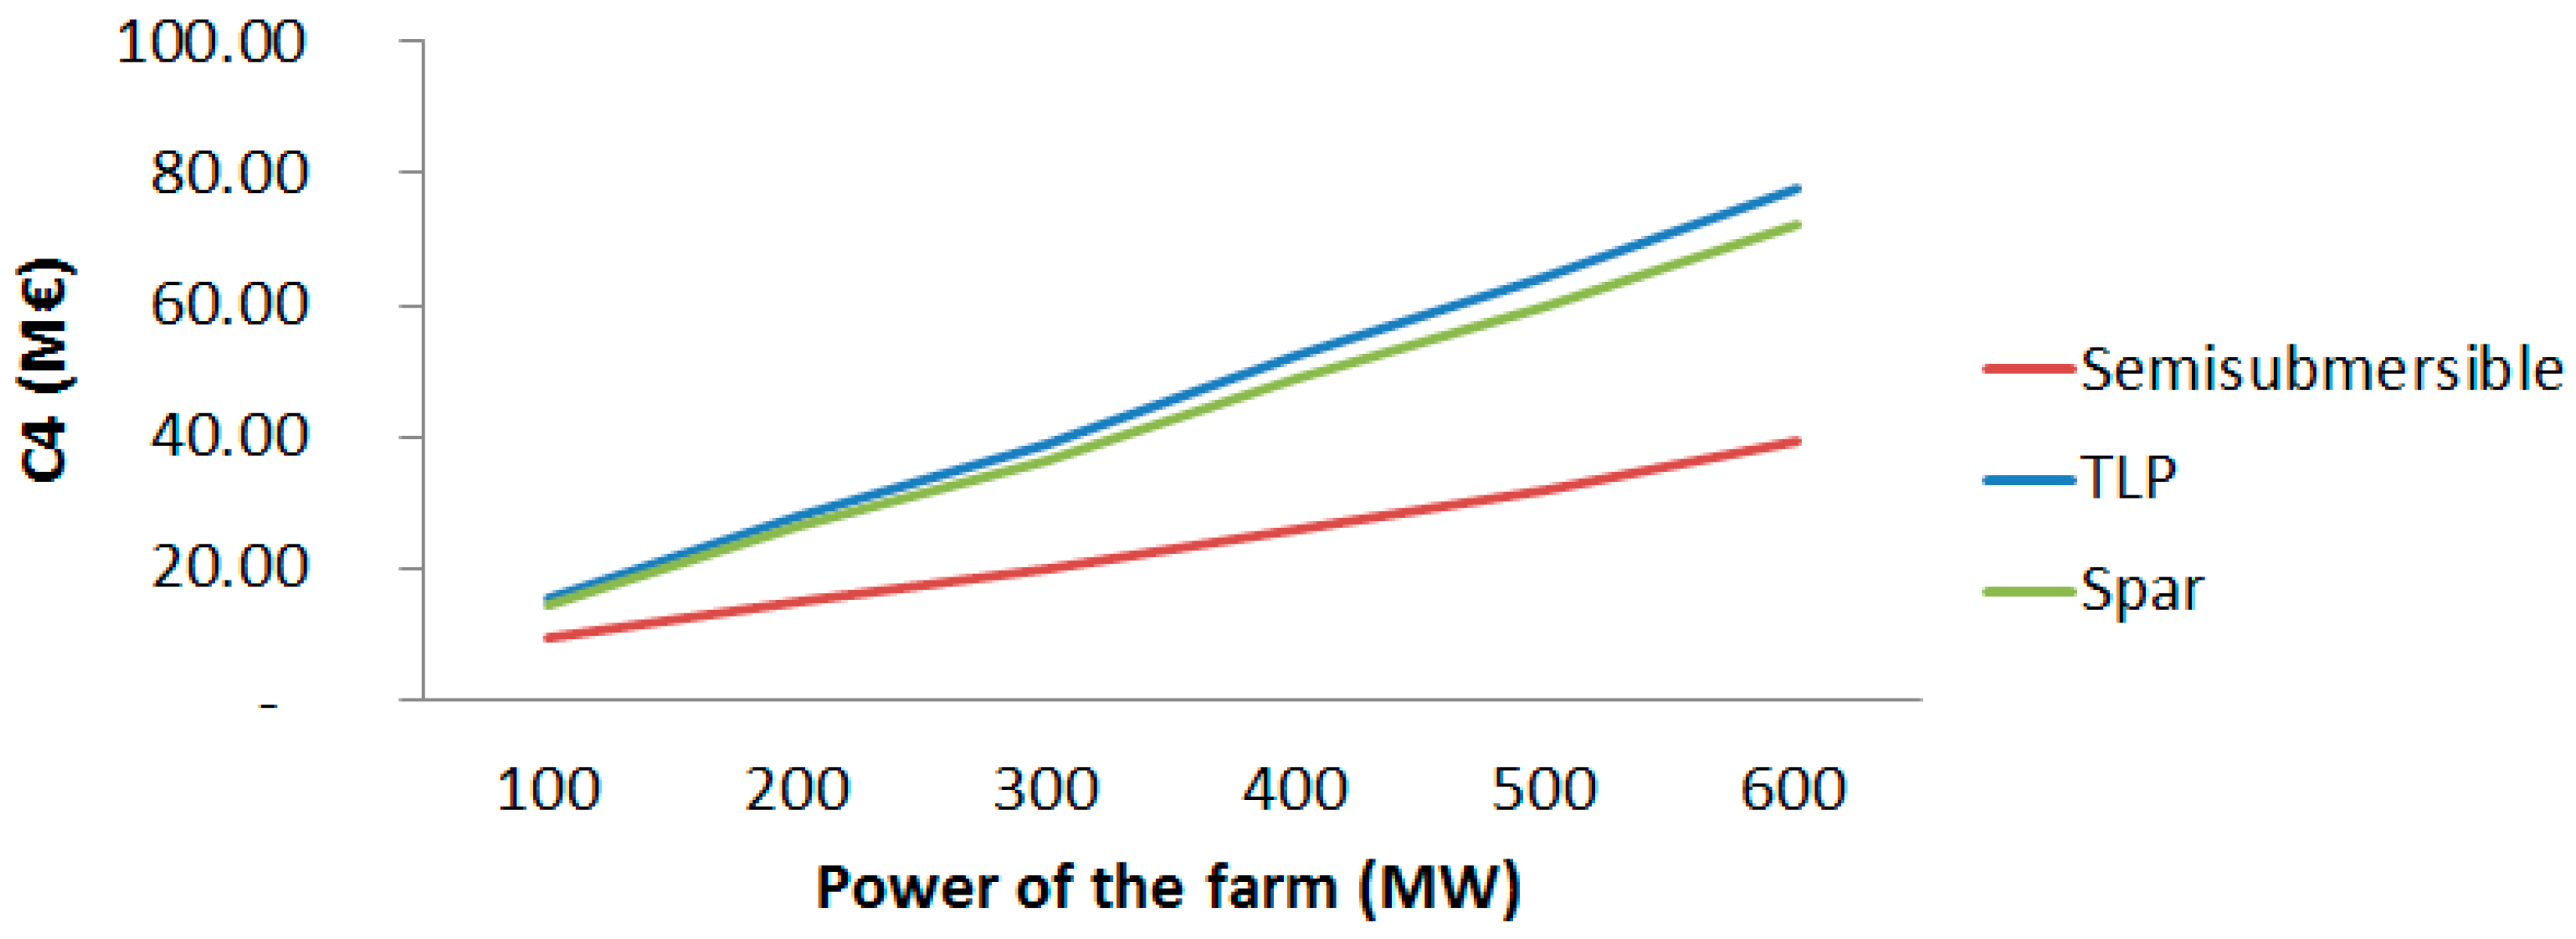
Figure 7 shows, such as the cost of manufacturing, how the cost of installing is increasing according the size of the farm. Furthermore, the cost of installing a semisubmersible platform is lower than the installation of the tensioned or the spar structures due to the way of transport of the floating platform from the shipyard, where it is built, to the offshore location, where it is installed. The semisubmersible structure can be directly towed, while the spar and tensioned structures require specific vessels for the process.
4.2. Levelized Cost of Energy
The LCOE has been calculated taking into consideration the costs previously analyzed and following the equations proposed in previous papers [40,47].
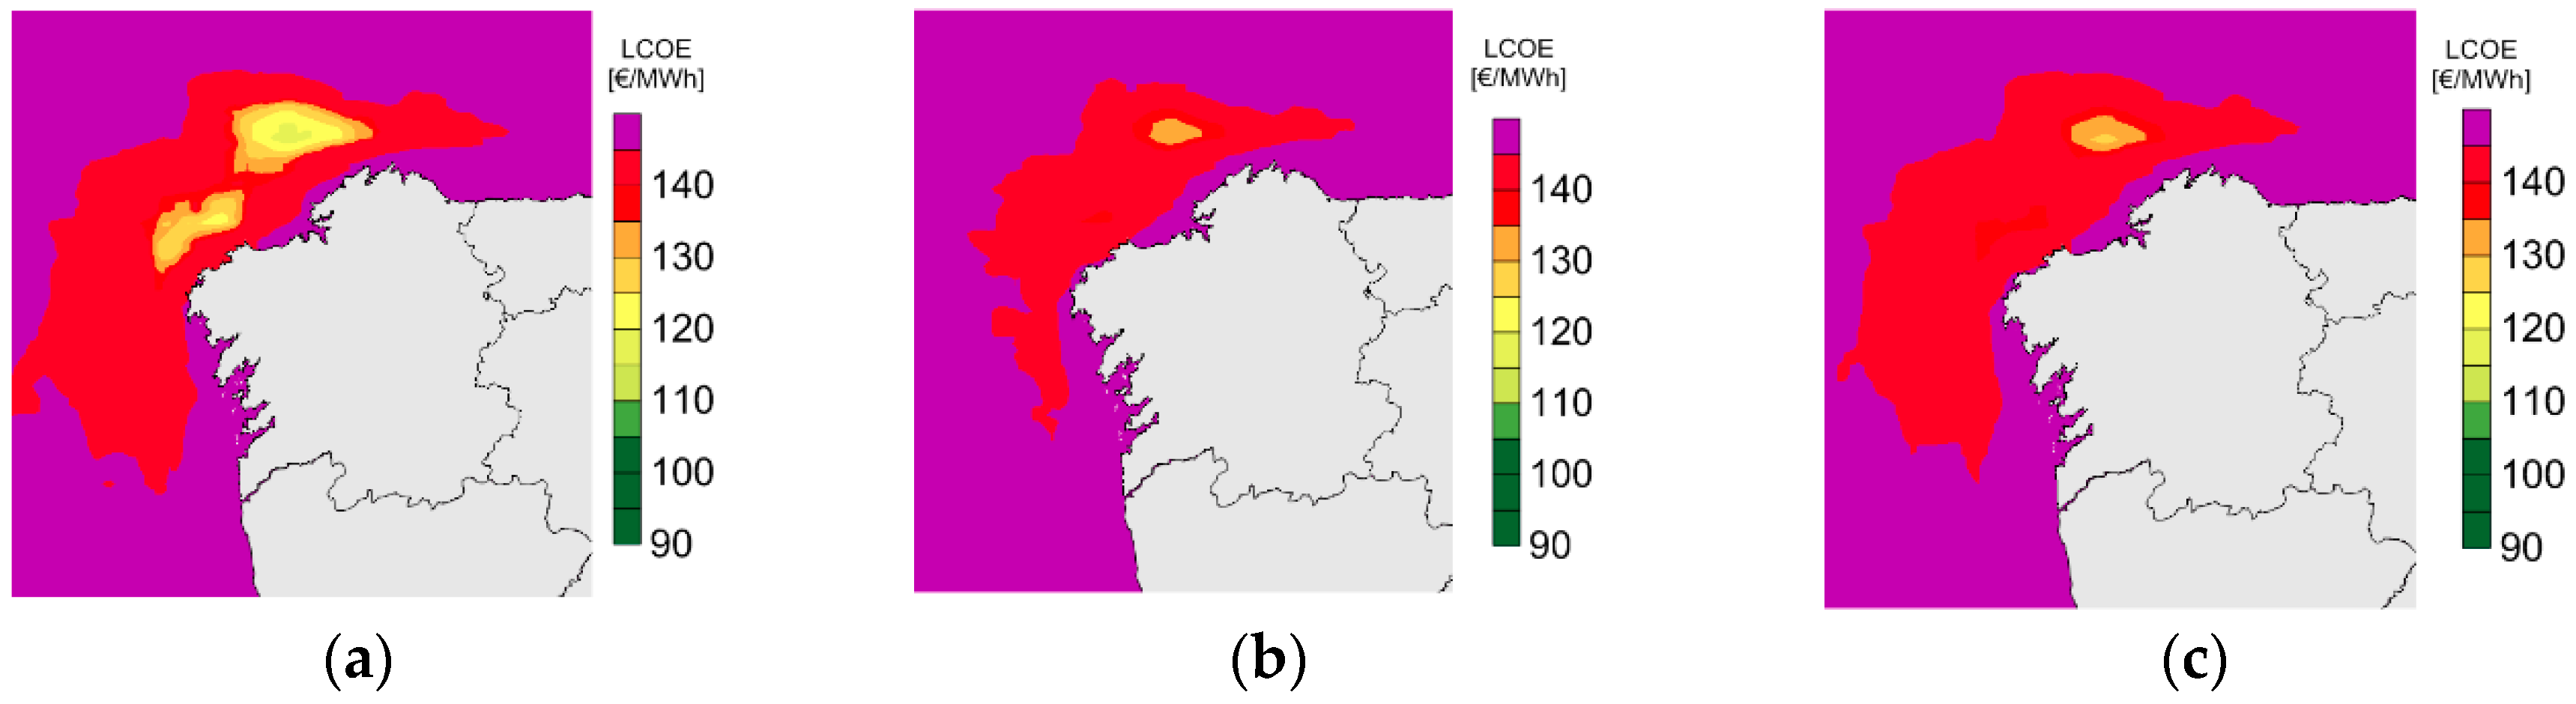
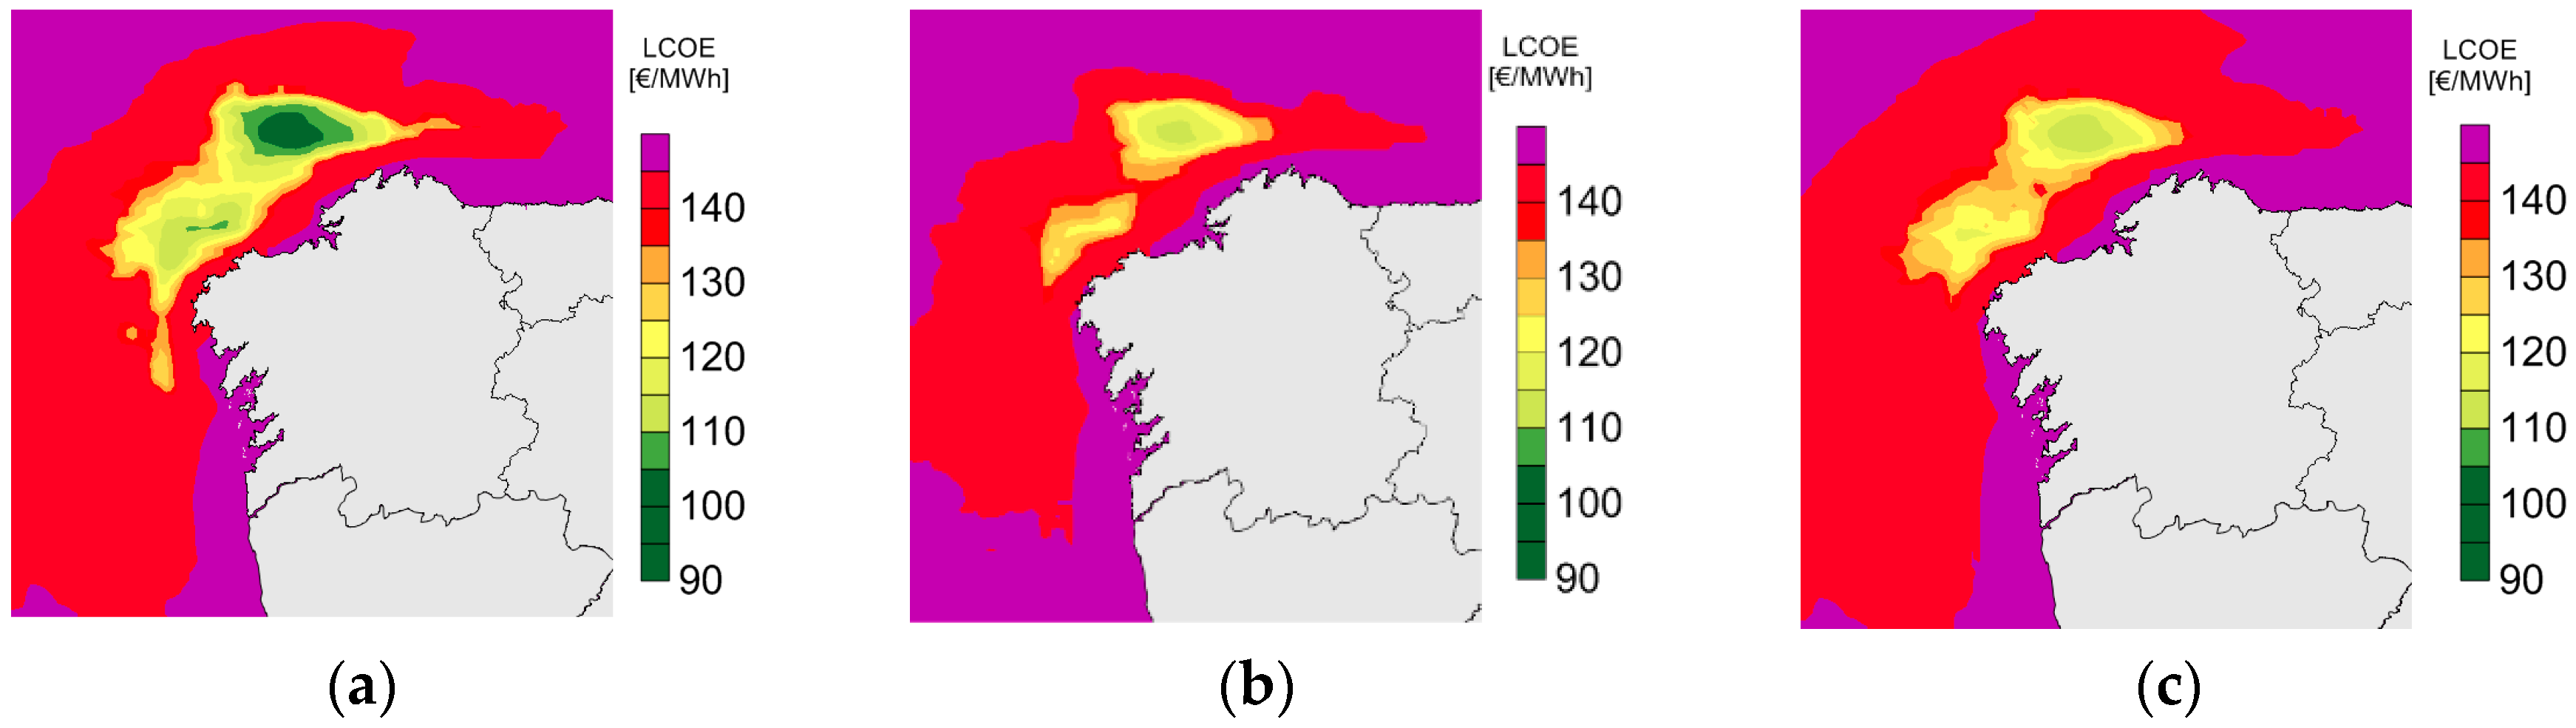
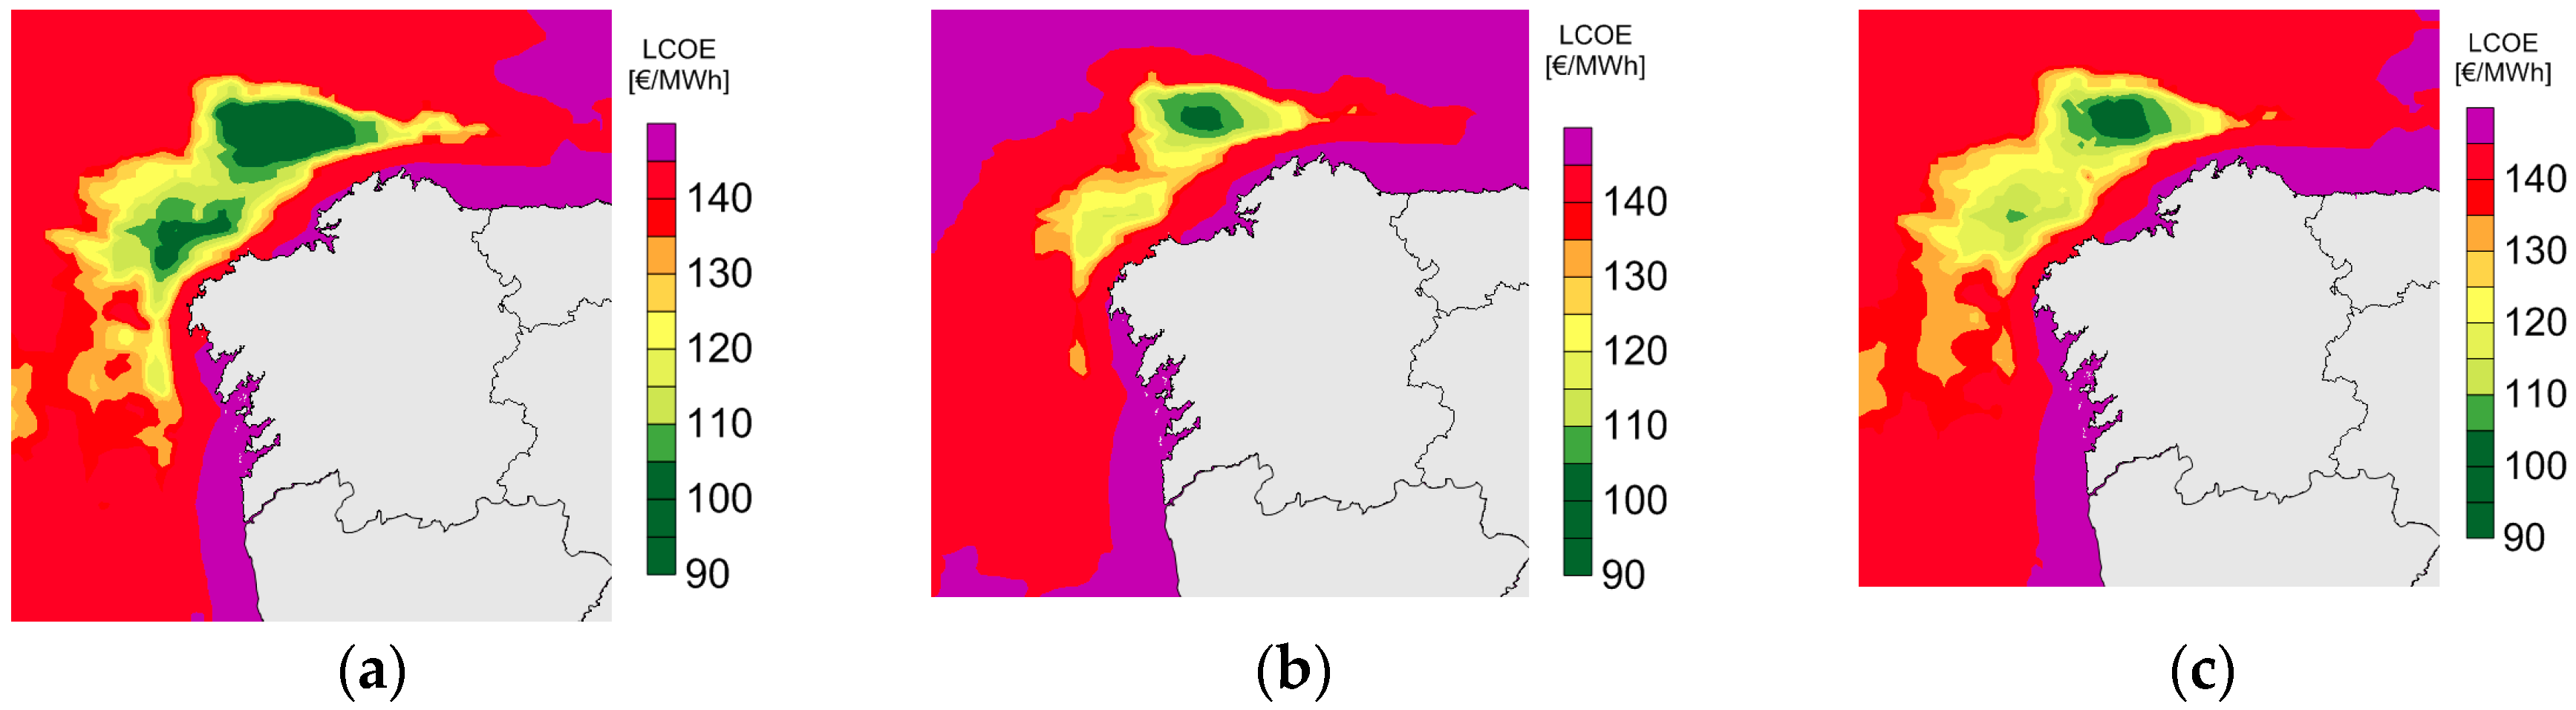
The smallest floating offshore wind farm considered has 100 MW of total power. It gives an LCOE from 117.05 to 1128.7 €/MWh for a farm with PA platforms (Figure 8a), from 130.03 to 1280.9 €/MWh for a farm with PB platforms (Figure 8b), and from 127.9 to 1282.4 €/MWh for a farm with PC platforms (Figure 8c).
The farm of 200 MW of total power gives an LCOE from 100.31 to 882.93 €/MWh for a farm with PA platforms (Figure 9a), from 112.14 to 1011.4 €/MWh for a farm with PB platforms (Figure 9b), and from 109.99 to 1012.7 €/MWh for a farm with PC platforms (Figure 9c).
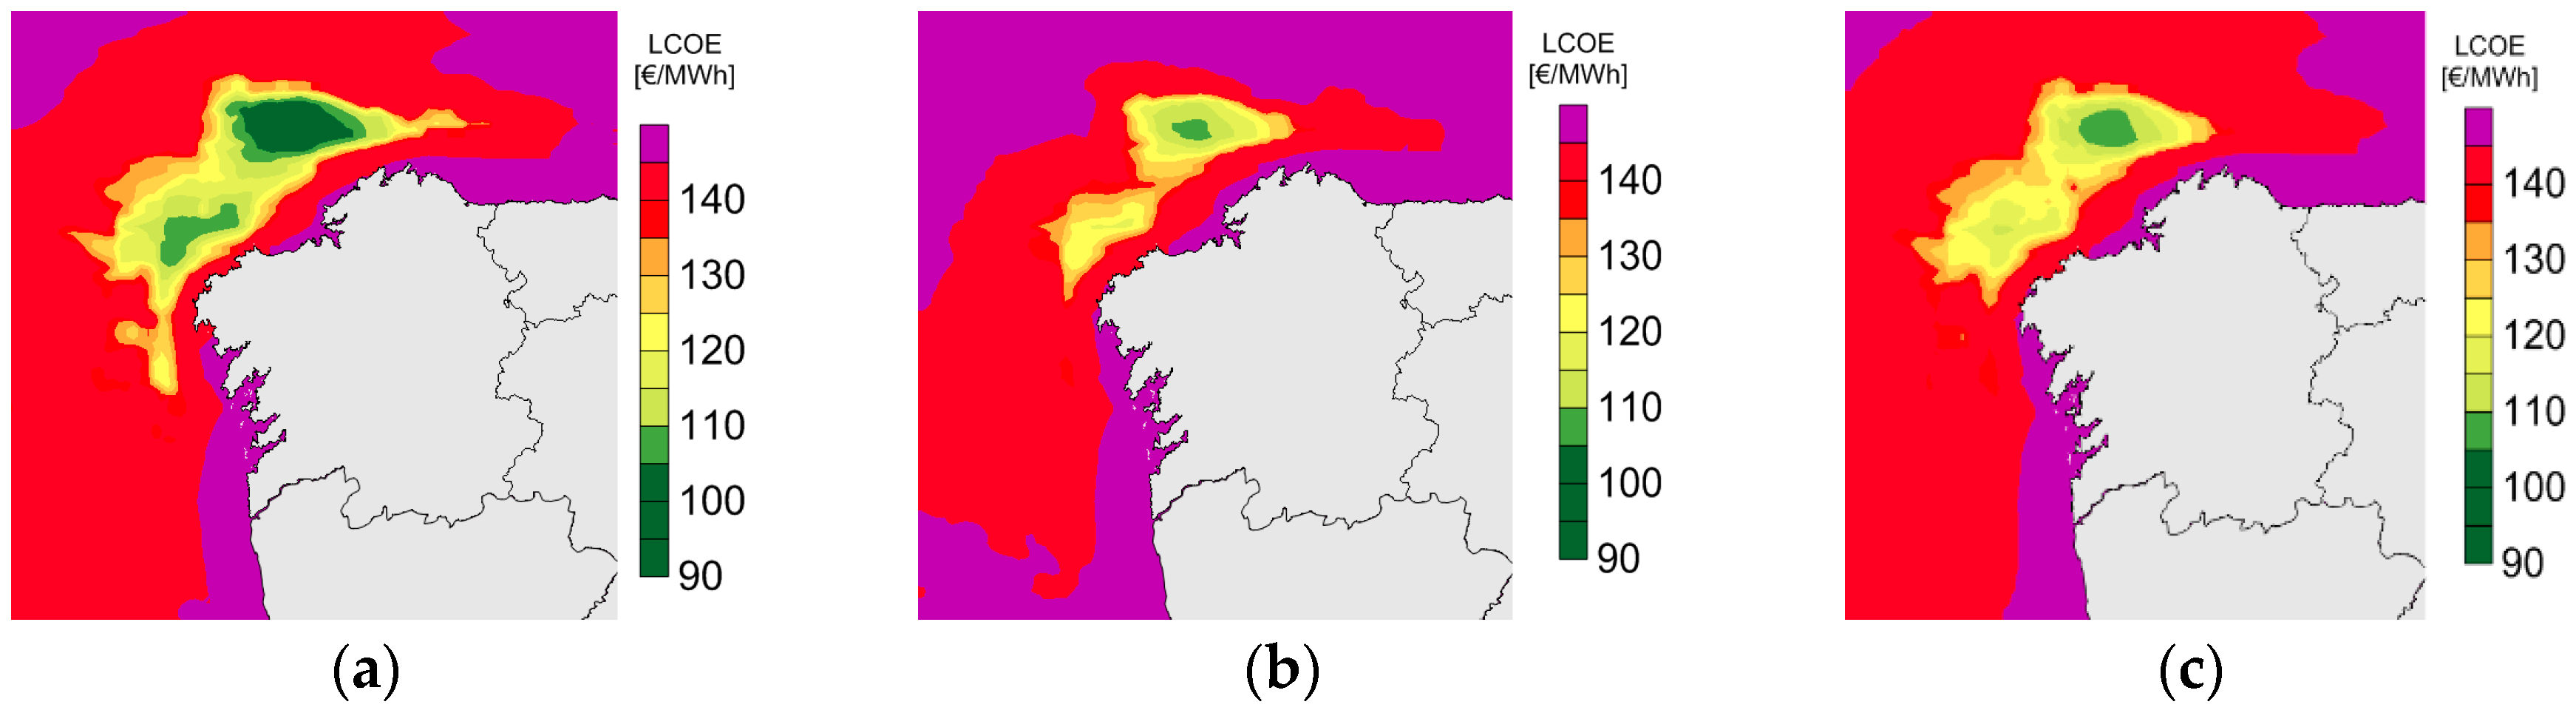
Thirdly, the farm of 300 MW of total power gives an LCOE from 96.29 to 820.78 €/MWh for a farm with PA platforms (Figure 10a), from 107.83 to 943.19 €/MWh for a farm with PB platforms (Figure 10b), and from 105.68 to 944.33 €/MWh for a farm with PC platforms (Figure 10c).
The farm of 400 MW of total power gives an LCOE from 93.70 to 782.61 €/MWh for a farm with PA platforms (Figure 11a), from 105.07 to 901.35 €/MWh for a farm with PB platforms (Figure 11b), and from 102.91 to 902.28 €/MWh for a farm with PC platforms (Figure 11c).
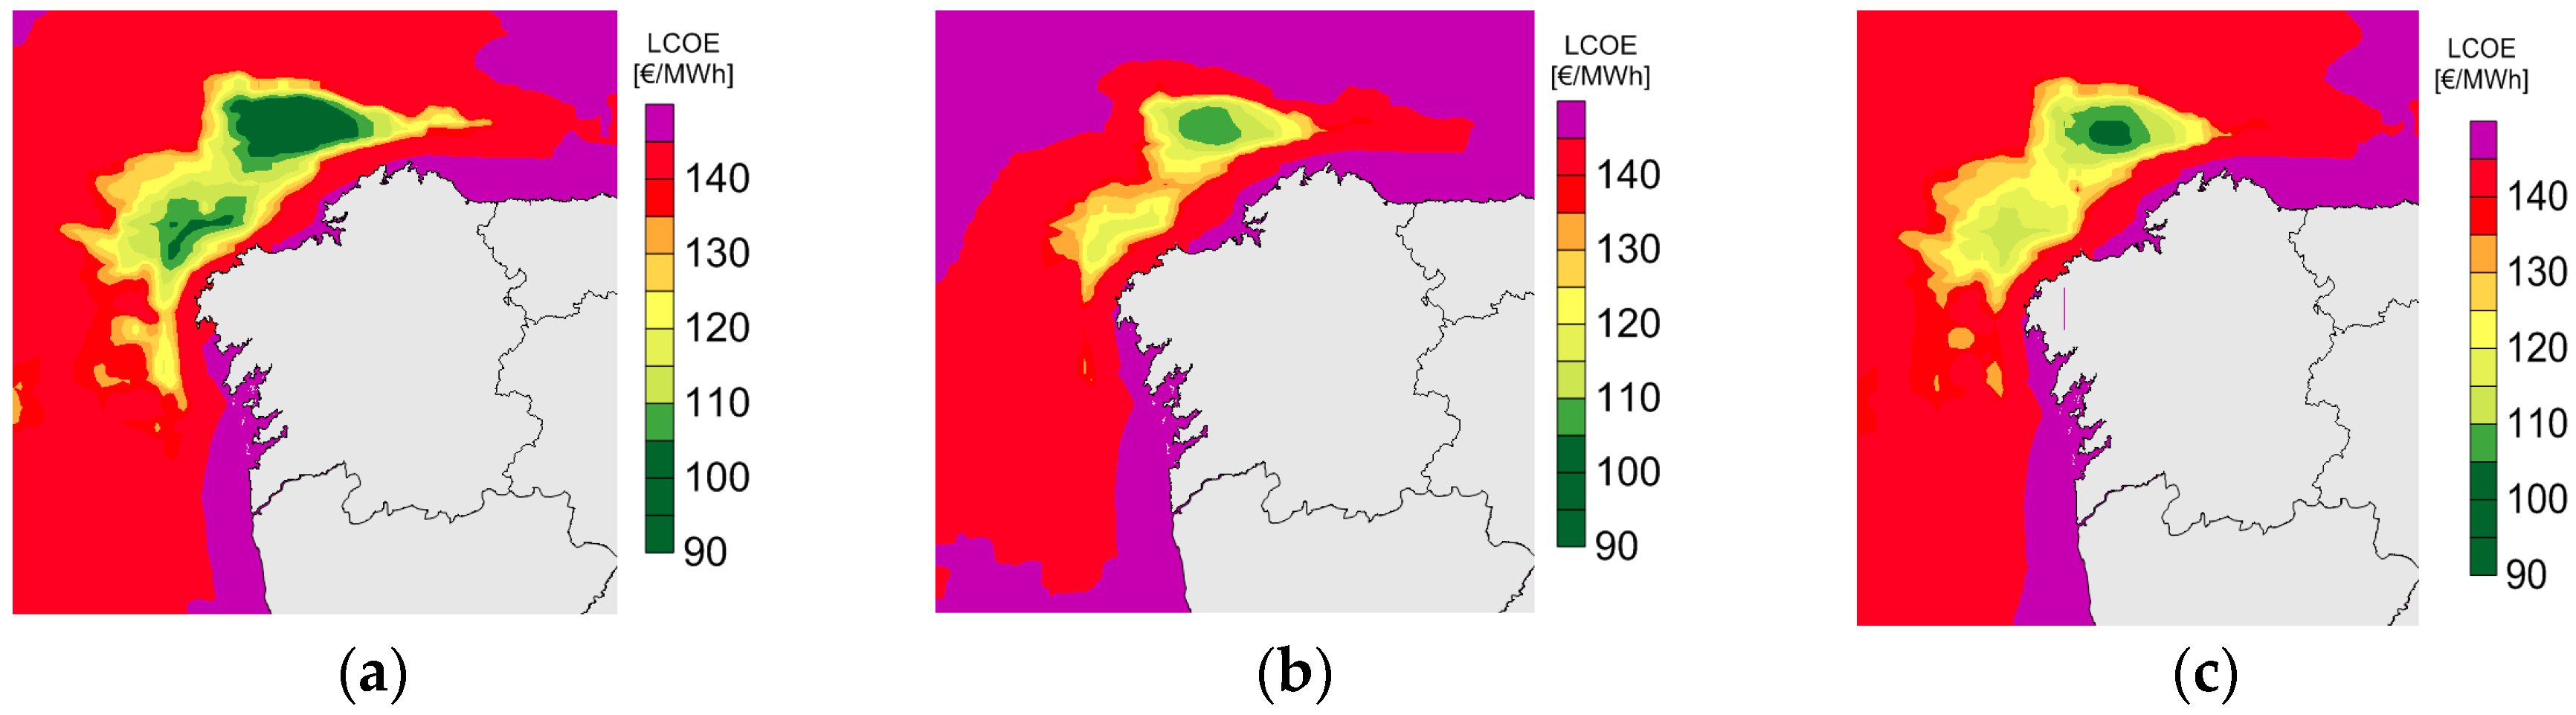
The farm of 500 MW of total power gives an LCOE from 92.69 to 765.82 €/MWh for a farm with PA platforms (Figure 12a), from 103.99 to 882.93 €/MWh for a farm with PB platforms (Figure 12b), and from 101.82 to 883.68 €/MWh for a farm with PC platforms (Figure 12c).
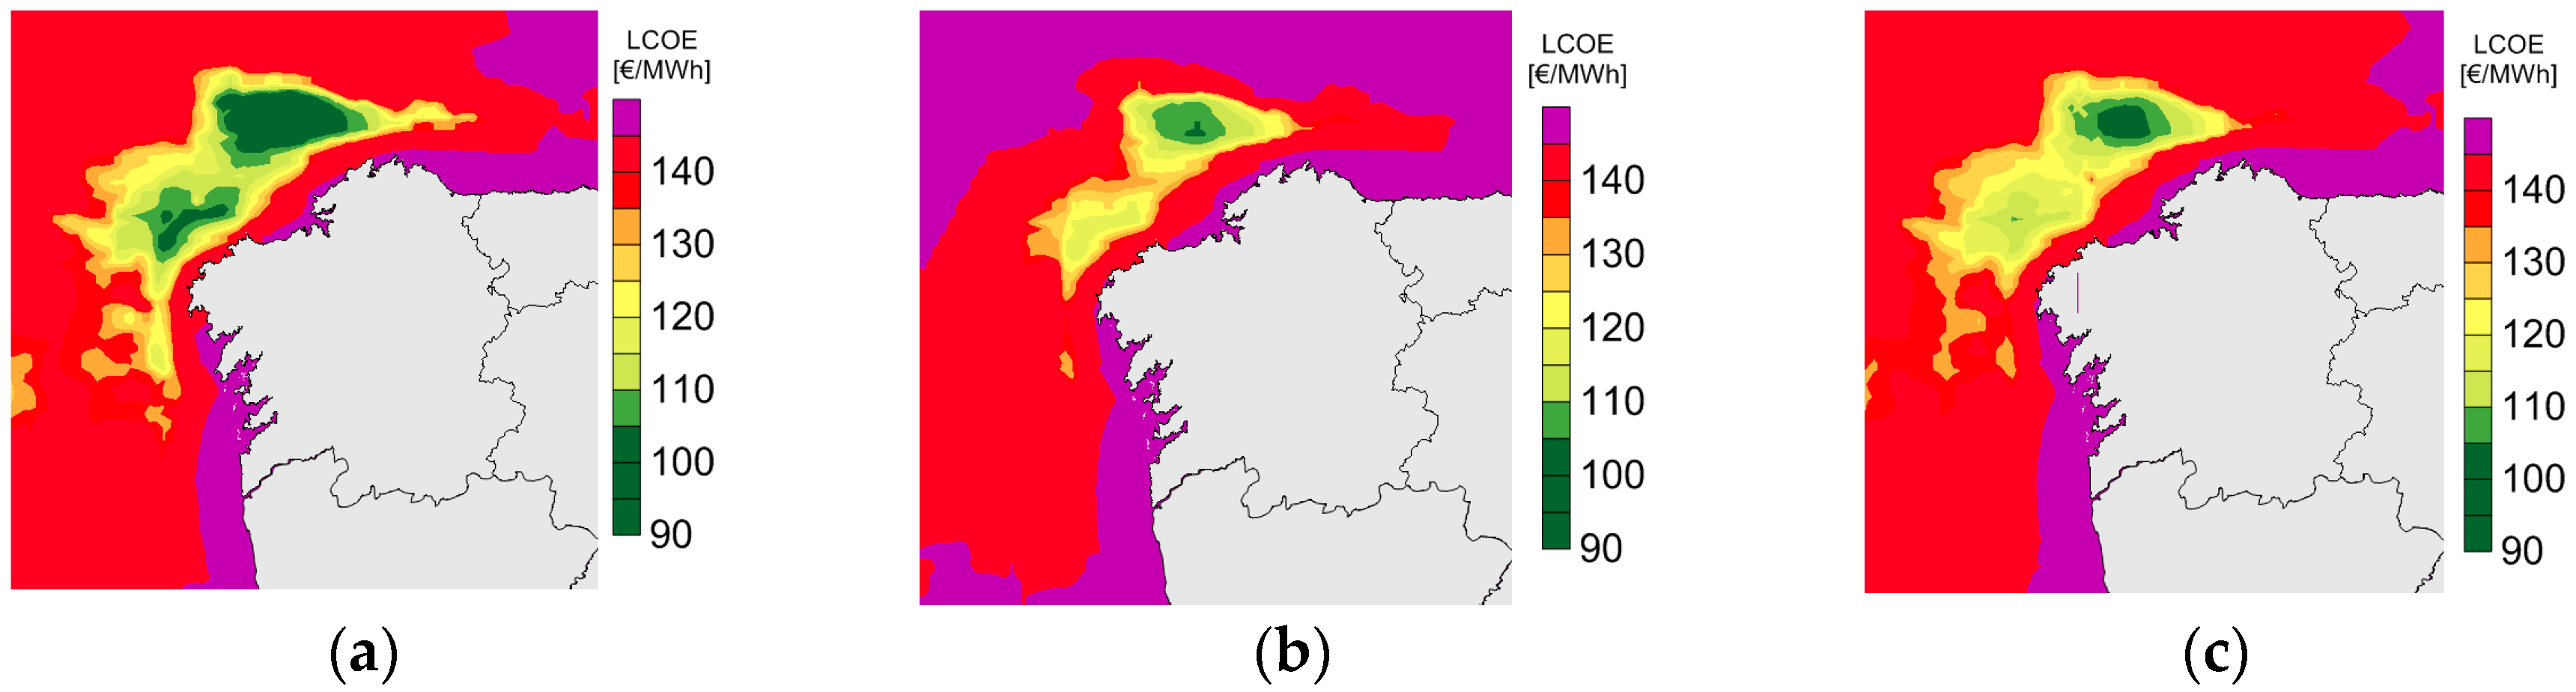
Finally, biggest farm, whose total power is 600 MW, gives an LCOE from 91.74 to 751.45 €/MWh for a farm with PA platforms (Figure 13a), from 102.97 to 867.18 €/MWh for a farm with PB platforms (Figure 13b), and from 100.8 to 867.73 €/MWh for a farm with PC platforms (Figure 13c).
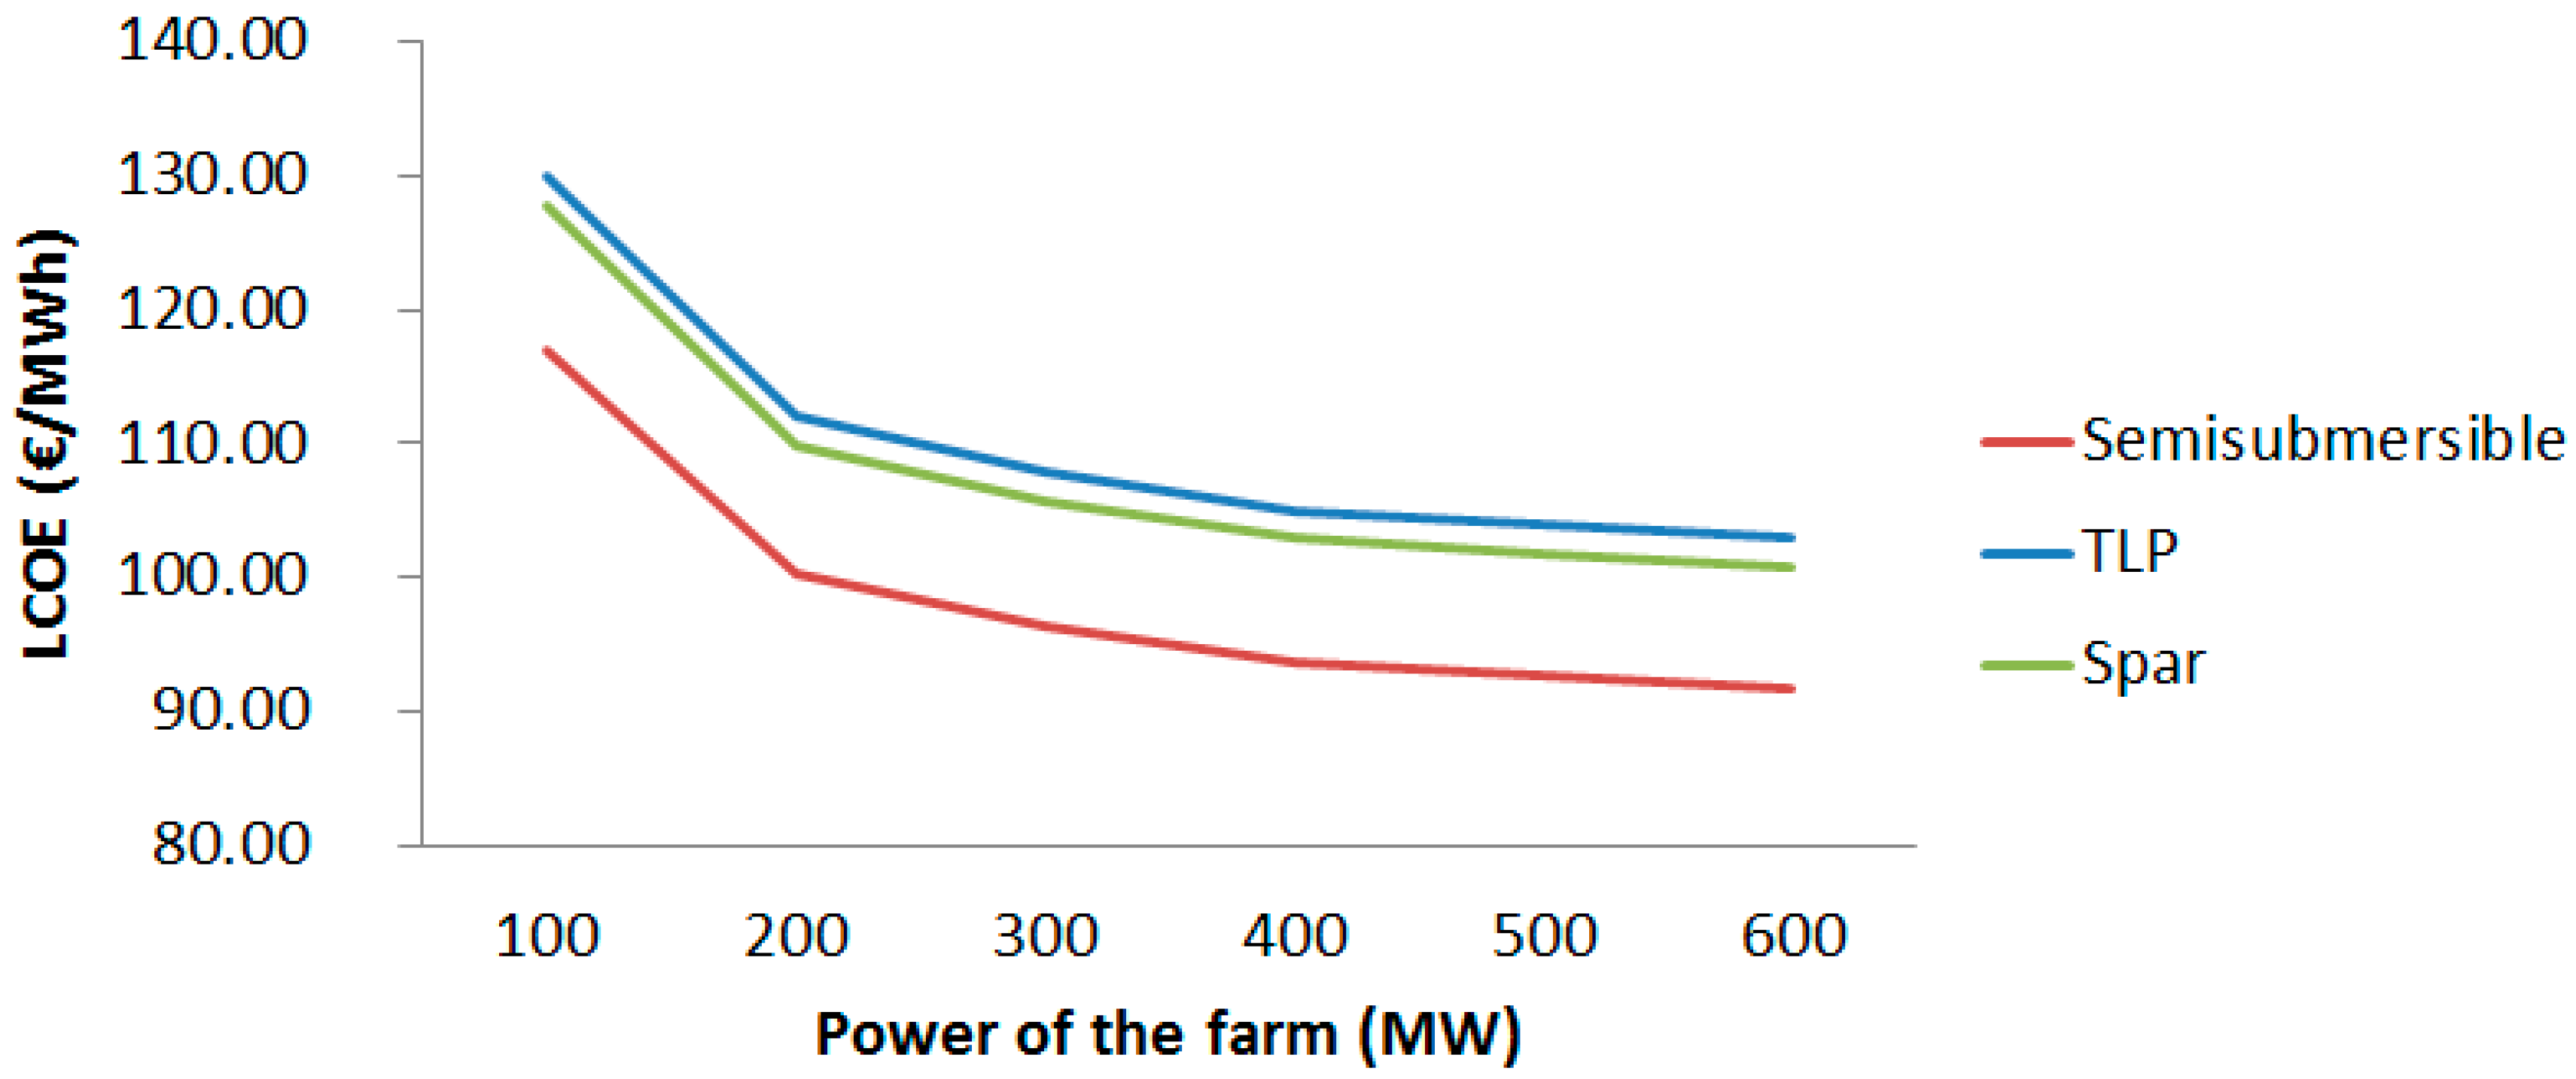
We can observe that in all the previous types of offshore farms studied (100 MW, 200 MW, 300 MW, 400 MW, 500 MW, and 600 MW), the best value for LCOE is for the PA platform (semisubmersible structure). Additionally, Figure 14 represents the evolution of the LCOE considering several types of floating wind platforms and the six alternatives of the total power for the farm. This figure only takes into account the values of the best point of the geography. It shows how the LCOE is lower when the total power of the farm is increased for all the types of floating wind structures (spar, semisubmersible, and tensioned). For instance, for the case of the PA (semisubmersible platform), the LCOE is reduced from 117.05 to 91.74 €/MWh for the 100 MW and the 600 MW respectively, which represents a reduction of 21.63% of the value regarding the small farm; for the case of the PB (tensioned platform), the LCOE is reduced from 130.03 to 102.97 €/MWh for the 100 MW and the 600 MW respectively, which represents a reduction of 20.81%; and for the case of the PC (spar platform), the LCOE is reduced from 127.90 to 100.80 €/MWh for the 100 MW and the 600 MW respectively, which represents a reduction of 21.19%. Therefore, we can conclude that these types of installations should be carried out considering a big farm of more than 100 MW of total power and independently of the type of floating wind structure.
In conclusion, results are focused in the LCOE and the costs, two parameters that have influence on the size of the farm. Considering the LCOE the best floating structure for the same location is the semisubmersible platform. This value is reduced a value around a 21% when the total power of the farm is increased for all the types of platforms and farms. Therefore, a floating offshore wind farm should be higher than a 100 MW farm. In addition, installation and manufacturing costs have great variations considering the size of the farm.
5. Conclusion and Policy Implications
This paper has developed a method to analyze the economic influence, in terms of its LCOE and its costs, of the size of floating offshore wind farms. The economic aspects analyzed, LCOE and the costs, depend on the number of floating offshore wind turbines, which establishes the importance of the size of the farm. In addition, this influence has been carried out for a map in a specific location.
Regarding the case of study, some alternatives have been considered taking into account the total power of the farm (100 MW, 200 MW, 300 MW, 400 MW, 500 MW, and 600 MW), which involve a different number of floating offshore wind generators, and the kinds of floating structures (semisubmersible, tensioned and spar). All these aspects have been studied for the location of Galicia (Spain).
Results are centred in two main economic influences of the size of the farm: the LCOE and the costs. In terms of LCOE, the semisubmersible structure has the best economic value. In addition, the LCOE reduces its value when the total power of the floating offshore wind farm is increased for all kinds of offshore structures. This reduction is from 20.81% to 21.63% depending on the type of platform and considering a farm of 100 MW and a farm of 600 MW. Consequently, the installation of a floating wind farm should consider a big farm of more than 100 MW. On the other hand, costs of manufacturing and installing have the biggest variations regarding the size of the farm.
This study will help Governments to know the influence that size has in the economic development of a floating offshore wind farm located in a particular location. This fact can be considered by Governments in order to analyze the offshore renewable energy policies of their countries. For instance, they need to know the size of the locations where a floating offshore wind farm will be installed at sea in order to analyze their maritime traffic or other factors. It is directly related to the size of the farm in terms of the total power, which has been analyzed in the present paper. In addition, this tool can help to plan the characteristics of a farm in future investments. It helps to analyze the best locations in economic terms where a floating offshore wind farm can be installed to focus the main efforts of Governments in these areas.
Author Contributions
Formal analysis, L.C.-S.; Investigation, L.C.-S.; Methodology, L.C.-S.; Resources, L. C.-S., A.F.-V., C.Á.-F. and L.C.; Software, L.C.-S.; Writing—original draft, L.C.-S.; Writing—review and editing, A.F.-V., C.Á.-F., L.C. and L.C.-S.
Funding
This research was funded by the European Regional Development Fund through the Interreg Atlantic Area Programme.
Acknowledgments
This work was performed in the scope of the ARCWIND project (EAPA_344/2016), co-financed by the European Regional Development Fund through the Interreg Atlantic Area Programme.
Conflicts of Interest
The authors declare no conflict of interest.
References
- Hoogwijk, M.; de Vries, B.; Turkenburg, W. Assessment of the global and regional geographical, technical and economic potential of onshore wind energy. Energy Econ. 2004, 26, 889–919. [Google Scholar] [CrossRef] [Green Version]
- WindEurope. Wind in Power. 2016 European Statistics; WindEurope: Brussels, Belgium, 2017. [Google Scholar]
- Lamy, J.V.; Azevedo, I.L. Do tidal stream energy projects offer more value than offshore wind farms? A case study in the United Kingdom. Energy Policy 2018, 113, 28–40. [Google Scholar] [CrossRef]
- WindEurope. Wind Energy in Europe: Scenarios for 2030; WindEurope: Brussels, Belgium, 2017. [Google Scholar]
- WindEurope. Driving Cost Reductions In offshore Wind; WindEurope: Brussels, Belgium, 2017. [Google Scholar]
- WindEurope. The European Offshore Wind Industry. Key Trends and Statistics 2016; WindEurope: Brussels, Belgium, 2017. [Google Scholar]
- European Wind Energy Association (EWEA). Wind in Our Sails, The Coming of Europe’s Offshore Wind Energy Industry; EWEA: Brussels, Belgium, 2011. [Google Scholar]
- Musial, W.; Butterfield, S.; Boone, A. Feasibility of Floating Platform Systems for Wind Turbines. In Proceedings of the 42nd AIAA Aerospace Sciences Meeting and Exhibit, Reno, Nevada, 5–8 January 2004; NREL (National Renewable Energy Laboratory): Reno, Nevada, 2004; p. 1007. [Google Scholar]
- Henderson, A.R.; Leutz, R.; Fujii, T. Potential for Floating Offshore Wind Energy in Japanese Waters. In Proceedings of the 12th International Offshore and Polar Engineering Conference, Kitakyushu, Japan, 26–31 May 2002; International Society of Offshore and Polar Engineers: Kitakyushu, Japan, 2002; Volume 3, pp. 505–512. [Google Scholar]
- Jonkman, J.; Matha, D. A Quantitative Comparison of the Responses of Three Floating Platforms; National Renewable Energy Laboratory (NREL): Stockholm, Sweden, 2010. [Google Scholar]
- Drake, K.R.; Smith, T.W.P. An investigation into the use of an articulated column supported wind turbine in water depths of 60–120 metres. In RINA Royal Institution of Naval Architects Marine Renewable and Offshore Wind Energy Papers; Royal Institution of Naval Architects: London, UK, 2010; pp. 55–62. [Google Scholar]
- Pérez-Collazo, C.; Greaves, D.; Iglesias, G. A review of combined wave and offshore wind energy. Renew. Sustain. Energy Rev. 2015, 42, 141–153. [Google Scholar] [CrossRef]
- Astariz, S.; Vazquez, A.; Iglesias, G. Evaluation and comparison of the levelized cost of tidal, wave, and offshore wind energy. J. Renew. Sustain. Energy 2015, 7, 053112. [Google Scholar] [CrossRef]
- Lozano-Minguez, E.; Kolios, A.J.; Brennan, F.P. Multi-criteria assessment of offshore wind turbine support structures. Renew. Energy 2011, 36, 2831–2837. [Google Scholar] [CrossRef] [Green Version]
- Henderson, A.R.; Zaaijer, M.B.; Bulder, B.; Pierik, J.; Huijsmans, R.; Van Hees, M.; Snijders, E.; Wijnants, G.H.; Wolf, M.J. Floating windfarms for shallow offshore sites. In Proceedings of the 14th International Offshore and Polar Engineering Conference, Toulon, France, 23–28 May 2004; The International Society of Offshore and Polar Engineers: Mountain View, CA, USA, 2004; pp. 120–127. [Google Scholar]
- Wang, C.M.; Utsunomiya, T.; Wee, S.C.; Choo, Y.S. Research on floating wind turbines: A literature survey. IES J. Part A Civ. Struct. Eng. 2010, 3, 267–277. [Google Scholar] [CrossRef]
- Li, Q.; Kamada, Y.; Maeda, T.; Murata, J.; Iida, K.; Okumura, Y. Fundamental study on aerodynamic force of floating offshore wind turbine with cyclic pitch mechanism. Energy 2016, 99, 20–31. [Google Scholar] [CrossRef]
- Myhr, A.; Bjerkseter, C.; Ågotnes, A.; Nygaard, T.A. Levelised cost of energy for offshore floating wind turbines in a life cycle perspective. Renew. Energy 2014, 66, 714–728. [Google Scholar] [CrossRef]
- Kausche, M.; Adam, F.; Dahlhaus, F.; Großmann, J. Floating offshore wind—Economic and ecological challenges of a TLP solution. Renew. Energy 2018, 126, 270–280. [Google Scholar] [CrossRef]
- Oguz, E.; Clelland, D.; Day, A.H.; Incecik, A.; López, J.A.; Sánchez, G.; Almeria, G.G. Experimental and numerical analysis of a TLP floating offshore wind turbine. Ocean Eng. 2018, 147, 591–605. [Google Scholar] [CrossRef]
- Aubault, A.; Cermelli, C.; Roddier, D. Windfloat: A floating foundation for offshore wind turbines. Part III: Structural analysis. In Proceedings of the ASME 28th International Conference on Ocean, offshore and Arctic Engineering OMAE2009, Honolulu, HI, USA, 31 May–5 June 2009; ASME Press: New York, NY, USA, 2009; pp. 1–8. [Google Scholar]
- Roddier, D.; Cermelli, C. Windfloat: A floating foundation for offshore wind turbines. Part I: design basis and qualification process. In Proceedings of the ASME 28th International Conference on Ocean, Offshore and Arctic Engineering OMAE2009, Honolulu, HI, USA, 31 May–5 June 2009; ASME Press: New York, NY, USA, 2009; pp. 1–9. [Google Scholar]
- Cermelli, C. Windfloat: A Floating foundation for offshore wind turbines. Part II: Hydrodynamics analysis. In Proceedings of the ASME 28th International Conference on Ocean, Offshore and Arctic Engineering OMAE2009, Honolulu, HI, USA, 31 May–5 June 2009; ASME Press: New York, NY, USA, 2009; pp. 1–9. [Google Scholar]
- Liu, Y.; Li, S.; Yi, Q.; Chen, D. Developments in semi-submersible floating foundations supporting wind turbines: A comprehensive review. Renew. Sustain. Energy Rev. 2016, 60, 433–449. [Google Scholar] [CrossRef]
- Castro-Santos, L.; Martins, E.; Guedes Soares, C. Cost assessment methodology for combined wind and wave floating offshore renewable energy systems. Renew. Energy 2016, 97, 866–880. [Google Scholar] [CrossRef]
- Thomsen, F.; Luedemann, K.; Piper, W.; Judd, A.; Kafemann, R. Potential effects of offshore wind farm noise on fish. Bioacoustics 2008, 17, 221–223. [Google Scholar] [CrossRef]
- Karloseva, A.; Nommann, S.; Nommann, T.; Urbel-Piirsalu, E.; Budzinski, W.; Czajkowski, M.; Hanley, N. Marine trade-offs: Comparing the benefits of off-shore wind farms and marine protected areas. Energy Econ. 2016, 55, 127–134. [Google Scholar] [CrossRef] [Green Version]
- Chipindula, J.; Botlaguduru, V.S.V.; Du, H.; Kommalapati, R.R.; Huque, Z. Life cycle environmental impact of onshore and offshore wind farms in Texas. Sustainability 2018, 10, 2022. [Google Scholar] [CrossRef]
- Jacobsson, S.; Karltorp, K. Mechanisms blocking the dynamics of the European offshore wind energy innovation system—Challenges for policy intervention. Energy Policy 2013, 63, 1182–1195. [Google Scholar] [CrossRef]
- Vagiona, D.G.; Kamilakis, M. Sustainable site selection for offshore wind farms in the South Aegean-Greece. Sustainability 2018, 10, 749. [Google Scholar] [CrossRef]
- Tseng, Y.C.; Lee, Y.M.; Liao, S.J. An integrated assessment framework of offshore wind power projects applying equator principles and social life cycle assessment. Sustainability 2017, 9, 1822. [Google Scholar] [CrossRef]
- Jongbloed, R.H.; Van der Wal, J.T.; Lindeboom, H.J. Identifying space for offshore wind energy in the North Sea. Consequences of scenario calculations for interactions with other marine uses. Energy Policy 2014, 68, 320–333. [Google Scholar] [CrossRef]
- Li, B.; DeCarolis, J.F. A techno-economic assessment of offshore wind coupled to offshore compressed air energy storage. Appl. Energy 2015, 155, 315–322. [Google Scholar] [CrossRef]
- Elkinton, C.N.; Manwell, J.F. Algorithms for offshore wind farm layout optimization. Wind Eng. 2008, 32, 67–84. [Google Scholar] [CrossRef]
- Hopewell, P.D.; Castro-Sayas, F.; Bailey, D.I. Optimising the design of offshore wind farm collection networks. In Proceedings of the 41st International Power Engineering Universities Conference, Newcastle-upon-Tyne, UK, 6–8 September 2006; Northumbria University School of Computing, Engineering and Information Sciences: Newcastle-upon-Tyne, UK, 2006. [Google Scholar]
- Van der Zwaan, B.; Rivera-Tinoco, R.; Lensink, S.; Van den Oosterkamp, P. Cost reductions for offshore wind power: Exploring the balance between scaling, learning and R&D. Renew. Energy 2012, 41, 389–393. [Google Scholar]
- Jensen, C.U.; Panduro, T.E.; Lundhede, T.H.; Nielsen, A.S.E.; Dalsgaard, M.; Thorsen, B.J. The impact of on-shore and off-shore wind turbine farms on property prices. Energy Policy 2018, 116, 50–59. [Google Scholar] [CrossRef]
- Sokoloski, R.; Markowitz, E.M.; Bidwell, D. Public estimates of support for offshore wind energy: False consensus, pluralistic ignorance, and partisan effects. Energy Policy 2018, 112, 45–55. [Google Scholar] [CrossRef]
- Ho, L.-W.; Lie, T.-T.; Leong, P.T.; Clear, T. Developing offshore wind farm siting criteria by using an international Delphi method. Energy Policy 2018, 113, 53–67. [Google Scholar] [CrossRef]
- Castro-Santos, L.; Diaz-Casas, V. Life-cycle cost analysis of floating offshore wind farms. Renew. Energy 2014, 66, 41–48. [Google Scholar]
- Castro-Santos, L.; Martins, E.; Guedes Soares, C. Methodology to calculate the Levelized Cost Of Energy (LCOE) of a floating offshore renewable energy farm. Energies 2016, 9, 324. [Google Scholar] [CrossRef]
- Castro-Santos, L.; Diaz-Casas, V. Sensitivity analysis of floating offshore wind farms. Energy Convers. Manag. 2015, 101, 271–277. [Google Scholar] [CrossRef]
- Sclavounos, P.D.; Lee, S.; DiPietro, J. Floating offshore wind turbines: tension leg platform and taught leg buoy concepts supporting 3–5 mw wind turbines. In Proceedings of the European Wind Energy Conference EWEC 2010, Warsaw, Poland, 20–23 April 2010; pp. 1–7. [Google Scholar]
- Castro-Santos, L.; Garcia, G.P.; Estanqueiro, A.; Justino, P.A.P.S. The Levelized Cost of Energy (LCOE) of wave energy using GIS based analysis: The case study of Portugal. Int. J. Electr. Power Energy Syst. 2015, 65, 21–25. [Google Scholar] [CrossRef] [Green Version]
- Short, W.; Packey, D.; Holt, T. A Manual for the Economic Evaluation of Energy Efficiency and Renewable Energy Technologies; University Press of the Pacific: Honolulu, HI, USA, 1995. [Google Scholar]
- Bulder, B.H.; Van Hees, M.T.; Henderson, A.; Huijsmans, R.H.M.; Pierik, J.T.G.; Snijders, E.J.B.; Wijnants, G.H.; Wolf, M.J. Study to Feasibility of Boundary Conditions for Floating Offshore Wind Turbines; ECN, MARIN, Lagerway the Windmaster, TNO, TUD, Technical Report 2002-CMC; ECN, MARIN, Lagerway the Windmaster: Delft, The Netherlands, 2002. [Google Scholar]
- Castro-Santos, L.; Filgueira-Vizoso, A.; Carral-Couce, L.; Formoso, J.Á.F. Economic feasibility of floating offshore wind farms. Energy 2016, 112, 868–882. [Google Scholar] [CrossRef]
Figure 1.
Influence of the size of the farm in the LCOE (Levelized Cost Of Energy) and costs of a floating offshore farm.
Figure 1.
Influence of the size of the farm in the LCOE (Levelized Cost Of Energy) and costs of a floating offshore farm.

Figure 2.
Alternatives of study.

Figure 3.
Location of the Galician region.

Figure 4.
Cost of manufacturing for the PA and an offshore farm of 100 MW (a) and 600 MW (b).

Figure 5.
Cost of installing for the PA and an offshore farm of 100 MW (a) and 600 MW (b).

Figure 6.
Variation of the cost of manufacturing the farm in M€ regarding several types of floating wind structures and different total power of the farm.
Figure 6.
Variation of the cost of manufacturing the farm in M€ regarding several types of floating wind structures and different total power of the farm.

Figure 7.
Variation of the cost of installing the farm in M€ regarding several types of floating wind structures and different total power of the farm.
Figure 7.
Variation of the cost of installing the farm in M€ regarding several types of floating wind structures and different total power of the farm.

Figure 8.
LCOE for the PA (a), PB (b), and PC (c) platforms and an offshore farm of 100 MW.

Figure 9.
LCOE for the PA (a), PB (b), and PC (c) platforms and an offshore farm of 200 MW.

Figure 10.
LCOE for the PA (a), PB (b), and PC (c) platforms and an offshore farm of 300 MW.

Figure 11.
LCOE for the PA (a), PB (b), and PC (c) platforms and an offshore farm of 400 MW.

Figure 12.
LCOE for the PA (a), PB (b), and PC (c) platforms and an offshore farm of 500 MW.

Figure 13.
LCOE for the PA (a), PB (b), and PC (c) platforms and an offshore farm of 600 MW.

Figure 14.
Evolution of the LCOE in €/MWh regarding several types of floating wind structures and different total power of the farm.
Figure 14.
Evolution of the LCOE in €/MWh regarding several types of floating wind structures and different total power of the farm.


Table 1.
Total power of the farm and total number of wind turbines.
| 100 | 6.00 | 18 | 91.35 |
| 200 | 13.00 | 39 | 197.93 |
| 300 | 19.00 | 57 | 289.28 |
| 400 | 26.00 | 78 | 395.85 |
| 500 | 32.00 | 96 | 487.20 |
| 600 | 39.00 | 117 | 593.78 |
© 2018 by the authors. Licensee MDPI, Basel, Switzerland. This article is an open access article distributed under the terms and conditions of the Creative Commons Attribution (CC BY) license (http://creativecommons.org/licenses/by/4.0/).
Share and Cite
MDPI and ACS Style
Castro-Santos, L.; Filgueira-Vizoso, A.; Álvarez-Feal, C.; Carral, L. Influence of Size on the Economic Feasibility of Floating Offshore Wind Farms. Sustainability 2018, 10, 4484. https://0-doi-org.brum.beds.ac.uk/10.3390/su10124484
AMA Style
Castro-Santos L, Filgueira-Vizoso A, Álvarez-Feal C, Carral L. Influence of Size on the Economic Feasibility of Floating Offshore Wind Farms. Sustainability. 2018; 10(12):4484. https://0-doi-org.brum.beds.ac.uk/10.3390/su10124484
Chicago/Turabian StyleCastro-Santos, Laura, Almudena Filgueira-Vizoso, Carlos Álvarez-Feal, and Luis Carral. 2018. "Influence of Size on the Economic Feasibility of Floating Offshore Wind Farms" Sustainability 10, no. 12: 4484. https://0-doi-org.brum.beds.ac.uk/10.3390/su10124484
Note that from the first issue of 2016, this journal uses article numbers instead of page numbers. See further details here.