Article

Effects of Cropland Conversion and Climate Change on Agrosystem Carbon Balance of China’s Dryland: A Typical Watershed Study

1
Collaborative Innovation Center on Forecast and Evaluation of Meteorological Disaster, School of Geographic Sciences, Nanjing University of Information Science and Technology, Nanjing 210044, China
2
Land Science Research Center, School of Geographic Sciences, Nanjing University of Information Science and Technology, Nanjing 210044, China
3
State Key Laboratory of Soil and Sustainable Agriculture, Institute of Soil Science, Chinese Academy of Sciences, Nanjing 210008, China
4
State Key Laboratory of Desert and Oasis Ecology, Xinjiang Institute of Ecology and Geography, Chinese Academy of Sciences, Urumqi 830011, China
5
Housing Expropriation and Compensation Management Office, Shuimogou District of Urumqi, Urumqi 830017, China
*
Authors to whom correspondence should be addressed.
Sustainability 2018, 10(12), 4508; https://0-doi-org.brum.beds.ac.uk/10.3390/su10124508
Submission received: 20 October 2018 / Revised: 26 November 2018 / Accepted: 28 November 2018 / Published: 29 November 2018
(This article belongs to the Section Sustainable Agriculture)

Abstract

:
Remarkable warm‒wet climate shifts and intensive cropland expansion strongly affected carbon (C) cycle and threaten agricultural sustainability in northwest China. In this study, we integrated a process-based ecosystem model and an empirical C bookkeeping model to investigate the coupled and isolated effects of arable land conversions and climate change (CLM) on regional C balance in a typical watershed of northwest China. Results revealed that the farmland area increased by 3367.31 km2 during 1979–2014. The combined effects of CLM with net cropland expansion enlarged the vegetation C (VEGC) and the soil organic C (SOC) stock by 2.83 and 11.83 Tg, respectively, and were strongest in 2008–2014. The conversions between desert grassland and cropland were the major driving forces for regional C balance. Cropland expansion shared equal effects on VEGC increase with CLM, but its effect on SOC increment was 53 times larger than CLM’s. VEGC was more responsive to CLM, whereas SOC gained more benefits from land management. The C sink from reclamation suffered from high water consumption and is facing great threats due to glaciers and mountain lake shrinking and groundwater overpumping. Water-saving irrigation techniques and environmentally friendly water use strategies are essential for local agricultural sustainability.

Graphical Abstract

1. Introduction

Lying in the northwestern part of the country, the dryland of China (approx. 3.2 million km2) is characterized by fragile ecosystems, remarkable climate change (CLM), and growing human disturbance [1]. In the past few decades, this region has experienced substantial CLMs, such as an above state-average warming rate and high spatiotemporal variation of precipitation [2,3]. Moreover, the cropland of this region has expanded more than four times since the 1950s to support the growing population’s food demands [4]. Arable land conversions including reclamation (Re) and abandonment (Ab) have become the primary land-use and land-cover change (LULCC, only includes Re and Ab in this study) forms in this area [5]. Furthermore, as one of the core region of China’s prosperous “The Belt and Road Initiative,” the environmental sustainability in northwest China is facing growing challenges.
Environmental and anthropogenic disturbances have profoundly regulated the local carbon (C) balance. The warm–wet climate mode shift that started in the mid-1980s significantly stimulated vegetation productivity [6,7,8] and led to a C sink by 2.40–7.37 g C m−2 year−1 [9,10,11]. Meanwhile, arable land Re activities could increase local C sequestration. For example, 51.8 Tg of C was absorbed in 1975–2005 in Xinjiang Province of northwest China [12]. Different from the globally predominated cropland expansion forms (forest or grassland to cropland) [13], the arable lands in arid regions were mostly converted from desert shrub or dry steppe and have C densities that are generally lower than those of agricultural ecosystems [14,15]. Therefore, cropland Re in arid region might lead to C sequestration rather than C emission [13,16]. By considering its vulnerability to environmental changes, researchers should further study the coupled effects of CLM and arable land conversion on the C budget of China’s dryland ecosystems to further maintain local environmental sustainability. However, this region received less attention and is one of the most uncertain areas in terms of regional C assessment [11,17].
Process-based ecosystem models can effectively analyze CLM effects on ecosystem C cycle [18,19]. However, typical dryland ecological characteristics, such as the distinctive root and canopy structure of xeric vegetation and related C-water processes [20,21], are seldom embedded in existing ecological models [17]. Therefore, large uncertainties exist in modeling dryland C cycle under CLM [22]. The C bookkeeping model (Section 2.2.2) is a popular empirical simulator to estimate C dynamics caused by LULCC [13,23]. A bookkeeping model needs land-use change history and C density of related C pools as the input. The model generally assumes that the C density remains unchanged with time and uses temporally fixed inventory data, which might overlook the effects of temporally dynamic factors (e.g., precipitation) on the variation of C density. Therefore, exclusive use of general ecological models or a C bookkeeping model may not be adequate for a deeper understanding of the regional C balance in the context of CLM and land use dynamics.
To narrow this gap, it is promising that coupling an ecological model that presents considerable solid performance in arid ecosystems with a bookkeeping model that employs dynamic C density. In our previous studies [11,17], we developed a processed-based model [Arid Ecosystem Model (AEM)] that specifically studies the interactions between dryland ecosystems and CLM (Section 2.2.1). AEM has improved the accuracy and rationality of arid ecosystem simulation and was successfully applied to address the influences of CLM on the C cycle of dryland ecosystems both in China and Central Asia [11,17,22,24]. In this work, we coupled AEM and C bookkeeping model by providing AEM-simulated temporally dynamic (i.e., under historical climate conditions and ambient atmospheric CO2) C densities for the inputs of C bookkeeping model. Basing on experimental simulations, we analyzed the coupled and isolated effects of CLM and arable land conversions on the regional C balance in a dryland area of China. This approach is an exploratory attempt to take advantage of both process-based models and statistical models in C dynamic study.
This paper could offer a better understanding in the responses of dryland ecosystem’s structure and function to CLM and land use dynamic, and therefore provide reference for conservation and sustainable use of land resources, and environmental protection in underdeveloped arid and semi-arid areas of China. A typical region, the Manas River watershed, which underwent significant CLM and land-use conversions in recent decades, was selected as a case study (Section 2.1).

2. Study Area and Method
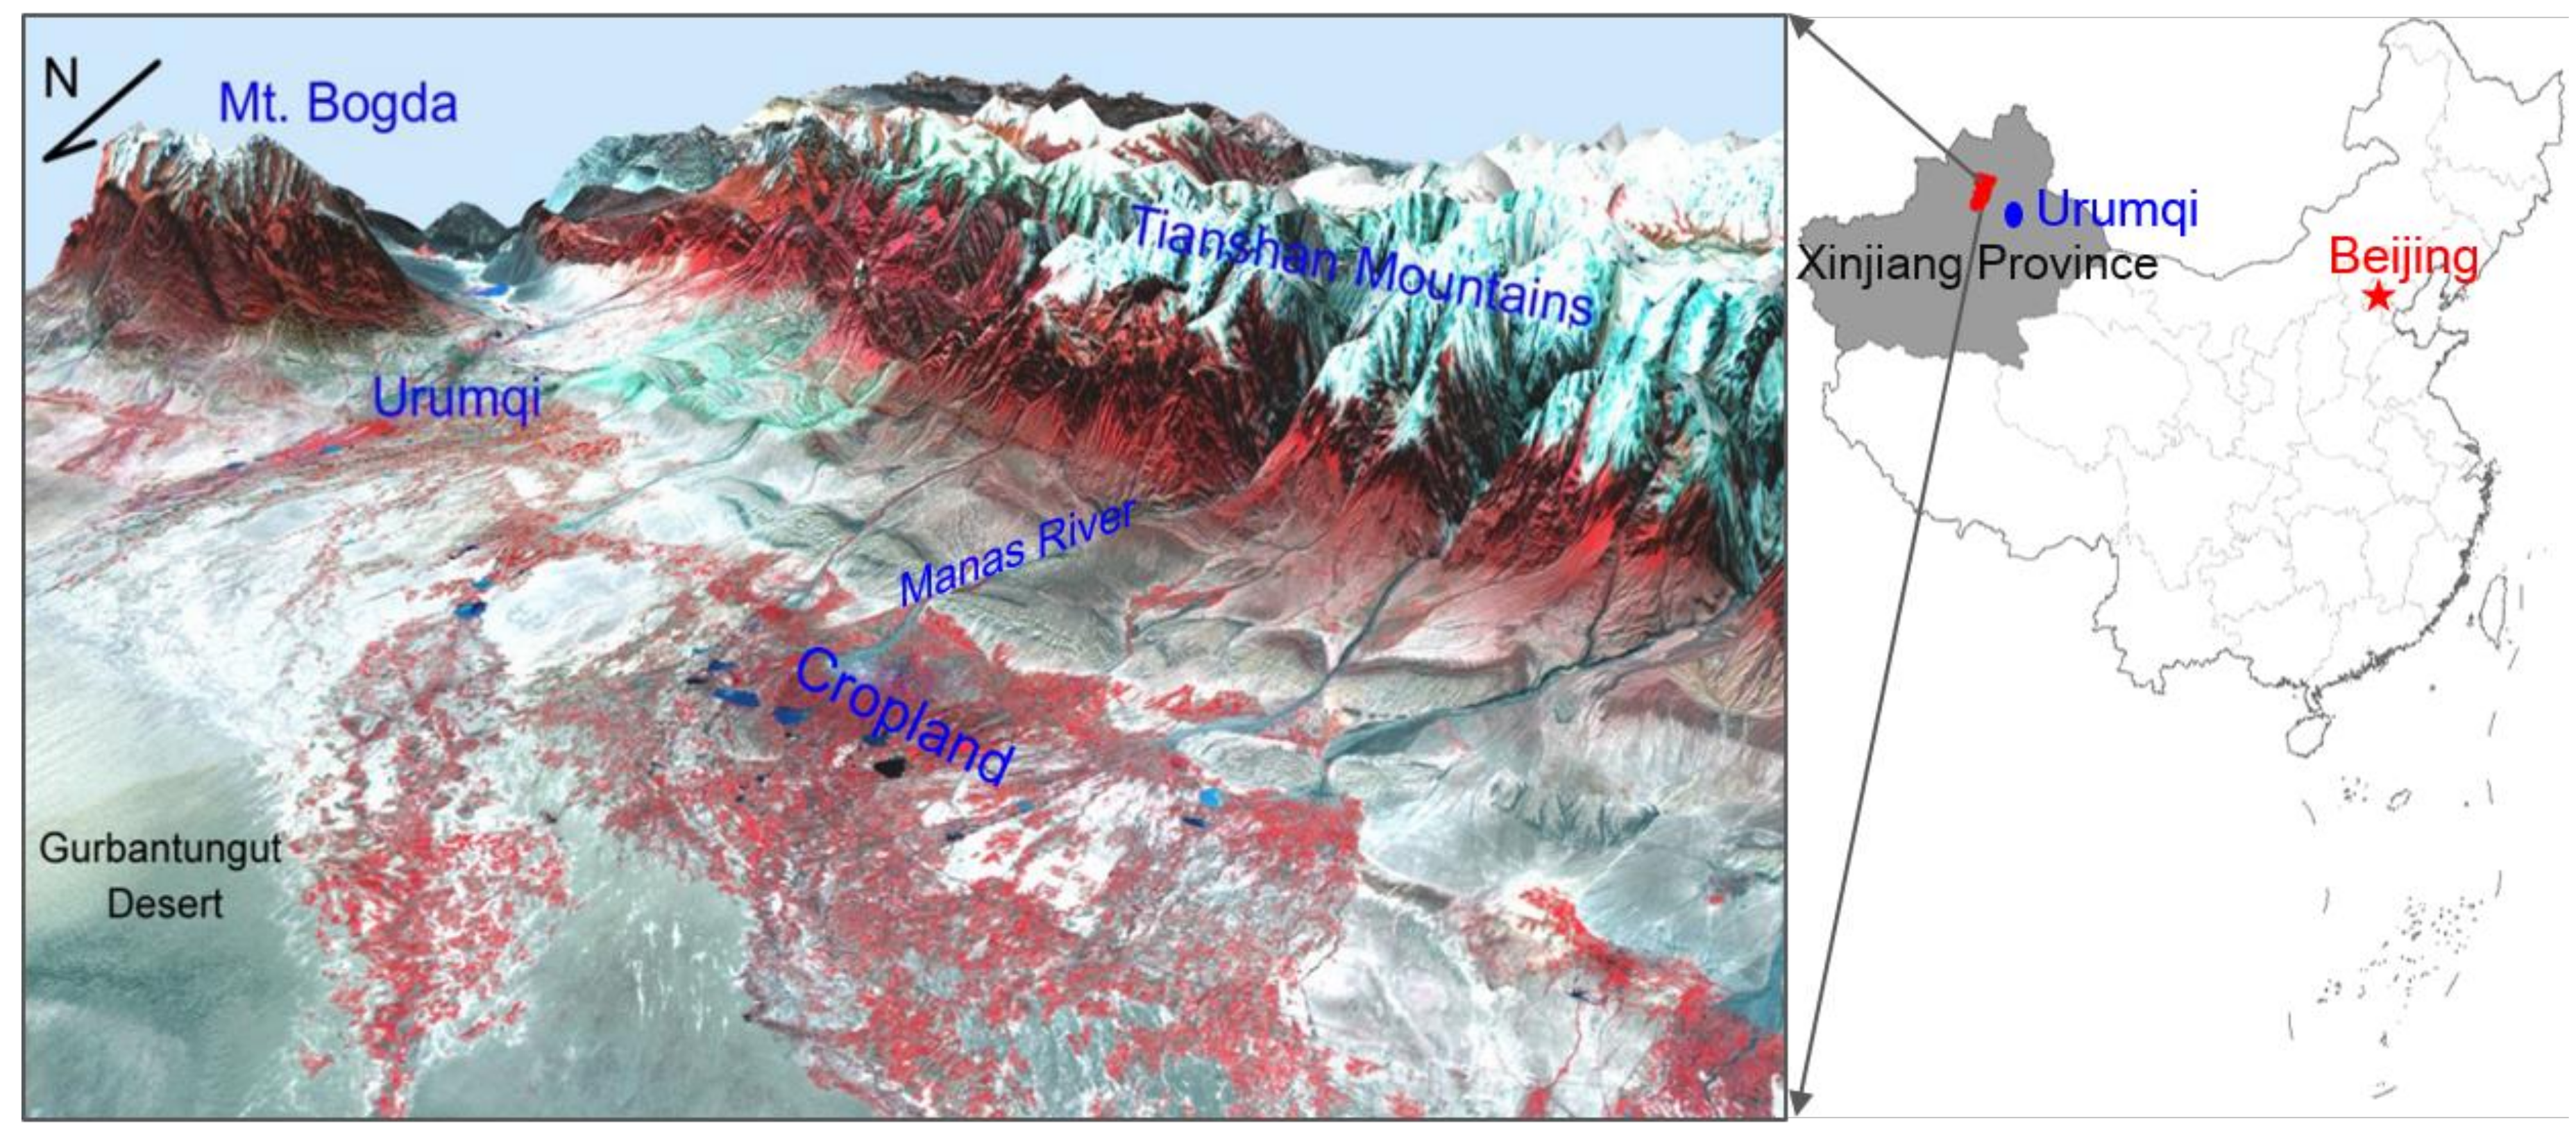
2.1. Study Area

Lying between the northern slope of Tianshan Mountains and the south edge of Gurbantungut Desert, the Manas River watershed covers an area of 3.4 × 10⁴ km2 (Figure 1) and is home to 1.4 million residents [25]. From south to north (Figure 1), glacier (>3900 m a.s.l.), mountain cushion or tundra (3200–3900 m a.s.l.), mountain meadow (2850–3200 m a.s.l.), evergreen needleleaf forest (1650–2850 m a.s.l.), mountain grassland (1100–1650 m a.s.l.), dry grassland (800–1100 m a.s.l.), and oasis and desert shrubland (<800 m a.s.l.) are distributed along the elevation gradient. Loam soils mainly covers alluvial fans; grey desert soil including irrigation grey desert soil (~80%) and salinized grey desert soil occupies agricultural area of alluvial plain; and aeolian soils are mainly found in desert ecosystems. The climate is typically continental arid and is characterized by hot–dry summer and frozen winter [26]. The annual average temperature and total precipitation are approximately 6.8 °C and 110–200 mm, whereas the evaporation capacity is 1500–2100 mm [26,27]. From 1954 to 2007, the watershed was consistently warmer by roughly 0.4 °C decade−1 and had increased precipitation by 0.9 mm per decade−1 [28]. Since the foundation of the People’s Republic of China in 1949, the cropland enlarged by nearly 30 times until the year 2000 [26] and has become the fourth-largest irrigated farmland area in the country [29]. Therefore, the coupled effects of CLM and arable land conversions on the regional C balance of dryland ecosystem in China are an ideal research case.

2.2. Model Description and Datasets

2.2.1. AEM

The AEM model is a process-based terrestrial ecosystem model that was specifically designed to stimulate the impacts of climate and atmospheric changes on the structure and functions of dryland ecosystems over explicit scales [17]. Based on the typical dryland ecological processes, the model especially addresses the structure of desert plants and their related C and water processes mainly by refining the vertical root distribution, mechanistically modelling water movement along the groundwater–soil–root–canopy continuum, dynamically updating a plant’s aboveground structure, and integrating the photodegradation impacts on detritus pools. Forcing by historical climate and atmospheric conditions, the model can estimate the C pools/fluxes and water pools/fluxes both in vegetation and soil on annual or daily basis, according to predefined land cover patterns. Model structure, functions, parameters, and sensitivity analysis can be found in Zhang et al. (2013) [17] and Zhang and Ren (2017) [24]. The model has been parameterized for and validated against six major PFTs (Plant Functional Types) in the dryland ecosystems of China and Central Asia regions: irrigated cropland, grassland, temperate deciduous broadleaf forest, temperate evergreen needleleaf forest, phreatophytic shrub, and non-phreatophytic shrub. Systematic calibration and validation against field observations (including plant structure, ecosystem respiration, daily evapotranspiration, daily and annual productivities, vegetation, and soil C densities) could be found in previous studies [17,22,24,30]. AEM has been successfully used to explore the responses of regional C dynamics to CLMs in the drylands of China [11] and Central Asia [22].
Given that the current vision of AEM did not couple land dynamic processes, we used AEM to analyze the isolated CLM effects (no LULCC involved) on C balance. Meanwhile, simulated vegetation C (VEGC) and soil organic C (SOC) densities were provided as the inputs for C bookkeeping model to study the LULCC impacts.

2.2.2. C Bookkeeping Model

The C bookkeeping model is a widely used empirical approach to track the LULCC-induced C fluxes [16,31,32]. The account process mainly relies on the present response curves of each C pool in a LULCC event that need two types of information: annual LULCC area of each land cover type (i.e., the cropland expansion and contraction in this study, m2 year−1) and C content (g C m−2) in soil, live plant, debris left on the site, and wood products. When LULCC occurs, the C flux is the difference from the C density of vegetation and soil before and after the change. The detailed model description and calculation frame can be found in the reports of Houghton et al., (2003, 2012) [13,16].
The VEGC and SOC density of each land cover type is essential to estimate the C flux caused by LULCC. The original bookkeeping model employed temporally fixed the inventory of VEGC and SOC density, which cannot respond to variations in environmental factors. Consequently, the computed C flux cannot reflect the influences of CLM on VEGC and SOC [23]. In this study, we used historical transient climate data to force the AEM model. Thereafter, the simulated annual VEGC densities, SOC densities, and C accumulation rates of each land type were provided for the bookkeeping model as inputs. Therefore, the final calculated C flux could both reflect the impacts of LULCC and CLMs.
The response curves of different C pools (i.e., living plants, debris left on the site, wood products, and soil) highly depended on the assumptions that were involved in the LULCC processes and the relating parameters. In this study, we set specific adjustments of model assumptions and localized key parameters according to literature and field surveys in the study region (Table 1). (1) After the clear cut of desert shrubland/dry grassland/unutilized land, the plant biomass was allocated into three C pools: the immediate C pool, mainly as firewood, which was released into the atmosphere in one year; the short-lived C pool, mainly as farm implements (for shrubland only), which will be released in 15 years; and the debris C pool, which will gradually decay and be added to the SOC pool (Table 1). (2) After Re, the SOC of former land-use type would increase to the stable SOC level of cropland during a fixed time (Ts in Table 1), and 80% of the increment is set to occur in the fast SOC change period (Tf). (3) In the Ab process, crop biomass was clearly removed from the ecosystem in one year, and new vegetation is going to establish on bare ground. (4) The VEGC and SOC of a new land use after Ab would reach its stable level in fixed years (Trv and Trv).

2.2.3. Model Simulation

AEM model was first run to an equilibrium state to develop the baseline for the C and water pools. Considering the lack of daily meteorological datasets before 1979, the climate mean value of the first decade (i.e., 1979–1988) was used to force the equilibrium simulation. To match the initial climate conditions of the equilibrium state, we used the 1979–1988 detrended climate dataset in the spin-up run. The spin-up was set for 1500 years by running the detrended data 10 times, which could eliminate abnormal fluctuations caused by the sudden mode switch from equilibration to transient. Finally, a transient run was set up using the transient data from 1979 to 2014.
In this study, seven simulation scenarios were designed to analyze the effects of combined climate and cropland area change (SOverall), Re alone (SRe_only), Ab alone (SAb_only), CLM-coupled Re (SCLM_Re) and Ab (SCLM_Ab), CLM alone over Re (SCLM_only_Re) and Ab (SCLM_only_Ab) areas on the VEGC and SOC dynamics of the Manas River watershed (Table 2). SOverall was forced by the historical CLM, Re, and Ab processes; SRe_only was only driven by Re events, while excluding Ab and keeping climate data unchanged. The same protocol was applied in SAb_only. SCLM_Re and SCLM_Ab were simulated only without the Ab and Re events, while keeping other drivers as “real”, and SCLM_only_Re/SCLM_only_Ab considered the historical CLM within the Re/Ab area.

2.2.4. Data Source

A set of time series of land-use data was derived from Landsat Multispectral Scanner (1979), Landsat Thematic Mapper (1989), and Landsat Enhanced Thematic Mapper (1999, 2008, and 2014), which were provided by the Xinjiang and Central Asia scientific data sharing platform [38]. The land-use types were classified into desert shrubland, desert grassland, cropland, forest, unutilized land, settlement, and water body. The Kappa coefficients of remote-sensing image interpretation for 1979, 1989, 1999, 2008, and 2014 were 71.88%, 81.88%, 85.45%, 87.56%, and 86.63%, respectively. The land-use datasets were aggregated into 500 m2 spatial resolution and then served as the plant functional type map for AEM model.
The AEM model forcing data sets included (1) the slope, aspect, and elevation maps derived from the 30 m spatial resolution Advanced Spaceborne Thermal Emission and Reflection Radiometer (ASTER) Global Digital Elevation Model Version 2 dataset [39]; (2) the soil maps (pH, soil texture, and bulk density) extracted from the 1:1 million soil map based on the second national soil survey of China [40]; (3) management factors (e.g., fertilization and harvest) following the local farming practice; (4) the atmospheric CO2 concentrations from 1979 to 2014, according to the Mauna Loa observations [41]; (5) daily climate data (precipitation, solar radiation, vapor pressure deficit, mean, maximum, and minimum air temperatures) derived from the Reanalysis China Meteorological Forcing Dataset (RCMFD) with a spatial resolution of 10 km2 [42,43]. The RCMFD predicted daily temperatures based on a refined temperature-modeling algorithm for arid dryland region [43], and it has been effectively used in CLM studies [44].

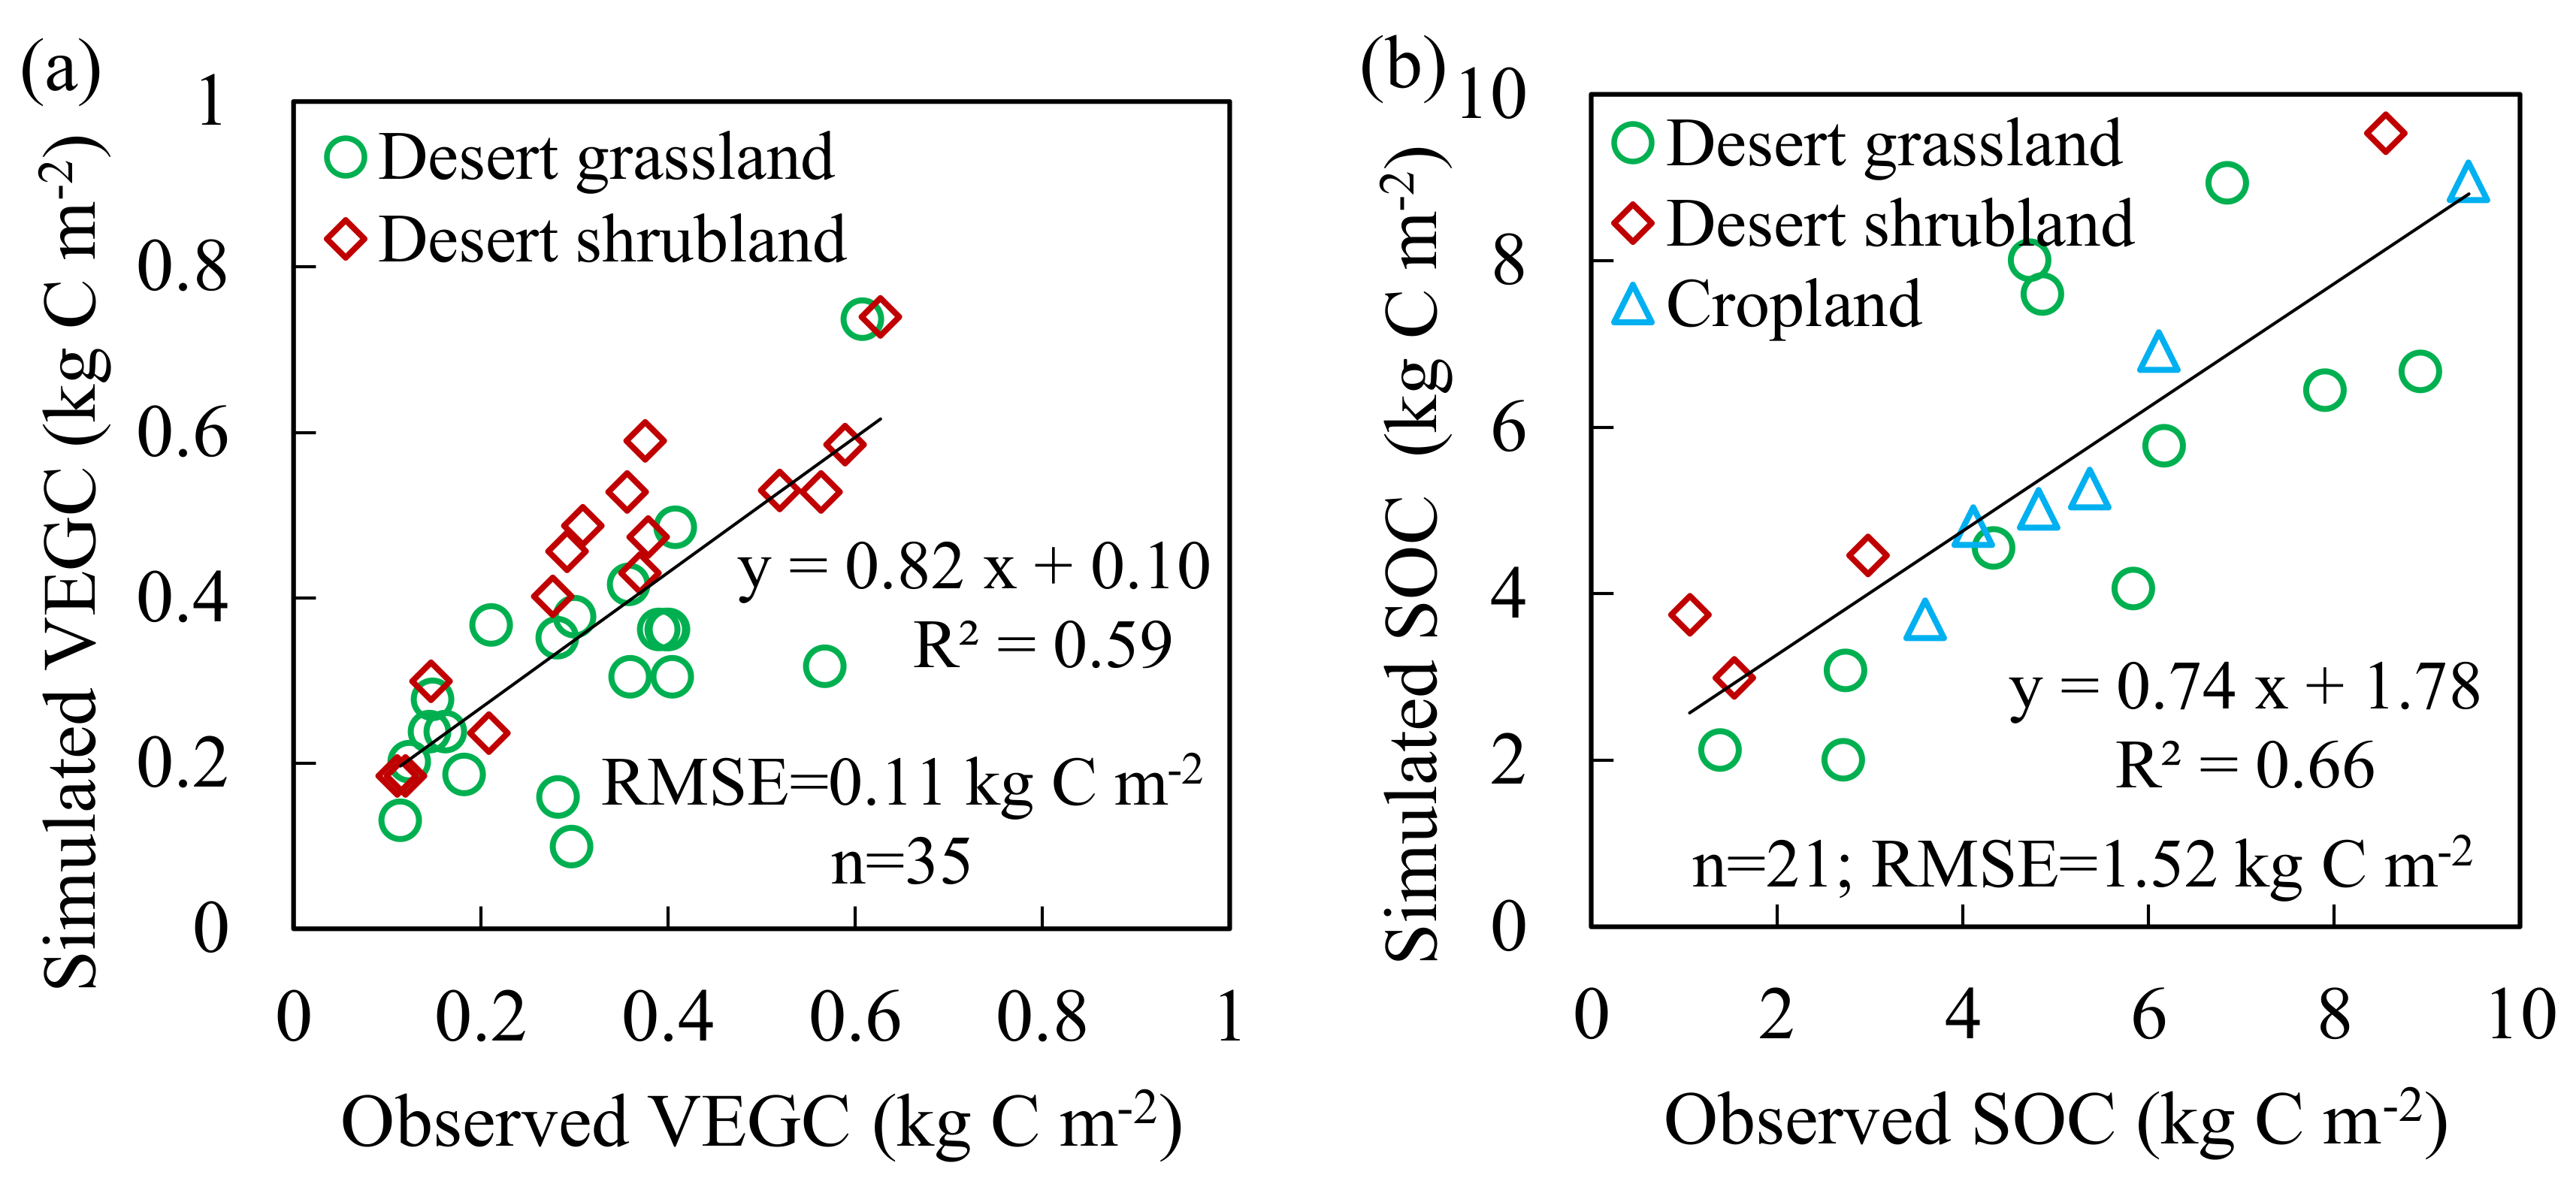
2.2.5. Additional Validation

AEM’s performance on modeling VEGC and SOC has been extensively evaluated against field observational data in Central Asia and China [17,22]. In this study, we further evaluated AEM’s simulation on VEGC and SOC in the Manas River watershed. The model outputs matched well with the field inventory data for both VEGC (Figure 2a; R2 = 0.59, P < 0.05) and SOC (Figure 2b; R2 = 0.66, P < 0.05).

3. Results

3.1. LULCC and CLM

During the whole study period, approximately 4445.61 km2 new cropland area in the Manas River watershed was created by Re activities, and 1078.30 km2 cropland was lost due to Ab, leading to 3367.31 km2 net area expansion (Table 3). The net cropland area first decreased during 1979–1998, then showed a steady increase till 2014. The Re intensity presented a continuous growing increase in 1979–2014, and more than half of the total Re area was established in 2008–2014 (Figure 3a). The lowest Re intensity (244.71 km2) was found in 1979–1988. Desert grassland and unutilized land were the top two sources of new cropland, accounting for 56% and 32% of the reclaimed area, respectively. Over the whole study period, cropland was mainly converted into desert grassland (520.35 km2) and built-up land (285.28 km2) (Figure 3a). The former mainly occurred in 1989–1998, and the latter mostly prevailed in 2008–2014. Notably, approximately half of the Ab-induced cropland loss was found between 1989 and 1998, surpassing the newly created cropland area in the same period, caused a net cropland area decrease by 79.28 km2. Ab was negligible at the first decade of the study period.
From 1979 to 2014, this region witnessed a significant warm‒wet climate shift with a warming trend of 0.3 °C decade−1 (R2 = 0.19, P < 0.01) and an insignificant annual total precipitation increase by 15.6 mm decade−1 (R2 = 0.10, P > 0.05) (Figure 3b). A lasting drought was observed in 1989–1997 when the annual total precipitation was 13% lower than the long-term average of 1979–2014.

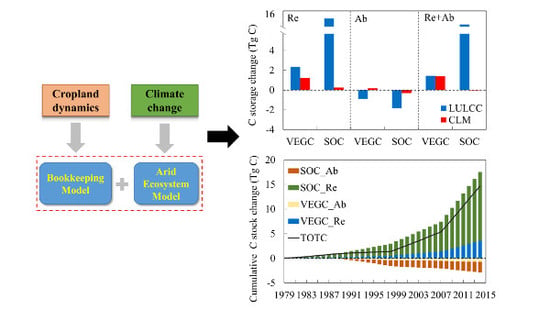
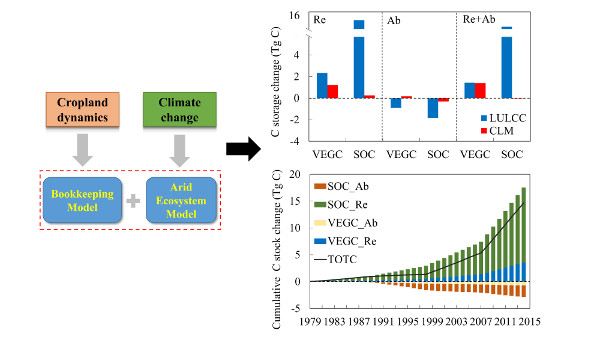
3.2. Combined Effects of LULCC and CLM on C Dynamics

In the context of CLM in 1979–2014, TOTC (TOTC = VEGC + SOC) relatively slowly increased in the first two decades of the study period, then remarkably accumulated afterward (Figure 4). The weighted average TOTC change during the whole study period was 345.81 g C m−2 yr−1. The largest increment speed of 1.17 Tg year−1 (458.69 g C m−2 yr−1) was in 2008–2014, when croplands had the highest establishment rate (Figure 3a). The lowest TOTC density increase rate of 48.00 g C m−2 year−1 was found in 1989–1998 (Table 3), when Ab area surpassed Re area (Table 2). The variation of SOC stock size was responsible for the 79% and 57% cumulative TOTC accumulation or reduction over 1979–2014 under Re (SCLM_Re) and Ab (SCLM_Ab) circumstances, respectively (Figure 4).
During the study period, the overall effect of CLM and LULCC (LULCC = SCLM_Re + SCLM_Ab) stimulated C sink both in VEGC and SOC, and SOC was more responsive than VEGC (Figure 5). The coupled influences of CLM and Re (SCLM_Re) activities on VEGC shows a growing increase trend, which led to C sequestration by 3.56 Tg (103.08 g C m−2 year−1). Meanwhile, a four time stronger C absorption in SOC (13.97 Tg, which is equal to 400.08 g C m−2 year−1) was achieved in 1979–2014 (Figure 4 and Table 3). The highest VEGC and SOC accumulation rates were both in 2008–2014 at 119.16 and 441.86 g C m−2 year−1, respectively (Table 3). Among all the Re pathways, the conversion from desert grassland was the largest contributor to the cumulative increase of both VEGC stock (56%) and SOC stock (87%) (Figure 5), then followed by the conversion of unutilized land.
The combined effects of CLM and Ab processes (SCLM_Ab) caused C emission throughout the whole study period, resulting in the shrinkage of VEGC stock and SOC stock by 0.73 Tg (76.91 g C m−2 year−1) and 2.14 Tg (225.99 g C m−2 year−1), respectively. The greatest decrease in VEGC (−82.66 g C m−2 year−1) and SOC (−264.98 g C m−2 year−1) both occurred in 2008–2014. The loss of cropland to desert grassland was the major attribution to regional cumulative C emission, accounting for approximately 52% and 93% of VEGC and SOC reduction, respectively (Figure 5). Transferring cropland to built-up land was the only Ab form that increased SOC (0.35 Tg in 1979–2014). In total, the net cropland expansion in the context of CLM in the Manas River watershed led to VEGC and SOC accumulation by 2.83 and 11.83 Tg, respectively.

3.3. Relative Effects of LULCC and CLM

Scenario modeling shows that over Re activities area (Figure 6, Re), CLM (SCLM_only_Re) induced a C sink in VEGC by 1.22 Tg, which was nearly five times larger than its effects on SOC increase (0.26 Tg), while Re (SRe_only) led to a SOC increase by 13.72 Tg that was about six times larger than the C increase in VEGC (2.34 Tg). Re’s effect was approximately twice that of CLMs on VEGC growth and 53 times stronger than CLM on the SOC enlargement. In areas where Ab occurred (Figure 6, Ab), CLM (SCLM_only_Ab) increased VEGC by 0.17 Tg and decreased SOC by 0.31 Tg. Ab (SAb_only) generally caused C release both in VEGC (0.91 Tg) and twice more in SOC (1.83 Tg), which showed opposite trend comparing to that in Re scenario (SRe_only). Ab’s effects on SOC reduce was about six times stronger than CLM’s.
Figure 6 (Re + Ab) shows that the combined CLM (SCLM_only_Re + SCLM_only_Ab) increased VEGC by 1.40 Tg, while had negligible influence on SOC (−0.05 Tg). LULCC activities (combination of Re and Ab, SRe_only + SAb_only) enlarged both VEGC (1.43 Tg) and SOC (11.89 Tg). LULCC and CLM shared comparable positive effect on VEGC, but the former’s effect on SOC sequestration was more significant than the latter’s. Overall, LULCC and CLM increased the TOTC (TOTC = VEGC + SOC) by 13.32 and 1.35 Tg, respectively.

4. Discussion

4.1. C Dynamics Affected by LULCC and CLM

As reported by many studies, the dryland in northwest China experienced a remarkable warm‒wet climate shift in the past decades [2,3]. During the study period, the warming trend (0.3 °C decade−1) and the precipitation increase (15.6 mm decade−1) in the Manas River watershed were approximately equal to the regional level of northwest China [11,45]. According to our analysis, the isolated CLM effects (SCLM_only_Re + SCLM_only_Ab) on the regional TOTC increased at 6.79 g C m−2 year−1, which was more than twice higher than that in northern Xinjiang (3.03 g C m−2 year−1) and Central Asia (2.45 g C m−2 year−1) [22], but slightly lower than in northwest China (7.37 C m−2 year−1) [10]. Notably, excluding the LULCC impacts, the climate-induced total C accumulation was mainly from VEGC pool (Figure 6) because the warm‒wet climate shift, as well as the increasing CO2 concentration, was favorable for crop growing [24], supporting that vegetation activities were more responsive to climatic change than soil C cycle in arid and semi-arid regions [46,47]. Furthermore, the CLM over our study area reduced SOC in cropland (Figure 6, Ab). Under arid conditions, the temperature and soil moisture increase can dramatically stimulate soil heterotrophic respiration [48,49]. Meanwhile, the harvest of crops would leave limited C behind, which can be placed back into soil and cause the shrinkage of SOC stock.
LULCC have significant impacts on ecosystem C storage and balance [13]. In arid and semi-arid regions, cropland conversions were the major pathway of LULCC [50,51], and the new cultivated areas were mainly transformed from biomes, whose C contents were considerably lower than those in cropland ecosystems such as desert grassland and unutilized land, as shown in this study and others [52,53,54]. Therefore, cropland expansion in arid areas generally led to ecosystem C accumulation. For example, 14.66 Tg of C was sequestrated in the Manas River watershed in 1979–2014. In contrast, Re at the global scale was mainly resulted from the removal of C-rich ecosystems, such as forest clearings in Amazon [55,56], Africa [57,58], and tropical Asia [59]. Consequently, the overall global cropland expansion generated C sources. For example, approximately 84 Tg of C was released into the atmosphere over the industrial period [60]. Our study also showed that LULCC led in regulating local C dynamics through affecting the stock size of SOC (Figure 6). SOC storage accounts for more than 90% of the total ecosystem C stock in arid China [61]. Therefore, the change in SOC stock inevitably dominated the TOTC dynamics. After converting from water-stressed C-poor ecosystems to managed agrosystem, the former xeric soil benefited from sufficient irrigation, fertilization, residue inputs, and other management practices, enabling the soil sequestrating C at a tremendous speed (Table 3) until a new equilibrium state is reached [48,62].

4.2. Implications of Cropland Expansion

New cropland establishments have been and will be a major LULCC activity in the dryland of China to satisfy the growing food demands for the population increase [63,64]. The cropland area in the Manas River watershed has expanded by 29 times since the 1950s [65], and by 168% in 1979–2014, according to our analysis (Figure 3a). Cropland expansion in arid China led to a set of positive environmental effects, such as the increase of local precipitation due to the growing irrigation that stimulated evapotranspiration and water cycle [66], the enhancement of crop productivity [67,68], the decline of desertification [8], and the C sequestration in VEGC and SOC, as shown in our analysis (Figure 4 and Figure 5).
Considering the insufficient precipitation and high evapotranspiration under arid climate conditions [69], the abovementioned positive effects suffered high water consumption [68]. For example, irrigation accounted for 91% of the total water utilization in Xinjiang province in 2010 [70]. In the last few decades, the rise in precipitation and warm-induced glacier melting was responsible for the runoff increase in this area [3], relieving local water shortages and supporting the growing irrigation demand [71]. However, given continuous warming but varied precipitation in the future [72], the glaciers, as well as the mountain lakes in the Tianshan Mountains (the water tower of Xinjiang province), would keep shrinking, which might cause a runoff decrease in the coming years [73,74]. In addition, the depth of groundwater (Gd), another main irrigation source, was falling because of extensive pumping for agricultural use. For example, the average Gd dropped from −3.3 m to −4.3 m in 2006–2012, according to the seven observation wells in the Manas River watershed (data provided by Xinjiang Institute of Ecology and Geography, Chinese Academy of Sciences, unpublished). Moreover, overdraining of groundwater has caused degradation of natural vegetation in the desert‒oasis ecotone [26]. Consequently, the agriculture and desert ecosystem will face great challenges in the coming years because of the possible limitation of water sources. Policy makers must pay more attention to the application of high-efficiency, water-saving irrigation techniques (e.g., dripping systems) [75] and design a sustainable water use budget for agricultural, industrial, and residential uses, especially in the context of rapid CLM in this area.

4.3. Uncertainties

The C flux from LULCC is the most uncertain component in C cycle research [76]. In this study, the main uncertainty might be derived from the simplification of some LULCC processes in the bookkeeping model. For example, the time to reach a new ecosystem equilibrium after Re and Ab depended on biome types, climate conditions, and soil C and nitrogen contents. However, we maintained the relating parameters constant because the process was difficult to quantify, and studies that could provide supporting information to our study are limited. In addition, the ratio of plant biomass allocating into different C pools during Re is difficult to obtain, especially for long-term studies in underdeveloped regions. Therefore, the allocating parameters present uncertainties that transferred from data sources and data assembling methodologies. Moreover, 13% and 60% of the total biomass were allocated to an immediate and short-lived C pool when desert shrubland was reclaimed in Xinjiang Province [12]; meanwhile, the fractions were 0.27 and 0.40 in the Manas River watershed, respectively, according to our data sources. Moreover, overlooking some land management practices by AEM would also introduce a set of uncertainties into our results. In northwest China, deep tillage with straw returning would stimulate cropland SOC accumulation by 16% [62], and plastic film mulching and drip irrigation could increase crop production by 8–31% [77,78]. With a lack of mathematically expressed supporting information on these processes, the current version of AEM cannot embed these cultivation practices. Hence, our results may underestimate the C sequestration capability of oasis cropland. To better understand the effects of LULCC and CLM on regional C cycle in dryland areas, we should refine the parameterization of LULCC processes, improve the accuracy of C density modeling and land cover data interpretation, as well as optimize the AEM structure by incorporating more agricultural management practices.

5. Conclusions

Long-term CLM and human activities tremendously regulated the regional C cycle and agricultural sustainability in arid northwest China. This study investigated the coupled and isolated effects of LULCC and CLM in a typical agricultural watershed of northwest China. The farmland area in the Manas River watershed increased by 3367.31 km2 from 1979 to 2014. The major land conversion types were desert grassland to crop and unutilized land to crop, accounting for 56% and 32% of cropland expansion, respectively. The study area experienced remarkable warm‒wet climate shift, which is favorable for vegetation development and SOC accumulation both in natural and agricultural ecosystems.
From 1979 to 2014, the net cropland expansion in the Manas River watershed led to a C sink both in VEGC and SOC pools. Re activities played a positive role in C sequestration, whereas Ab processes played a negative role. Desert grassland to cropland contributed most to the cumulative increase of VEGC stock (56%) and SOC stock (87%), whereas the inverse process was the major attribution to cumulative C emission. Regional C dynamics was highly correlated to LULCC rates. LULCC and CLM had approximately equal effects on VEGC increase, but the former’s impact on SOC increment was approximately 53 times larger than that of the latter. VEGC were more responsive to CLMs, and SOC gained more benefits from irrigation, fertilization, and residual input when natural arid ecosystems were transferred into cropland.
The increased C sink due to new cropland establishments was at the expense of high water consumption, which may not be sustainable in the long run. Ongoing shrinkage of glaciers and mountainous lakes and groundwater overpumping are the major threats to local agricultural sustainability, as well as to natural xeric ecosystems. More effort should be dedicated to further improving water-saving irrigation techniques and designing environmentally friendly water-use strategies for long-term sustainable development in dryland areas of China. The approach of coupling an ecological model and statistical C bookkeeping model in this study could also be effective choice for studying the land dynamic’s influences over global arid and semi-arid regions, such as afforestation/deforestation in Central Asia.

Author Contributions

Conceptualization, G.L. and C.L.; Methodology, C.L.; Software, Q.H.; Validation, Y.W. and C.L.; Formal Analysis, C.L.; Investigation, C.L.; Resources, Y.W. D.Y. and G.L.; Data Curation, Y.W.; Writing—Original Draft Preparation, C.L.; Writing—Review & Editing, C.L.; Visualization, C.L. and Q.H.; Supervision, G.L. & C.Z.; Project Administration, C.Z.; Funding Acquisition, S.L. & C.L.

Funding

This research was funded by National Key Research and Development Program of China grant number 2017YFC0504301; National Natural Science Foundation of China grant numbers 41671108, 41501098; the Knowledge Innovation Program of Institute of Soil Science, Chinese Academy of Sciences grant number ISSASIP1630; and the Startup Foundation for Introducing Talent of NUIST grant number 2017r036 to Chaofan Li.

Acknowledgments

We want to thank the editor and anonymous reviewers for their valuable comments and suggestions to this paper.

Conflicts of Interest

The authors declare no conflict of interest.

References

  1. Luo, G.P.; Zhou, C.H.; Chen, X.; Li, Y. A methodology of characterizing status and trend of land changes in oases: A case study of Sangong River watershed, Xinjiang, China. J. Environ. Manag. 2008, 88, 775–783. [Google Scholar] [CrossRef] [PubMed]
  2. Song, S.; Li, L.; Chen, X.; Bai, J. The dominant role of heavy precipitation in precipitation change despite opposite trends in west and east of northern China. Int. J. Climatol. 2015, 35, 4329–4336. [Google Scholar] [CrossRef]
  3. Shi, Y.; Shen, Y.; Kang, E.; Li, D.; Ding, Y.; Zhang, G.; Hu, R. Recent and future climate change in northwest china. Clim. Chang. 2007, 80, 379–393. [Google Scholar] [CrossRef]
  4. Chen, X. Land Use/Cover Change in Arid Areas in China; Science Press: Beijing, China, 2008. (In Chinese) [Google Scholar]
  5. Dang, Y.; Ren, W.; Tao, B.; Chen, G.; Lu, C.; Yang, J.; Pan, S.; Wang, G.; Li, S.; Tian, H. Climate and Land Use Controls on Soil Organic Carbon in the Loess Plateau Region of China. PLoS ONE 2014, 9, e95548. [Google Scholar] [CrossRef] [PubMed]
  6. Fang, J.; Piao, S.; He, J.; Ma, W. Increasing terrestrial vegetation activity in China, 1982–1999. Sci. China Ser. C 2004, 47, 229–240. [Google Scholar]
  7. Piao, S.; Ciais, P.; Lomas, M.; Beer, C.; Liu, H.; Fang, J.; Friedlingstein, P.; Huang, Y.; Muraoka, H.; Son, Y.; et al. Contribution of climate change and rising CO2 to terrestrial carbon balance in East Asia: A multi-model analysis. Glob. Planet. Chang. 2011, 75, 133–142. [Google Scholar] [CrossRef]
  8. Piao, S.; Fang, J.; Liu, H.; Zhu, B. NDVI-indicated decline in desertification in China in the past two decades. Geophys. Res. Lett. 2005, 32, L06402. [Google Scholar] [CrossRef]
  9. Piao, S.; Fang, J.; Ciais, P.; Peylin, P.; Huang, Y.; Sitch, S.; Wang, T. The carbon balance of terrestrial ecosystems in China. Nature 2009, 458, 1009–1013. [Google Scholar] [CrossRef] [PubMed]
  10. Tian, H.; Melillo, J.; Lu, C.; Kicklighter, D.; Liu, M.; Ren, W.; Xu, X.; Chen, G.; Zhang, C.; Pan, S.; et al. China’s terrestrial carbon balance: Contributions from multiple global change factors. Glob. Biogeochem. Cycles 2011, 25, GB1007. [Google Scholar] [CrossRef]
  11. Li, C.; Zhang, C.; Luo, G.; Chen, X. Modeling the carbon dynamics of the dryland ecosystems in Xinjiang, China from 1981 to 2007—The spatiotemporal patterns and climate controls. Ecol. Model. 2013, 267, 148–157. [Google Scholar] [CrossRef]
  12. Wang, Y.; Luo, G.; Zhao, S.; Han, Q.; Li, C.; Fan, B.; Chen, Y. Effects of arable land change on regional carbon balance in Xinjiang. Acta Geogr. Sin. 2014, 69, 110–120. [Google Scholar] [CrossRef]
  13. Houghton, R.A.; House, J.I.; Pongratz, J.; van der Werf, G.R.; DeFries, R.S.; Hansen, M.C.; Le Quéré, C.; Ramankutty, N. Carbon emissions from land use and land-cover change. Biogeosciences 2012, 9, 5125–5142. [Google Scholar] [CrossRef] [Green Version]
  14. Lal, R. Sequestering carbon in soils of arid ecosystems. Land Degrad. Dev. 2009, 20, 441–454. [Google Scholar] [CrossRef]
  15. Reynolds, J.F.; Smith, D.M.S.; Lambin, E.F.; Turner, B.L.; Mortimore, M.; Batterbury, S.P.J.; Downing, T.E.; Dowlatabadi, H.; Fernández, R.J.; Herrick, J.E.; et al. Global desertification: Building a science for dryland development. Science 2007, 316, 847–851. [Google Scholar] [CrossRef] [PubMed]
  16. Houghton, R.A.; Hackler, J.L. Sources and sinks of carbon from land-use change in China. Glob. Biogeochem. Cycles 2003, 17. [Google Scholar] [CrossRef] [Green Version]
  17. Zhang, C.; Li, C.; Luo, G.; Chen, X. Modeling plant structure and its impacts on carbon and water cycles of the Central Asian arid ecosystem in the context of climate change. Ecol. Model. 2013, 267, 158–179. [Google Scholar] [CrossRef]
  18. Sitch, S.; Friedlingstein, P.; Gruber, N.; Jones, S.D.; Murray-Tortarolo, G.; Ahlström, A.; Doney, S.C.; Graven, H.; Heinze, C.; Huntingford, C.; et al. Recent trends and drivers of regional sources and sinks of carbon dioxide. Biogeosciences 2015, 12, 653–679. [Google Scholar] [CrossRef] [Green Version]
  19. Canadell, J.G.; Schulze, E.D. Global potential of biospheric carbon management for climate mitigation. Nat. Commun. 2014, 5. [Google Scholar] [CrossRef] [PubMed]
  20. Reynolds, J.F.; Kemp, P.R.; Ogle, K.; Fernández, R.J. Modifying the ‘pulse–reserve’ paradigm for deserts of North America: Precipitation pulses, soil water, and plant responses. Oecologia 2004, 141, 194–210. [Google Scholar] [CrossRef] [PubMed]
  21. Xu, H.; Li, Y.; Xu, G.; Zou, T. Ecophysiological response and morphological adjustment of two Central Asian desert shrubs towards variation in summer precipitation. Plant Cell Environ. 2007, 30, 399–409. [Google Scholar] [CrossRef] [PubMed] [Green Version]
  22. Li, C.; Zhang, C.; Luo, G.; Chen, X.; Maisupova, B.; Madaminov, A.A.; Han, Q.; Djenbaev, B.M. Carbon stock and its responses to climate change in Central Asia. Glob. Chang. Biol. 2015, 21, 1951–1967. [Google Scholar] [CrossRef] [PubMed]
  23. Houghton, R.A.; Hackler, J.L.; Lawrence, K.T. The U.S. Carbon Budget: Contributions from Land-Use Change. Science 1999, 285, 574. [Google Scholar] [CrossRef] [PubMed]
  24. Zhang, C.; Ren, W. Complex climatic and CO2 controls on net primary productivity of temperate dryland ecosystems over central Asia during 1980–2014. J. Geophys. Res. Biogeosci. 2017, 122, 2356–2374. [Google Scholar] [CrossRef]
  25. Ling, H.; Xu, H.; Fu, J.; Fan, Z.; Xu, X. Suitable oasis scale in a typical continental river basin in an arid region of China: A case study of the Manas River Basin. Quat. Int. 2013, 286, 116–125. [Google Scholar] [CrossRef]
  26. Cheng, W.; Zhou, C.; Liu, H.; Zhang, Y.; Jiang, Y.; Zhang, Y.; Yao, Y. The oasis expansion and eco-environment change over the last 50 years in Manas River Valley, Xinjiang. Sci. China Earth Sci. 2006, 49, 163–175. [Google Scholar] [CrossRef]
  27. Zhang, Q.; Xu, H.; Li, Y.; Fan, Z.; Zhang, P.; Yu, P.; Ling, H. Oasis evolution and water resource utilization of a typical area in the inland river basin of an arid area: A case study of the Manas River valley. Environ. Earth Sci. 2012, 66, 683–692. [Google Scholar] [CrossRef]
  28. Ling, H.; Xu, H.; Fu, J.; Liu, X. Surface runoff processes and sustainable utilization of water resources in Manas River Basin, Xinjiang, China. J. Arid Land 2012, 4, 271–280. [Google Scholar] [CrossRef]
  29. Feng, Y.; Luo, G.; Lu, L.; Zhou, D.; Han, Q.; Xu, W.; Yin, C.; Zhu, L.; Dai, L.; Li, Y.; et al. Effects of land use change on landscape pattern of the Manas River watershed in Xinjiang, China. Environ. Earth Sci. 2011, 64, 2067–2077. [Google Scholar] [CrossRef]
  30. Fang, X.; Zhang, C.; Wang, Q.; Chen, X.; Ding, J.; Karamage, F. Isolating and Quantifying the Effects of Climate and CO2 Changes (1980–2014) on the Net Primary Productivity in Arid and Semiarid China. Forests 2017, 8, 60. [Google Scholar] [CrossRef]
  31. Carlson, K.M.; Curran, L.M.; Asner, G.P.; Pittman, A.M.; Trigg, S.N.; Marion Adeney, J. Carbon emissions from forest conversion by Kalimantan oil palm plantations. Nat. Clim. Chang. 2012, 3, 283. [Google Scholar] [CrossRef]
  32. Schulp, C.J.E.; Nabuurs, G.-J.; Verburg, P.H. Future carbon sequestration in Europe—Effects of land use change. Agric. Ecosyst. Environ. 2008, 127, 251–264. [Google Scholar] [CrossRef]
  33. Mohammat, A.; Wang, X.; Xu, X.; Peng, L.; Yang, Y.; Zhang, X.; Myneni, R.B.; Piao, S. Drought and spring cooling induced recent decrease in vegetation growth in Inner Asia. Agric. For. Meteorol. 2013, 178–179, 21–30. [Google Scholar] [CrossRef]
  34. Xu, W.; Tang, G.; Sheng, J.; Liang, Z.; Zhou, B.; Zhu, M. Effects of cultivation on organic carbon fractionation and aggregate stability in Xinjiang oasis soils. Acta Ecol. Sin. 2010, 30, 1773–1779. [Google Scholar]
  35. Lei, C.; Tian, C. Contents of soil organic carbon in newly reclaimed field in arid desert zone. J. Arid Land Resour. Environ. 2008, 22, 105–110. [Google Scholar]
  36. Feng, H. A Study on Growth Characteristic and Biomass of Poplar Plantation. Chinese Academy of Forestry: Beijing, Chin, 2007. [Google Scholar]
  37. An, H.; Yang, X.; Liu, B.; Li, X.; He, X.; Song, N. Changes of plant community biomass and soil nutrients during the vegetation succession on abandoned cultivated land in desert steppe region. Chin. J. Appl. Ecol. 2011, 22, 3145–3149. [Google Scholar]
  38. Xinjiang and Central Asia Data Center. Available online: http://midasia.geodata.cn/Portal/index.jsp (accessed on 27 May 2015).
  39. ASTER GDEM v.2. Available online: http: //gdem.ersdac.jspacesystems.or.jp/ (accessed on 21 March 2014).
  40. Nachtergaele, F.; Velthuizen, H.v.; Verelst, L. Harmonized World Soil Database; Food and Agriculture Organization of the United Nations: Roma, Italy, 2008. [Google Scholar]
  41. CDIAC. Available online: http://cdiac.esd.ornl.gov/ftp/trends/co2/maunaloa.co2 (accessed on 4 April 2015).
  42. Yang, K.; He, J.; Tang, W.; Qin, J.; Cheng, C.C.K. On downward shortwave and longwave radiations over high altitude regions: Observation and modeling in the Tibetan Plateau. Agric. For. Meteorol. 2010, 150, 38–46. [Google Scholar] [CrossRef]
  43. Chen, Y.; Yang, K.; He, J.; Qin, J.; Shi, J.; Du, J.; He, Q. Improving land surface temperature modeling for dry land of China. J. Geophys. Res. 2011, 116, D20104. [Google Scholar] [CrossRef]
  44. Han, Q.; Luo, G.; Li, C.; Xu, W. Modeling the grazing effect on dry grassland carbon cycling with Biome-BGC model. Ecol. Complex. 2014, 17, 149–157. [Google Scholar] [CrossRef]
  45. Piao, S.; Ciais, P.; Huang, Y.; Shen, Z.; Peng, S.; Li, J.; Zhou, L.; Liu, H.; Ma, Y.; Ding, Y.; et al. The impacts of climate change on water resources and agriculture in China. Nature 2010, 467, 43–51. [Google Scholar] [CrossRef] [PubMed]
  46. Shen, W.; Reynolds, J.F.; Hui, D. Responses of dryland soil respiration and soil carbon pool size to abrupt vs. gradual and individual vs. combined changes in soil temperature, precipitation, and atmospheric [CO2]: A simulation analysis. Glob. Chang. Biol. 2009, 15, 2274–2294. [Google Scholar] [CrossRef]
  47. Benjamin, P.; David, F.; Philippe, C.; Ranga, B.M.; Niels, A.; Jian, B.; Gregoire, B.; Josep, G.C.; Frederic, C.; Yi, Y.L.; et al. Contribution of semi-arid ecosystems to interannual variability of the global carbon cycle. Nature 2014, 509, 600–603. [Google Scholar]
  48. Ren, W.; Tian, H.; Tao, B.; Huang, Y.; Pan, S. China’s crop productivity and soil carbon storage as influenced by multifactor global change. Glob. Chang. Biol. 2012, 18, 2945–2957. [Google Scholar] [CrossRef] [PubMed]
  49. St Clair, S.B.; Lynch, J.P. The opening of Pandora’s Box: Climate change impacts on soil fertility and crop nutrition in developing countries. Plant Soil 2010, 335, 101–115. [Google Scholar] [CrossRef]
  50. Houghton, R.A.; Goodale, C.L. Effects of Land-Use Change on the Carbon Balance of Terrestrial Ecosystems. In Ecosystems and Land Use Change; American Geophysical Union: Washington, DC, USA, 2013; pp. 85–98. [Google Scholar]
  51. Nutini, F.; Boschetti, M.; Brivio, P.A.; Bocchi, S.; Antoninetti, M. Land-use and land-cover change detection in a semi-arid area of Niger using multi-temporal analysis of Landsat images. Int. J. Remote Sens. 2013, 34, 4769–4790. [Google Scholar] [CrossRef]
  52. Amuti, T.; Luo, G. Analysis of land cover change and its driving forces in a desert oasis landscape of Xinjiang, northwest China. Solid Earth 2014, 5, 1071–1085. [Google Scholar] [CrossRef] [Green Version]
  53. Roland, K.; Alexander, V.P.; Daniel, M.; Tobias, K.; Volker, C.R.; Andrey, D.; Alexey, T.; Manfred, F. Long-term agricultural land-cover change and potential for cropland expansion in the former Virgin Lands area of Kazakhstan. Environ. Res. Lett. 2015, 10, 054012. [Google Scholar] [Green Version]
  54. Ranjeet, J.; Jiquan, C.; Nan, L.; Burkhard, W. Land cover/land use change in semi-arid Inner Mongolia: 1992–2004. Environ. Res. Lett. 2009, 4, 045010. [Google Scholar] [Green Version]
  55. Praveen, N.; Morton, C.D.; Macedo, N.M.; Victoria, C.D.; Chengquan, H.; Gibbs, K.H.; Bolfe, L.E. Forest carbon emissions from cropland expansion in the Brazilian Cerrado biome. Environ. Res. Lett. 2017, 12, 025004. [Google Scholar] [Green Version]
  56. Galford, G.L.; Melillo, J.M.; Kicklighter, D.W.; Mustard, J.F.; Cronin, T.W.; Cerri, C.E.P.; Cerri, C.C. Historical carbon emissions and uptake from the agricultural frontier of the Brazilian Amazon. Ecol. Appl. 2011, 21, 750–763. [Google Scholar] [CrossRef] [PubMed] [Green Version]
  57. Ciais, P.; Bombelli, A.; Williams, M.; Piao, S.L.; Chave, J.; Ryan, C.M.; Henry, M.; Brender, P.; Valentini, R. The carbon balance of Africa: Synthesis of recent research studies. Phil. Trans. R. Soc. A Math. Phys. Eng. Sci. 2011, 369, 2038–2057. [Google Scholar] [CrossRef] [PubMed]
  58. Houghton, R.A.; Hackler, J.L. Emissions of carbon from land use change in sub-Saharan Africa. J. Geophys. Res. Biogeosci. 2006, 111. [Google Scholar] [CrossRef] [Green Version]
  59. Tao, B.; Tian, H.; Chen, G.; Ren, W.; Lu, C.; Alley, K.D.; Xu, X.; Liu, M.; Pan, S.; Virji, H. Terrestrial carbon balance in tropical Asia: Contribution from cropland expansion and land management. Glob. Planet. Chang. 2013, 100, 85–98. [Google Scholar] [CrossRef]
  60. Strassmann, K.M.; Joos, F.; Fischer, G. Simulating effects of land use changes on carbon fluxes: Past contributions to atmospheric CO2 increases and future commitments due to losses of terrestrial sink capacity. Tellus B 2008, 60, 583–603. [Google Scholar] [CrossRef] [Green Version]
  61. Tang, X.; Zhao, X.; Bai, Y.; Tang, Z.; Wang, W.; Zhao, Y.; Wan, H.; Xie, Z.; Shi, X.; Wu, B.; et al. Carbon pools in China’s terrestrial ecosystems: New estimates based on an intensive field survey. Proc. Natl. Acad. Sci. USA 2018, 115, 4021–4026. [Google Scholar] [CrossRef] [PubMed] [Green Version]
  62. Zhao, Y.; Wang, M.; Hu, S.; Zhang, X.; Ouyang, Z.; Zhang, G.; Huang, B.; Zhao, S.; Wu, J.; Xie, D.; et al. Economics- and policy-driven organic carbon input enhancement dominates soil organic carbon accumulation in Chinese croplands. Proc. Natl. Acad. Sci. USA 2018, 115, 4045–4050. [Google Scholar] [CrossRef] [PubMed] [Green Version]
  63. Li, X.; Wang, Y.; Liu, L.; Luo, G.; Li, Y.; Chen, X. Effect of Land Use History and Pattern on Soil Carbon Storage in Arid Region of Central Asia. PLoS ONE 2013, 8, e68372. [Google Scholar] [CrossRef] [PubMed]
  64. Wu, Z.; Zhang, H.; Krause, C.; Cobb, N. Climate change and human activities: A case study in Xinjiang, China. Clim. Chang. 2010, 99, 457–472. [Google Scholar] [CrossRef]
  65. Zhang, F.; Hanjra, M.A.; Hua, F.; Shu, Y.; Li, Y. Analysis of climate variability in the Manas River Valley, North-Western China (1956–2006). Mitig. Adapt. Strateg. Glob. Chang. 2013, 19. [Google Scholar] [CrossRef]
  66. Ma, Q.; Wang, J.; Li, X.; Zhu, S.; Liu, H.; Zhan, K. Long-term changes of Tamarix-vegetation in the oasis-desert ecotone and its driving factors: Implication for dryland management. Environ. Earth Sci. 2009, 59, 765–774. [Google Scholar] [CrossRef]
  67. Chen, X.; Luo, G. Carbon Cycle in Dryland Ecosystems of Central Asia, 1st ed.; China Environmental Press: Beijing, China, 2013. [Google Scholar]
  68. Shen, Y.; Li, S.; Chen, Y.; Qi, Y.; Zhang, S. Estimation of regional irrigation water requirement and water supply risk in the arid region of Northwestern China 1989–2010. Agric. Water Manag. 2013, 128, 55–64. [Google Scholar] [CrossRef]
  69. Li, L.; Luo, G.; Chen, X.; Li, Y.; Xu, G.; Xu, H.; Bai, J. Modelling evapotranspiration in a Central Asian desert ecosystem. Ecol. Model. 2011, 222, 3680–3691. [Google Scholar] [CrossRef]
  70. Bureau of Xinjiang Water Resources. Xinjiang Water Resources Bulletin 2010; Bureau of Xinjiang Water Resources: Xinjiang, China, 2011. [Google Scholar]
  71. Chen, X.; Luo, G.; Xia, J.; Zhou, K.; Lou, S.; Ye, M. Ecological response to the climate change on the northern slope of the Tianshan Mountains in Xinjiang. Sci. China Ser. D Earth Sci. 2005, 48, 765–777. [Google Scholar] [CrossRef]
  72. Siegfried, T.; Bernauer, T.; Guiennet, R.; Sellars, S.; Robertson, A.; Mankin, J.; Bauer-Gottwein, P.; Yakovlev, A. Will climate change exacerbate water stress in Central Asia? Clim. Chang. 2012, 112, 881–899. [Google Scholar] [CrossRef]
  73. Sorg, A.; Bolch, T.; Stoffel, M.; Solomina, O.; Beniston, M. Climate change impacts on glaciers and runoff in Tien Shan (Central Asia). Nat. Clim. Chang. 2012, 2, 725–731. [Google Scholar] [CrossRef]
  74. Xin, W.; Yongjian, D.; Shiyin, L.; Lianghong, J.; Kunpeng, W.; Zongli, J.; Wanqin, G. Changes of glacial lakes and implications in Tian Shan, central Asia, based on remote sensing data from 1990 to 2010. Environ. Res. Lett. 2013, 8, 044052. [Google Scholar] [Green Version]
  75. Wang, J.; Gao, Y.; Wang, S. Land Use/Cover Change impacts on water table change over 25 years in a desert-oasis transition zone of the Heihe River Basin, China. Water 2016, 8, 11. [Google Scholar] [CrossRef]
  76. Arneth, A.; Sitch, S.; Pongratz, J.; Stocker, B.D.; Ciais, P.; Poulter, B.; Bayer, A.D.; Bondeau, A.; Calle, L.; Chini, L.P.; et al. Historical carbon dioxide emissions caused by land-use changes are possibly larger than assumed. Nat. Geosci. 2017, 10, 79–84. [Google Scholar] [CrossRef] [Green Version]
  77. Li, X.; Liu, L.; Yang, H.; Li, Y. Relationships between carbon fluxes and environmental factors in a drip-irrigated, film-mulched cotton field in arid region. PLoS ONE 2018, 13, e0192467. [Google Scholar] [CrossRef] [PubMed]
  78. Li, Z.; Zhang, R.; Wang, X.; Wang, J.; Zhang, C.; Tian, C. Carbon Dioxide Fluxes and Concentrations in a Cotton Field in Northwestern China: Effects of Plastic Mulching and Drip Irrigation. Pedosphere 2011, 21, 178–185. [Google Scholar] [CrossRef]
Figure 1. 3D view of Manas River watershed.
Sustainability 10 04508 g001
Figure 2. Comparing simulated vegetation carbon (VEGC) (a) and soil organic carbon (SOC) (b) against field observations.
Sustainability 10 04508 g002
Figure 3. Changes in cropland area (a), climate conditions (b) and land use maps in 1979 and 2014 (c). B→C: built-up land to cropland; U→C: unutilized land to cropland; G→C: desert grassland to cropland; S→C: desert shrubland to cropland; C→B: cropland to built-up land; C→U: cropland to unutilized land; C→G: cropland to desert grassland; and C→S: cropland to desert shrubland.
Sustainability 10 04508 g003
Figure 4. Combined effects of abandonment (Ab)/reclamation (Re) and climate change (CLM) on the dynamics of vegetation carbon (VEGC) stock, soil organic carbon (SOC) stock, and total carbon (TOTC) stock (TOTC = VEGC + SOC) in 1979–2014. SOC_Ab/SOC_Re denotes the combined effects of CLM and Ab/Re on SOC dynamics, respectively; VEGC_Ab/VEGC_Re represents the combined impacts of CLM and Ab/Re on VEGC changes, respectively. A positive value indicates C sequestration by the regarding C pool, whereas a negative value indicates C emission to the atmosphere.
Sustainability 10 04508 g004
Figure 5. Combined effects of CLM and different LULCC forms on the dynamics of vegetation carbon (VEGC) pool (a) and soil organic carbon (SOC) pool (b). C→B: cropland to built-up land; C→U: cropland to unutilized land; C→G: cropland to desert grassland; C→S: cropland to desert shrubland; B→C: built-up land to cropland; U→C: unutilized land to cropland; G→C: desert grassland to cropland; and S→C: desert shrubland to cropland.
Sustainability 10 04508 g005
Figure 6. Relative effects of CLM and LULCC on the change of vegetation carbon (VEGC) pool and soil organic carbon (SOC) pool in 1979–2014. In the left (Re) and middle (Ab) panels, LULCC only includes Re (SRe_only) and Ab (SAb_only), and CLM indicates SCLM_only_Re and SCLM_only_Ab respectively. In the right panel (Re + Ab), LULCC = SRe_only + SAb_only, and CLM = Soverall − LULCC.
Sustainability 10 04508 g006
Table 1. Parameters of the bookkeeping model in this study.
DescriptionDesert
Shrubland
Desert
Grassland
Unutilized LandBuilt-Up
Land
Reference
The allocation ratio of plant biomass into different C pools when reclaiming
1-year immediate C pool0.270.500.50 This study
15-year short-lived C pool0.40 This study
Debris C pool0.330.500.50 [33]
The stable SOC density in cropland (g C m−2)6507852936099940[33]
The time to reach a new equilibrium SOC level after Re (Ts) (year)10201020[12,34]
The fast SOC change time after Re (Tf) (year)5555[34,35]
The time to reach the equilibrium VEGC level after arable land Ab (Trv) (year)10201020[34,36,37]
The time to reach the new equilibrium SOC level after arable land Ab (Trs) (year)10201020[12,34]
Table 2. Scenario simulation design.
ScenarioReAbClimateRegionDescription
SOverall1979–20141979–20141979–2014Re and Ab areasCombined effects of climate and cropland area change
SCLM_Re1979–2014NA1979–2014Re areaCoupled effects of climate and Re
SRe_only1979–2014NA1979Re areaIsolated effects of Re
SCLM_only_ReNANA1979–2014Re areaClimate effects over Re area
SCLM_AbNA1979–20141979–2014Ab areaCoupled effects of climate and Ab
SAb_onlyNA1979–20141979Ab areaIsolated effects of Ab
SCLM_only_AbNANA1979–2014Ab areaClimate effects over Ab area
Table 3. Annual average vegetation carbon (VEGC), soil organic carbon (SOC) and total carbon (TOTC = VEGC + SOC) flux density (g C m−2 yr−1) that caused by the coupled effects of climate change and reclamation (Re) or abandonment (Ab). A positive value indicates the enlargement of the regarding carbon pool, whereas a negative value indicates reduction.
Area
(km2)Re/Ab
ReAbTOTC Change
VEGCSOCVEGCSOC
1979–1988244.71/13.2871.58287.20−71.23−2.10336.54
1989–1998455.66/534.9474.78379.41−72.69−225.2948.00
1999–20071169.32/203.1885.27339.74−79.16−179.74323.77
2008–20142575.93/326.90119.16441.86−82.66−264.98458.69
Total area and
Weighted average
4445.61/1078.30103.08400.08−76.91−225.99345.81

