Life Cycle Assessment of Commercial Delivery Trucks: Diesel, Plug-In Electric, and Battery-Swap Electric


School of Economics and Commerce, South China University of Technology, Guangzhou 510006, China
*
Author to whom correspondence should be addressed.
Sustainability 2018, 10(12), 4547; https://0-doi-org.brum.beds.ac.uk/10.3390/su10124547
Submission received: 22 October 2018
/
Revised: 29 November 2018
/
Accepted: 29 November 2018
/
Published: 2 December 2018
Abstract
:The development of electric delivery trucks has attracted much attention in recent years. The purpose of this study is to assess the greenhouse gas (GHG) emissions and the total cost of ownership (TCO) of light-duty and medium-duty diesel trucks (DTs), plug-in electric trucks (ETs), and battery-swap ETs. A simplified life cycle assessment (LCA) method and a TCO assessment method are used. Numerical results show that the average GHG emission of light-duty ETs is 69% lower than that of light-duty DTs, while that of medium-duty ETs is 9.8% higher than that of medium-duty DTs. As regards TCO, those of plug-in ETs and battery-swap ETs are 37.8% lower and 21% higher than that of light-duty DTs, while for medium-duty trucks, the TCO of plug-in and battery-swap ETs are 6.7% lower and 18.9% higher than that of medium-duty DTs. The main conclusion of this paper is that light-duty plug-in ETs exhibit the best performance in terms of cost saving and GHG emission reduction. Moreover, ETs show more advantages than DTs when the frequency of use is higher or when the driving environment is more congested.
1. Introduction
Globally, more than 90% of the transport sector is powered by fuel derived from oil. However, the consumption of oil is deemed problematic owing to the cost and the generated greenhouse gas (GHG) or air pollutants emissions [1]. GHG emissions from road transport exceed 70% of total emissions in the transport sector [2], among which delivery trucks are responsible for about a quarter of CO2 emissions, one third of NOX emissions, and half of the particulate matters in cities. With the number of cars in the world projected to increase more than fourfold by 2050 to three billion [3,4], fuel consumption and GHG emissions may become more serious problems than they are today. Therefore, many countries are committed to developing low-carbon economies [5,6]. To reduce dependence on oil and ease environmental pollution problems, electric vehicles are considered a viable alternative and have been advocated for decades [7,8]. Since 2015, the State Council of China has insisted on the development of new energy vehicles, specifically electric vehicles, and prioritized the construction of charging infrastructure [9].
Many environmental organizations, groups, and related scholars are interested in the application of electric delivery trucks in the “last-mile” urban distribution process, because they believe that urban areas are suitable for the early application of electric trucks (ETs) [10]. With the increasing of urban population and logistics demand, the number of delivery trucks in cities has increased rapidly as well. Increasingly serious congestion in cities causes vehicles to travel for a long time in low-speed conditions, resulting in lower fuel economy and more serious negative effects, such as congestion, GHG emissions, and noise. However, owing to higher fuel efficiency in the same condition, electric delivery trucks seem to be an effective way to alleviate these problems in “last-mile” urban distribution [11].
According to China’s new national standard (GB9417-89), delivery trucks can be divided based on gross vehicle weight (GVW) into four types: mini trucks (GVW ≤ 1800 kg), light trucks (1800 kg < GVW ≤ 6000 kg), medium trucks (6000 kg < GVW ≤ 14,000 kg), and heavy-duty trucks (GVW > 14,000 kg). As most cities in China have restrictions on heavy-duty trucks, the main types of delivery trucks operating in city areas are light and medium-duty trucks [12]. A study focusing on heavy ETs analyzed the electrification potential of the entire Swiss heavy-duty fleet and found that, currently, heavy-duty ETs were unable to replace the diesel trucks (DTs) [13]. In relation to this, light and medium-duty trucks are the research objects of the present study.
Currently, the most widely used commercial electric vehicle in China is the electric taxi. In 2017, the Chinese government issued a policy that all the new taxis in Beijing should be replaced by electric vehicles. Other cities also actively promoted taxis being replaced by electric vehicles [14]. As more and more ETs enter the market, there is an increasing demand for charging. Currently, charging piles and charging stations are widely used. However, when in a charging station, a truck needs to wait from four up to 8 hours to be fully charged. Hence, the charging mode may not be able to meet the needs of vehicles in time, especially for vehicles which require more daily mileage and higher punctuality, such as taxis, buses, and delivery trucks [15]. One major solution being considered is to use the battery-swap mode, in which a user only needs to buy a truck with no battery, and then battery rental companies shall be responsible for battery charging, replacement, maintenance, and other related works [16]. When the electricity is exhausted, the battery can be replaced in three to eight minutes. Then it can be charged in a centralized way, which is safer and more reliable than the distributed charge mode and can effectively prolong the battery’s life [17]. Although the battery-swap mode also has some problems, such as non-uniform battery standards and high infrastructure cost, these problems are easier to be solved for vehicles like taxis and delivery trucks. Since these vehicles are used in large scale and high frequency, and typically operate on almost the same route every day, systematic central battery swapping and charging is more feasible for them. In literature related to the battery-swap mode, Zhou et al. [18] indicated that battery-swap mode might be the most widely used method of power supplement in the future, while charging mode will be used as an auxiliary mode. Therefore, both plug-in ETs and battery-swap ETs are considered in this paper.
Compared with a traditional internal combustion engine vehicle, the biggest difference of an electric vehicle is that the electric motor replaces the internal combustion engine; hence, electric vehicles typically have higher tank-to-wheel efficiency and produce no tailpipe emissions [19]. Many people, including the manufacturers of electric vehicles, highlight the advantages of zero emission of electric vehicles. Yet they ignore the fact that energy production is also accompanied by GHG emissions, which means that there are indirect GHG emissions from the use of ETs [20]. To assess the environmental performance of electric vehicles, some studies have been conducted thus far. However, there are still some controversies over the issue of whether electric vehicles can reduce GHG emissions. On the one hand, some studies compared electric vehicles with traditional internal combustion engine vehicles and vehicles using other alternative energy (e.g., biodiesel, natural gas and so on), and found that electric vehicles outperformed all other types of trucks overall despite their electricity generation-related emissions [1,21,22,23,24]. On the other hand, Zhao et al. [25] proposed the opposite view regarding the performance of electric vehicles in terms of GHG emission reduction. Their research analyzed the energy consumption and GHG emissions of various transport trucks, including ETs, DTs, diesel electric hybrid trucks and compressed natural gas trucks, and then pointed out that although the direct emission of ETs was zero, their average energy consumption and indirect GHG emissions were slightly higher than those of other trucks. Moreover, surveys conducted by Doucette and McCulloch [26] and Huang et al. [27] confirmed that the proportion of clean energy in power generation structure played an important role in electric vehicles’ life cycle GHG emissions. Hence, for countries with high GHG emissions during their power generation, such as China and India, electric vehicles might be unable to effectively reduce GHG emissions or even cause increased emissions.
Other studies focused on the cost of electric vehicles, because cost is the main factor that should be considered when comparing ETs with DTs [28,29]. The total cost of ETs includes purchase cost, electricity cost, infrastructure cost, maintenance cost, and recovery costs during their lifetime. Introducing a large number of ETs therefore introduces new challenges, like building infrastructure for charging or battery swapping. As a result, although the energy cost of ETs is lower, the costs of battery and infrastructure may be higher than those of DTs. Other costs such as insurance, government subsidies, tax credits, or penalties, may also exist. However, to compare the competitiveness of ETs and DTs without subsidy or regulation, the influence of these factors could be excluded [30]. From an economic and technical perspective, some research analyzed the factors affecting competitiveness in the total cost of electric commercial vehicles, such as purchase cost, charging strategies, charging infrastructure, and policies [31,32,33]. Furthermore, the comprehensive study by Feng et al. [34] reported that electric commercial vehicles are more competitive in cost when use frequency is high.
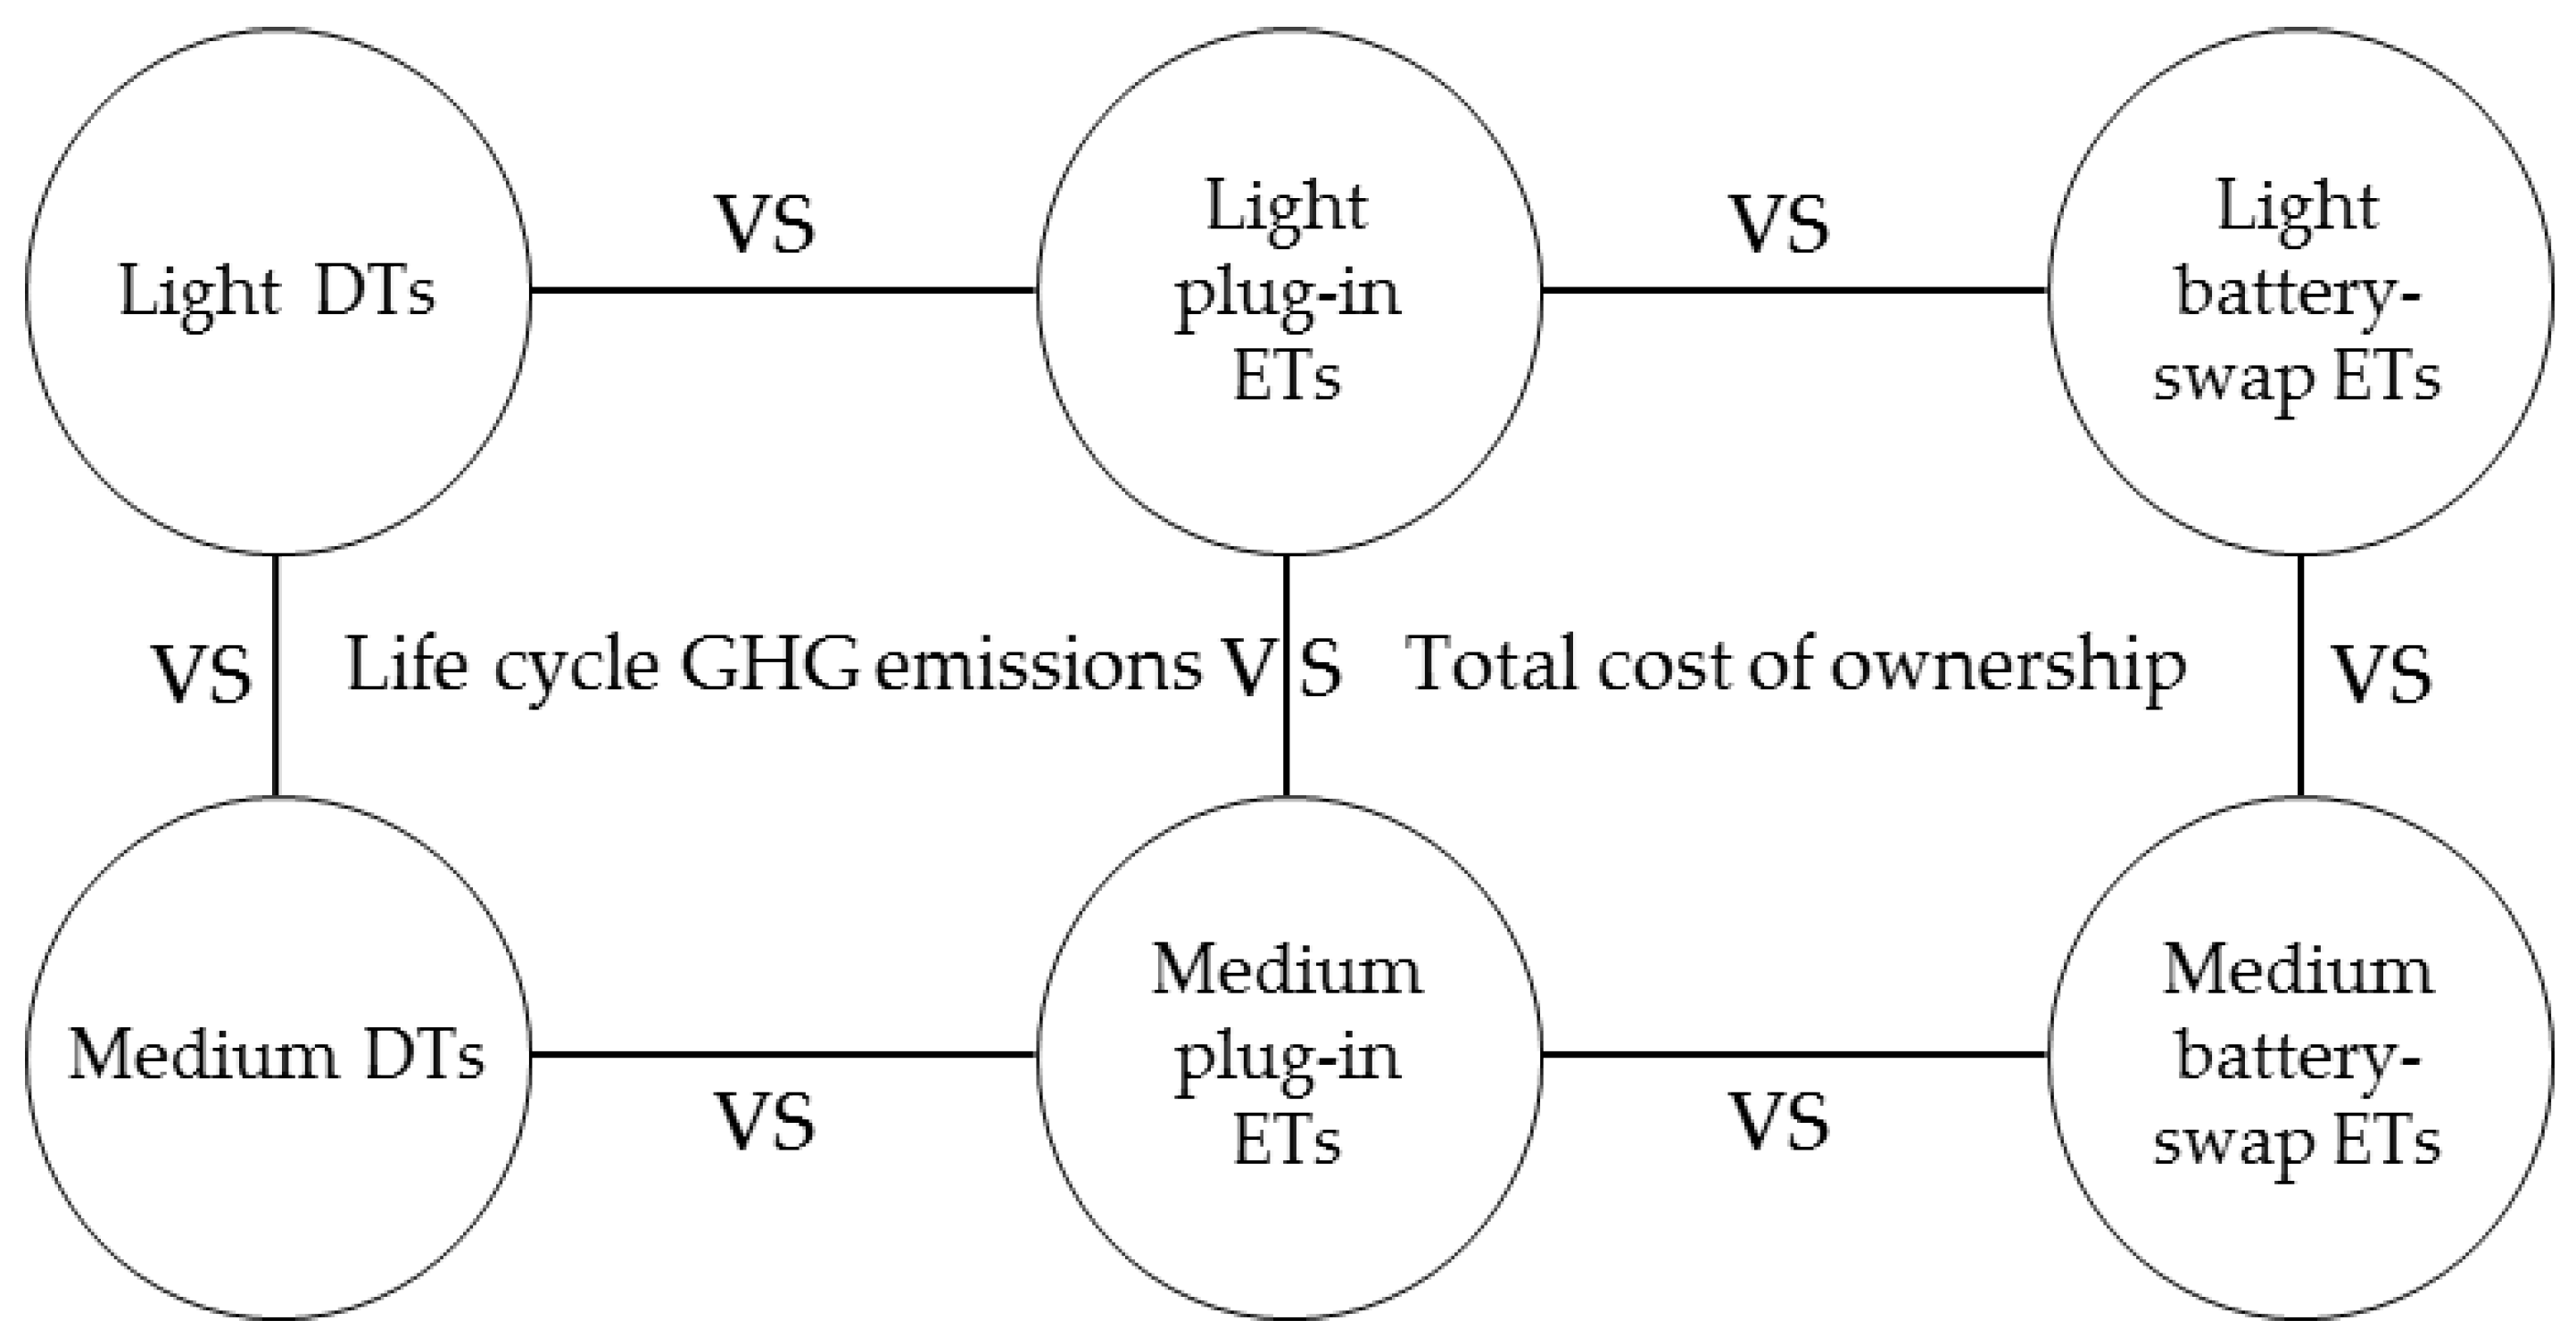
The existing literature compared the competitiveness of DTs and plug-in ETs in terms of the GHG emissions or the total cost of ownership (TCO). However, few studies compared them from both economic and environmental perspectives. For ETs, different types of trucks, such as plug-in and battery-swap ETs, might have different costs. Specifically, battery-swap ETs have lower purchase cost, because there is no need to buy batteries. However, they may have higher charging cost than plug-in ETs. In addition, for trucks of different classes, the conclusions may be different. Few studies considered the differences among trucks of different classes. In relation to such gaps in the literature, the main objectives of this paper are to compare the GHG emissions and the TCO of light and medium-duty DTs, plug-in ETs, and battery-swap ETs comprehensively, to assess the possible association of changes in some influence factors with changes in GHG emissions and TCO, and then to identify the most significant drivers of GHG emissions and TCO changes. The main content of this study is evaluating and comparing advantages and disadvantages of light and medium-duty DTs, plug-in ETs, and battery-swap ETs from perspectives of environmental protection and economy. Trucks of the same classes but of different types and trucks of the same types but of different classes are compared (see Figure 1).
2. Methods
This study assesses the GHG emissions and the TCO of DTs and ETs. A simplified life cycle assessment (LCA) method is used to estimate GHG emissions. LCA is a well-established tool (International Standards Organization, 2006) to analyze direct and indirect environmental, social, and economic impacts of processes and products. “Life cycle” refers to the whole process of a product (or service) from obtaining raw materials, production, use to abandonment, that is, from cradle to grave. Next, the total cost of trucks is assessed from a truck owner’s perspective, which is called TCO. TCO assessment method is similar to LCA, and can be described as the sum of cost that occurs in the whole life service cycle of the assets, including purchase cost, energy cost, maintenance cost, and handling cost. TCO is often used as the technical evaluation standard by companies.
The dataset for trucks in this study is not nation-specific. However, for country-dependent factors, such as electricity demand, electricity generation capacity, and transport demand, the data of China are used. For a fair comparison, six kinds of similar-sized light and medium-duty trucks are compared. Because the battery is the main difference between plug-in and battery-swap ETs, some of the same parameters as plug-in ETs are used for battery-swap ETs. The most significant characteristics are summarized in Table 1. According to the literature research, commercial trucks drive 14,728 km to 30,000 km per year [10,35,36]. To facilitate calculation, this study assumes that lifetime of a truck is 10 years and life driving mileage is 240,000 km, then sensitivity analysis is conducted for total driving mileage in Section 4.1. Moreover, according to Lebeau [36], and Miotti et al. [37], the lifetime of a Li-ion battery is five to six years on average. As a result, this research estimates an average value of two batteries over the lifetime of an electric truck (ET).
2.1. Simplified LCA Method to Evaluate GHG Emissions
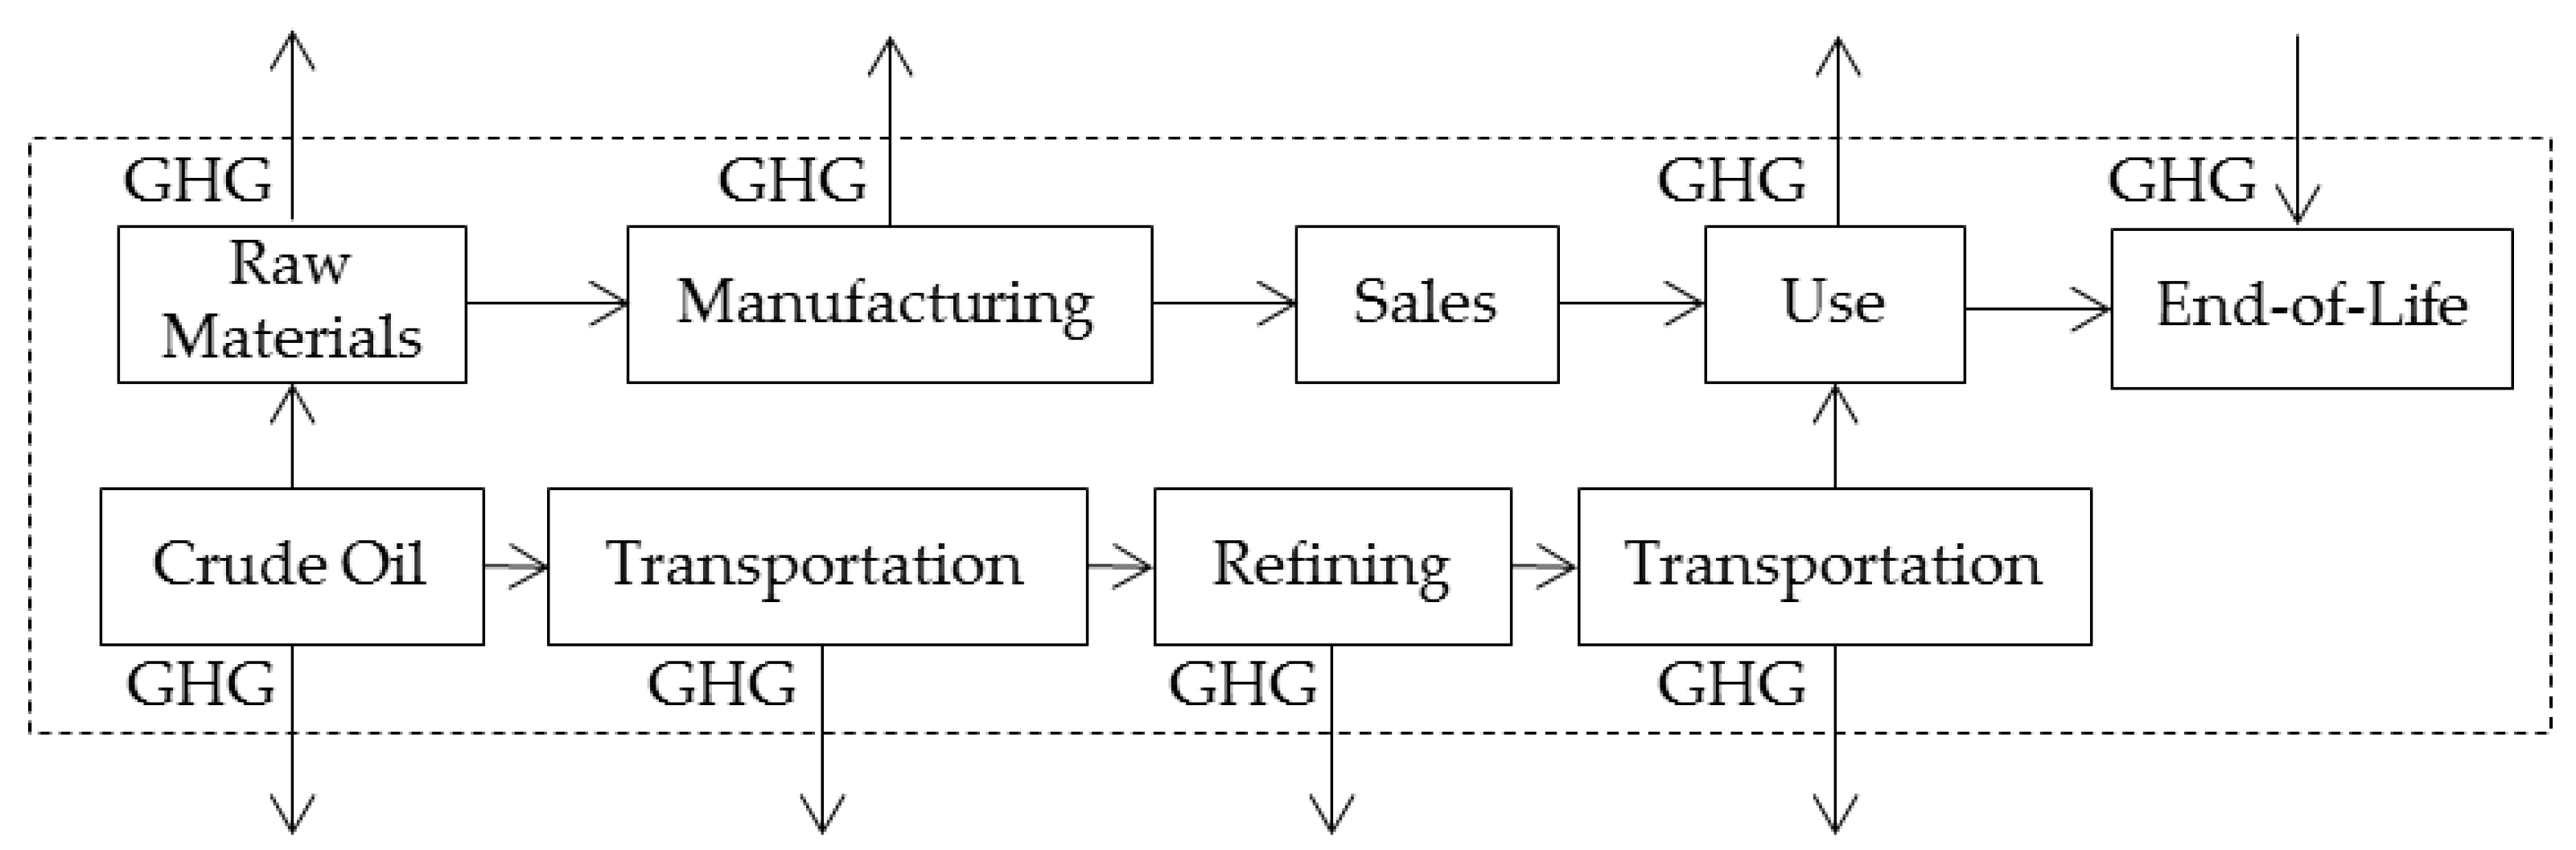
According to the definition of International Organization for Standardization (ISO) 14040, LCA includes the following four stages: goal and scope definition, inventory analysis, impact assessment, and explanatory analysis. Following these steps, this research first determines the life cycle scope of trucks, namely the system boundary. Then the life cycle is divided into several phases, and the input and output of each phase are analyzed. Finally, life cycle GHG emissions are calculated. As shown in Figure 2, GHG emissions from the entire lifetime of a diesel truck (DT) are mainly produced from three phases: vehicle production, use, and end-of-life. GHG emissions from use phase include direct emissions from the combustion of diesel and indirect emissions from the extraction and transportation of crude oil and diesel. However, unlike the other two phases, end-of-life phase has effects on reducing GHG emissions, because recycled materials and components can be used for remanufacturing so as to reduce GHG emissions from the truck production phase [35]. In China, the main focus of remanufacturing is auto parts remanufacturing, which officially began in 2008 when the National Development and Reform Committee of China announced 14 enterprises as pilot remanufacturers of auto parts. As a result, GHG emission savings due to recycling are considered in the calculation of life cycle GHG emissions. Life cycle GHG emissions of DTs can be calculated according to Equation (1). Because different GHG contributes differently to the global warming effect, the current study uses carbon dioxide equivalent (CO2e) as the basic unit for measuring the impact of GHG.
where is the total GHG emission of DTs (kg CO2e); is the GHG emission of DTs in the production phase (kg CO2e); is the GHG emission of DTs in the use phase (kg CO2e); and is the GHG emission of DTs during end-of-life recycling (kg CO2e).
The boundaries of GHG emission systems of ETs are roughly similar to those of DTs. But a difference is that the battery production also contributes to GHG emissions. Another difference is that GHG emissions during the use phase only refer to indirect emissions from electricity production and transmission. Therefore, the GHG emissions of ETs are the sum of all emissions from the production, use and end-of-life phases of truck bodies, batteries, and electricity, as given in Equation (2):
where refers to the total GHG emissions of ETs (kg CO2e); and refer to GHG emissions from the production phase of ETs’ bodies and batteries, respectively (kg CO2e); refers to emissions of ETs from use phase (kg CO2e); and and refer to GHG emissions from the end-of-life recycling of ETs’ bodies and batteries, respectively (kg CO2e).
Most of the data used in the simplified LCA method are secondary data, that is, it comes from the literature or databases. In vehicle production stage, Lee et al. [10] found that GHG emissions can be calculated by a simple linear model that depends only on curb weight, because material compositions of conventional vehicles within specific classes (cars, light-duty trucks, etc.) are sensibly constant on a percent-by-weight basis. Accordingly, Equation (3) can be used to estimate the GHG emissions of DTs from production phase:
where is the curb weight of DT (kg); and is a constant of GHG emissions and represents emissions of truck production per unit curb weight (kg CO2e/kg). According to literature [10], is equal to 8 kg CO2e /kg.
Given that the increase in GHG emissions from the production phase of ETs is mainly caused by the battery production compared with those of DTs, in addition to calculating GHG emissions from the body production phase of ETs, GHG emissions from the battery production process are estimated as well. The GHG emissions of battery production can also be simplified as a linear function that only relates to battery capacity, so GHG emissions from the ETs production phase can be calculated according to Equation (4):
where is the curb weight of ETs (kg), and is the battery capacity (kWh). is a constant of the GHG emissions of battery production per unit capacity (kg CO2e). According to literature [10], is equal to 141 kg CO2e /kWh.
During the use phase, the GHG emissions of DTs are mainly generated during the diesel combustion process, while those generated from the diesel production phases should also be measured. According to data from the National Bureau of Statistics, the average consumption of crude oil in China for producing 1 kg of diesel was 2.95 kg in 2014. The diesel production and combustion processes are divided into five stages, as shown in Figure 2. GHG emissions occurring at each stage are shown in Table 2.
As can be seen, emission of ETs is almost zero during the use phase. However, it does not mean that they produce no GHG emission, because emissions from electricity production should not be ignored. Average GHG emissions from power generation process can be calculated according to Equation (5) [10]:
where is the average GHG emissions from unit electricity powered by source (kg CO2e /kWh), and is power generation proportion of power source in China’s power generation structure (%). The values of and are shown in Table 3. Moreover, , , and stand for the transmission efficiency of power network, the efficiency of converting electrical energy into chemical energy, and the efficiency of converting chemical energy into mechanical energy, respectively. These three parameters are assumed to be the same for plug-in ETs and battery-swap ETs, because the power transmission network and battery types in this study are the same for them. The values of the three parameters are shown in Table 4. In addition, refers to the payload of ETs (kg), and its value can be found in Table 1.
The recycling of truck bodies and batteries, and the production of spare parts for new vehicles, are of great significance in reducing GHG emissions from the truck body and battery manufacturing phases. For example, if battery manufacturers collect Li-ion batteries and deal with them reasonably, it will reduce the GHG emissions of Li-ion batteries by 19% [40]. Lee et al. [10] estimated the GHG emission savings from recycling, and concluded that GHG emission savings are about 17% of total GHG emissions of a truck body. Therefore, GHG emission savings in truck body and battery end-of-life phases can be estimated accordingly, as shown in Table 5.
2.2. TCO Method to Evaluate Cost
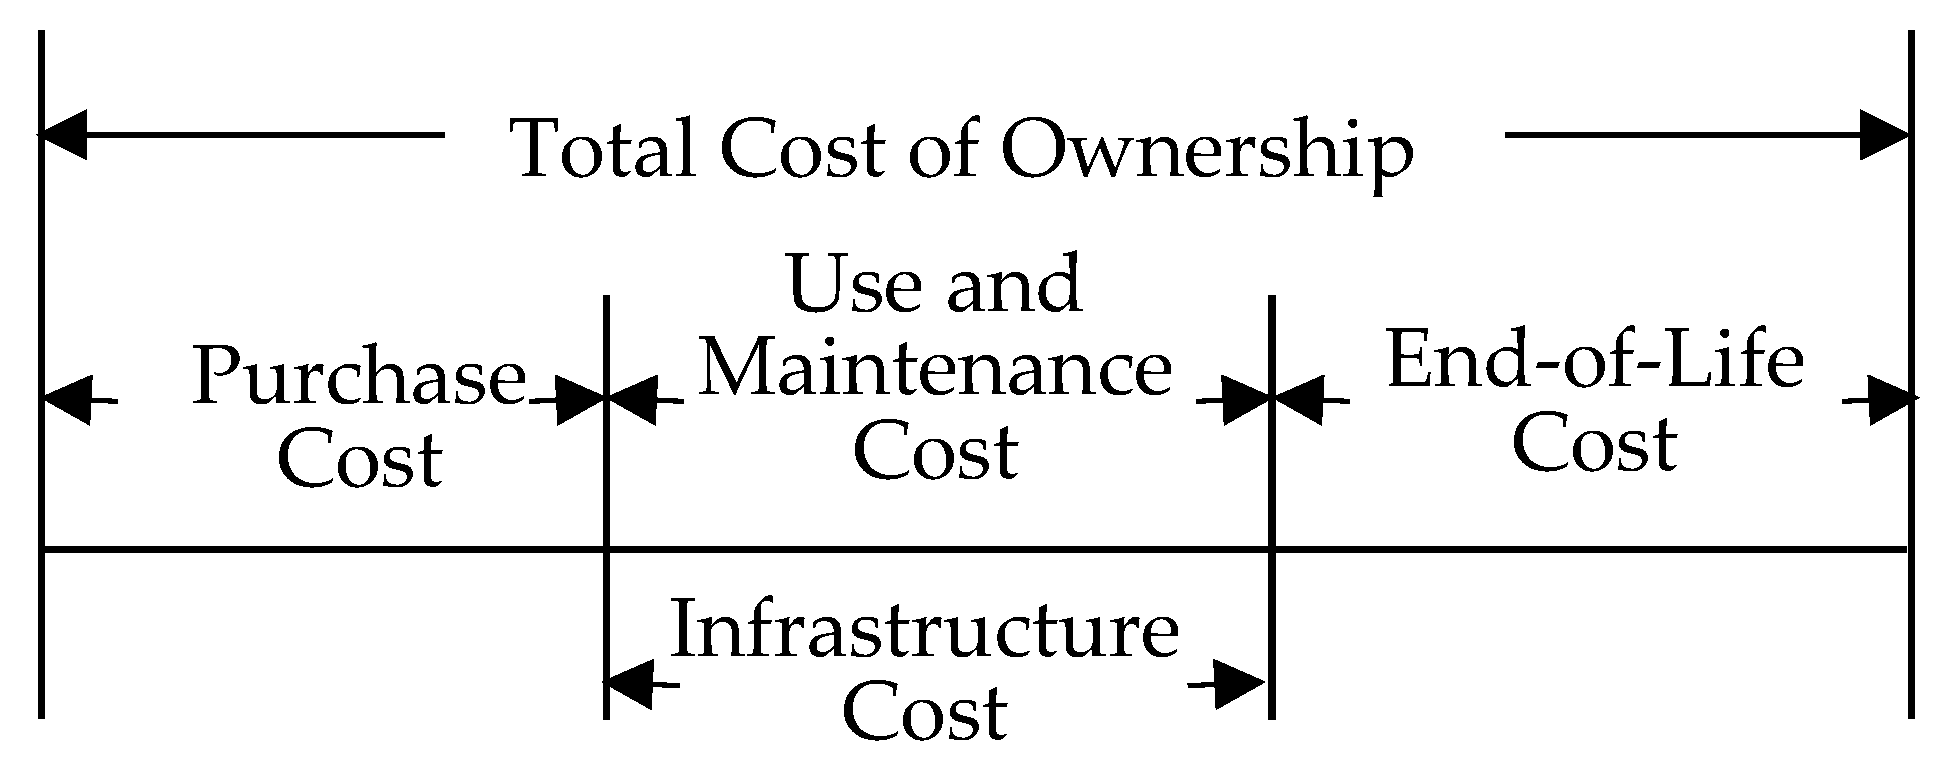
Even if the use of ETs is identified as a way to reduce the consumption of fossil fuel, decision makers may not regard ETs as an attractive alternative to traditional DTs if the former are not cost-effective [1,42]. The high purchase cost of ETs is usually considered as the main barrier for switching from conventional trucks. However, a rational fleet manager should also consider other costs incurring in a truck’s lifetime when calculating the total cost. Thus, calculating cost form the TCO perspective is highly significant. As plug-in ETs have many differences in cost with battery-swap ETs, in this study, the respective TCO of light-duty and medium-duty DTs, plug-in ETs, and battery-swap ETs are compared. The following cost of trucks is considered in the TCO: purchase cost, maintenance cost, use cost, infrastructure cost, and recycling cost, as shown in Figure 3. In particular, infrastructures of plug-in ETs primarily refer to charging facilities, while those of battery-swap trucks refer to battery-swap facilities. For battery-swap ETs, electricity and battery-swap infrastructure costs are included in battery rental cost.
The TCO of DTs, plug-in ETs, and battery swap ETs can be calculated according to Equations (6)–(8), respectively.
where the superscripts and represent DTs, plug-in ETs, and battery-swap ETs, respectively; is the purchase cost of the truck body (USD); is the purchase cost of the battery (USD); is the maintenance cost (USD); is the diesel cost (USD); is the recycling cost of truck body (USD); is the electricity cost (USD); is the battery recycling cost (USD); and is the battery rental cost of battery-swap ETs (USD).
Purchase cost in this research refers to the cost paid to the truck retailer in the purchase phase, not including purchase tax, insurance, and government subsidies. As shown in Table 1, the purchase costs of light-duty DTs and medium-duty DTs are USD 11,239.8 and USD 21,009.8, respectively, and those of light-duty and medium-duty plug-in ETs are USD 9193.6 and USD 28,243.6, respectively. However, for battery-swap ETs, consumers only need to buy a bare truck without batteries. It is reported that 50% of an electric vehicle’s price is the battery cost [43], thus the purchase costs of light-duty and a medium-duty battery-swap ETs can be as low as USD 4596.8 and USD 14,121.8, respectively.
In the use phase, the cost of DTs includes maintenance cost and diesel cost. For plug-in ETs, the maintenance, electricity, and infrastructure costs are considered. However, if battery-swap ETs are used, the user only needs to pay for the battery rental cost and maintenance cost because electricity and infrastructure costs are included in rental cost. According to Vliet et al. [44], the maintenance cost of a DT is about USD 0.0484/km, while that of an ET is estimated to be half of that of a DT owing to the absence of engine and transmission-related maintenance (e.g., timing belt, water pump, fuel filter, oil change, engine air filter, and coolant replacement), a simpler structure, as well as smaller number of components [10,36]. Aside from maintenance cost, diesel and electric costs are important factors affecting use cost. Diesel and electricity prices used in this research are the 2017 average values of China, which are USD 0.9266/L for diesel, USD 0.0589/kWh during the trough period (23.00 to 7.00), and USD 0.1746/kWh during the peak period (7.00 to 23.00) for industrial electricity. For plug-in ETs, building charging piles is considered as a more economical and feasible way than a building charging station. The cost of building a charging pile is USD 1210.44 [45] and it requires almost no maintenance cost. As a result of the long charging time and the limited mileage, the vacant time at night and the day time when needed can be utilized to charge plug-in ETs. In this manner, the electricity cost of plug-in ETs considers the average electricity price of the peak and trough period. Furthermore, the infrastructures of the battery-swap station include power supply facilities, charging facilities, and battery-swap facilities. Based on the centralized charging mode, night charging is selected to achieve cheaper charging cost. This study considers a battery-swap station with a daily service capacity of 120 vehicles as an example to calculate the infrastructure cost. The composition of the infrastructure cost is shown in Table 6.
The unit rental cost of the battery is estimated by the annuity method, as shown in Equation (9) [42]:
where is the unit battery rental cost per kilometer of a battery-swap ET (USD); is annual electricity cost (USD); is annual labor cost (USD); is the annual batteries depreciation (USD); is annual infrastructures depreciation (USD); is annual kilometers traveled (km); is tax rate (%); and is profit margin (%). This study assumes that the designed service life of the battery is five years [40] and that of the charging/swapping infrastructure is 20 years [45]. Their depreciation rates are all 5% [45], and the tax rate is 5.54% [45]. Moreover, the profit margin is set to 60%; and a sensitivity analysis will be made in Section 4.1 to evaluate its impact on the TCO.
Finally, in the end-of-life phase, the recycling values of DTs and battery-swap ETs mainly come from the recycling of truck bodies. However, for plug-in ETs, those come from both truck bodies and batteries. This study assumes that the recovery rate is 5% [45].
3. Results
Based on the simplified LCA model and TCO model, the GHG emissions and TCO of light-duty and medium-duty DTs, plug-in ETs and battery-swap ETs in China are presented. In addition, the GHG emissions and the TCO of these trucks are compared with each other to find the most competitive ones in terms of emission reduction and cost saving.
3.1. Average GHG Emissions
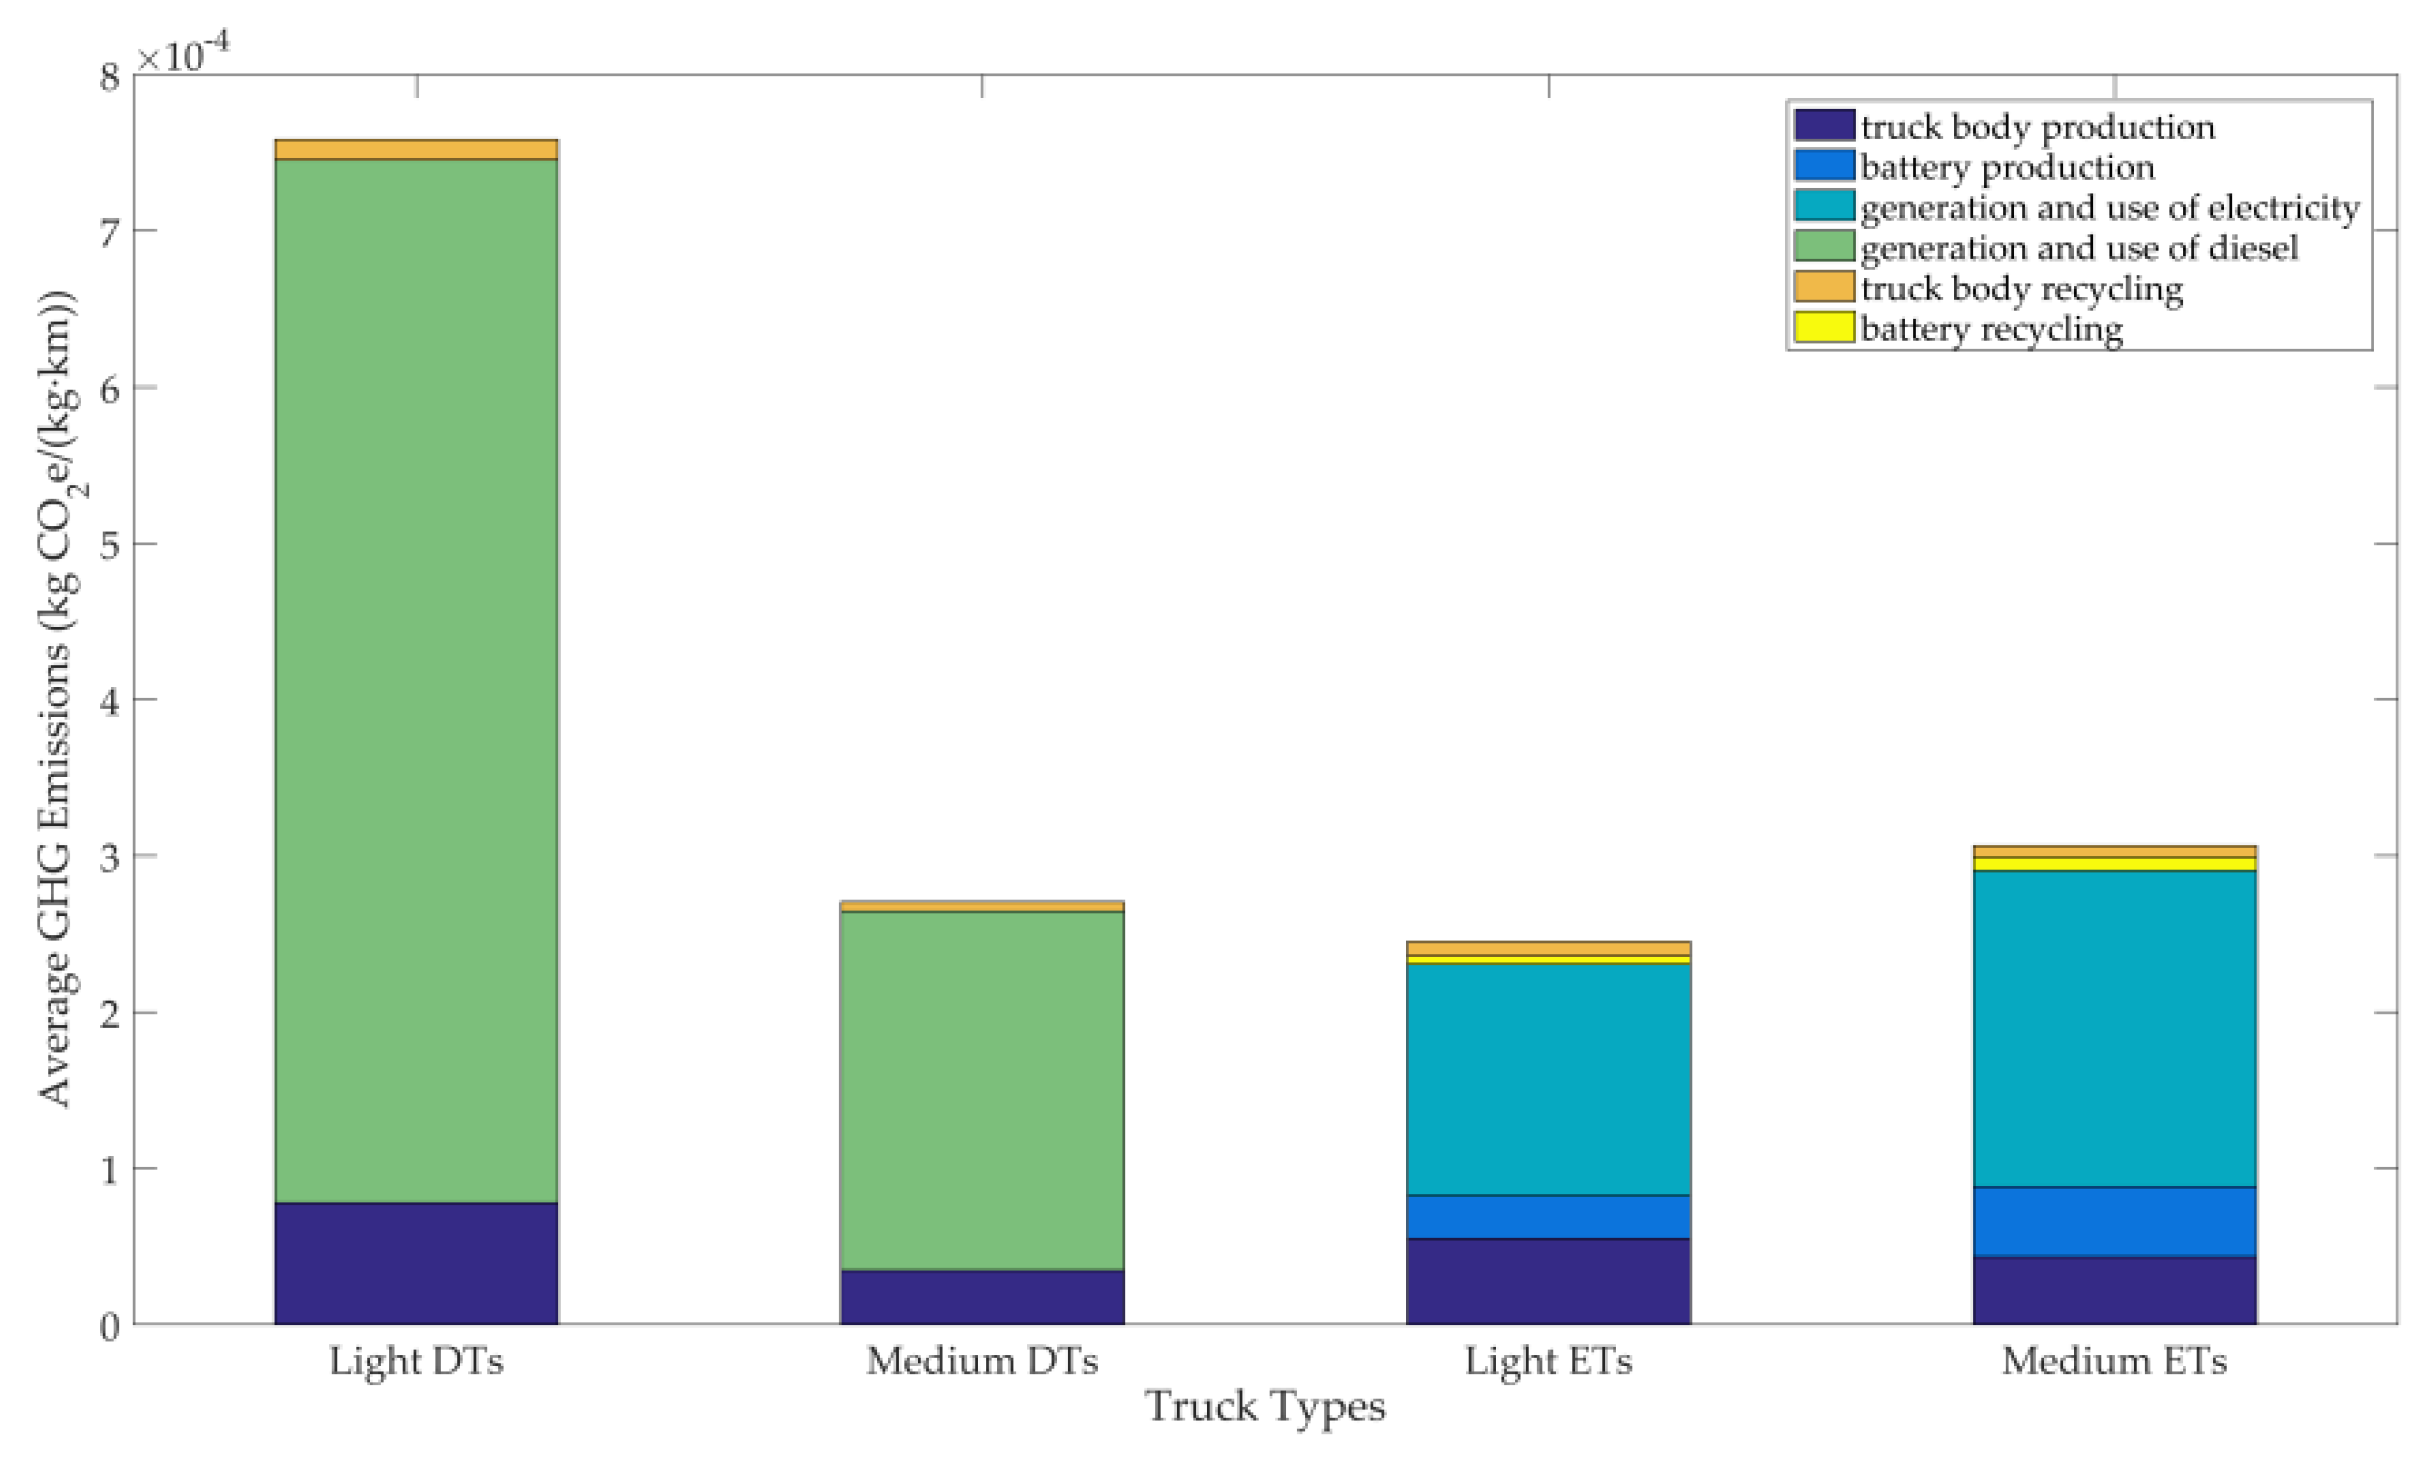
As loads of trucks in the same class selected in this research are not strictly equal, observing the relationship between GHG emissions and work efficiency of a truck from the perspective of total GHG emissions is difficult. Therefore, the average GHG emissions per kilometer per kilogram are introduced to measure GHG emission levels of trucks which have the same work efficiency. The average GHG emissions of DTs and ETs, including light-duty and medium-duty trucks, and emissions from each stage are shown in Figure 4. Here ETs include plug-in and battery-swap ETs, because their GHG emissions are similar.
Figure 4 shows that the average GHG emissions of light-duty and medium-duty DTs are 7.454 × 10⁻⁴ kg CO2e/(kgkm) and 2.646 × 10⁻⁴ kg CO2e/(kgkm), and those of light-duty and medium-duty ETs are 2.306 × 10⁻⁴ kg CO2e/(kgkm) and 2.905 × 10⁻⁴ kg CO2e/(kgkm), respectively. The average GHG emissions of light-duty ETs are 69% lower than those of light-duty DTs, while those of medium-duty ETs are 9.8% higher than those of medium-duty DTs. Analyzing the component of the average GHG emissions of DTs and ETs, it can be observed that the average GHG emissions of light-duty DTs far exceed those of light-duty ETs. Here, the main contributor is the average life cycle GHG emissions of diesel, which accounts for 91.3% of the total emissions. Emissions from the body production of light-duty ETs are smaller than those of light-duty DTs, but their total production (including body and battery production) emissions are higher than those of DTs owing to the high emissions from battery production. The GHG emissions from using electricity are much smaller than those from using diesel, which makes up for higher GHG emissions from trucks and battery manufacturing and makes the average GHG emissions of light-duty ETs smaller than those of light-duty DTs. However, for medium-sized trucks, results seem to be much different. On the one hand, the average GHG emissions from diesel decrease while those from electricity increase when doing the same work. The reason might be that the weight of the battery and body of medium-duty ETs increases sharply, resulting in the decrease of loading rate, which in return leads to the increase in average GHG emissions. On the other hand, GHG emissions from the production of ETs are still higher than those of DTs. Thus, the average GHG emissions of medium-duty ETs exceed those of medium-duty DTs.
In conclusion, the average GHG emissions of light-duty DTs are the highest. On the contrary, light-duty ETs have the lowest average emissions, which can be the best choice for decision makers if only considering the performance in emission reduction. For medium-duty trucks, the average GHG emissions of ETs are higher than those of DTs. That is to say, smaller duty ETs will have greater advantages in reducing GHG emissions.
3.2. Total Cost of Ownership
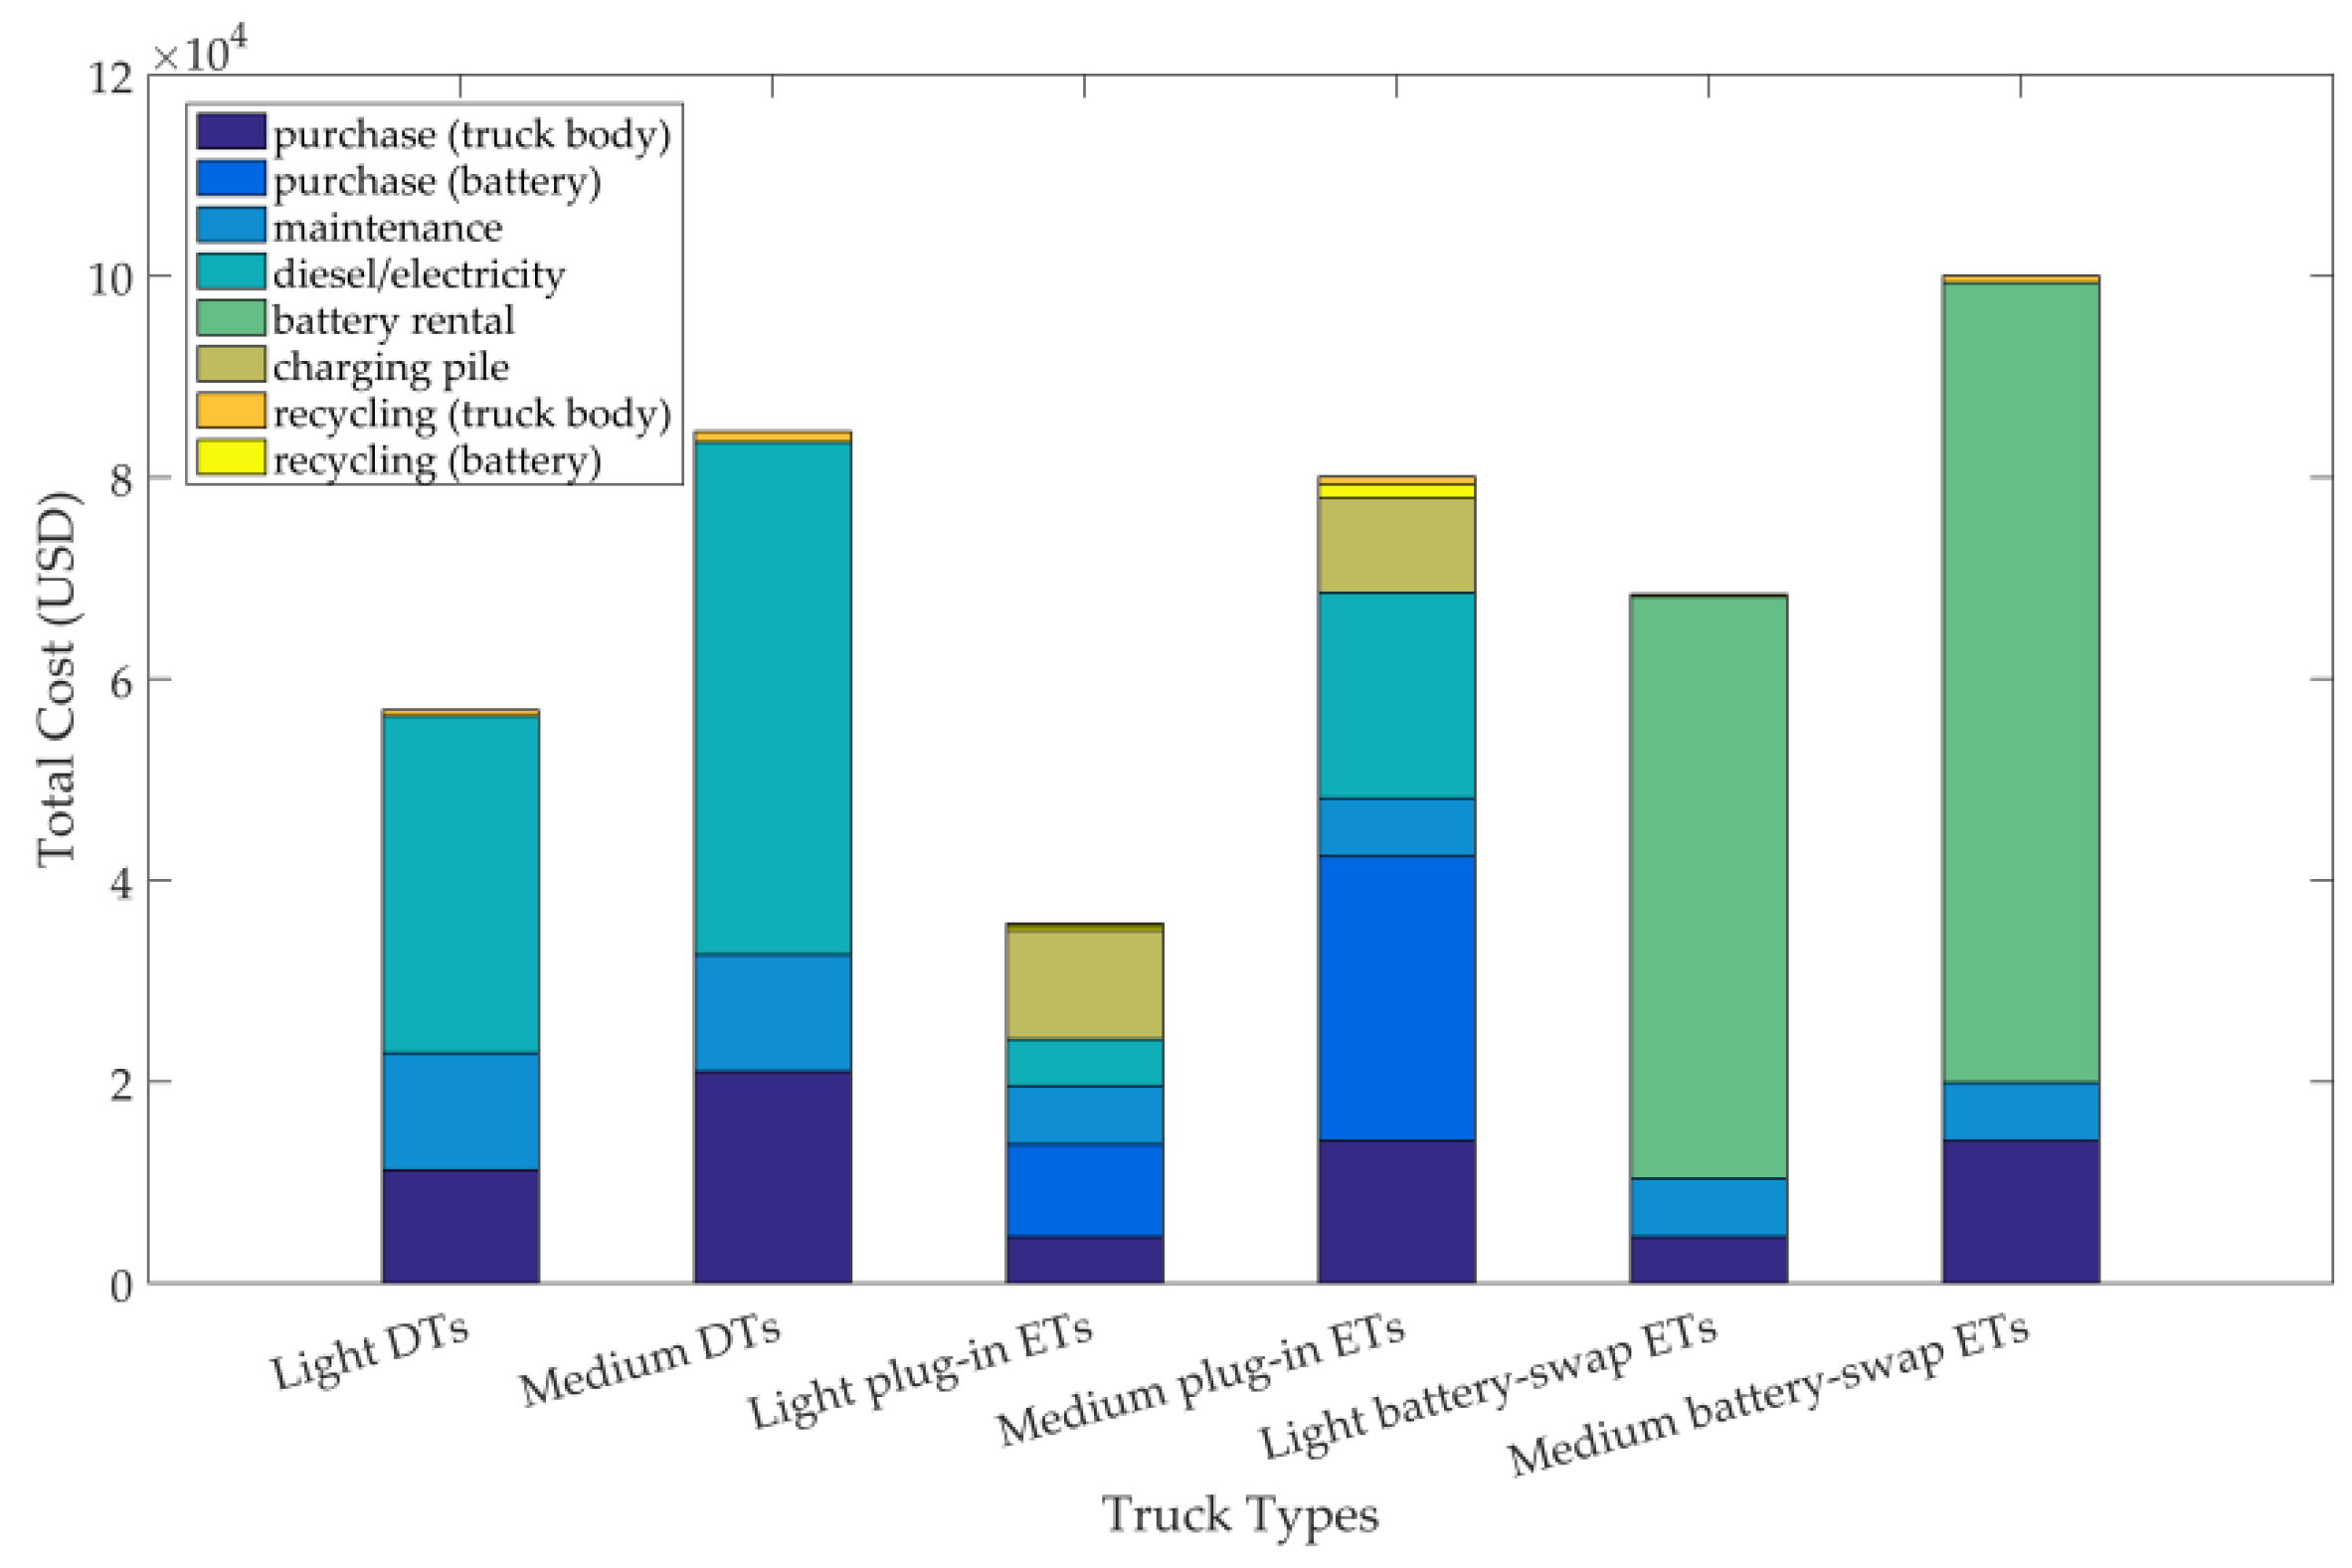
Figure 5 shows the TCO of six types of trucks. The TCO values of light-duty and medium-duty DTs are USD 56,338.59 and USD 83526.37, while those of light-duty and medium-duty plug-in ETs are USD 35,047.22 and USD 77,954.07. The TCO of light-duty and medium-duty battery-swap ETs are USD 68,187.73 and USD 99,353.26. For light-duty trucks, the TCO of plug-in ETs is 37.8% lower than that of DTs, while that of battery-swap ETs is 21% higher than that of DTs. For medium-duty trucks, the TCO values of plug-in and battery-swap ETs are 6.7% lower and 18.9% higher than those of DTs. From the cost point of view, both light-duty plug-in ETs and medium-duty plug-in ETs have lower total costs compared with other trucks in the same class owing to their lower electricity cost and maintenance cost, although their purchase cost is higher than that of the other trucks. Moreover, the battery-swap ETs are considered to be the worst choices. The cost composition of battery-swap ETs shows that the high battery rental cost is the main contributor to their total cost, which accounts for 85.1% and 80.7% of the TCO of light-duty and medium-duty battery-swap ETs. As for light-duty and medium-duty battery-swap ETs, 45.6% and 40.8% of the battery rental costs are spent on battery and infrastructure costs. Therefore, the first step to reduce total cost of battery-swap ETs is to reduce the battery rental cost, especially the infrastructure and battery costs, as much as possible.
In summary, both the average GHG emissions and cost of light-duty plug-in ETs are lower than those of light-duty DTs and battery-swap ETs, which means that the former are the most competitive ones from environmental protection and economy perspectives. However, the performances of medium-duty plug-in ETs in terms of GHG emission reduction and cost saving are not as good as those of DTs. Furthermore, the costs of light-duty and medium-duty battery-swap ETs are always higher than those of diesel and plug-in ETs in the same class.
4. Discussion
As the results of the GHG emissions and TCO are however limited to the Chinese context, sensitivity analysis is conducted to analyze the influence of several parameters on the average GHG emissions and the TCO. Then optimistic and pessimistic scenario analysis is also performed to forecast possible changes in GHG emissions and TCO under the influence of multiple factors.
4.1. Sensitivity Analysis
Because of the uncertainties of many parameters of the simplified LCA model and the TCO model in the future, this study tests the different assumptions of some parameters, including fuel economy, battery and charging/swapping infrastructure cost, diesel and electricity prices, coal-fired power generation rate, use frequency, and profit margin, to evaluate the sensitivity of the average GHG emissions and the TCO.
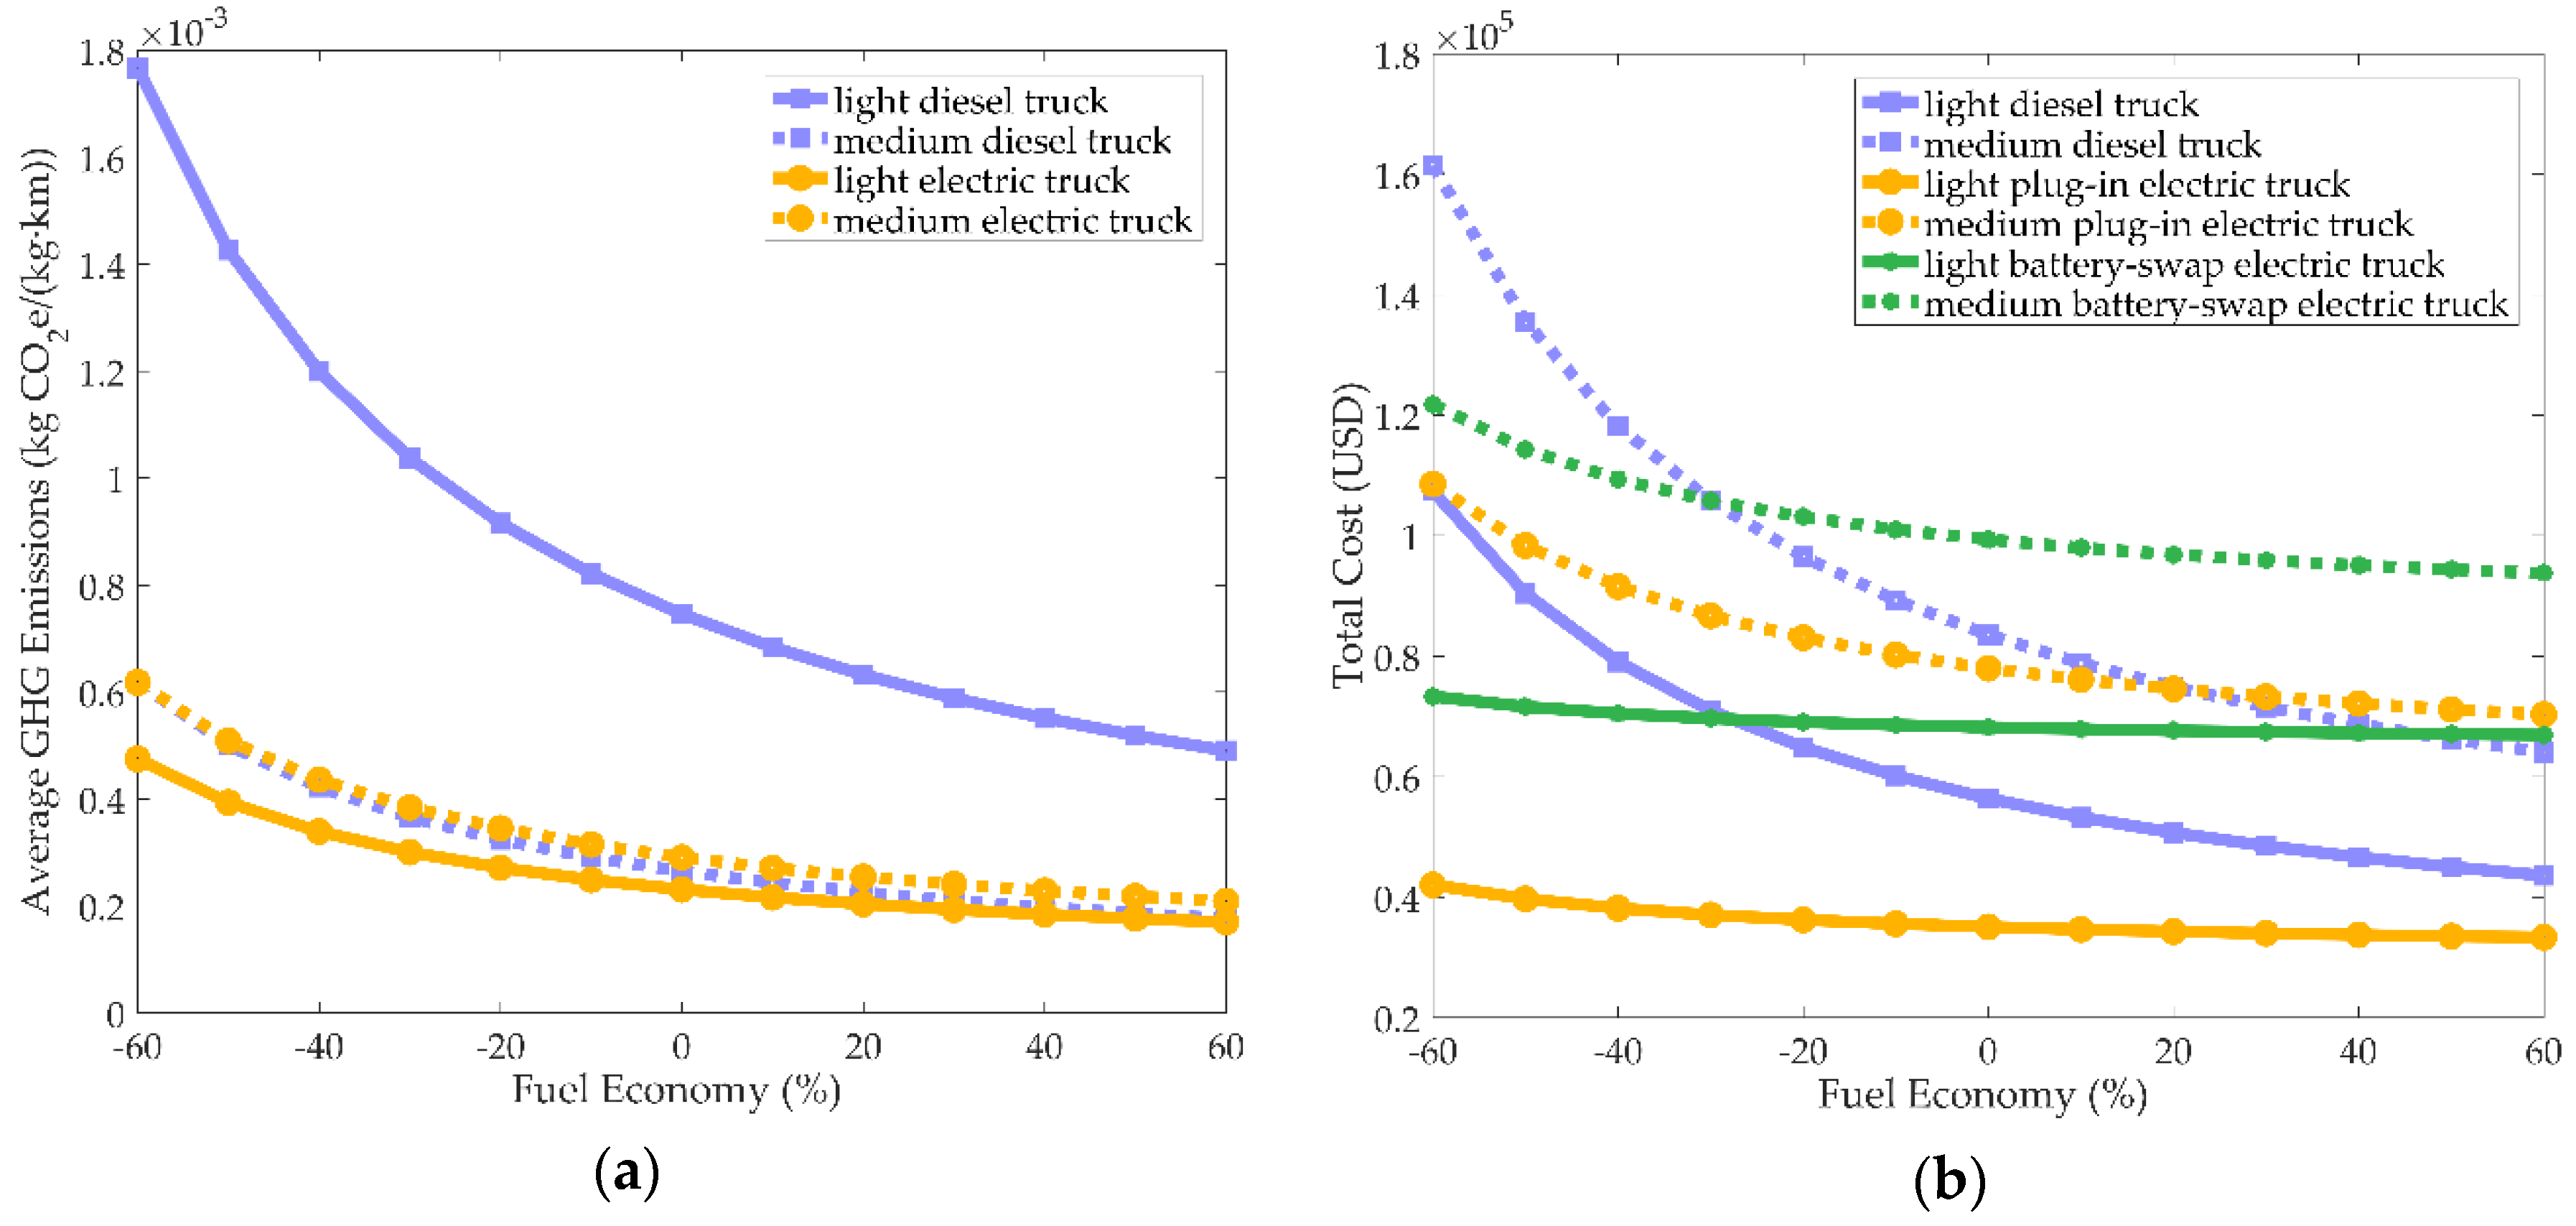
With the increase in the number of vehicles in the city, urban traffic has become increasingly congested. Hence, delivery trucks have been driving in environments with low speed and frequent parking over a long period of time, which will affect fuel economy of trucks. As a result, the effects of fuel economy on the GHG emissions and the TCO are first analyzed. Fuel economy in this study is assumed to be linearly related to speed, and to change within the range of ±60%. Figure 6a shows that the average GHG emissions of both DTs and ETs decrease with fuel economy. The worse the fuel economy is, the faster the GHG emissions increase, especially for light-duty DTs. The increase rates of medium-duty DTs are a little higher than medium-duty ETs, indicating that the changes of driving environment, namely, the changes of fuel economy, have greater impacts on the average GHG emissions of DTs. In other words, when trucks are parked more frequently because of crowded roads, using ETs has more advantages in reducing GHG emissions. Moreover, Figure 6b shows that the TCO of six types of trucks all decrease with fuel economy. Among them, medium-duty DTs have the fastest decreasing speed. For light-duty and medium-duty trucks, decreasing trends of plug-in and battery-swap ETs are not obvious, but the decreasing speed of DTs is fast. With the reduction of fuel efficiency, the TCO of DTs is much higher than that of plug-in ETs. When the fuel efficiency decreases by more than 27.9%, the TCO of light-duty DTs will be higher than that of light-duty battery-swap ETs, while the TCO of medium-duty DTs will be higher than that of medium-duty battery-swap ETs when the fuel efficiency decreases by more than 30%. The results in Figure 6b also indicate that fuel economy has a great impact on the TCO of DTs, especially for medium-duty DTs. The cost of medium-duty DTs will rapidly become lower than that of medium-duty ETs rapidly when the fuel efficiency increases by 21.4%. That means, when driving in suburbs where traffic is not crowded and is no need to stop frequently, the economy performance of ETs is poor. However, in the case of terrible road conditions, both plug-in and battery-swap ETs will gradually perform better than DTs.
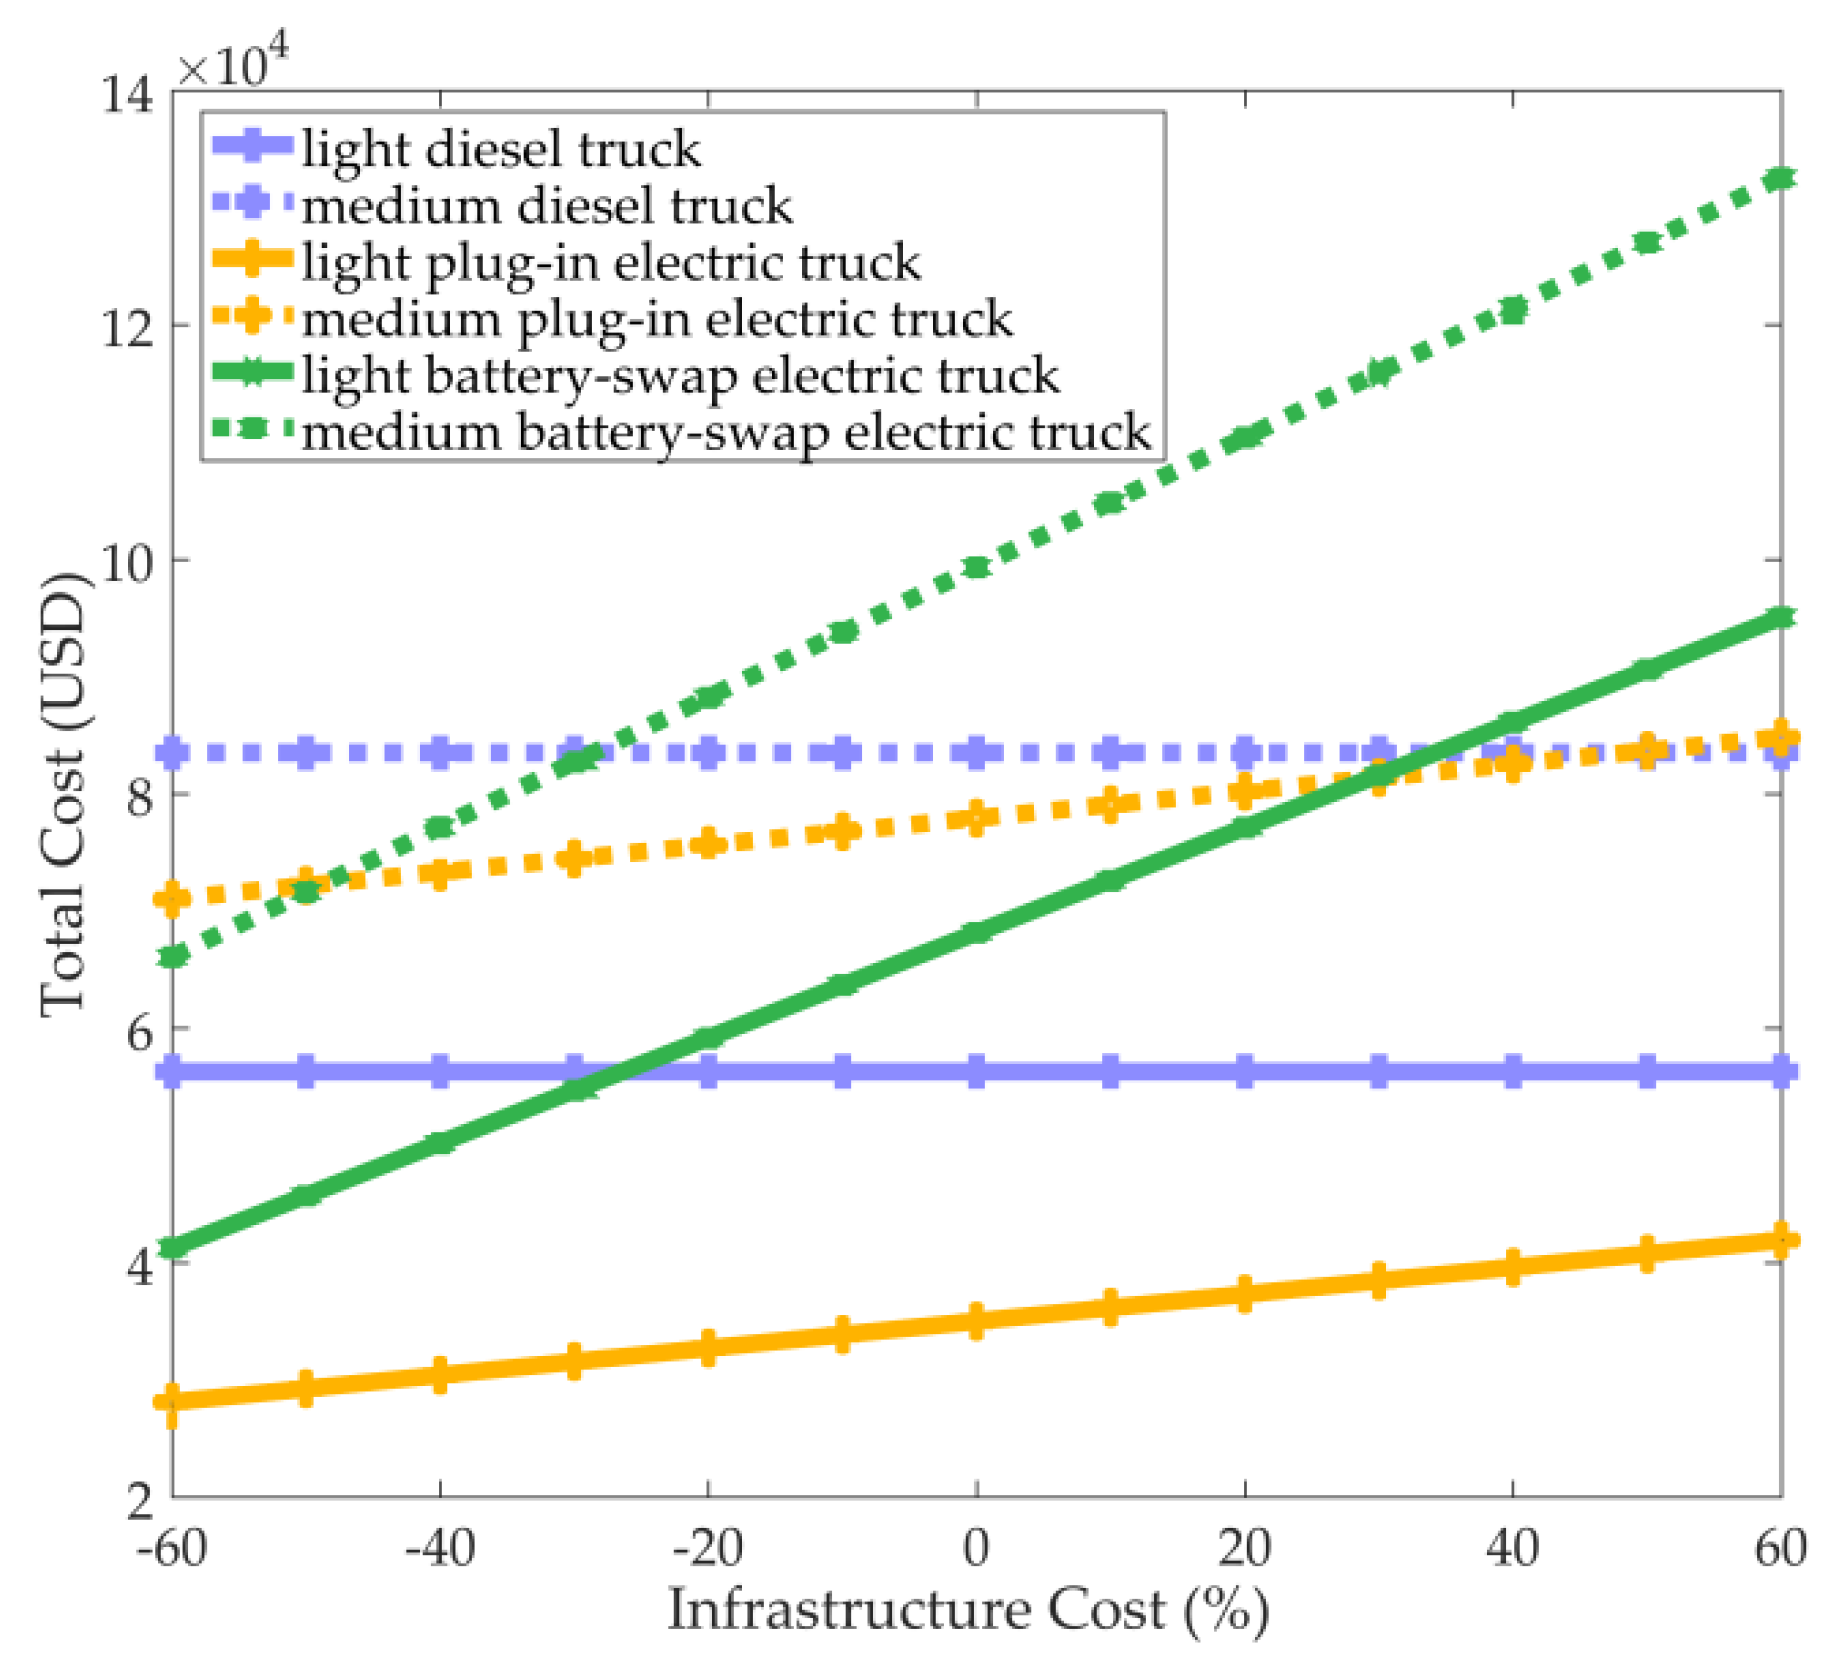
Next, this study also analyzed impacts of battery and charging/swapping infrastructure costs on the TCO, because they are important components of the TCO of ETs, especially for battery-swap ETs. High charging/swapping infrastructure costs are also the key factors resulting in the high TCO of battery-swap ETs. However, battery and infrastructure costs are expected to decrease with the maturity of charging/swapping technology. Therefore, this study analyzes the TCO sensitivity of six types of trucks on the costs of battery and charging/swapping infrastructure. Results of sensitivity analysis are shown in Figure 7, which illustrates that when battery and infrastructure costs decrease, TCO values of all kinds of ETs will decline. The advantages of light-duty plug-in ETs in cost saving are more outstanding. When there is a decrease of more than 26.4%, light-duty battery-swap ETs will have an advantage over light-duty DTs in the TCO. For medium-duty trucks, when there is a decrease of more than 28.6%, the TCO of battery-swap ETs will be lower than that of DTs. In addition, when decreasing by 48.7%, the TCO of battery-swap ETs will be even lower than that of plug-in ETs. In brief, reducing the costs of battery and charging/swapping infrastructure is of great significance to reduce the TCO of battery-swap ETs. When the decline is large enough, both light-duty and medium-duty battery-swap ETs will be superior to DTs in cost saving.
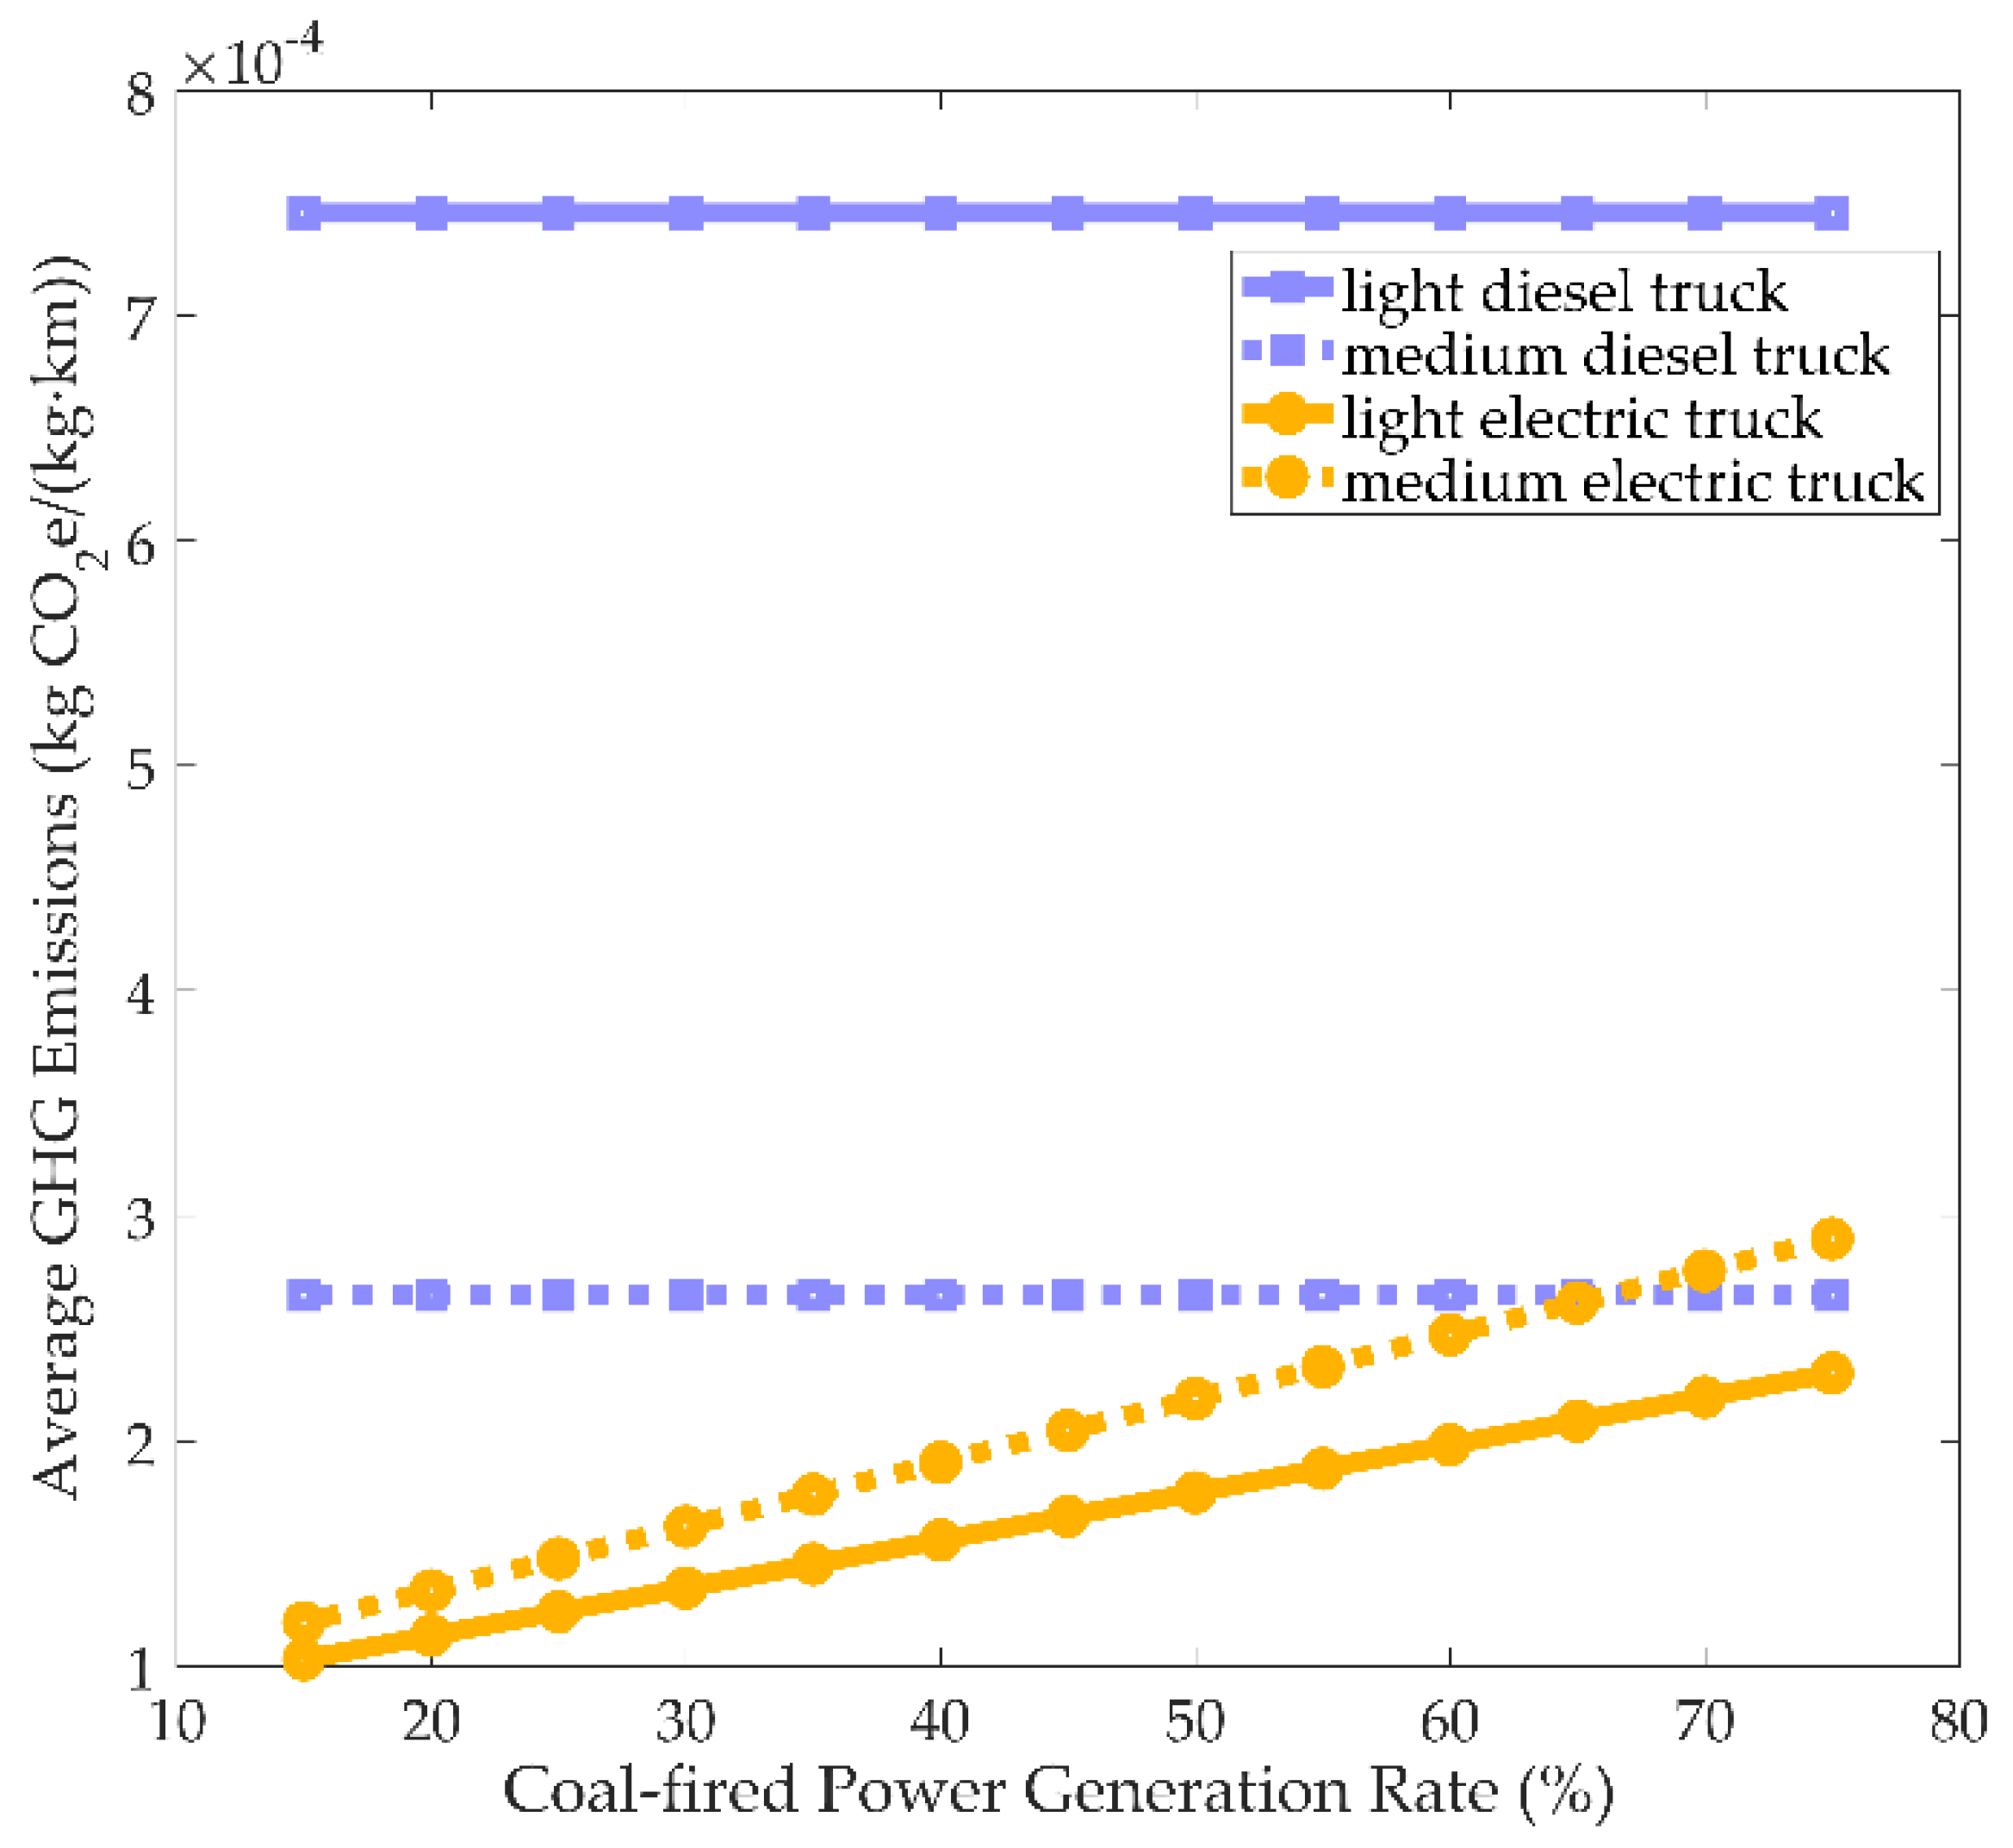
Moreover, for the reason that coal-fired power generation has caused a lot of GHG emissions, in power system reform, the use of clean energy, such as nuclear energy and wind energy, is advocated to optimize power structure, reduce GHG emissions, and promote sustainable economic development. Therefore, the influence of coal-fired power generation rate on GHG emissions is analyzed after wards. As shown in Figure 8, analysis results indicate that reducing the proportion of coal-fired power generation can enhance the performances of both light-duty and medium-duty ETs in GHG emission reduction. When the coal-fired power generation rate is less than 66.1%, the average GHG emissions of medium-duty ETs will be lower than those of medium-duty DTs. Therefore, optimizing the power generation structure and increasing the use of clean energy are also important for the reducing GHG emissions of ETs.
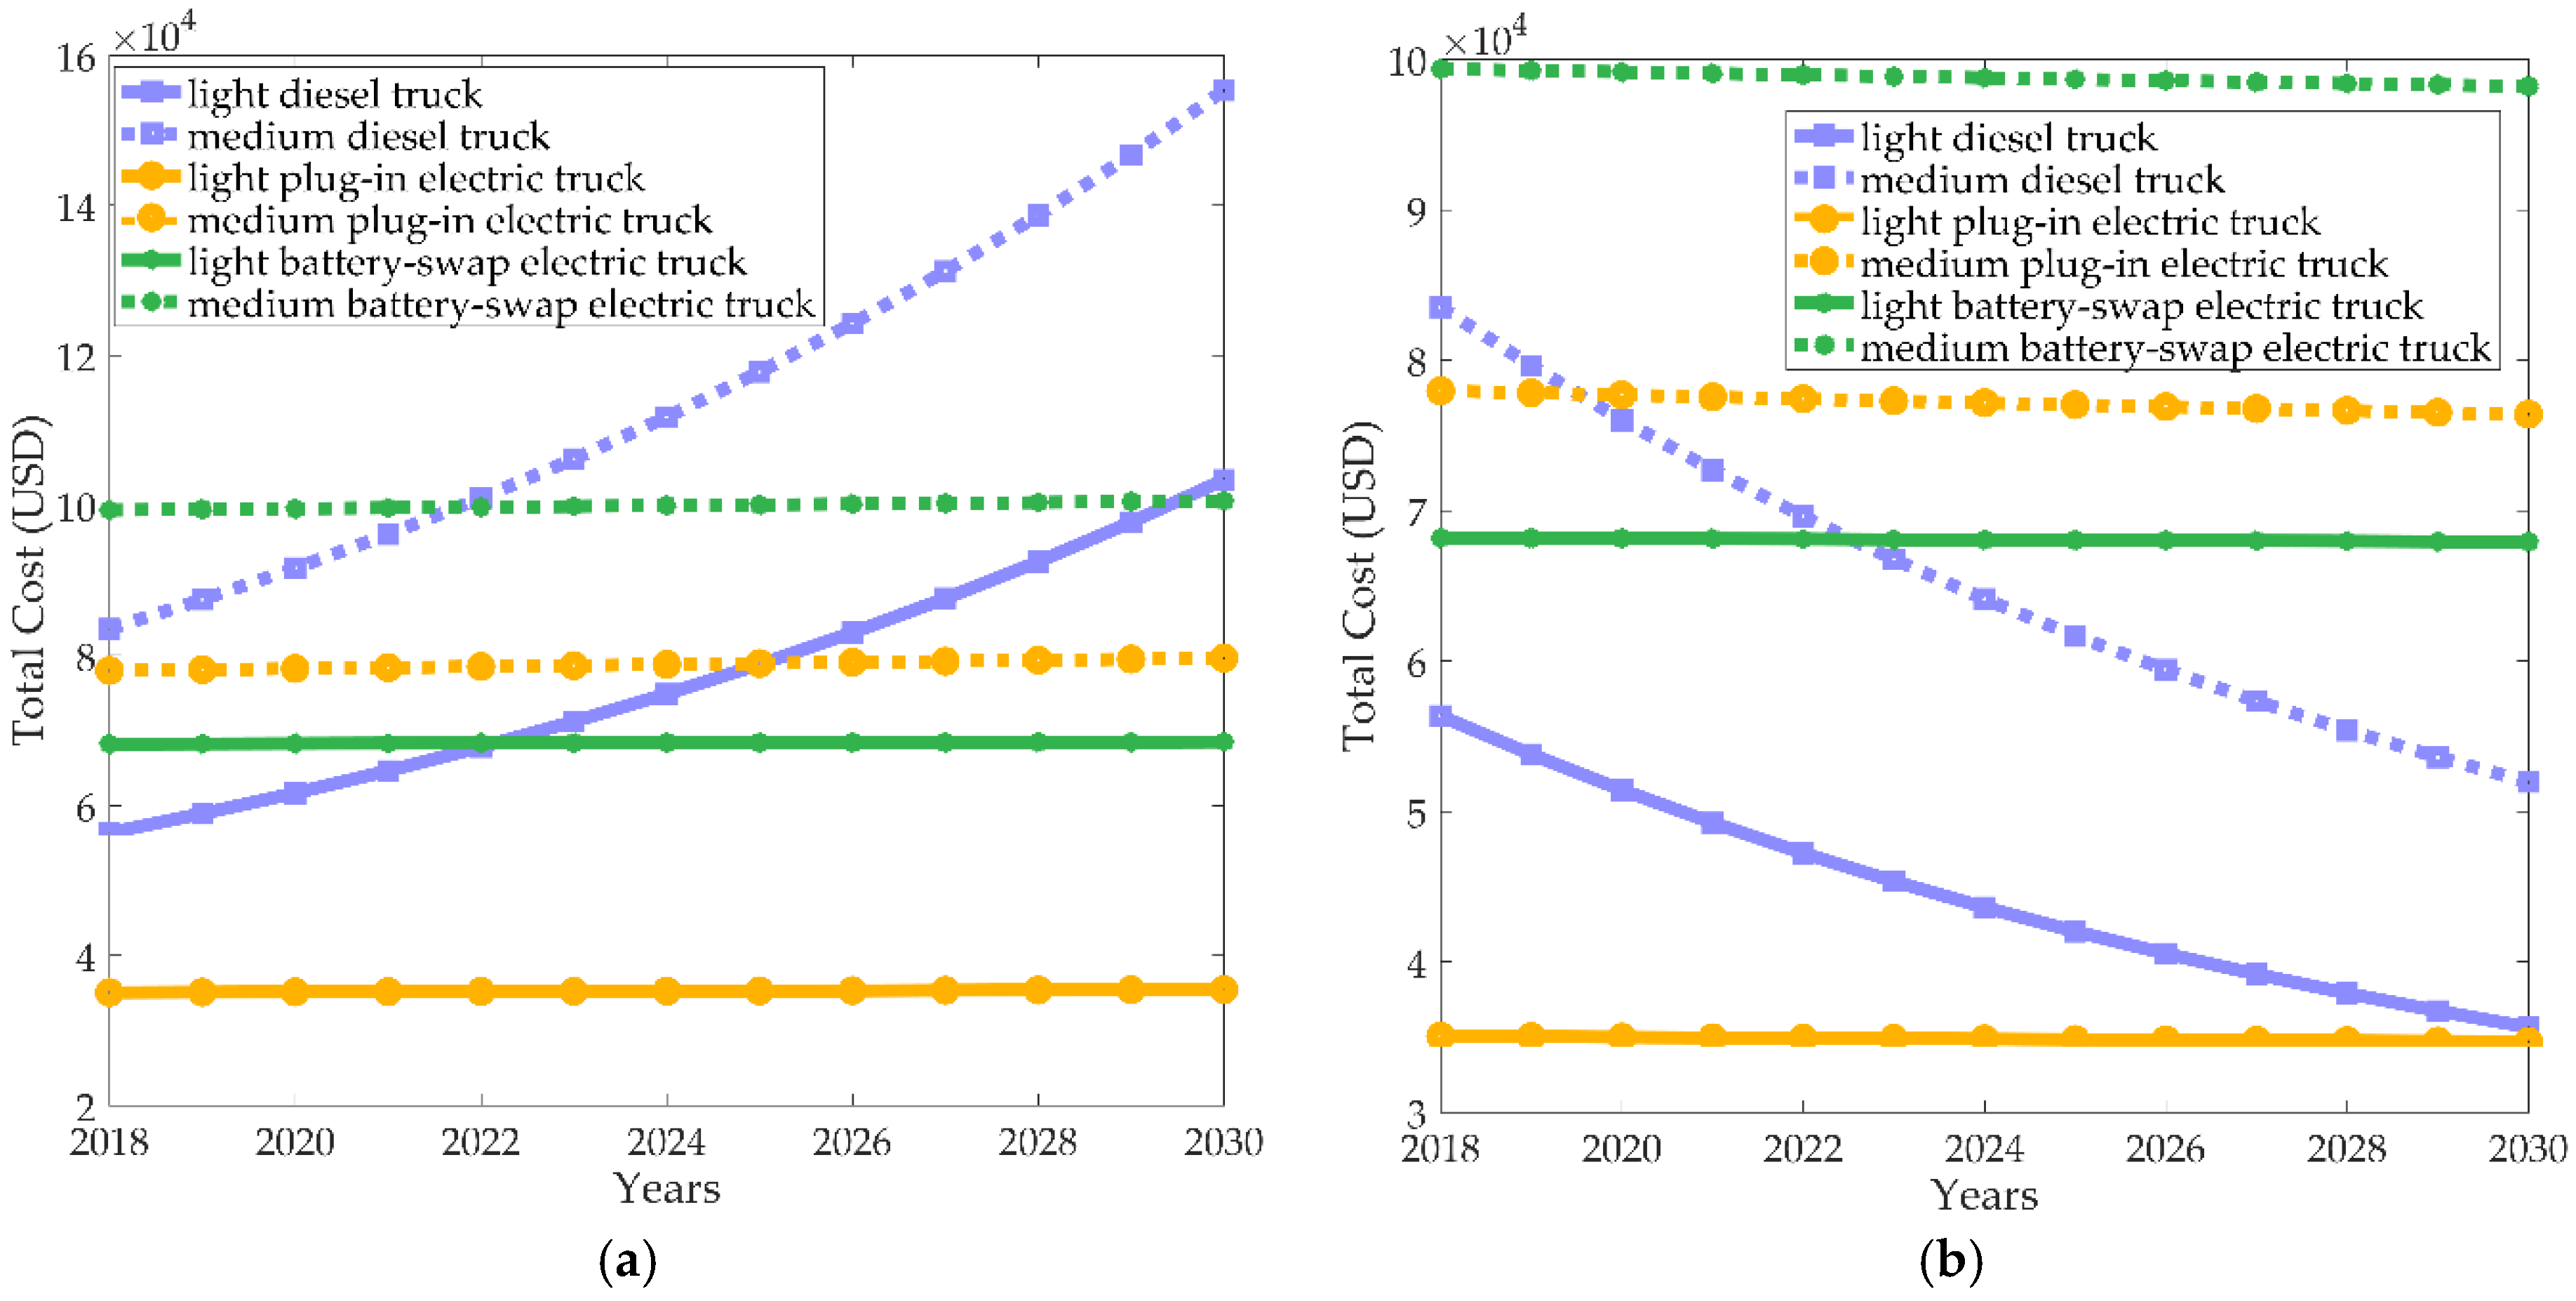
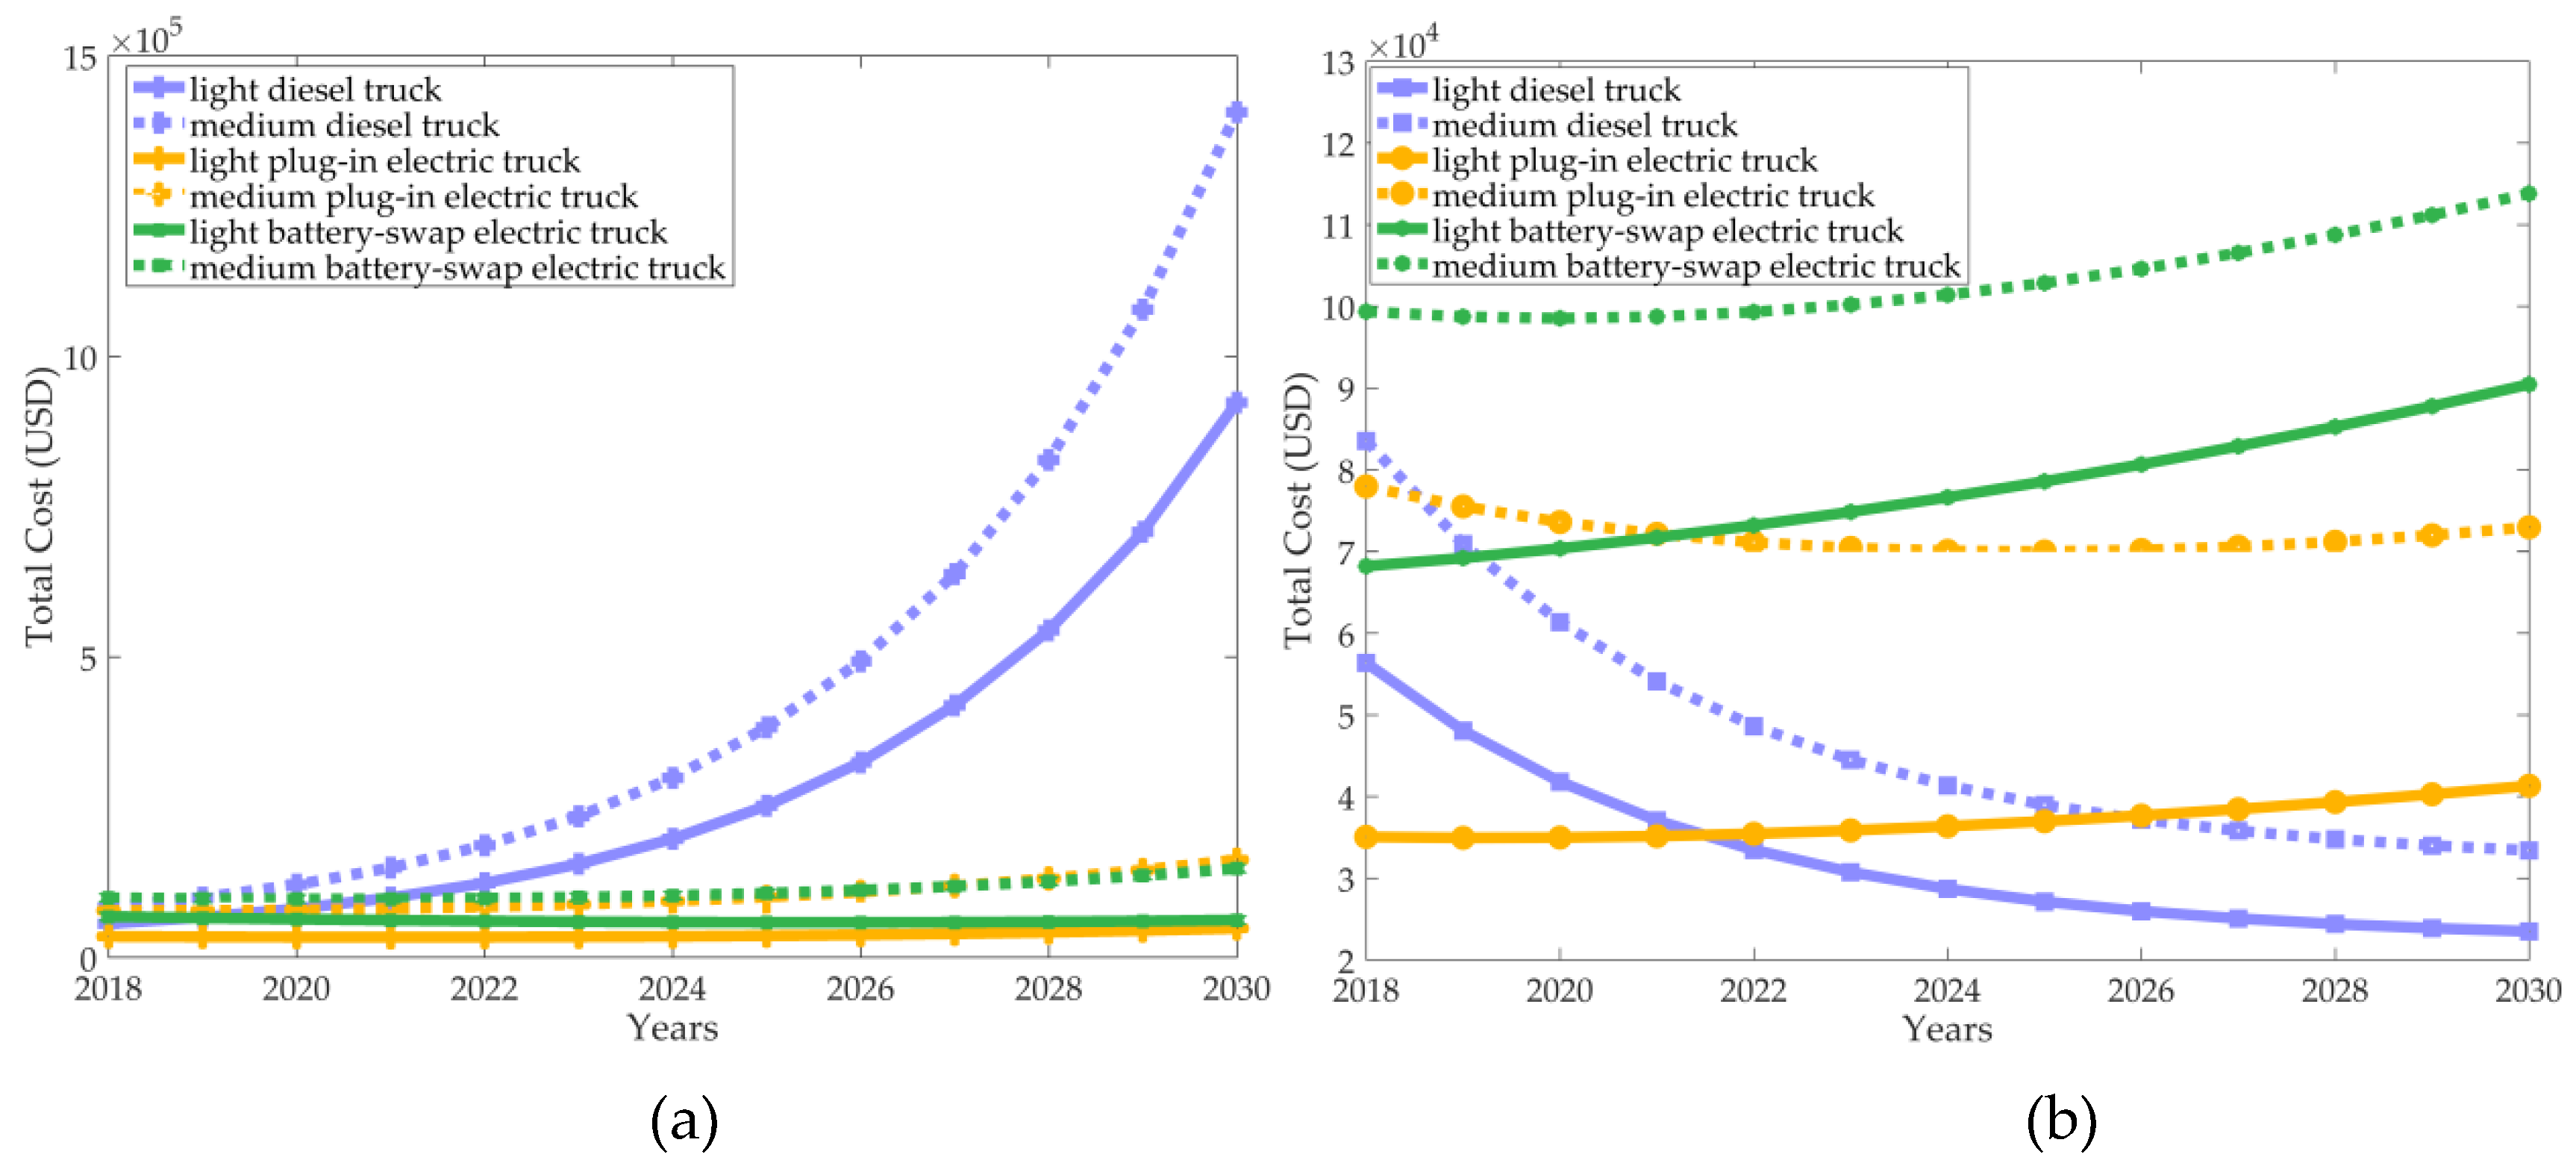
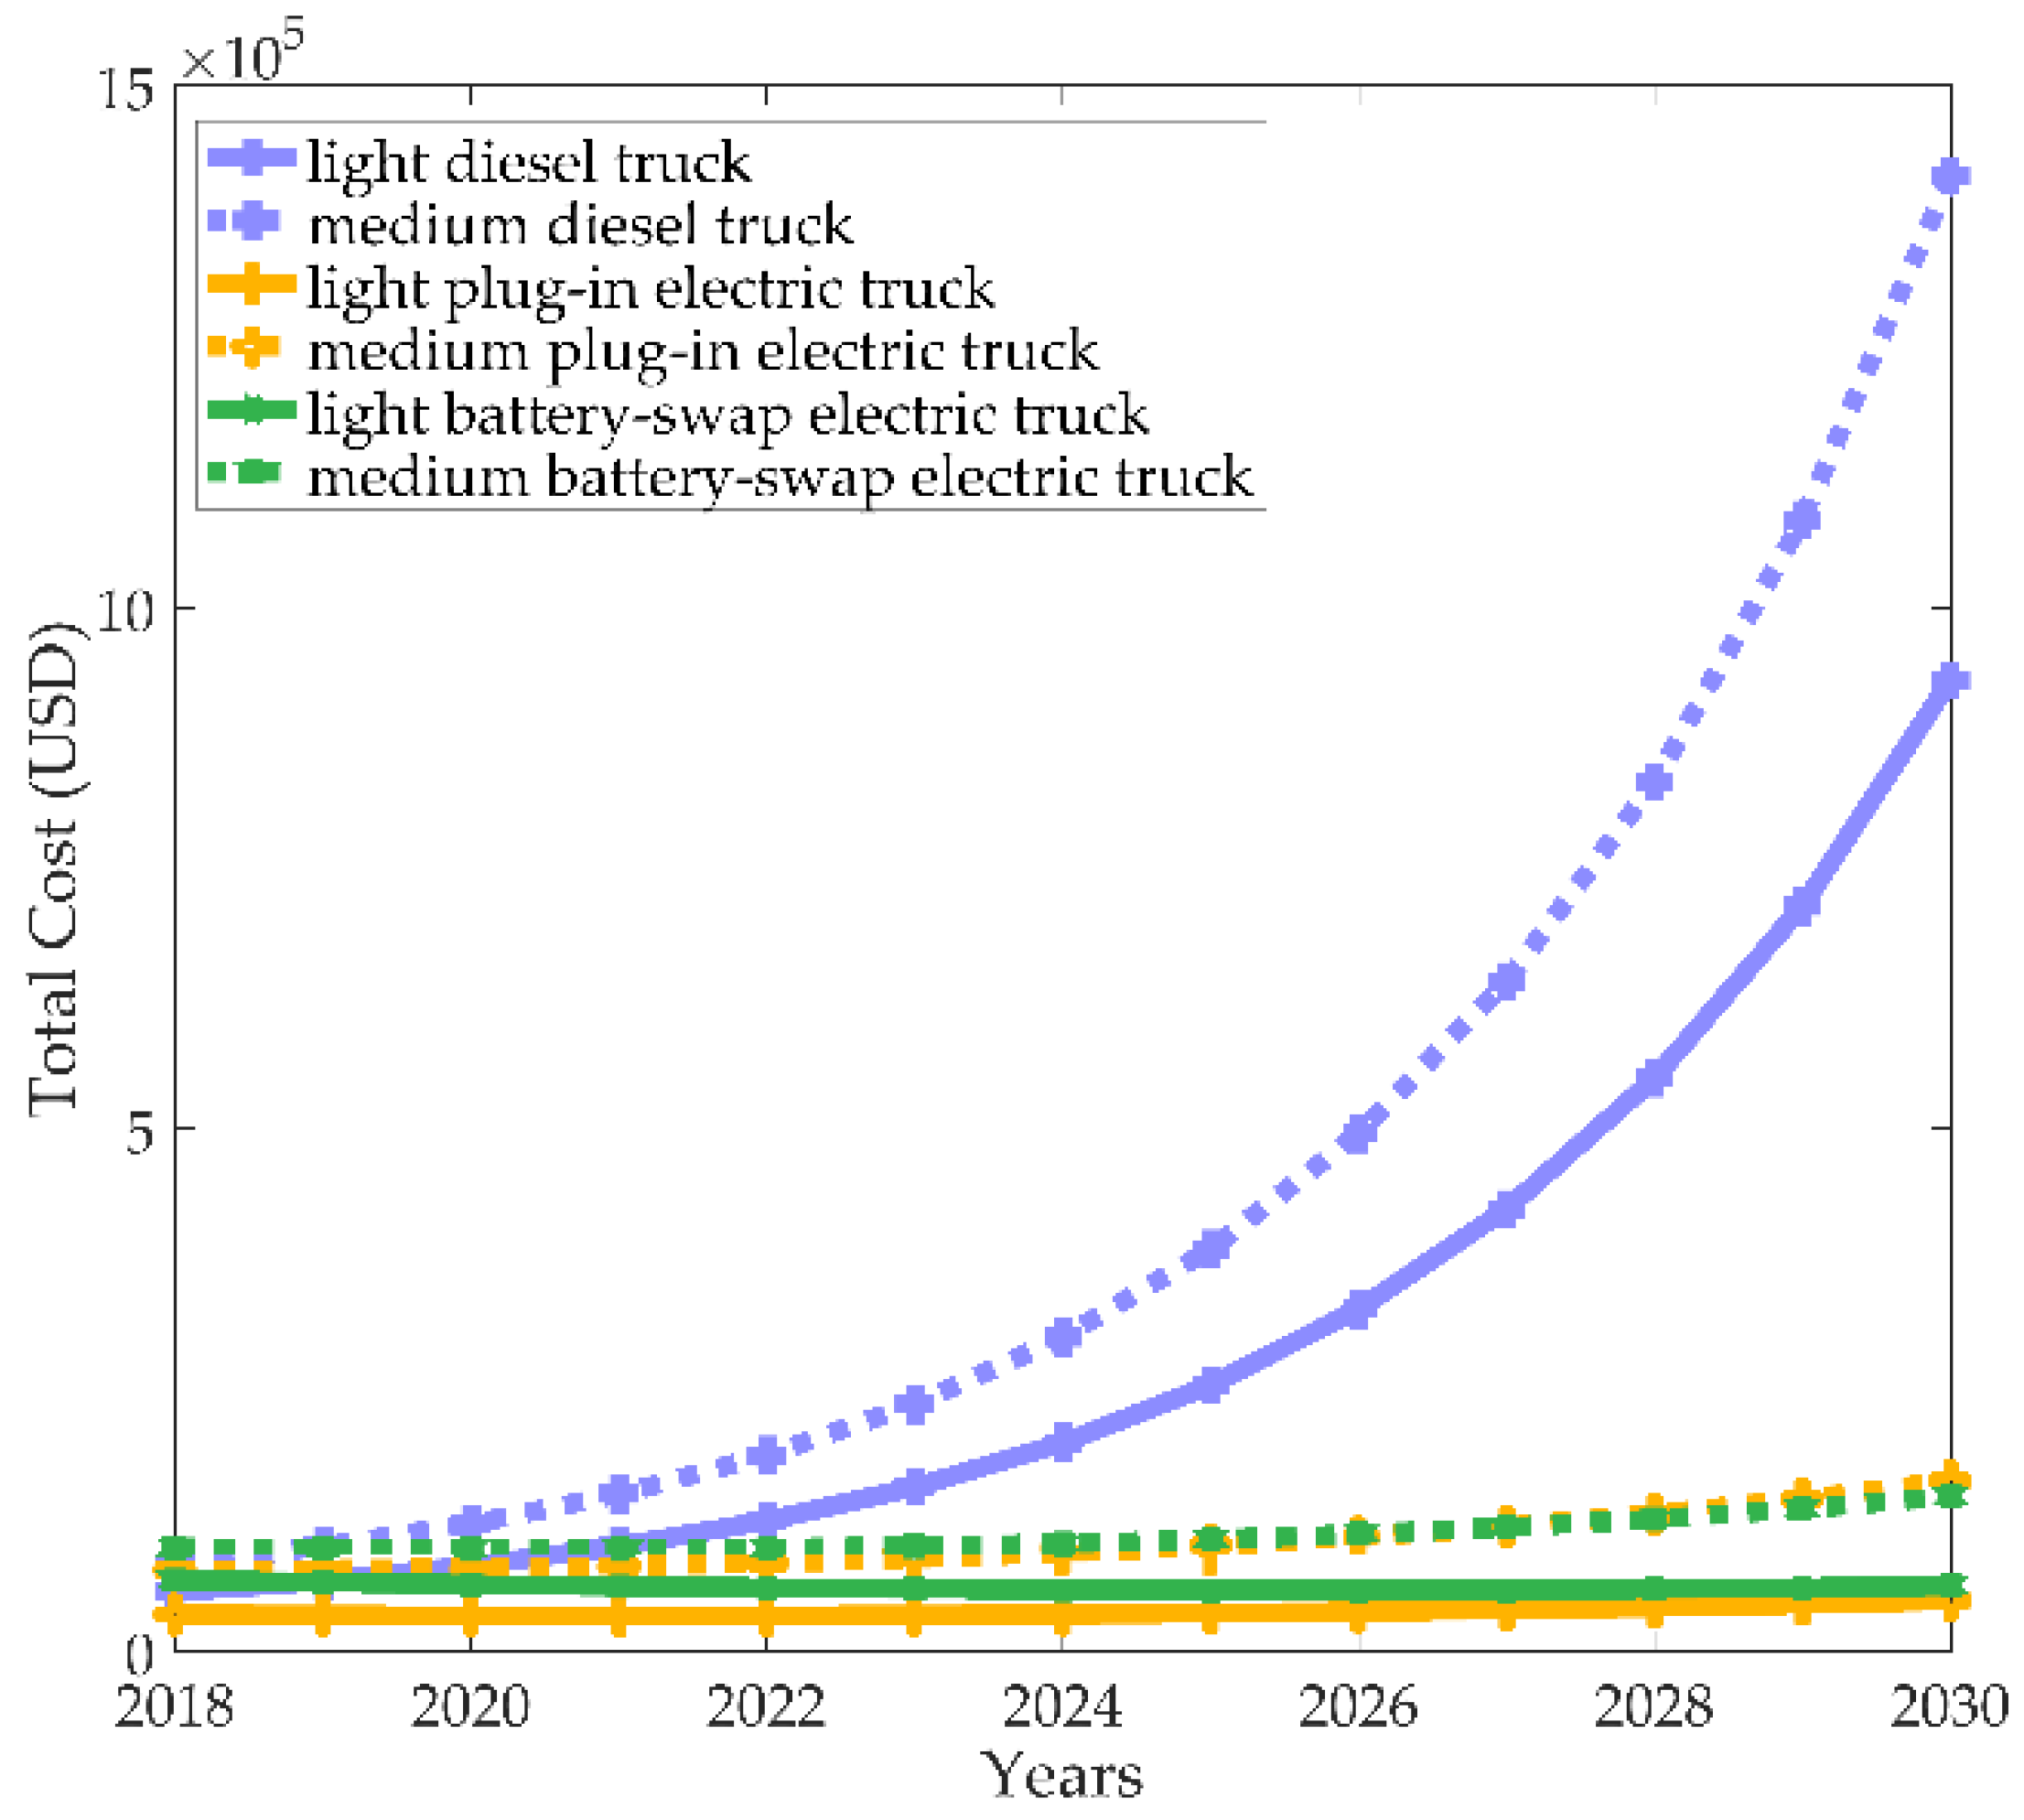
As for electricity and diesel prices aspects, according to historical data, before 2014, diesel price showed an increasing trend, but since 2014, it began to show a downward trend. It remains controversial whether the price of oil will rise or fall in the future. In recent years, electricity prices also fluctuated at a relatively small rate of change. The annual growth rate and the reduction rate of diesel price are about ±7.5%, while the fluctuation of electricity price is about ±0.66% per year in China. As such, the influence of diesel and electricity prices on TCO is discussed in both optimistic and pessimistic scenarios, as shown in Figure 9. In an optimistic scenario (see Figure 9a), this research assumes that both electricity and diesel prices increase. The total cost of all trucks shows upward trends, of which the rising trends of DTs are the most obvious. The total cost of DTs is higher than that of plug-in ETs in the same class. After 2022, the total cost of light-duty DTs will be the same as that of light-duty battery-swap ETs, and then becomes higher. As a result, when diesel and electricity prices increase, the cost of DTs will increase rapidly and eventually becomes higher than that of plug-in and battery-swap ETs in the same class. In a pessimistic scenario, this research assumes that both electricity and diesel prices decrease. Figure 9b shows that the total cost of light-duty DTs will continue to be higher than that of light-duty plug-in ETs, but the gap between them will gradually narrow. For medium-duty trucks, the total cost of DTs will be lower than that of plug-in ETs soon. Although the total cost of battery-swap ETs decreases, it is always higher than that of plug-in ETs and DTs in the same class.
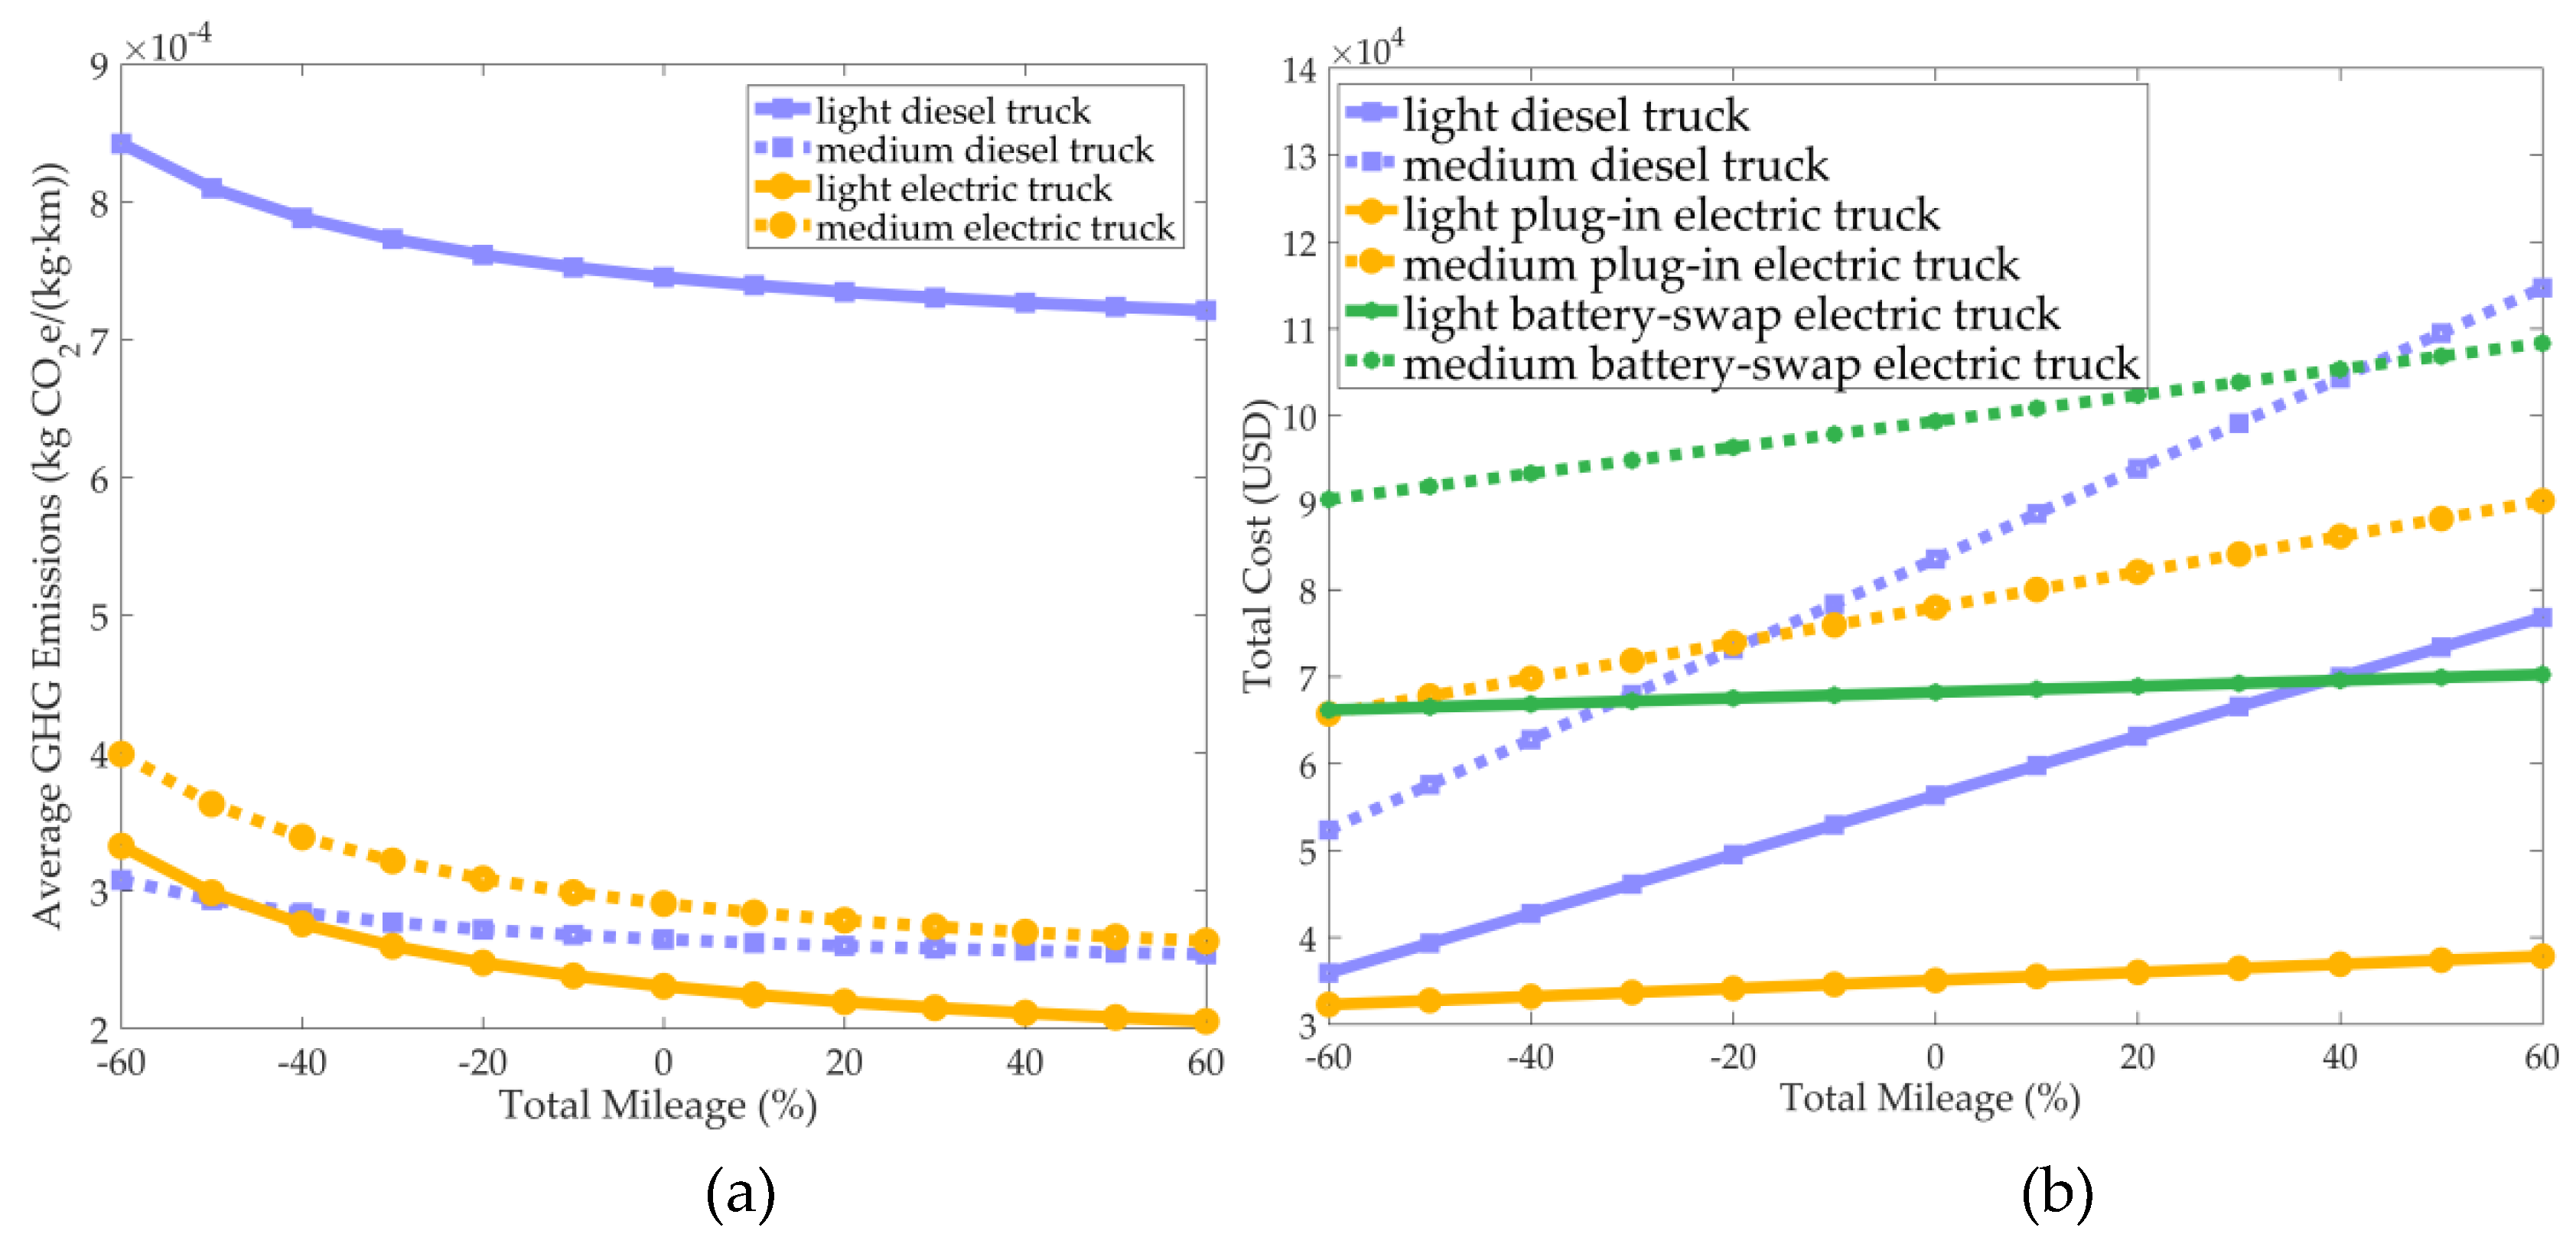
In addition, use frequency is also one of the factors affecting truck’s life cycle GHG emissions and TCO. The life cycle driving mileage of trucks can reasonably describe the frequency of use. Therefore, this study assumes that life cycle driving mileage changes within the range of ±60%. Figure 10a illustrates that the GHG emissions of trucks all decrease with the total mileage and those of ETs decrease faster than those of DTs, which means that when use frequency is higher, the effects of ETs on emission reduction will be improved significantly. Figure 10b also shows that the TCO of trucks increases with total mileage. Growth rates of DTs are greater than those of ETs, and those of medium-duty trucks rise faster than those of light-duty trucks. When the total mileage increases by more than 42.8%, the TCO of DTs will be higher than that of the other trucks in the same class. Therefore, the performances of ETs in GHG emission reduction and cost saving can be improved more obviously in situations with high use frequency.
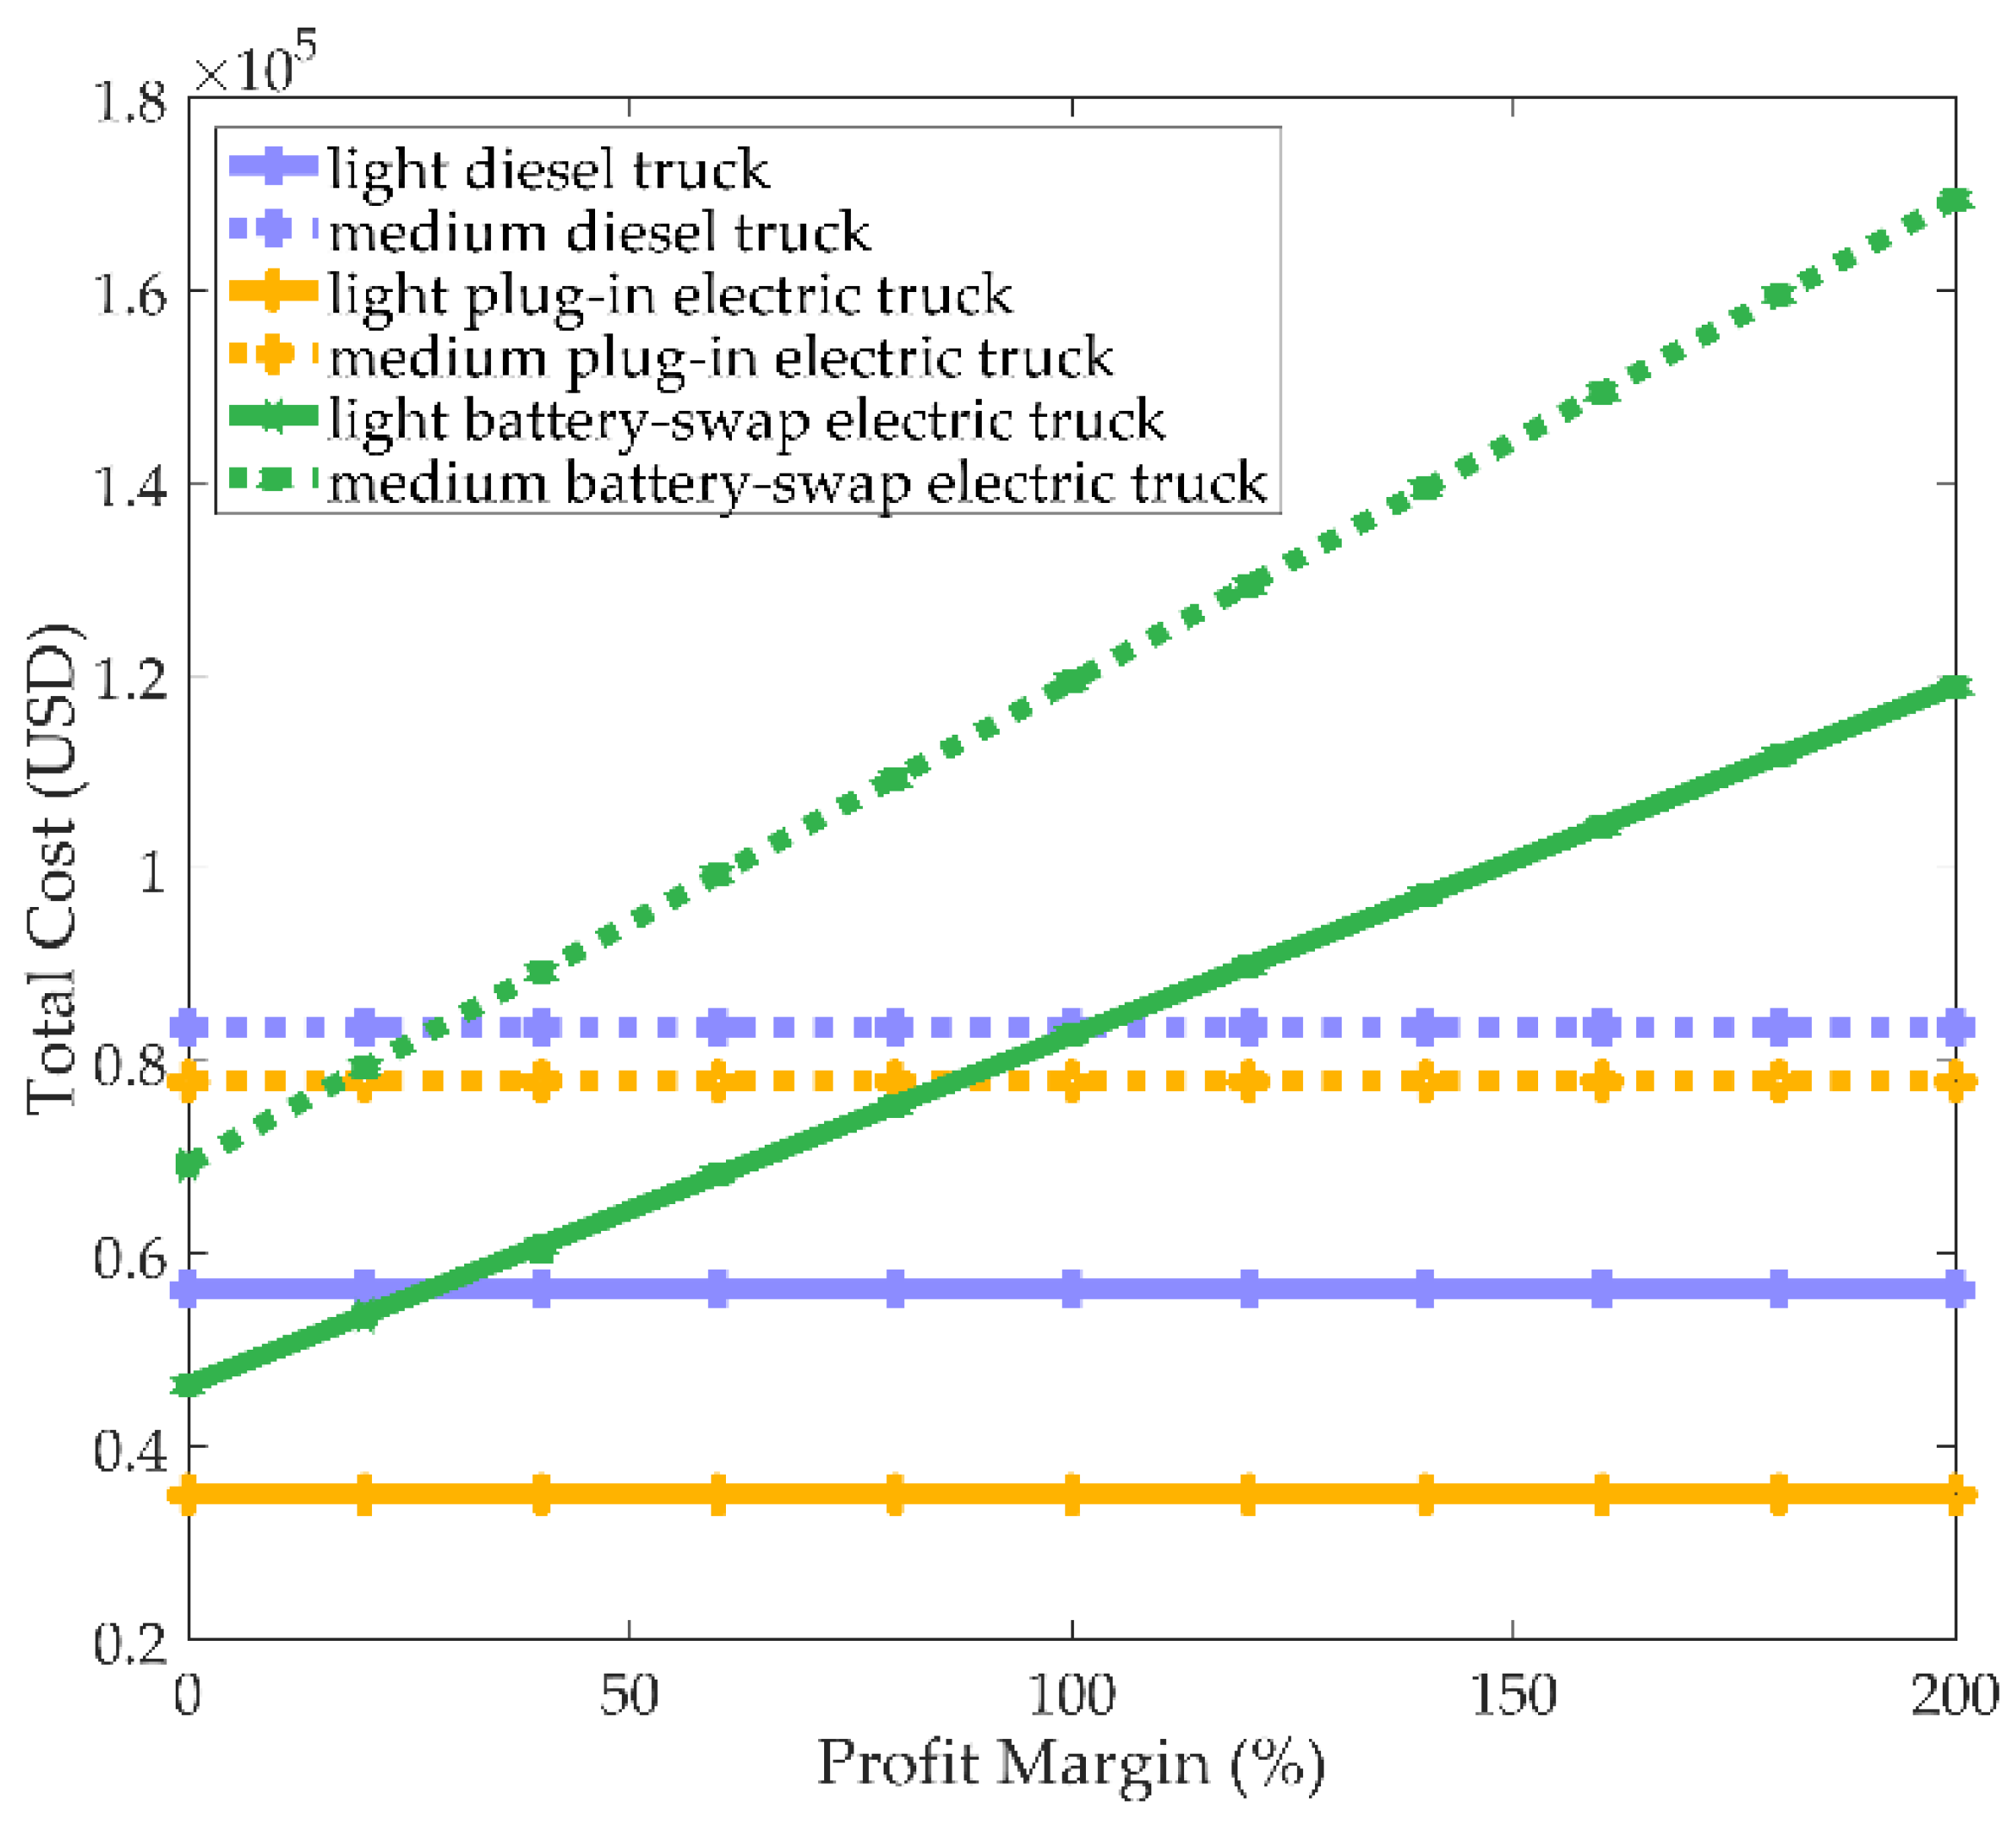
Finally, in this study, battery swapping and battery charging need to be completed by battery-lease companies or battery-swap stations. In the foregoing, the operation and the battery rental costs of battery-lease companies or battery-swap stations have been analyzed considering a 60% profit margin. However, in practice, this profit margin may be even higher, and it also can be lower if the fleet managers consider building their own battery-swap station. Thus, the impacts of profit margin on the total cost are analyzed, the results of which are shown in Figure 11. Sensitivity analysis results indicate that when profit margin increases, the TCO of battery-swap ETs increases rapidly (see Figure 11). In comparison, when the profit margin becomes lower, the TCO of medium-duty battery-swap ETs will be lower than those of DTs and ETs, and the TCO of light-duty battery-swap ETs will be lower than that of light-duty DTs. Considering the battery-swap station is assumed to service 120 vehicles per day, this means that if the number of trucks in a fleet is relatively large, the establishment of its own battery-swap station will be a better choice that can save costs and improve the operation efficiency compared with the option of leasing batteries from other companies, especially for medium-sized ETs.
4.2. Scenario Analysis
The effects of the single factor on average GHG emissions and total cost are discussed in Section 4.1. To accurately forecast the development of the six types of trucks, changes of the TCO and the GHG emissions under the consideration of multiple influence factors are analyzed. This study makes predictions on changes of some influence factors in the next few years and divides them into two scenarios: an optimistic scenario and a pessimistic scenario. In the optimistic scenario, prices of electricity and diesel increase by 0.66% and 7.5% every year, respectively, and the charging/swapping infrastructure cost increases by 10% every year. The annual growth rate of battery life is 10% and the fuel economy of DTs and ETs decrease by 10% and 5%, respectively. In addition, the driving mileage increases by 10% every year. The pessimistic scenario reflects the opposite conditions.
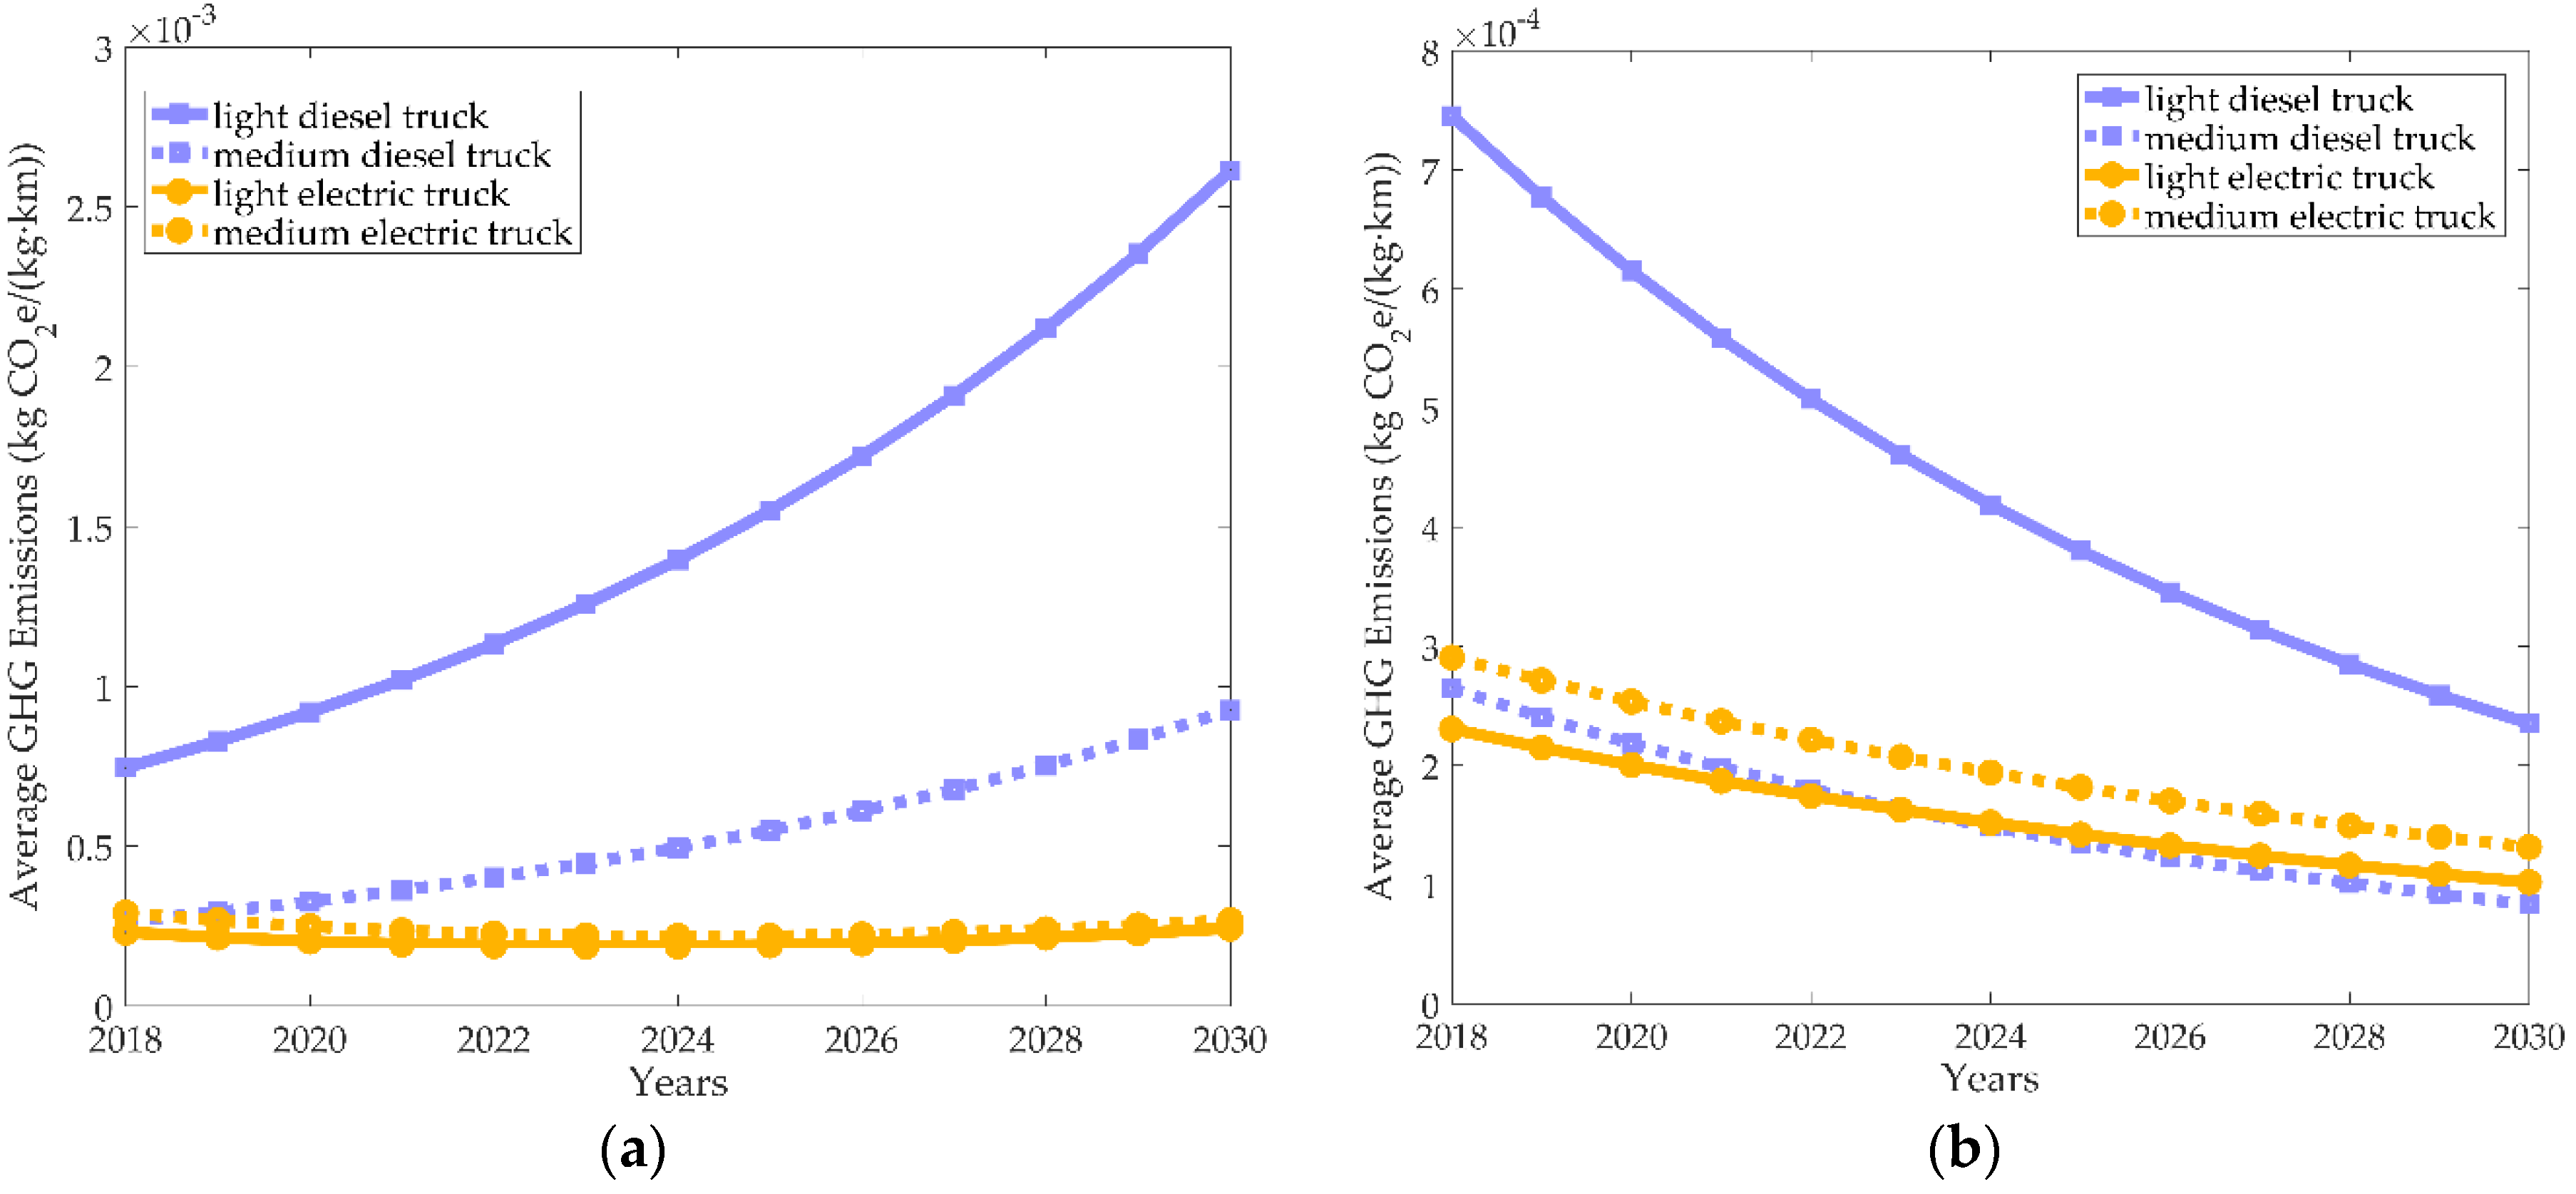
Figure 12a shows that, in an optimistic scenario, the GHG emissions of all the trucks increase, but the increase rates of light-duty and medium-duty ETs are small, while those of DTs are relatively large. In such conditions, the average GHG emissions of medium-duty DTs will gradually exceed those of ETs in the following years. Then, both light-duty and medium-duty ETs will outperform DTs in the same class in terms of emission reduction. Figure 12b shows that, in a pessimistic scenario, the GHG emissions of all the trucks decrease. The decline rates of light-duty and medium-duty ETs are both smaller, while those of DTs are greater. Moreover, the average GHG emissions of medium-duty DTs are gradually lower than those of light-duty ETs, making them tucks with the lowest the average GHG emissions. The reason may be that in the pessimistic scenario, the decreased use frequency causes the increases in the average GHG emissions of both DTs and ETs and the increased fuel economy leads to lower average GHG emissions from the use phase of DTs. However, the improvement of fuel economy has a more obvious effect on emission reduction of DTs, and reduction of use frequency has a more obvious effect on the increasing average GHG emissions of ETs, leading to a faster reduction rate of DTs than that of ETs. In addition, light-duty ETs have advantages in reducing GHG emissions than DTs in the same class, while medium-duty ETs perform worse than medium-duty DTs.
Figure 13a indicates that, in an optimistic scenario, the TCO of light-duty battery-swap ETs decreases, while that of other trucks increases, among which, DTs have the fastest increase rate and are ultimately higher than the other types of ETs in terms of the TCO. The main reason is that diesel price rises faster than electricity price and poor fuel economy leads to the rapid growth in the cost of DTs. At the same time, the declined infrastructure cost greatly reduces the TCO of battery-swap ETs. The reason why the TCO of light-duty battery-swap ETs decreases is that although the infrastructure cost decreases, the worse fuel economy and higher use frequency have greater impacts on improving the total cost of medium battery-swap ETs. Therefore, the TCO of light-duty battery-swap ETs decreases and that of medium-duty battery-swap ETs increases. In this situation, both plug-in ETs and battery-swap ETs are more economical than DTs. Meanwhile, Figure 13b illustrates that in a pessimistic scenario, the TCO of DTs decreases because of the decreased diesel price and driving mileage. However, the TCO of light-duty and medium-duty battery-swap ETs increases because the increased infrastructure and battery cost as well as the decreased battery life. Moreover, the TCO of light-duty plug-in ETs increases because of the same reason. Interestingly, the TCO of medium-duty plug-in ETs declines. The reason is that, although electricity price and infrastructure cost decrease, lower use frequency has greater impacts on reducing the cost of medium-duty plug-in ETs.
China is expected to constitute about half of the world’s GHG emissions between 2010 and 2040 [46]. As concerns about climate change intensify, more and more countries including China, Singapore, Canada, among others, are preparing their respective carbon tax policies. Singapore has even discussed the pricing of carbon tax, which is currently USD 1.441 to USD 2.882 per 1000 kg and is going to increase to USD 7.205 by 2022 [47]. As a result, taking carbon tax into consideration is necessary when predicting the TCO in an optimistic scenario. As the carbon tax of the transportation industry only considers the carbon emissions from the vehicle use phase, the implementation of the carbon tax will undoubtedly benefit the future development of ETs. This study assumes that carbon tax is USD 1.441/1000 kg CO2e, and the tax rate is increased by USD 1.441 annually. Figure 14 shows that carbon tax leads to an overall increase in the total cost of DTs, but because tax rate is relatively low, effects are not obvious. Therefore, the tax rate should be appropriately improved to achieve the desired results.
5. Conclusions
In recent years, the rapid growth of the number of commercial delivery trucks has increased GHG emissions and human dependence on oil. The use of ETs in urban distribution is considered to be an effective way to reduce emissions and save fossil energy. This paper presents comparisons and analysis of the respective average GHG emissions and the TCO of six types of trucks: DTs, plug-in ETs, and battery-swap ETs under light-duty and medium-duty. The GHG emissions and total cost are estimated according to a simplified LCA method and a TCO method. Then the corresponding effects of fuel efficiency, charging/swapping infrastructure and battery costs, diesel price, electricity price, coal-fired power generation proportion and profit margin on the TCO and the GHG emissions are also discussed. Finally, changes in the average GHG emissions and the TCO in optimistic and pessimistic scenarios are predicted. Numerical results of this paper show that the average GHG emissions of light-duty ETs are 69% lower than those of light-duty DTs, while those of medium-duty ETs are 9.8% higher than those of medium-duty DTs. Furthermore, the TCO of light-duty plug-in ETs is 37.8% lower and that of light-duty battery-swap ETs is 21% higher than that of light-duty DTs. For medium-duty trucks, the TCO of plug-in and battery-swap ETs are 6.7% lower and 18.9% higher than that of DTs.
Based on the sensitivity analysis and scenarios analysis, it can be concluded that the average GHG emissions increase with coal-fired power generation rate and decrease with fuel economy and use frequency. Moreover, the TCO increases with diesel/electricity price, infrastructure cost, battery cost, use frequency, as well as profit margin and decreases with battery life and fuel economy. Among these influence factors, fuel economy has a greater impact on performance of DTs, and use frequency is more relevant to the GHG emissions of ETs and the TCO of medium-duty trucks.
The main conclusions obtained this paper are summarized as follows: first, for light-duty trucks, plug-in ETs perform better in reducing the GHG emissions and the TCO than DTs, while for medium-duty trucks, the former have lower cost but higher average GHG emissions than the latter. Battery-swap ETs currently have no advantage in cost saving. In addition, under the condition of high use frequency and congested working environment, ETs are more likely to have lower GHG emissions and the TCO. Finally, the carbon tax rate should be set relatively high to generate the desired effect.
The limitation of this paper is that it does not consider the impact of charging time on the TCO, because charging time may reduce the TCO by leading to lower customer satisfaction and opportunity cost. Thus, further research can consider the charging time. Additionally, a regional analysis can also be conducted in the future, since energy generation sources would vary significantly from region to region.
Author Contributions
Formal analysis, L.Y. and C.H.; Funding acquisition, L.Y.; Supervision, L.Y.; Writing and revising draft, C.H. and Y.C.
Funding
This research was funded by the National Natural Science Foundation of China (grant number 71572058) and the Fundamental Research Funds for the Central Universities (grant number 2018JDXM05). And the APC was funded by the Fundamental Research Funds for the Central Universities.
Conflicts of Interest
The authors declare no conflict of interest.
References
- Vliet, O.V.; Brouwer, A.S.; Kuramochi, T.; Broek, M.V.D.; Faaij, A. Energy use, cost and CO2 emissions of electric cars. J. Power Sources 2011, 196, 2298–2310. [Google Scholar] [CrossRef]
- Marland, G.; Boden, T.A.; Andres, R.J.; Brenkert, A.L.; Johnston, C. Global, regional, and national fossil fuel CO2 emissions. In Trends: A Compendium of Data on Global Change; Carbon Dioxide Information Analysis Center: Oak Ridge, TN, USA, 2003; pp. 34–43. [Google Scholar] [CrossRef]
- Demir, E.; Huang, Y.; Scholts, S.; van Woensel, T. A selected review on the negative externalities of the freight transportation: Modeling and pricing. Transp. Res. Pt. e-Logist. Transp. Rev. 2015, 77, 95–114. [Google Scholar] [CrossRef]
- Chamon, M.; Mauro, P.; Okawa, Y. Mass car ownership in the emerging market giants. Econ. Policy 2008, 23, 244–296. [Google Scholar] [CrossRef]
- Yang, L.; Zhang, Q.; Ji, J. Pricing and carbon emission reduction decisions in supply chains with vertical and horizontal cooperation. Int. J. Prod. Econ. 2017, 191, 286–297. [Google Scholar] [CrossRef]
- Yang, L.; Ji, J.; Wang, M.; Wang, Z. The manufacturer’s joint decisions of channel selections and carbon emission reductions under the cap-and-trade regulation. J. Clean. Prod. 2018, 193, 506–523. [Google Scholar] [CrossRef]
- Almeida, P.D.; Silva, P.D. The peak of oil production—Timings and market recognition. Energy Policy 2009, 37, 1267–1276. [Google Scholar] [CrossRef]
- Van, M.J.; Maggetto, G. Fuel Cell or Battery: Electric Cars are the Future. Fuel Cells 2010, 7, 165–173. [Google Scholar] [CrossRef]
- The State Council of China. Guidance of on Accelerating the Construction of Electric Vehicle Charging Infrastructure. Available online: http://www.gov.cn/zhengce/content/2015-10/09/content_10214.htm (accessed on 25 July 2017).
- Lee, D.Y.; Thomas, V.M.; Brown, M.A. Electric urban delivery trucks: Energy use, greenhouse gas emissions, and cost-effectiveness. Environ. Sci. Technol. 2013, 47, 8022–8030. [Google Scholar] [CrossRef]
- Hellgren, J. Life cycle cost analysis of a car, a city bus and an intercity bus powertrain for year 2005 and 2020. Energy Policy 2007, 35, 39–49. [Google Scholar] [CrossRef]
- Liu, H.; He, K.; Wang, Q.; Huo, H.; Lents, J. Comparison of vehicle activity and emission inventory between Beijing and Shanghai. J. Air Waste Manag. Assoc. 2007, 57, 1172–1177. [Google Scholar] [CrossRef]
- Çabukoglu, E.; Georges, G.; Küng, L.; Pareschi, G.; Boulouchos, K. Battery electric propulsion: An option for heavy-duty vehicles? Results from a Swiss case-study. Transp. Res. Pt. C-Emerg. Technol. 2018, 88, 107–123. [Google Scholar] [CrossRef]
- China Daily. What Is the Future of the Electric taxi? It Takes Only 3 min to Replace the Battery. Available online: http://cnews.chinadaily.com.cn/2017-03/28/content_28703420.htm (accessed on 28 March 2017).
- Lam, A.Y.S.; Leung, Y.W.; Chu, X. Electric vehicle charging station placement: Formulation, complexity, and solutions. IEEE Trans. Smart Grid 2014, 5, 2846–2856. [Google Scholar] [CrossRef]
- Yang, J.; Sun, H. Battery swap station location-routing problem with capacitated electric vehicles. Comput. Oper. Res. 2015, 55, 217–232. [Google Scholar] [CrossRef]
- Zheng, Y.; Dong, Z.Y.; Xu, Y.; Meng, K.; Zhao, J.H.; Qiu, J. Electric vehicle battery charging/swap stations in distribution systems: Comparison study and optimal planning. IEEE Trans. Power Syst. 2014, 29, 221–229. [Google Scholar] [CrossRef]
- Zhou, F.Q.; Lian, Z.W.; Wang, X.L.; Yang, X.H.; Xu, Y.S. Discussion on operation mode to the electric vehicle charging station. Power Syst. Prot. Control 2010, 38, 63–67. (In Chinese) [Google Scholar] [CrossRef]
- Doucette, R.T.; McCulloch, M.D. Modeling the prospects of plug-in hybrid electric vehicles to reduce CO2 emissions. Appl. Energy 2011, 88, 2315–2323. [Google Scholar] [CrossRef]
- Campanari, S.; Manzolini, G.; DelaIglesia, F.G. Energy analysis of electric vehicles using batteries or fuel cells through well-to-wheel driving cycle simulations. J. Power Sources 2009, 186, 464–477. [Google Scholar] [CrossRef]
- Noel, L.; de Rubens, G.Z.; Kester, J.; Sovacool, B.K. Beyond emissions and economics: Rethinking the co-benefits of electric vehicles (EVs) and vehicle-to-grid (V2G). Transp. Policy 2018, 71, 130–137. [Google Scholar] [CrossRef]
- Lidiane, L.P.S.; Electo, E.S.L.; Carlos, E.P.; Mateus, H.R.; Maria, L.G.R.; Osvaldo, J.V. Comparative environmental life cycle assessment of conventional vehicles with different fuel options, plug-in hybrid and electric vehicles for a sustainable transportation system in Brazil. J. Clean. Prod. 2018, 264, 444–468. [Google Scholar] [CrossRef]
- Sen, B.; Ercan, T.; Tatari, O. Does a battery-electric truck make a difference? Life cycle emissions, costs, and externality analysis of alternative fuel-powered class 8 heavy-duty trucks in the United States. J. Clean. Prod. 2017, 141, 110–121. [Google Scholar] [CrossRef]
- Fernández, R.Á. A more realistic approach to electric vehicle contribution to greenhouse gas emissions in the city. J. Clean. Prod. 2018, 172, 949–959. [Google Scholar] [CrossRef]
- Zhao, Y.; Onat, N.C.; Kucukvar, M.; Tatari, O. Carbon and energy footprints of electric delivery trucks: A hybrid multi-regional input-output life cycle assessment. Transp. Res. Part D-Transp. Environ. 2016, 47, 195–207. [Google Scholar] [CrossRef]
- Doucette, R.T.; McCulloch, M.D. Modeling the CO2 emission from battery electric vehicles given the power generation mixes of different countries. Energy Policy 2011, 39, 803–811. [Google Scholar] [CrossRef]
- Huang, S.J.; Ren, Y.L. Indirect carbon emission measurement of electric vehicle in China. Appl. Mech. Mater. 2013, 470, 772–776. [Google Scholar] [CrossRef]
- Davis, B.A.; Figliozzi, M.A. A methodology to evaluate the competitiveness of electric delivery trucks. Transp. Res. Pt. e-Logist, Transp. Rev. 2013, 49, 8–23. [Google Scholar] [CrossRef]
- Zhang, W.; Wu, B.; Li, W.; Lai, X.K. Discussion on development trend of battery electric vehicles in China and its energy supply mode. Power Syst. Technol. 2009, 33, 1–5. (In Chinese) [Google Scholar] [CrossRef]
- Thiel, C.; Perujo, A.; Mercier, A. Cost and CO2 aspects of future vehicle options in Europe under new energy policy scenarios. Energy Policy 2010, 38, 7142–7151. [Google Scholar] [CrossRef]
- Yu, J.; Yang, P.; Zhang, K.; Miao, L. Evaluating the effect of policies and the development of charging infrastructure on electric vehicle diffusion in China. Sustainability 2018, 10, 3394. [Google Scholar] [CrossRef]
- Lajunen, A. Lifecycle costs and charging requirements of electric buses with different charging methods. J. Clean. Prod. 2018, 172, 56–67. [Google Scholar] [CrossRef]
- Teoh, T.; Kunze, O.; Teo, C.C.; Wong, Y. Decarbonisation of urban freight transport using electric vehicles and opportunity charging. Sustainability 2018, 10, 3258. [Google Scholar] [CrossRef]
- Feng, W.; Figliozzi, M.A. An economic and technological analysis of the key factors affecting the competitiveness of electric commercial vehicles: A case study from the USA market. Transp. Res. Pt. C-Emerg. Technol. 2013, 26, 135–145. [Google Scholar] [CrossRef]
- Gu, X.Y.; Ieromonachou, P.; Zhou, L.; Tseng, M.L. Developing pricing strategy to optimize total profits in an electric vehicle battery closed loop supply chain. J. Clean. Prod. 2018, 203, 376–385. [Google Scholar] [CrossRef]
- Lebeau, P. Electrifying light commercial vehicles for city logistics? A total cost of ownership analysis. Eur. J. Transport. Infrastruct. Res. 2015, 15, 551–569. [Google Scholar]
- Miotti, M.; Hofer, J.; Bauer, C. Integrated environmental and economic assessment of current and future fuel cell vehicles. Int. J. Life Cycle Assess. 2017, 22, 94–110. [Google Scholar] [CrossRef]
- Commercial Vehicle Interactive Service Platform. Available online: http://www.360che.com/#pvareaid=1010101 (accessed on 12 February 2017).
- Gao, Y.S.; Li, X.H. Life cycle analysis of diesel fuel for large passenger cars. J. Beihang Univ. 2009, 35, 1349–1352. (In Chinese) [Google Scholar] [CrossRef]
- Sullivan, J.L.; Gaines, L. Status of life cycle inventories for batteries. Energy Convers. Manag. 2012, 58, 134–148. [Google Scholar] [CrossRef]
- National Power Industry Statistics. From National Energy Administration. Available online: http://news.bjx.com.cn/html/20170815/843358.shtml (accessed on 23 August 2017).
- Offer, G.J.; Howey, D.; Contestabile, M.; Clague, R.; Brandon, N.P. Comparative analysis of battery electric, hydrogen fuel cell and hybrid vehicles in a future sustainable road transport system. Energy Policy 2010, 38, 24–29. [Google Scholar] [CrossRef] [Green Version]
- Fleet Electrification Roadmap: Revolutionizing Transportation and Achieving Energy Security. Electrification Coalition, 2010. Available online: https://www.electrificationcoalition.org/fleet-electrification-roadmap-revolutionizing-transportation-and-achieving-energy-security/ (accessed on 29 November 2018).
- Vliet, O.V.; Kruithof, T.; Turkenburg, W.C.; Faaij, A.P.C. Techno-economic comparison of series hybrid, plug-in hybrid, fuel cell and regular cars. J. Power Sources 2010, 195, 6570–6585. [Google Scholar] [CrossRef]
- Sun, B.X.; He, T.T.; Niu, J.L.; Zhang, W.G.; Jiang, J.C.; Tony, Y. Evaluation and prediction of operation cost of pure electric vehicles based on power exchange and battery rental mode. Trans. China Electrotech. Soc. 2014, 29, 316–322. (In Chinese) [Google Scholar] [CrossRef]
- Presley, K.; Wesseh, J.; Lin, B.Q. Optimal carbon taxes for China and implications for power generation, welfare, and the environment. Energy Policy 2018, 118, 1–8. [Google Scholar] [CrossRef]
- China’s Carbon Emissions Trading Platform. Available online: http://www.tanpaifang.com/tanshui/2017/0313/58737.html (accessed on 12 February 2017).
Figure 1.
General sketch of the comparative relationship among light-duty and medium-duty diesel trucks, plug-in electric trucks, and battery-swap electric trucks from greenhouse gas emissions and total cost of ownership perspectives.
Figure 1.
General sketch of the comparative relationship among light-duty and medium-duty diesel trucks, plug-in electric trucks, and battery-swap electric trucks from greenhouse gas emissions and total cost of ownership perspectives.

Figure 2.
Division of the boundary of diesel truck’s life cycle and greenhouse gas emissions or savings from each stage.
Figure 2.
Division of the boundary of diesel truck’s life cycle and greenhouse gas emissions or savings from each stage.

Figure 3.
Boundary division of total cost of ownership of diesel trucks, plug-in electric trucks, and battery-swap electric trucks.
Figure 3.
Boundary division of total cost of ownership of diesel trucks, plug-in electric trucks, and battery-swap electric trucks.

Figure 4.
Average greenhouse gas emissions of light-duty and medium-duty diesel trucks and electric trucks.
Figure 4.
Average greenhouse gas emissions of light-duty and medium-duty diesel trucks and electric trucks.

Figure 5.
Total cost of ownership of light-duty and medium-duty diesel trucks, plug-in electric trucks, and battery-swap electric trucks.
Figure 5.
Total cost of ownership of light-duty and medium-duty diesel trucks, plug-in electric trucks, and battery-swap electric trucks.

Figure 6.
Average greenhouse gas emissions (a), and total cost of ownership (b) sensitivity of light-duty and medium-duty diesel trucks and electric trucks on fuel economy.
Figure 6.
Average greenhouse gas emissions (a), and total cost of ownership (b) sensitivity of light-duty and medium-duty diesel trucks and electric trucks on fuel economy.

Figure 7.
Total cost of ownership sensitivity of light-duty and medium-duty diesel trucks and electric trucks on battery and charging/swapping infrastructure cost.
Figure 7.
Total cost of ownership sensitivity of light-duty and medium-duty diesel trucks and electric trucks on battery and charging/swapping infrastructure cost.

Figure 8.
Average greenhouse gas emissions sensitivity of light-duty and medium-duty diesel trucks and electric trucks on coal-fired power generation rate.
Figure 8.
Average greenhouse gas emissions sensitivity of light-duty and medium-duty diesel trucks and electric trucks on coal-fired power generation rate.

Figure 9.
Total cost of ownership sensitivity of light-duty and medium-duty diesel trucks and electric trucks on diesel/electricity price: in an optimistic scenario (a), and in a pessimistic scenario (b).
Figure 9.
Total cost of ownership sensitivity of light-duty and medium-duty diesel trucks and electric trucks on diesel/electricity price: in an optimistic scenario (a), and in a pessimistic scenario (b).

Figure 10.
Average greenhouse gas emissions (a), and total cost of ownership (b) sensitivity of light-duty and medium-duty diesel trucks and electric trucks on total mileage.
Figure 10.
Average greenhouse gas emissions (a), and total cost of ownership (b) sensitivity of light-duty and medium-duty diesel trucks and electric trucks on total mileage.

Figure 11.
Total cost of ownership sensitivity of light-duty and medium-duty diesel trucks and electric trucks on profit margin.
Figure 11.
Total cost of ownership sensitivity of light-duty and medium-duty diesel trucks and electric trucks on profit margin.

Figure 12.
Predicted average greenhouse gas emissions of light-duty and medium-duty diesel trucks and electric trucks: in an optimistic scenario (a), and in a pessimistic scenario (b).
Figure 12.
Predicted average greenhouse gas emissions of light-duty and medium-duty diesel trucks and electric trucks: in an optimistic scenario (a), and in a pessimistic scenario (b).

Figure 13.
Predicted total cost of ownership of light-duty and medium-duty diesel trucks and electric trucks: in an optimistic scenario (a), and in a pessimistic scenario (b).
Figure 13.
Predicted total cost of ownership of light-duty and medium-duty diesel trucks and electric trucks: in an optimistic scenario (a), and in a pessimistic scenario (b).

Figure 14.
Total cost of ownership sensitivity of light-duty and medium-duty diesel trucks and electric trucks on carbon tax in an optimistic scenario.
Figure 14.
Total cost of ownership sensitivity of light-duty and medium-duty diesel trucks and electric trucks on carbon tax in an optimistic scenario.


Table 1.
Baseline characteristics of electric trucks and diesel trucks. Data was collected from commercial vehicle interactive service platform of China [38].
Table 1.
Baseline characteristics of electric trucks and diesel trucks. Data was collected from commercial vehicle interactive service platform of China [38].
| Jiang Huai | Isuzu | Kaima | Dongfeng Captain | Battery-Swap ET | Battery-Swap ET | |
|---|---|---|---|---|---|---|
| Power | diesel | diesel | electricity | electricity | electricity | electricity |
| Class | Light | Medium | Light | Medium | Light | Medium |
| Price (USD) | 11,239.8 | 21,009.8 | 9193.6 | 28,243.6 | 4596.8 | 14,121.8 |
| Gross vehicle weight (kg) | 2615 | 6875 | 2450 | 7320 | 2450 | 7320 |
| Curb weight (kg) | 1740 | 3400 | 1525 | 4520 | 1525 | 4520 |
| Payload (kg) | 745 | 3280 | 795 | 2605 | 795 | 2605 |
| Battery capacity (kWh) | _ | _ | 18.5 | 99.8 | 18.5 | 99.8 |
| Charging time (h) | _ | _ | 3–5 | 5–6 | 0.08–0.25 | 0.08–0.25 |
| Maximum power (kW) | _ | 96 | 20 | 100 | 20 | 100 |
Table 2.
Unit greenhouse gas emissions from diesel production and combustion processes. Data was modified after Gao et al. [39].
Table 2.
Unit greenhouse gas emissions from diesel production and combustion processes. Data was modified after Gao et al. [39].
| Stages | GHG Emissions (kg CO2e/kg) |
|---|---|
| Crude oil extraction | 0.07220 |
| Crude oil transportation | 0.05356 |
| Diesel refined | 0.37515 |
| Diesel transportation | 0.01011 |
| Diesel combustion | 3.18630 |
Table 3.
Power generation ratio and unit greenhouse gas emissions of the energy in China. Data was modified after Lee et al. [10] and National Energy Administration of China [41].
| Power source | Coal | Nuclear | Hydraulic | Wind |
|---|---|---|---|---|
| 75.28 | 3.91 | 15.63 | 5.18 | |
| 1.0044 | 0.02952 | 0.00864 | 0.02232 |
Table 4.
Electricity transmission efficiency, charging efficiency, and fuel economy of electric trucks. Data was modified after Lee et al. [10] and Campanari et al. [20].
| Parameter | Description | Unit | Value |
|---|---|---|---|
| Transmission efficiency | % | 92.85 | |
| Charging efficiency | % | 90 | |
| Fuel economy of ET | km/kWh | 1.60 |
Table 5.
GHG emission savings of diesel trucks and electric trucks from truck bodies and battery end-of-life phases.
Table 5.
GHG emission savings of diesel trucks and electric trucks from truck bodies and battery end-of-life phases.
| Parameter | Description | Unit | Value (Light/Medium) |
|---|---|---|---|
| GHG emission savings from recycling truck body of DT | kg CO2e | −2366.40/−4624.00 | |
| GHG emission savings from recycling battery of ET | kg CO2e | −991.23/−5347.28 | |
| GHG emission savings from recycling truck body of ET | kg CO2e | −1787.18/−4599.90 |
Table 6.
Composition of the infrastructure cost of the battery-swap station. Data was collected from Sun et al. [45].
Table 6.
Composition of the infrastructure cost of the battery-swap station. Data was collected from Sun et al. [45].
| Infrastructure | Cost |
|---|---|
| Charging/Swapping equipment (million USD) | 4.34 |
| Building (million USD) | 0.79 |
| Distribution facilities (million USD) | 0.24 |
| Installation (million USD) | 0.40 |
| Others (million USD) | 0.28 |
| Total (million USD) | 6.04 |
© 2018 by the authors. Licensee MDPI, Basel, Switzerland. This article is an open access article distributed under the terms and conditions of the Creative Commons Attribution (CC BY) license (http://creativecommons.org/licenses/by/4.0/).
Share and Cite
MDPI and ACS Style
Yang, L.; Hao, C.; Chai, Y. Life Cycle Assessment of Commercial Delivery Trucks: Diesel, Plug-In Electric, and Battery-Swap Electric. Sustainability 2018, 10, 4547. https://0-doi-org.brum.beds.ac.uk/10.3390/su10124547
AMA Style
Yang L, Hao C, Chai Y. Life Cycle Assessment of Commercial Delivery Trucks: Diesel, Plug-In Electric, and Battery-Swap Electric. Sustainability. 2018; 10(12):4547. https://0-doi-org.brum.beds.ac.uk/10.3390/su10124547
Chicago/Turabian StyleYang, Lei, Caixia Hao, and Yina Chai. 2018. "Life Cycle Assessment of Commercial Delivery Trucks: Diesel, Plug-In Electric, and Battery-Swap Electric" Sustainability 10, no. 12: 4547. https://0-doi-org.brum.beds.ac.uk/10.3390/su10124547
Note that from the first issue of 2016, this journal uses article numbers instead of page numbers. See further details here.