Article

Spatiotemporal Trajectory of China’s Provincial Energy Efficiency and Implications on the Route of Economic Transformation

1
State Key Laboratory of Organic Geochemistry, Guangzhou Institute of Geochemistry, Chinese Academy of Sciences, Guangzhou 510640, China
2
Guangzhou Institute of Energy Consumption, Chinese Academy of Sciences, Guangzhou 510640, China
3
University of Chinese Academy of Sciences, Beijing 100049, China
*
Authors to whom correspondence should be addressed.
Sustainability 2018, 10(12), 4582; https://0-doi-org.brum.beds.ac.uk/10.3390/su10124582
Submission received: 21 October 2018 / Revised: 27 November 2018 / Accepted: 29 November 2018 / Published: 4 December 2018

Abstract

:
A comparative analysis of the spatiotemporal trajectory of energy efficiency (STEE) among the provinces in China over the past 21 years was conducted based on a quadrant diagram of the GDP per capita and the energy consumption per capita. An energy macro-efficiency per capita indicator (EMEPCI) was established using the energy consumption data of 30 Chinese provinces from 1996 to 2016. The spatiotemporal trajectory clustering method (STCM) and the industrial structure upgrading index (ISUI) were used for an exploratory analysis of the driving force of the changes in the STEE. The results showed the following: (1) The growth rate and amplitude of energy efficiency differed by province. From a geospatial perspective, the energy efficiency of the eastern regions was higher than that of the western regions, and that of the southern regions was higher than that of the northern regions. The growth trends demonstrated a pattern in which the provinces with higher energy efficiency had higher growth rates, whereas the provinces with lower energy efficiency showed lower growth rates. (2) The majority of the Chinese provinces, particularly the southwest region and the regions near the middle stream of the Yangtze River, were still undergoing a development process. Thus, it is necessary to pay attention to the adjustment of the economic development model to avoid shifting towards quadrants I or II, where the energy consumption is higher. (3) A spatiotemporal trajectory clustering analysis grouped the different provinces into four categories. Besides the majority of the provinces, which remained in quadrant III, Beijing, Shanghai, and Tianjin have remained in the “dual-high” quadrant for long period of time and are shifting towards quadrant IV. The trajectory of the second group was characterized by movement almost directly from the “dual-low” quadrant (III) towards the target quadrant (IV). The common feature of the energy efficiency trajectory of the third group was that they remained in the high energy consumption and low GDP quadrant for a relatively long period, and immediate changes were required in their development models. (4) The provinces with a similar industrial structure transformation level were more likely to have similar spatiotemporal trajectories of energy efficiency. Particularly, provinces with a similar level of transformation from secondary industries to tertiary industries enjoyed a greater probability of transformation as well as similar spatiotemporal trajectories of energy efficiency.

1. Introduction

Since the reform and opening up of China 30 years ago, China’s economy has experienced continuous rapid growth. However, the pace of its economic growth has slowed in recent years [1,2]. Along with the gradual disappearance of the demographic dividend, preservation of natural resources, and environmental constraints, the traditional economic model, which relies on the investment and extensive use of resources, has shown that it cannot ensure sustainable development. An upgrade of the current economic model is urgently needed. China is currently going through economic transformation, and a proper strategy for growth is critical for this transformation. China has a vast territory, and regardless of time or space, the development level of each province has been shown to differ greatly from one another. Economic growth in China demonstrates variable regional characteristics, energy consumption, and energy efficiency, which also shows a strong correlation with economic growth and strong spatial dependence [3]. Hence, during the process of economic transformation, the speed and direction of the provinces’ transformations also vary from one another. Some researchers have monitored energy efficiency trends and compared their performances across different countries [4,5,6]. As is the case with countries that have developed at different speeds, the different provinces of China can learn from the provincial regions that have shown swift growth and good planning; valuable information can be derived from the more developed regions to improve the regional strategies for restructuring and development, providing the provinces that are still in the early stages of development with useful references and thereby contributing to a more equal economic transformation and development process for China as a whole.
Economic development and environmental change are inseparable because of the increase in energy consumption that accompanies such growth [7,8,9,10,11]. Some economists have pointed out that China’s current stage of economic transformation still overlaps with the economic cycle and energy revolution period [12,13]. In this context, energy efficiency, an index that reflects the quality of energy input and output, deserves further attention [14,15,16]. The European Union’s Action Plan for Energy Efficiency defined the concept of energy efficiency as reducing energy consumption without reducing the use of energy-consuming plants and equipment. Aiming to make better use of energy, energy efficiency means promoting behavior, working methods, and manufacturing techniques that are less energy-intensive [17]. Inglesi-Lotz concluded that energy efficiency is an economical way to reduce energy usage, taking into consideration of the economy’s real output [18,19,20]. This study adopted the energy macro-efficiency per capita indicator (EMEPCI) to illustrate the spatiotemporal trajectory of energy efficiency (STEE) of 30 provinces in mainland China (excluding Tibet). We then introduced geospatial information technology and utilized the spatiotemporal trajectory clustering method (STCM) to conduct a similarity analysis of the STEE of the provinces, so as to explore the trends of the STEE on a provincial level. Based on the cluster results of the STEE, we attempted to uncover the response mechanisms of energy efficiency and industrial structure by analyzing the relationships between the various categories of trajectory and the industrial structure of the provinces. Through this study, we intended to summarize the lessons learned from the more developed provinces into a reference for the economic transformation of the less developed provinces, from the perspective of energy utilization efficiency.

2. Materials and Methods

Energy efficiency is designed to reflect the amount of the energy consumed for the maintenance or promotion of sustainable economic, social, and environmental development [21,22]. Different application areas use different methods to measure energy efficiency, as it is generally impossible to use a single indicator to completely cover the complexities of the causal connotations. Based on a summary and analysis of energy efficiency indicators in commonly applied areas, Wei and Liu proposed seven new energy efficiency indicators, namely energy macro-efficiency, energy physical efficiency, energy thermodynamics efficiency, energy value efficiency, energy allocative efficiency, energy utilization efficiency, and energy economic efficiency [22,23,24], and pointed out that energy macro-efficiency (the reciprocal of energy consumption per GDP) is suitable for long-term studies.
This study utilized the energy consumption data of provinces in China (given the difficulty of data acquisition, Hong Kong, Macao, Taiwan, and Tibet were not included) over a period of 21 years (1996–2016). Compared with total energy consumption, energy consumption per capita can better represent the energy consumption level of a nation or region, as well as the benefits of energy that are available for people [25]. Therefore, this study constructed e (the EMEPCI), the calculation formula of which is shown in Equation (1), wherein G represents the regional GDP per capita (unit: 10,000 Yuan/person), while E represents the energy consumption per capita (unit: metric tons of standard coal equivalent/person).
e = G E

2.1. Trajectory Clustering Methods

On the basis of the EMEPCI, we developed a comparison quadrant diagram of the GDP per capita and energy consumption per capita of the 30 provinces over 21 years. Nanni (2002) summarized different defined methods of spatiotemporal trajectory, including a global regression model, local difference value model, field knowledge model, and semantic information trajectory expression model [26]. This study introduced the spatiotemporal trajectory data processing method in a geospatial information system (GIS) to analyze the STEE data of 30 provinces in China. Because the data scale was relatively small in this study, it was unnecessary to use a regression model to define the STEE. Therefore, prior to the adoption of the spatiotemporal trajectory clustering method, it was necessary to normalize the data for each province from each year and acquire a coordinate on the trajectory chart. As shown in Equation (2), G i is the GDP per capita of the i th province, and M a x ( G 1 : G 30 ) is the maximum GDP per capita among the 30 provinces; E i is the energy consumption per capita of the ith province, and M a x ( E 1 : E 30 ) is the maximum energy consumption per capita among the 30 provinces.
x = G 1 M a x ( G 1 : G 30 ) y = E 1 M a x ( E 1 : E 30 )
In this study, the spatiotemporal trajectory of energy efficiency (STEE) was defined and expressed using a series of data pairs in different years, composed of (x, y), where x was the normalized GDP per capita and y was the energy consumption per capita, calculated using Equation (2). To demonstrate the construction of the STEE, the two spatiotemporal trajectories of Beijing and Guangdong are shown in Figure 1, and the development trajectories of energy efficiency of the 30 provinces over 21 years are shown in Figure 2, which clearly shows the distribution of the STEE of each province temporally and spatially.
Spatiotemporal trajectory data processing and analysis is a nascent data mining method, emerging in recent years amid the background of geospatial information development. Spatiotemporal trajectory data are actually a recorded sequence of the position and time of a moving object [27,28]. This article introduced spatiotemporal trajectory data processing methods in geospatial information science into the mining and analysis of the spatiotemporal trajectory data related to energy efficiency, wherein, the spatiotemporal trajectory cluster analysis method was adopted to distinguish subjects with similar temporal behaviors and dissimilar behaviors [29] in order to measure the similarity of trajectories at different time intervals. The researchers also invented a different spatiotemporal trajectory clustering calculation method. Wang et al. (2003) performed “group pattern” clustering of spatiotemporal trajectory, whereby if the distances between moving objects are less than a minimum threshold, these objects can be clustered into one group [30,31]. Through the requirements of similarity over various time intervals, one can understand the diversity in the similarity of spatiotemporal trajectories. Such a method can also reflect the development process of the similarities of spatiotemporal trajectories.
Compared with the spatiotemporal trajectory data in the geospatial information area, the scale of the data used in this study, which involved a 21-year period, were relatively small, and the computing requirements were relatively simple. Therefore, the computational complexity could be ignored during the clustering process, and a simple and intuitive way of clustering could be adopted. The Euclidean distances between the trajectories were employed to measure the similarity during the clustering process, and afterward, summation integration methods were also employed [32,33]. The details are shown in Equation (3):
D ( R , S ) = k = 1 n d ( r k , s k ) d ( r k , s k ) = ( r k , x s k , x ) 2 + ( r k , y s k , y ) 2
where R,S present the two spatiotemporal trajectory records, respectively; n is the recorded number of points; D(R,S) is the Euclidean distance of the two trajectories; rk,sk is the kth record of trajectory R,S; rk,x, sk,x, rk,y, sk,y is the cross-ordinate of the record point; and d(rk,sk) is the Euclidean distance of rk,sk.

2.2. Calculation of the ISUI

Many factors, including natural conditions, regional location, economic foundation, historical background, and policy orientation, can impact energy efficiency. Thus, a significant amount of academic research has indicated that energy efficiency and industrial structure are closely related [34,35,36]; in which case, upgrading the industrial structure is an essential link that affects the enhancement of energy efficiency. This study utilized the industrial structure upgrading index (ISUI) to analyze the evolution of the industrial structure of each province, with an additional focus on the driving impact of the evolution of the industrial structural development on changes in the energy efficiency development trajectory.
The industrial structure is composed of primary industries, secondary industries, and tertiary industries. The gradual shifting process of industrial focus from primary industries to secondary and tertiary industries can be seen as the industrial structure development process from a lower level to a higher level. The angle between the proportion vector of the corresponding industry and the coordinate axis tends to vary based on the proportion of a given industry during the three tested times. Using this special feature, Zheng constructed an industrial structure upgrading index IH, described in equation (4), to quantitatively describe the transformation process of such industrial structures [37]. The calculation formula is as follows: µ1 and µ2 are the angles between vector (x1,x2,x3), (0,1,0) and (0,0,1); σ1 is the angle between vector (x2,x3) and vector (0,1); and x1,x2,x3 are the proportions of the increased value during the three tested times on the GDP, respectively. θ1 and θ2 can be used to measure the degree of transformation of the primary industries to the secondary and tertiary industries and that of the secondary industries to the tertiary industries, respectively. The greater the value, the higher the transformation level and the corresponding ISUI, with IH indicating a higher industrial structure transformation level.
I H = θ 1 + θ 2 θ 1 = π μ 1 μ 2 θ 2 = π 2 σ 1
The angle between the vectors is calculated as follows (the range of n in this study was 2 and 3, respectively). θ represents the angle between the vectors.
θ 2 = arccos [ i = 1 n ( x i x i , 0 ) ( i = 1 n x i 2 ) 1 2 i = 1 n ( x i , 0 2 ) 1 2 ]

3. Results and Analysis

3.1. Analysis of Energy Efficiency Variation

Figure 3 shows the variation diagram of the energy efficiency of the provinces in the time sequence and indicates clear trends of growth in energy efficiency per capita. However, there are apparent differences in the growth rate and amplitude across provinces. Beijing has the greatest energy efficiency growth rate and magnitude in the country. Its energy efficiency ranked 11th in 1996 and has been in the top position since 2006. The energy efficiency in the provinces of Guangdong, Zhejiang, Jiangsu, and Fujian also ranked at the top in the country. Shanghai and Tianjin had a large increase in energy efficiency, and by 2016, their rankings improved to the fourth and seventh places, respectively. Anhui, Jiangxi, and Hainan provinces had relatively higher energy efficiency per capita. Ningxia, Qinghai, Xinjiang, and Guizhou, which are located in western China, together with Shanxi and Inner Mongolia, have lower energy efficiency. Moreover, the provinces with lower energy efficiency were also characterized as having a lower increase in energy efficiency.

3.2. Trajectory Clustering Analysis of Energy Efficiency Development

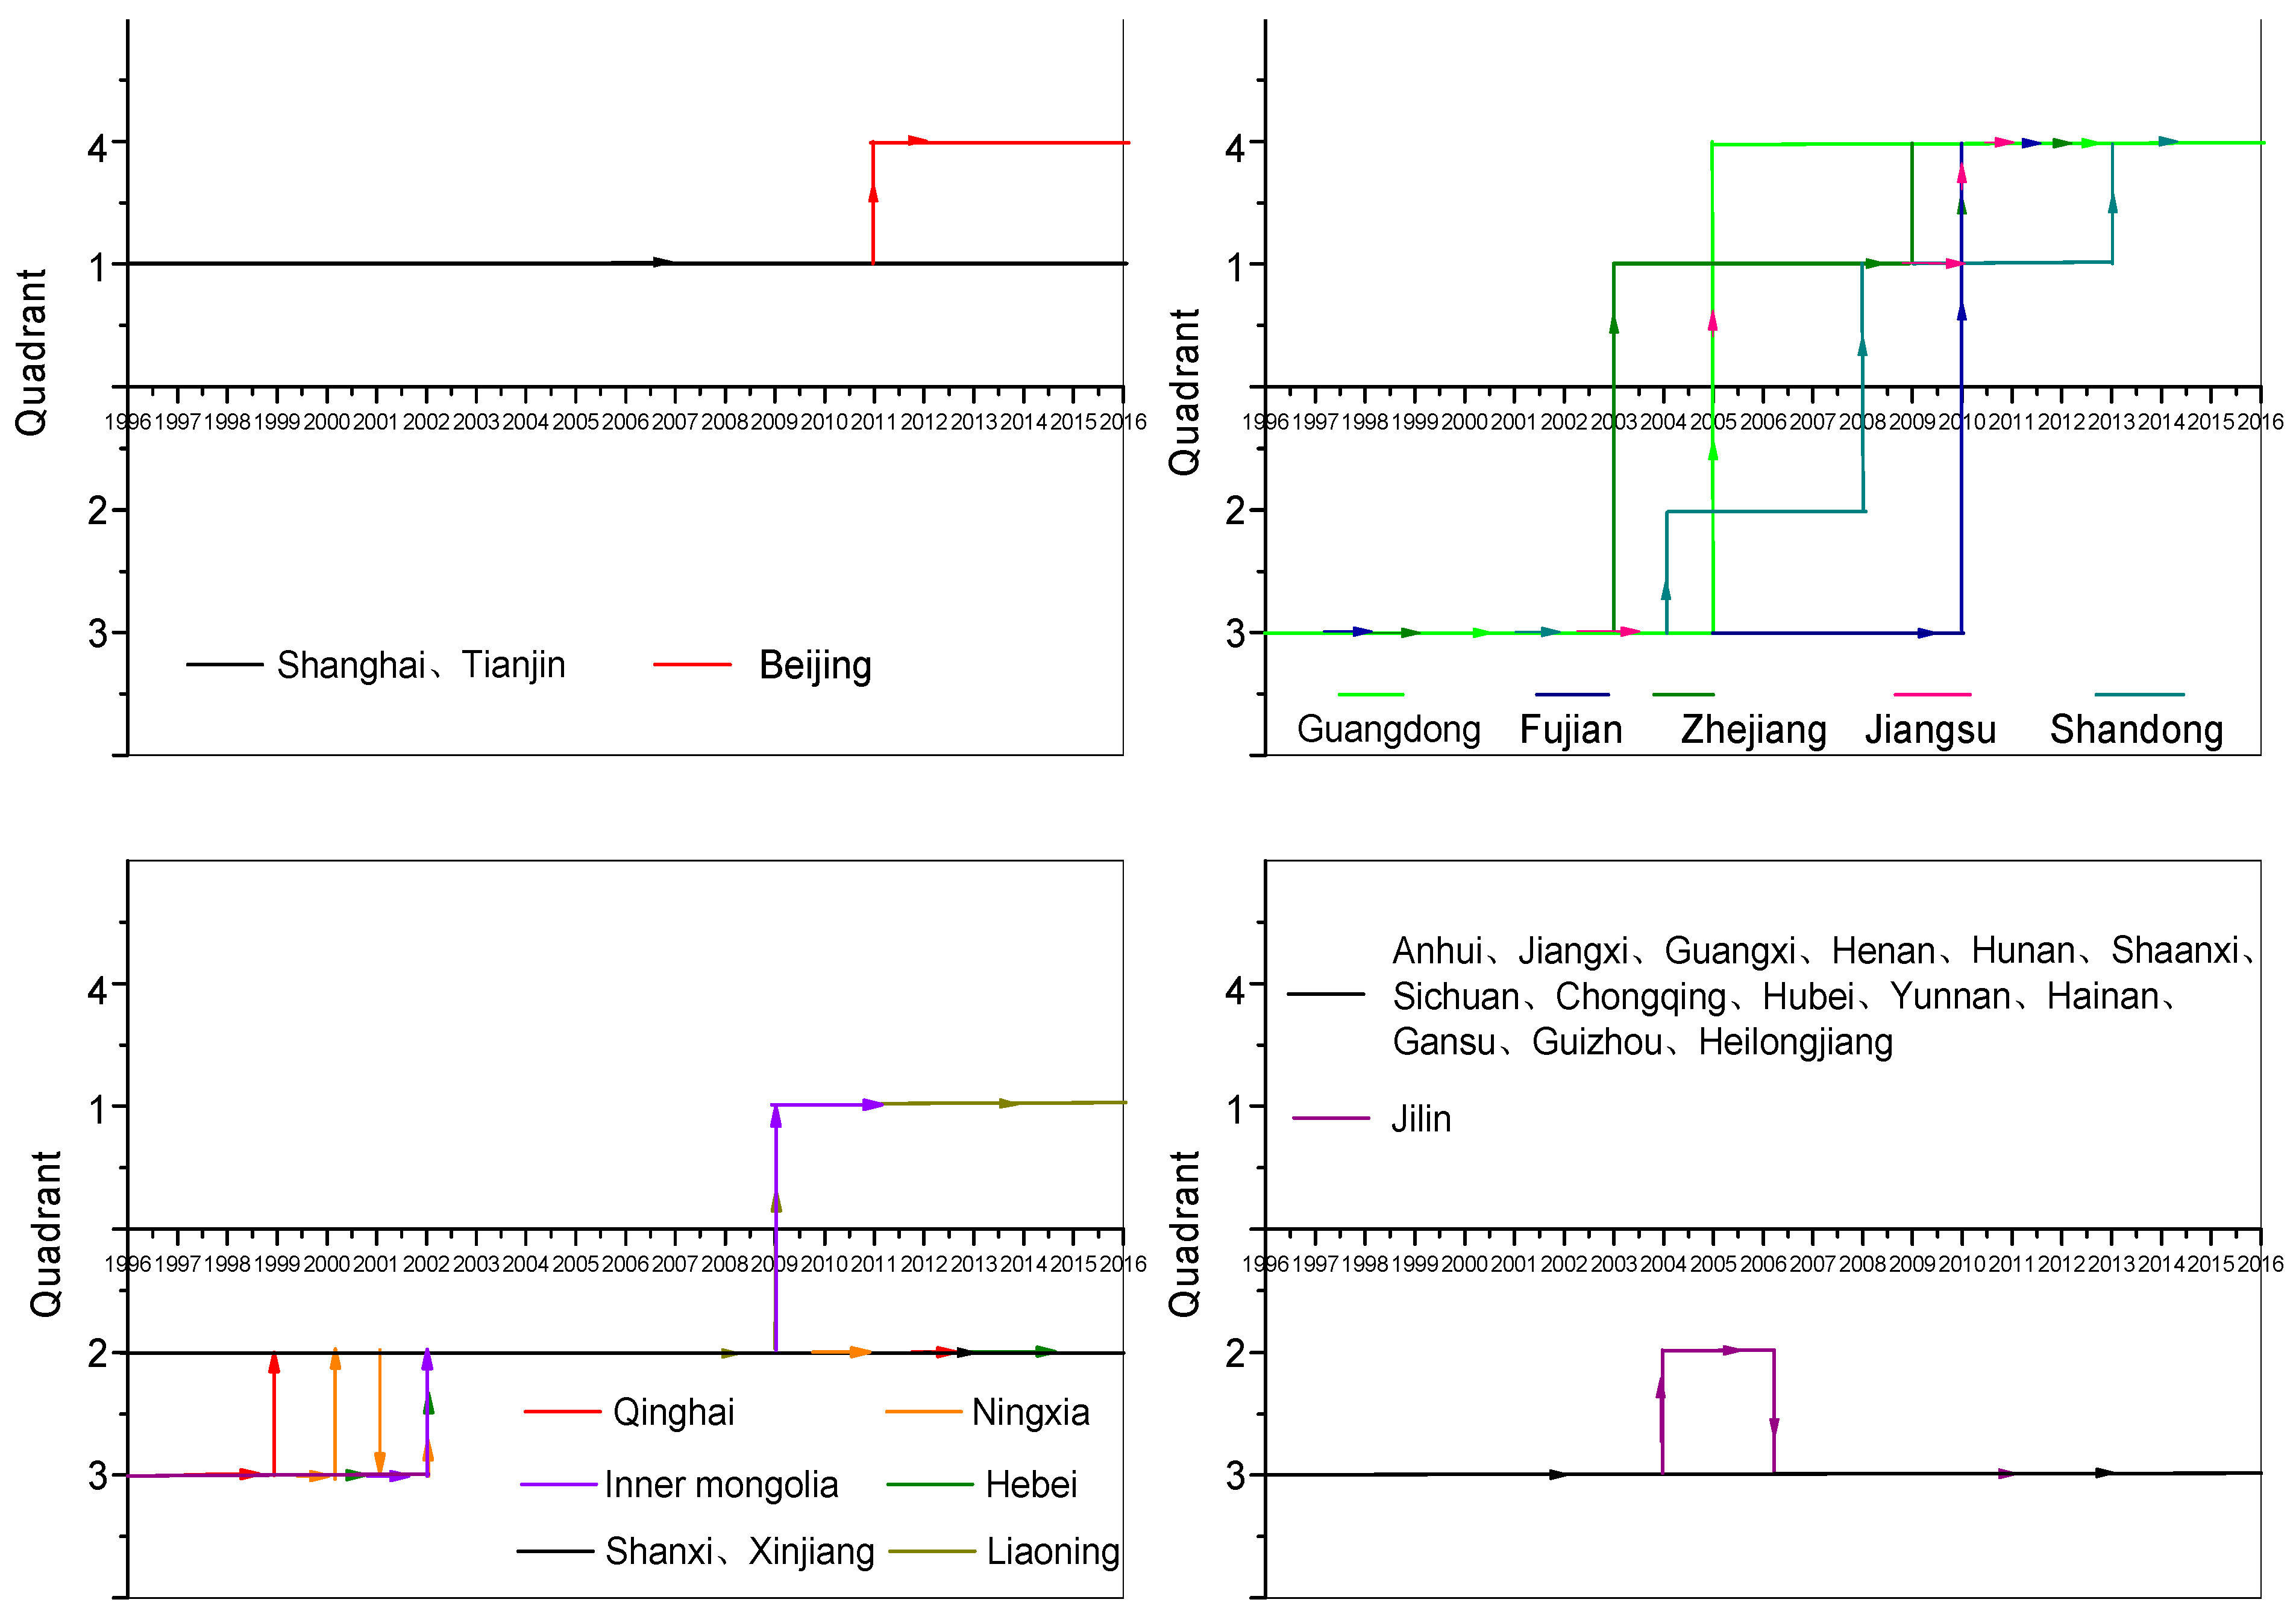
After the clustering analysis, the spatiotemporal trajectory of the development of energy efficiency of the 30 provinces were clustered into four groups (the threshold was set to 5): Group One: Beijing, Tianjin, and Shanghai; Group Two: Jiangsu, Zhejiang, Fujian, Shandong, and Guangdong; Group Three: Qinghai, Xinjiang, Hebei, Shanxi, Inner Mongolia, Liaoning, and Ningxia; and Group Four: Anhui, Jiangxi, Guangxi, Henan, Hunan, Shaanxi, Sichuan, Chongqing, Hubei, Yunnan, Hainan, Gansu, Guizhou, Jilin, and Heilongjiang.
It can be seen that the clustering results corresponded with the energy efficiency of the provinces. Most of the provinces in Groups One and Two had relatively high energy efficiency; Group Three was composed of the provinces with relatively low energy efficiency; and Group Four included the provinces that had a medium level of energy efficiency. However, the level of energy efficiency and the cluster results did not correspond exactly, suggesting a distinction in the way energy efficiency was acquired by the provinces, which must await further in-depth analysis.
On the basis of Figure 2, 
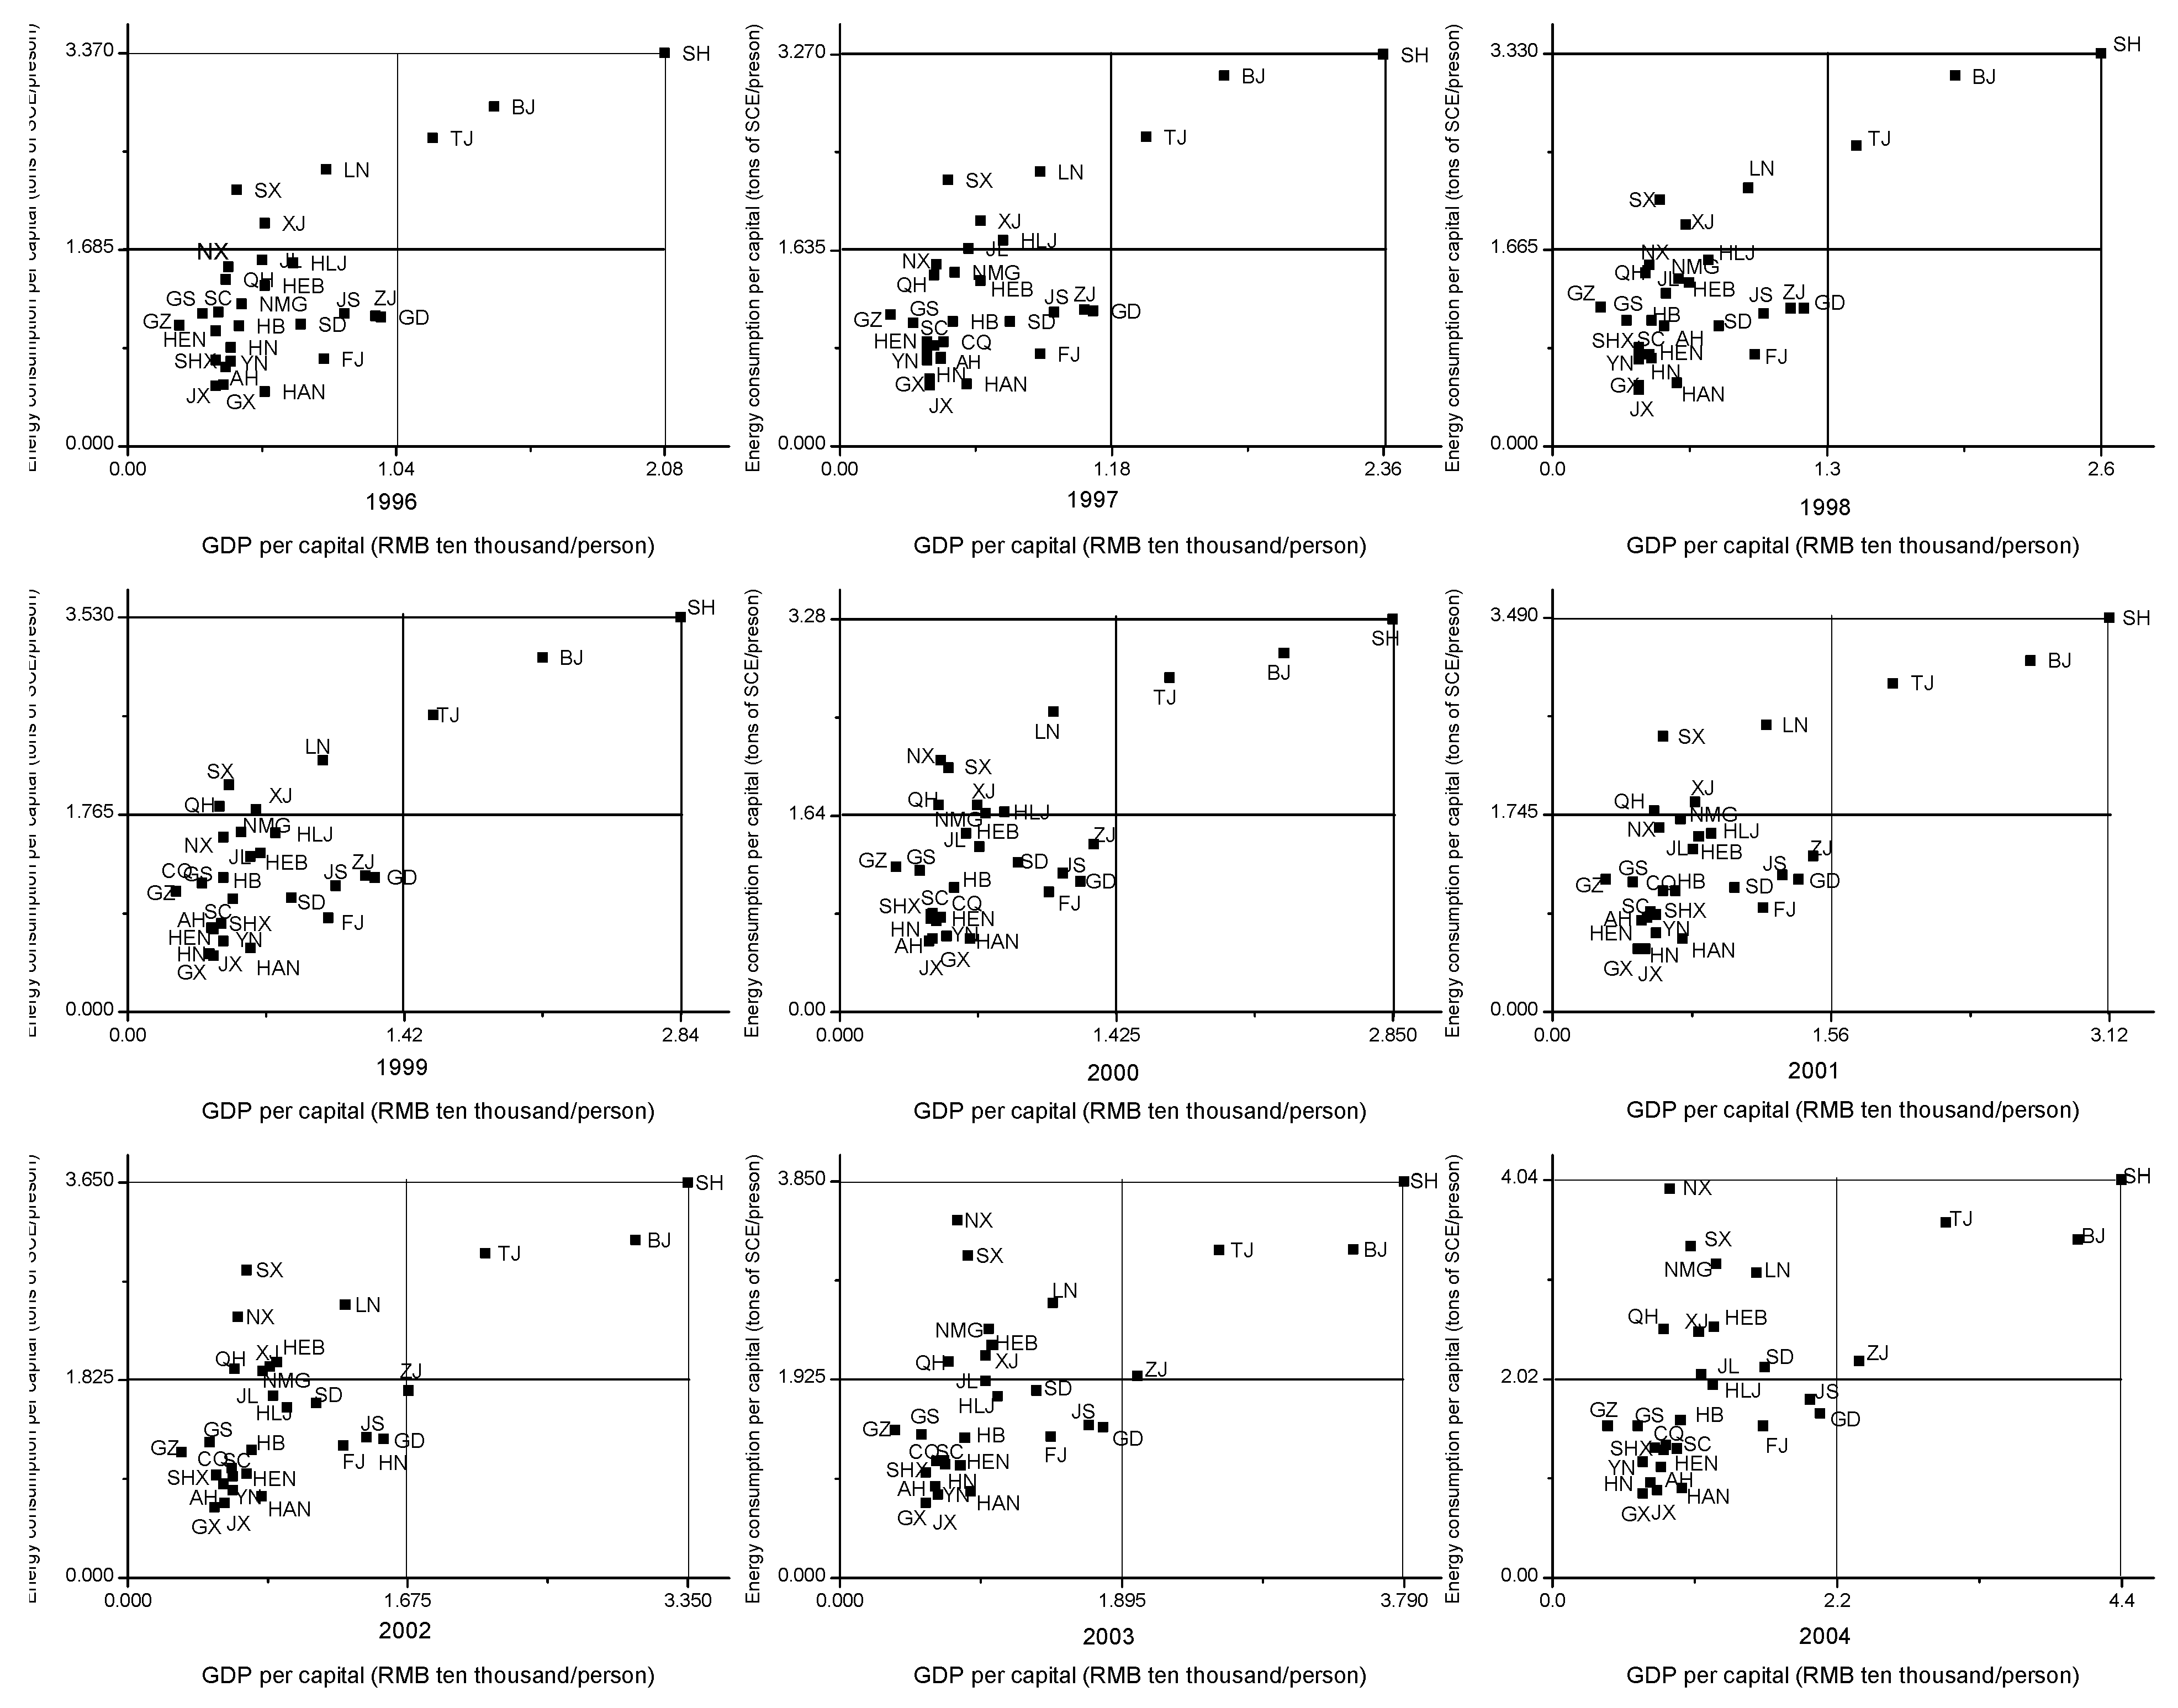
Figure 4 illustrated the changes in the energy efficiency development trajectory of the four groups in a quadrant chart. The first quadrant (I) is a “dual-high” zone with high energy consumption and high GDP, the second quadrant (II) is a high energy consumption and low GDP zone, the third quadrant (III) is a “dual low” zone with low GDP and low energy consumption, and the fourth quadrant (IV) is a low energy consumption and high GDP zone. Both quadrants I and II include high energy-consuming regions. Particularly, in quadrant II, high energy consumption brought about low GDP, suggesting an extensive use of energy with slower economic growth. The regions in quadrants III and IV were low energy-consuming regions. The provinces in quadrant IV showed low energy consumption yet achieved a high GDP, the ideal target for the provinces in the low energy consumption and low GDP quadrant (III).
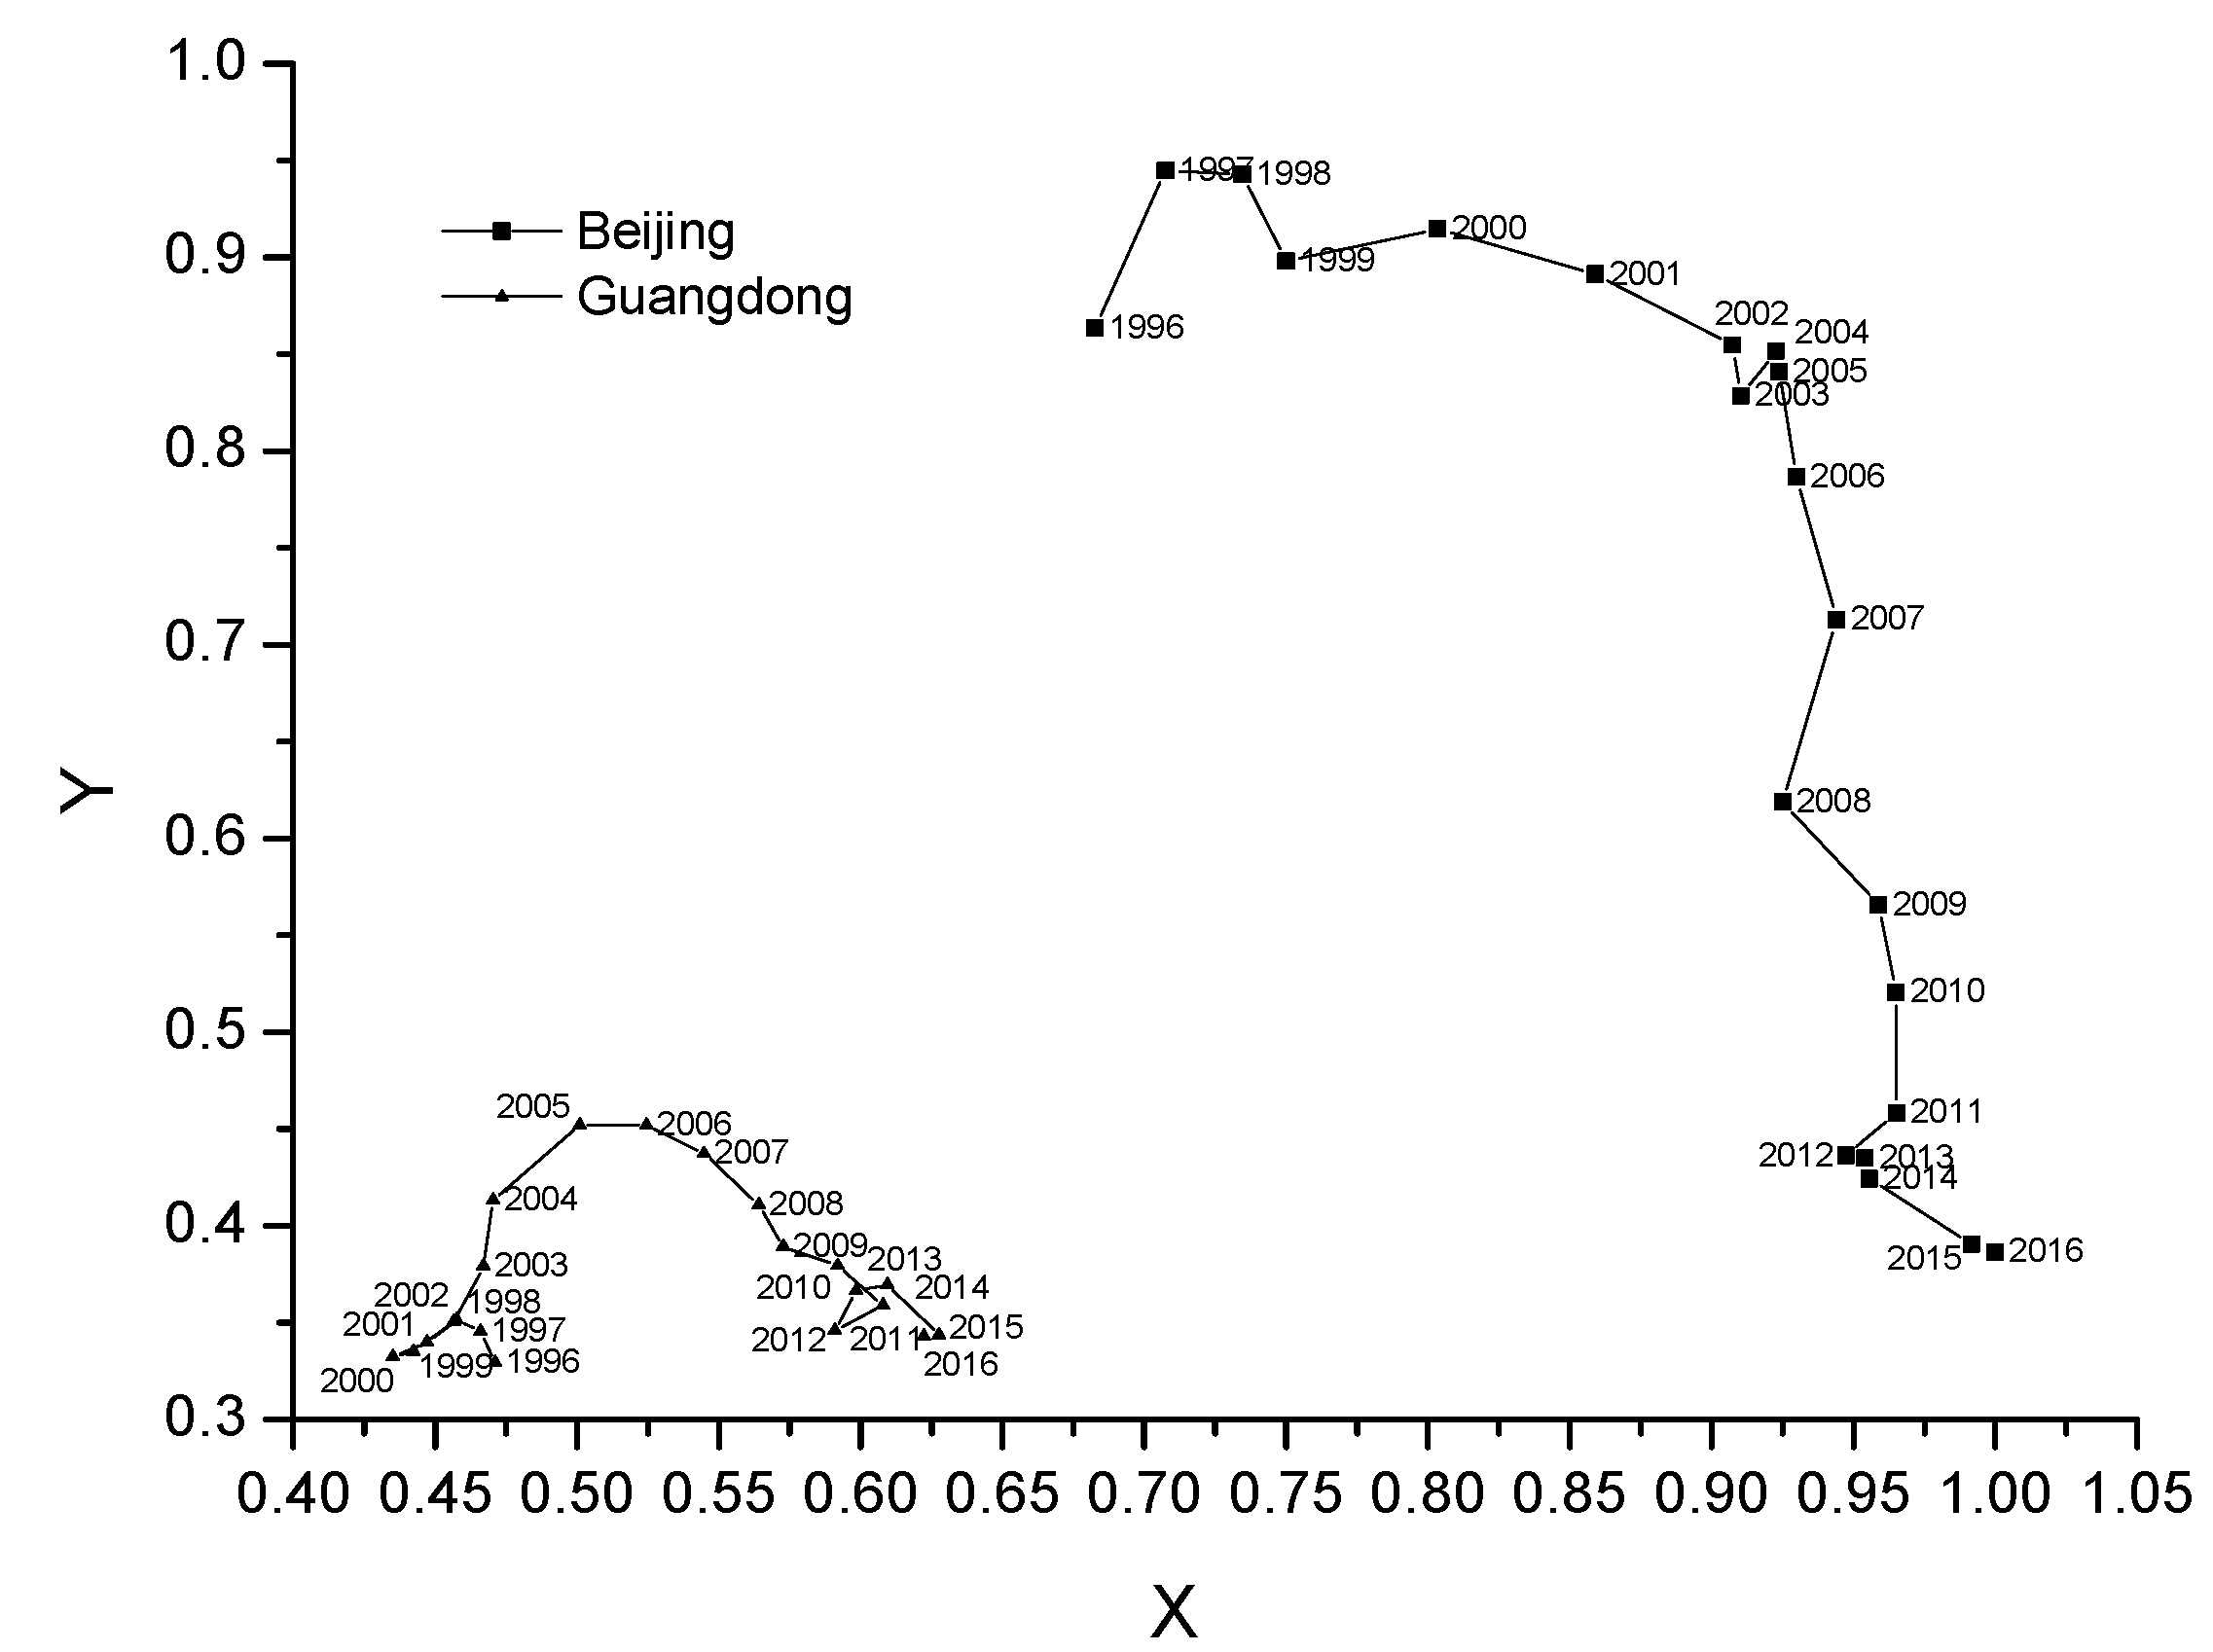
Group One of the cluster analysis included Beijing, Shanghai, and Tianjin, which have the common feature of a “dual-high” spatiotemporal trajectory. In 2011, Beijing moved to quadrant IV, showing low energy consumption and a high GDP. The comparison in Figure 2 also reveals that Shanghai and Tianjin demonstrated a similar trend of change, with a growth in GDP per capita and a continuous decline of respective energy consumption.
Group Two included Guangdong, Jiangsu, Zhejiang, Shandong, and Fujian. From 1996 to 2003, these provinces all belonged in the “dual-low” quadrant (III). In 2005, Guangdong moved from the “dual-low” quadrant (III) to quadrant IV, with low energy consumption and a high GDP. Fujian showed a similar trajectory as that of Guangdong, moving from quadrant III to IV in 2010. Zhejiang moved from the “dual-low” quadrant (III) to the “dual-high” quadrant (I) in 2003 and from quadrant I to IV in 2009. Similar to Zhejiang, Jiangsu moved from the “dual-low” quadrant (III) to the “dual-high” quadrant (I) in 2005. According to 
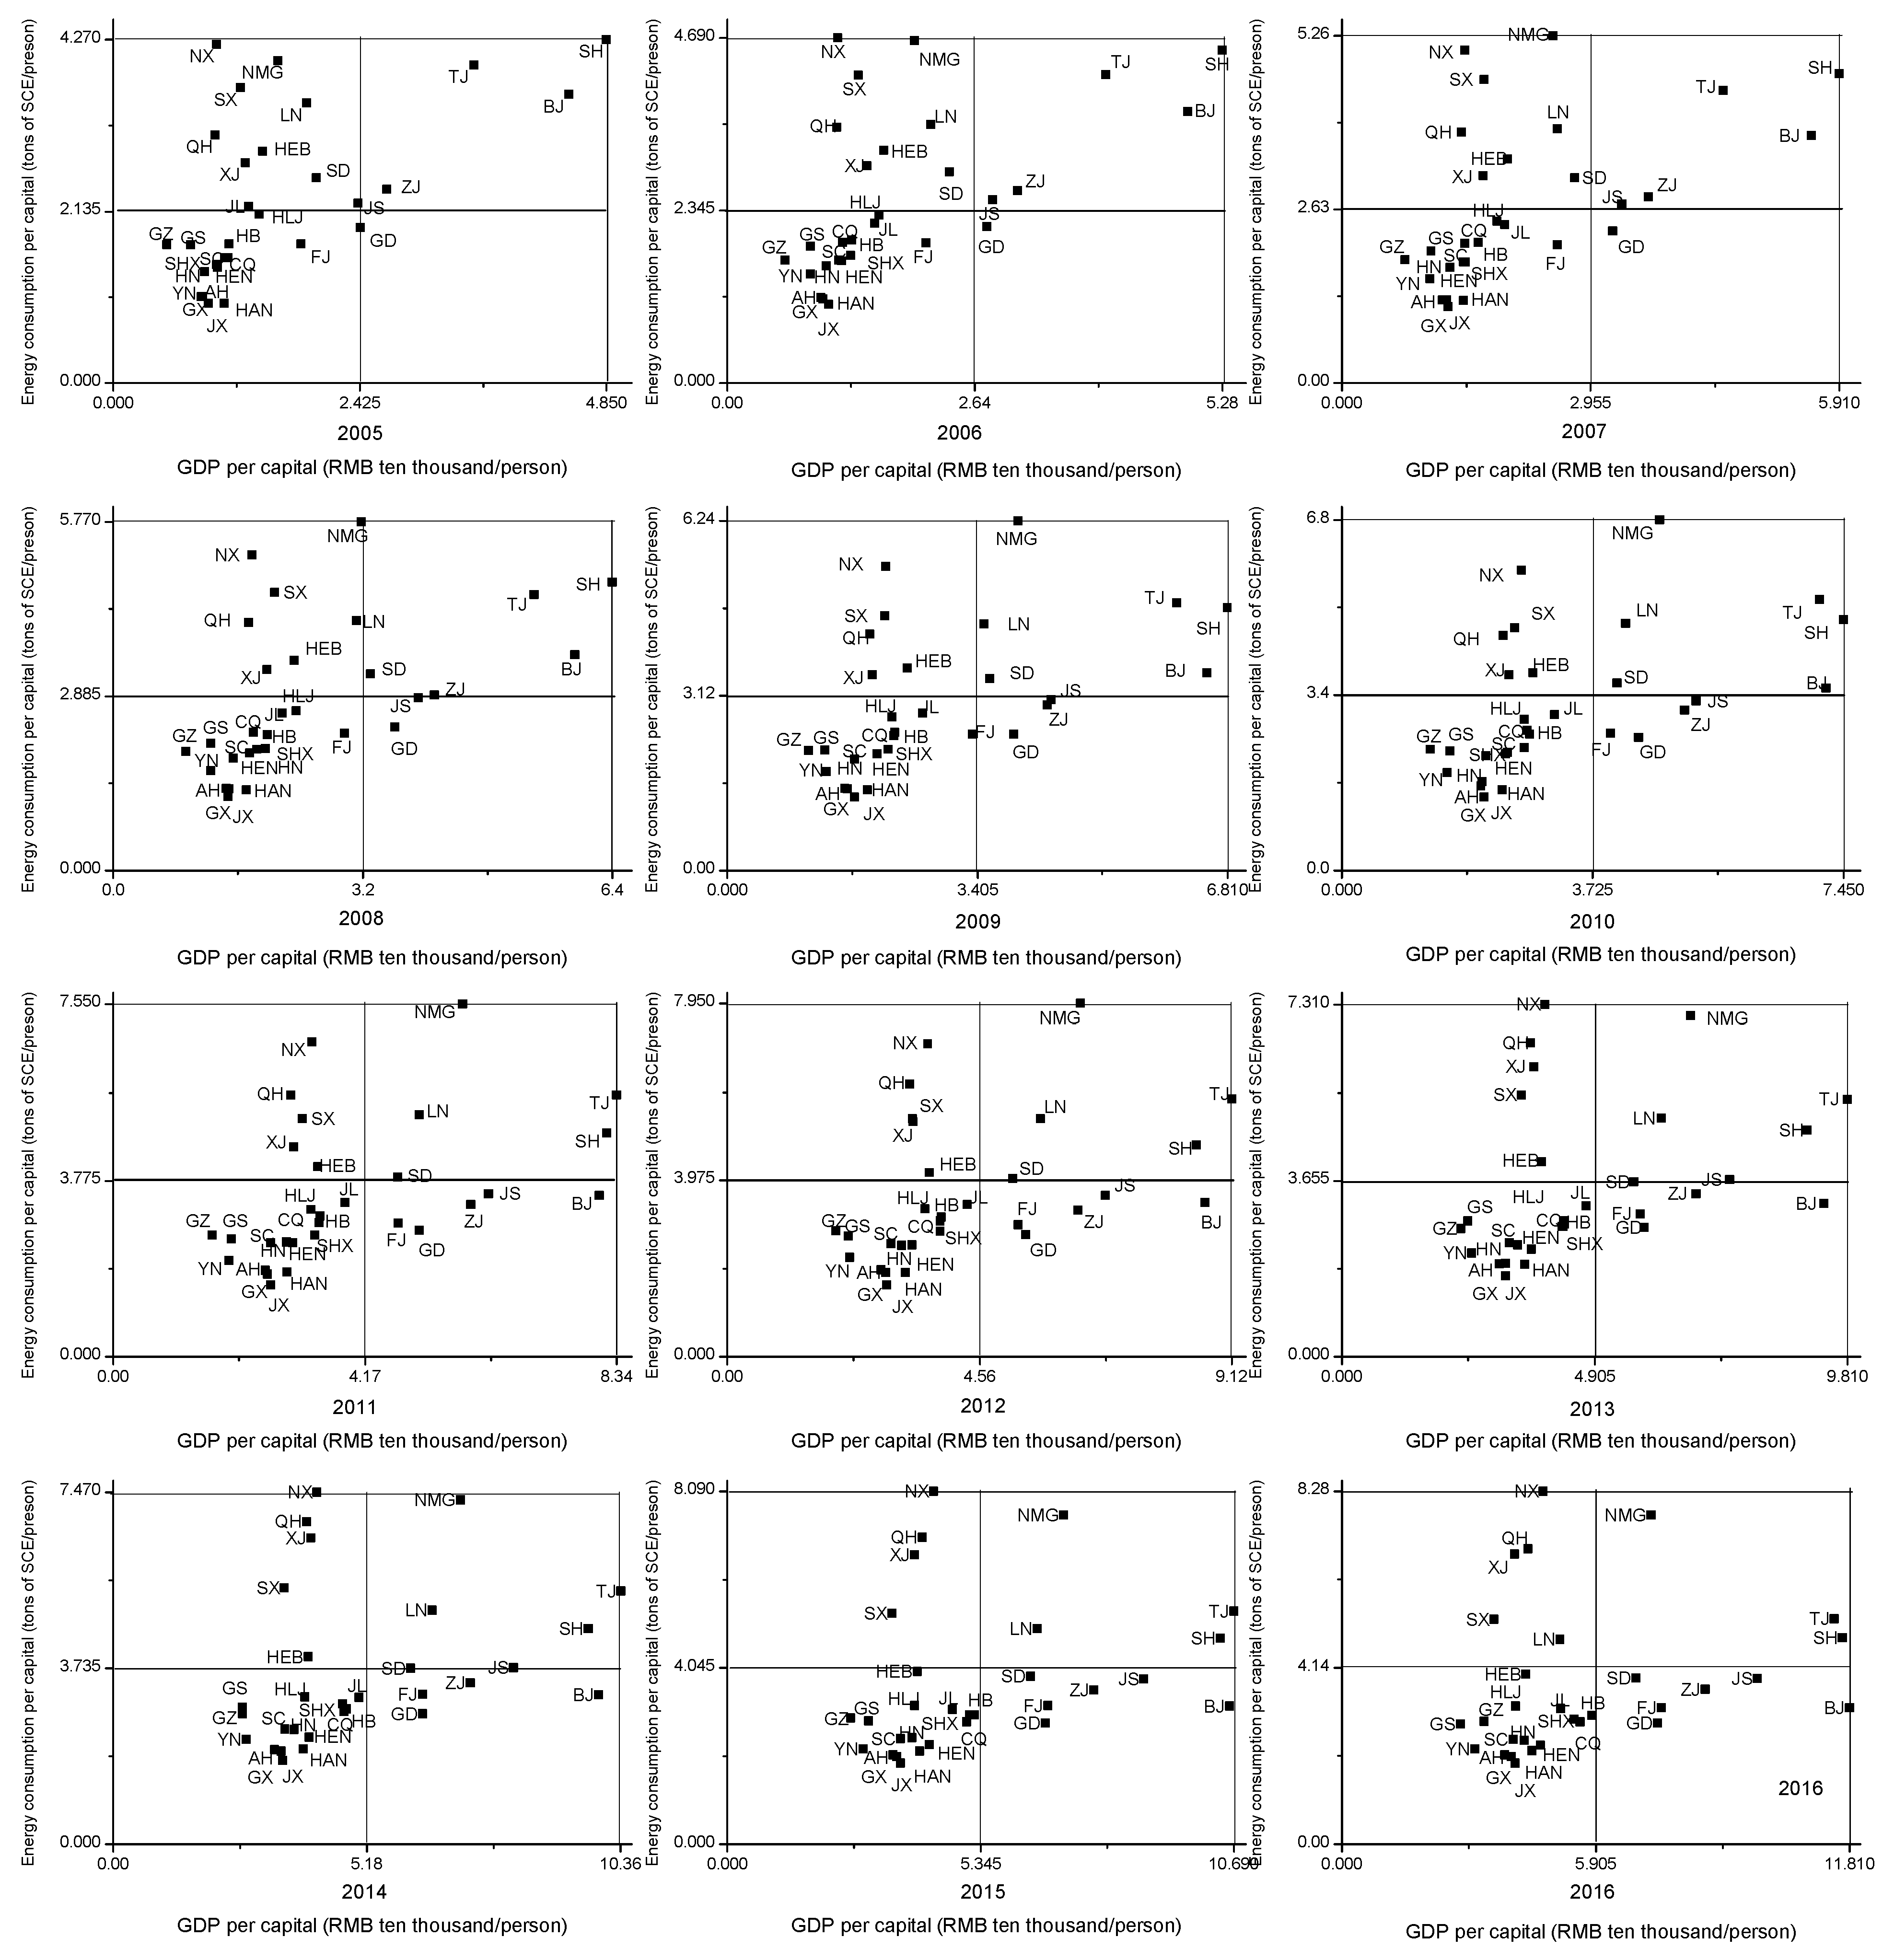
Figure 2, the change trajectories of Zhejiang and Jiangsu were quite alike, moving from the “dual-low” to “dual-high” quadrant in 2003 and 2005, respectively, and thereafter, to quadrant IV. Shandong moved to quadrant II (high energy consumption and low GDP) in 2004, and after four years of development, from quadrant II to the “dual-high” quadrant (I) in 2008, and then to quadrant IV in 2013. The detailed trajectories in Figure 2 revealed that when Zhejiang, Jiangsu, and Shandong were in either quadrant I or quadrant II, their positions were quite close to the intersection area of the quadrants, indicating relatively smaller energy consumption per capita compared with other provinces in the same quadrants. To sum up, the common characteristic of the STEE of the provinces in Group Two was that they all started from the “dual-low” quadrant (III), then moved directly or indirectly—but within a short period of time—to quadrant IV, which has the best energy utilization efficiency.
The Group Three provinces were Qinghai, Hebei, Inner Mongolia, Shanxi, Ningxia, Liaoning, and Xinjiang. The common feature of their STEE was that they were found to stay in the high energy consumption and low GDP quadrant (II) for a long period of time. This was particularly the case for Shanxi and Xinjiang, which remained in quadrant II during the entire study period. Hebei and Qinghai shifted from the “dual-low” quadrant (III) to the high energy consumption and low GDP quadrant (II) in 1999 and 2002, respectively. Ningxia experienced repeated shifts between quadrants III and II throughout 2000 and 2001 and then moved to the high energy consumption and low GDP quadrant (II) in 2002. By 2013, all three provinces remained in quadrant II. Between 1996 and 2002, Inner Mongolia showed a similar development trajectory to that of Ningxia and Hebei, shifting from quadrant III (dual low) to quadrant II in 2002, except that Inner Mongolia then moved from quadrant II to quadrant I (dual high) in 2009. Liaoning also moved from quadrant II to quadrant I (dual high) in 2010.
The spatiotemporal trajectory of the Group Three provinces between 1996 and 2016 can be summarized as follows: Inner Mongolia completed the transformation from “dual low” to high energy consumption and low GDP and then to “dual high”; Qinghai, Ningxia, and Hebei completed the shift from “dual low” to high energy consumption and low GDP; Liaoning changed from high energy consumption and low GDP to “dual high”; and Xinjiang and Shanxi remained at the stage of high energy consumption and low GDP. If simply analyzing the spatiotemporal trajectories, according to the cluster results, it can be inferred that Qinghai, Hebei, Ningxia, Shanxi, and Xinjiang may follow a development path similar to that of Inner Mongolia in the future, shifting from the high energy consumption and low GDP quadrant to the “dual-high” quadrant. Inner Mongolia and Liaoning may complete the energy efficiency development trajectory of Beijing, together with Shanghai and Tianjin from Group One, moving from quadrant I (dual high) to quadrant IV.
The clustering results showed that Group Four includes most of the provinces, suggesting that the majority of the provinces were still in the early stage of the development process during which their energy consumption and GDP per capita were not particularly high. With respect to their economic and social development, the provinces in Group Four were faced with choosing their own path to energy efficiency development. A further cluster analysis done within Group Four by narrowing the threshold value down to 1.5 resulted in four subgroups: (1) Anhui, Jiangxi, Guangxi, and Hainan; (2) Jilin and Heilongjiang; (3) Henan, Hunan, Hubei, Chongqing, Shaanxi, Henan, Sichuan, and Yunnan; and (4) Gansu and Guizhou. A comparative analysis within Group Four revealed that Anhui, Jiangxi, Guangxi, and Hainan had relatively high GDP per capita and low energy consumption per capita. Further, Jilin and Heilongjiang had relatively high GDP per capita and energy consumption per capita, while Gansu and Guizhou had low GDP per capita and high energy consumption per capita.

3.3. Analysis of Driving Forces of Energy Efficiency Development Trajectories

Figure 5 shows the change in the ISUI of the provinces over the years. Comparing Figure 3 and Figure 5 revealed that the energy efficiency and ISUI of the provinces did not correspond with each other, with some instances even showing that the two variables deviated from each other. Such provinces included Anhui, Jiangxi, and Guangxi, which had relatively high energy efficiency levels but had ISUI values lower than those of other provinces. Nonetheless, further analysis disclosed an association between the STEE and the transformation of the ISUI.
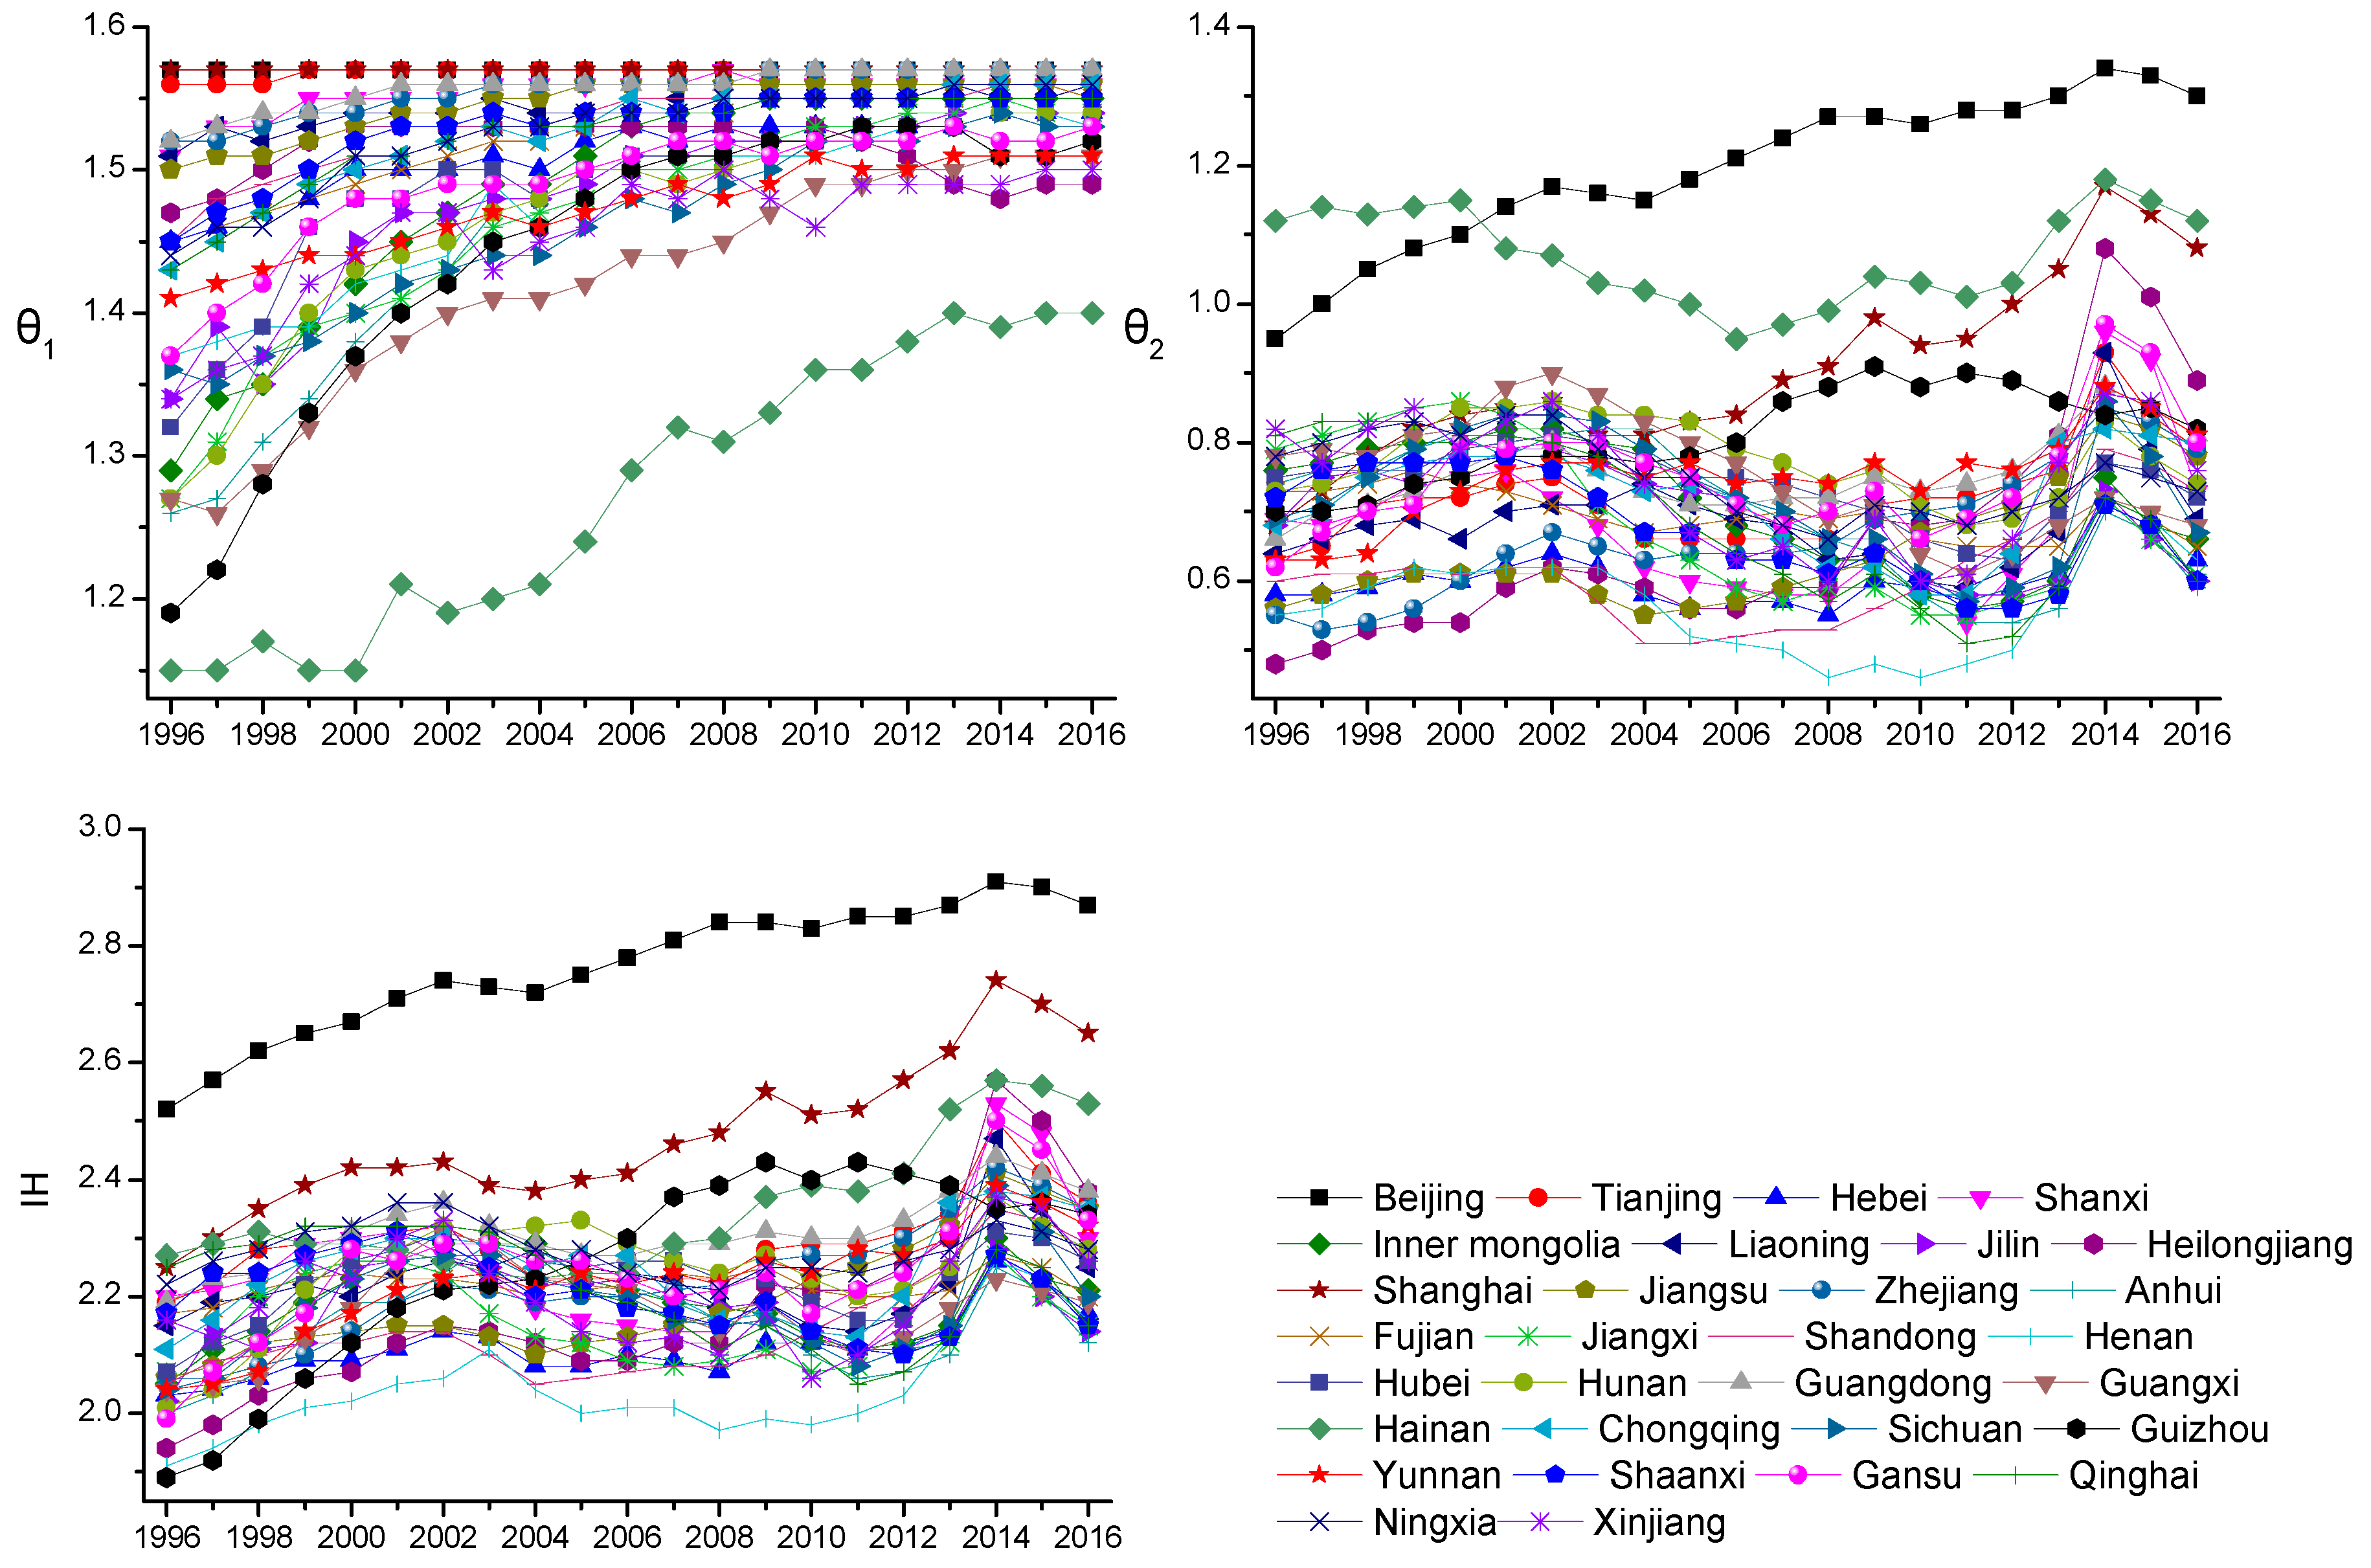
Their ISUI values showed that the provinces still relied heavily on the improvement of industrial structures for their transformation from primary industries to secondary and tertiary industries. From 1996 to 2016, the transformation of each province from primary industries to higher-level industries was relatively stable, with a relatively small gap among the provinces, as well as with an almost synchronized pace of development. Compared with other provinces, although Hainan experienced positive industrial transformation from primary industries to higher-level industries, its level of transformation was still lower, indicating that Hainan, compared with other provinces, focused more on the development of primary industries, which was consistent with the reality of the situation. The provinces that led the transformation from primary industries to secondary and tertiary industries included Beijing, Shanghai, Tianjin, Guangdong, Zhejiang, Shanxi, Jiangsu, and Liaoning, with an average annual ISUI value of higher than 1.54. Xinjiang, Sichuan, Anhui, Guizhou, Guangxi, and Hainan had an average annual ISUI value of less than 1.45, lagging behind other provinces. However, the transformation growth levels of Guizhou, Hainan, Anhui, Jiangxi, Hunan, Inner Mongolia, and Guangxi from primary industries to secondary and tertiary industries were among the top, with a growth rate of more than 18%
The trend in the level of transformation from secondary industries to tertiary industries of the provinces was different than their transformation from primary industries to secondary and tertiary industries. There was an apparent increase in the transformation from secondary industries to tertiary industries for Beijing, Shanghai, Tianjin, Jiangsu, Zhejiang, Guangdong, Shandong, Yunnan, and Heilongjiang, and their ISUI values were also relatively high. Hainan presented a notable decreasing trend in the transformation speed from secondary industries to tertiary industries after 2000, which did not recover until 2011; however, its level of transformation remained high, ranking first from 1996 to 2000 and close to that of Beijing between 2001 and 2016. Other provinces that had a high ISUI value included Guizhou and Gansu. During the 10 years between 1996 and 2006, Guizhou experienced a slight upward trend in industrial transformation. Although there was a high level of decline in 2009, its overall level of transformation was still on par with those of Beijing, Hainan, and Shanghai after 2006. Gansu showed a level of development similar to Guizhou from 1996 to 2006, with a minor decline in 2006 and subsequent recovery since 2010.
In contrast, the transformation level from secondary industries to tertiary industries in Anhui, Jiangxi, Guangxi, Inner Mongolia, Qinghai, Shaanxi, Sichuan, Chongqing, Ningxia, and Jilin manifested a recognizable downward trend. The majority of these provinces had a higher level of transformation than Zhejiang, Jiangsu, and Heilongjiang from 1996 to 2008. Nonetheless, in 2008, Zhejiang and Jiangsu surpassed these provinces, and thereafter, the gap between the two groups continued to grow. The rate of transformation of Shanxi, Hubei, and Hunan presented a slight downward trend. Provinces such as Henan and Liaoning showed a relatively stable development trend; however, compared with other provinces, they ranked very low.
According to the comparative analysis between the ISUI and STEE, the majority of the provinces in Groups One and Two of the cluster results of the energy efficiency trajectory, including Beijing, Tianjin, Shanghai, Jiangsu, Zhejiang, Guangdong, Shandong, and Fujian, stood at the forefront in terms of their level of improvement, and their transformation from secondary industries to tertiary industries presented an upward trend.
Provinces from Group Three of the energy efficiency cluster results, including Qinghai, Hebei, Inner Mongolia, Shanxi, Ningxia, Liaoning, and Xinjiang, showed various levels of industry transformation. The majority of these provinces were around or below the country’s average level of industry transformation. Particularly, the transformation from secondary industries to tertiary industries presented a downward trend, with relatively low transformation.
The ISUI of provinces from Group Four of the energy efficiency trajectory cluster results differed greatly. The level and path of growth of the industrial structures for Anhui, Guangxi, and Jiangxi were almost identical, and their STEE results were also similar. However, Hainan, which was in the same subgroup as these provinces, had a significantly different performance. The transformation directions of Jilin and Heilongjiang from secondary industries to tertiary industries were exactly the opposite, while their STEE did not show similar patterns. Henan, Hunan, Hubei, Chongqing, Shaanxi, Henan, and Sichuan had an indistinguishable level and path of growth of industrial structure, and their corresponding energy efficiency also showed a similar trajectory; nevertheless, Yunnan, which was in the same subgroup as these provinces, again, performed very differently in terms of the two indices. Gansu and Guizhou had a seemingly synchronized level and path of industrial structure transformation, regardless of whether it was from primary industries to secondary and tertiary industries or from secondary industries to tertiary industries, and their STEE also showed similar characteristics.
Based on the above analysis, it can be concluded that provinces with similar levels of transformation of industrial structures tended to have a higher probability of possessing a similar energy efficiency spatiotemporal trajectory. Particularly, provinces with a similar transformation level from secondary industries to tertiary industries seemed to have a greater probability of comparable STEE.
From the perspective of a single province, the study further analyzed whether the temporal characteristics of industrial structure transformation corresponded with their STEE.
Beijing (from Group One) completed the transformation from the “dual high” quadrant (I) to high GDP per capita and low energy consumption per capita (quadrant IV) in 2011. It can be seen from Figure 5 that after a brief lull in 2010, the ISUI of Beijing reached its second peak in 2011, which corresponded with the high point of its industrial transformation from secondary industries to tertiary industries.
Shandong (from Group Two) had the most frequent shifts in its energy efficiency trajectory. A further analysis showed that its transformation from primary industries to secondary and tertiary industries reached its second highest point in 2004 (1.53). Shandong’s energy efficiency trajectory showed that in 2004, Shandong started to shift from the “dual low” quadrant (III) to the high energy consumption per capita and low GDP per capita quadrant (II), matching the peak of industrial transformation from primary industries as part of the transformation from primary industries to secondary industries, which involved the transformation from low energy-consuming to high energy-consuming industries. In 2008, Shandong shifted from the high energy consumption and low GDP per capita quadrant (II) to the “dual high” quadrant (I), and the ISUI from the transition from secondary industries to tertiary industries reached 0.53, the highest point since the valley point in 2004. Thereafter, there was evident growth in the index. In 2013, Shandong moved into the low energy consumption and high GDP per capita quadrant (IV). These findings suggested that the industrial structural upgrade path of Shandong correlated with the characteristics of its STEE.
Inner Mongolia (from Group Three) had the most frequent changes in its energy efficiency trajectory in the group. Therefore, we used Inner Mongolia as a benchmark for analysis. Inner Mongolia’s transformation index from primary industries to secondary and tertiary industries rose from 1.29 in 1996 to 1.47 in 2002 and remained between 1.49 and 1.55 thereafter; its transformation index from secondary industries to tertiary industries reached the peak value of 0.82 in 2002, followed by a slight downward trend, and an accelerated drop in 2009, at which point, it dropped below 0.60. Correspondingly, the STEE of Inner Mongolia shifted from the “dual-low” quadrant (III) to the high energy consumption and low GDP per capita quadrant (II) in 2002, which could have been affected by the transformation from primary industries to secondary industries. In 2009, its STEE moved to the “dual-high” quadrant (I) and remained at the top position for energy consumption per capita in China between 2007 and 2012, which might have been associated with its high levels of transformation from primary industries and the decline in the transformation from secondary industries. On the whole, the level and development trend of industrial structural upgrade for Inner Mongolia possessed similar characteristics to its STEE.
Based on the comparison of the temporal characteristics of industrial structural upgrades and the STEE of each province, it can be concluded that the development of each province’s level of industrial structure upgrades and STEE presented the same or similar temporal characteristics, indirectly showing that the extent of industrial structure transformation can affect the development of energy efficiency.

4. Conclusions and Recommendations

In this study, the EMEPCI was employed to illustrate the STEE of 30 Chinese provinces between 1996 and 2016, and a spatiotemporal trajectory data processing method in geospatial information science was introduced for a cluster analysis of the energy efficiency trajectories of those provinces. In addition, the ISUI was constructed for each province to further analyze the relationships between the industrial structure and the energy efficiency of each province. The conclusions are as follows:
(1) All 30 provinces showed trends of growth in energy efficiency per capita; however, the growth rate and amplitude differed by province. From a geospatial perspective, the energy efficiency of the eastern regions was higher than that of the western regions, and that of the southern regions was higher than that of the northern regions. From the perspective of an economic region, the Beijing-Tianjin area, the Yangtze River Delta core area (Shanghai, Zhejiang, and Jiangsu), and the radiation region of the Pearl River Delta (Guangdong, Fujian, and Hainan) were in the lead in terms of energy efficiency. In the middle reaches of the Yellow River, including Shanxi and Inner Mongolia, the northwest and southwest regions had lower energy efficiency. Further, the growth trends demonstrated a pattern in which the provinces with higher energy efficiency had higher growth rates, whereas the provinces with lower energy efficiency had lower growth rates.
(2) Adopting GDP per capita as the horizontal axis and energy consumption per capita as the vertical axis, an energy efficiency trajectory quadrant diagram was constructed. The analyses revealed that the majority of the Chinese provinces belonged to quadrant III, where neither energy consumption nor GDP per capita was high, suggesting that most of the provinces and cities were still in the early stages of the development process. Specifically, the southwest region and the regions near the middle reaches of the Yangtze River remained in quadrant III from 1996 to 2016. With the improvement of the urbanization and further development of the economy in these regions, their energy demands are likely to increase correspondingly. Hence, it is necessary to pay attention to the adjustment of the economic development model to avoid the shifting towards quadrants I or II, where the energy consumption is high.
(3) A spatiotemporal trajectory clustering analysis grouped Beijing, Shanghai, and Tianjin into one cluster. The three cities remained in the “dual-high” quadrant for a long period of time and are shifting towards quadrant IV. Guangdong, Jiangsu, Zhejiang, Fujian, and Shandong belonged to Group Two, the trajectory of which was characterized by moving almost directly from the “dual-low” quadrant (III) towards the target quadrant (IV). The common feature of the energy efficiency trajectory of Qinghai, Hebei, Inner Mongolia, Shanxi, Ningxia, Liaoning, and Xinjiang was that they remained in the high energy consumption and low GDP quadrant for a relatively long period of time and immediate changes were required in their development models. The remaining provinces were mainly from the southwest region and the middle reaches of the Yangtze River. These provinces belonged in quadrant III, where both the energy consumption and GDP per capita were low. With the continuing development of the economy and society, they will be confronted with the choice of the direction of their energy efficiency utilization trajectory.
(4) The comparative analysis between the industrial structure upgrade level and the energy efficiency trajectory of the provinces revealed that the provinces with a similar industrial structure transformation level are more likely to have similar spatiotemporal trajectories of energy efficiency. Particularly, provinces with a similar level of transformation from secondary industries to tertiary industries have a greater probability of having a similar spatiotemporal trajectory of energy efficiency. The industrial structure transformation level and development of each province were found to have synchronized temporal features with the development of its spatiotemporal trajectory of energy efficiency, indirectly supporting the argument, therefore, that industrial structure transformation can affect the development of energy efficiency.
Therefore, in order to improve energy efficiency, it is necessary to design a development path of energy efficiency according to the historical trajectory of a province’s energy efficiency and the characteristics of its industrial structure. We propose the following target recommendations.
(1) Currently, the level of transformation of the primary industries of 30 Chinese provinces are higher than that of the secondary industries; hence, each province has its own need and must drive to continue on the path towards economic transformation. With respect to the path toward energy efficiency, different provinces should be given different commendations. Generally, the rest of the provinces of China should learn from the experiences of the provinces in Group 2 (Guangdong, Jiangsu, Zhejiang, Shandong, and Fujian). One of the strategies concluded from the historical experiences analyzed in this study is that every province should readjust its industrial structure, especially to improve the pace of transformation from secondary industries to tertiary industries.
(2) Although Beijing, Shanghai, and Tianjin have relatively better industrial structures and development trends, they still need to further increase their paces of transformation. In particular, the provinces in Group Three, such as Qinghai, Hebei, Inner Mongolia, Shanxi, Ningxia, Liaoning, and Xinjiang, which are still engaging in energy-intensive industries, should change their energy utilization patterns urgently and speed up the transformation of their industrial structures. It is especially crucial to quickly reverse the declining trend of the transformation of secondary industries to tertiary industries.
(3) Regions in the southwest and the middle reaches of the Yangtze River, whose energy efficiency is still in quadrant III, are advised to learn from the economic development paths of provinces such as Guangdong, Jiangsu, Zhejiang, and Fujian to accomplish a direct transition from the low energy consumption and low GDP per capita quadrant (III) to the high energy efficiency quadrant (IV).
(4) There are many aspects to the development of energy efficiency, and more and deeper research is worth exploring continually.

Author Contributions

Y.W. and C.X. conceived of and designed the research; C.X. performed the analyses and prepared the first draft of the manuscript; Y.W. finalized the manuscript; and funding acquisition, L.L., and P.W.

Funding

This research was funded by the China National 863 Program (2006AA06A306), the China National Key Technology R&D Program(2012BAH32B03), Guangdong NSF (S2013010014097, 2017A030310D05, 2017A050501060), and the National Natural Science Foundation of China project (NO.71603248). This is also contribution No. SKLOG2016A03 from SKLOG and No. IS-2617 from GIGCAS.

Acknowledgments

We thank the NASA Earth System for the MODIS products and Guangdong Statistical Bureau for the socio-economic data. Bernard de Jong of Utrecht University and Z. Zhou and H. Greg of Lancaster University are thanked for the comments and corrections. Special thanks are forwarded to the editor of this journal for their editing, which improved the manuscript extensively.

Conflicts of Interest

The authors declare no conflicts of interest.

References

  1. Haltmaier, J. Challenges for the future of Chinese economic growth. Int. Financ. Discuss. Pap. 2013, 1072, 1–32. [Google Scholar]
  2. Yang, W.; Zhao, J. Study on China’s economic development from the perspective of strong sustainability. Singap. Econ. Rev. 2018, 3, 1–32. [Google Scholar] [CrossRef]
  3. Wang, Z.H.; Zeng, H.L.; Wei, Y.M.; Zhang, Y.X. Regional total factor energy efficiency: An empirical analysis of industrial sector in china. Appl. Energy 2012, 97, 115–123. [Google Scholar] [CrossRef]
  4. Zhang, X.P.; Cheng, X.M.; Yuan, J.H.; Gao, X.J. Total-factor energy efficiency in developing countries. Energy Policy 2011, 39, 644–650. [Google Scholar] [CrossRef]
  5. Zhao, Y.; Ke, J.; Ni, C.C.; Mcneil, M.; Khanna, N.Z.; Zhou, N.; Fridley, D.; Li, Q. A comparative study of energy consumption and efficiency of Japanese and Chinese manufacturing industry. Energy Policy 2014, 70, 45–56. [Google Scholar] [CrossRef]
  6. Honma, S.; Hu, J.L. Total-factor energy efficiency of regions in japan. Energy Policy 2012, 46, 216–224. [Google Scholar] [CrossRef]
  7. Huang, J.; Gurney, K.R. The variation of climate change impact on building energy consumption to building type and spatiotemporal scale. Energy 2016, 111, 137–153. [Google Scholar] [CrossRef] [Green Version]
  8. Ahmad, A.; Zhao, Y.; Shahbaz, M.; Bano, S.; Zhang, Z.; Wang, S.; Liu, Y. Carbon emissions, energy consumption and economic growth: An aggregate and disaggregate analysis of the Indian economy. Energy Policy 2016, 96, 131–143. [Google Scholar] [CrossRef]
  9. Hu, J.L.; Lin, C.H. Examining Asymmetric Behavior between Energy Consumption and Economic Growth in Taiwan. Energy Sources Part B Econ. Plan. Policy 2013, 8, 76–85. [Google Scholar] [CrossRef]
  10. Chontanawat, J.; Hunt, L.C.; Pierse, R. Does energy consumption cause economic growth?: Evidence from a systematic study of over 100 countries. J. Policy Model. 2008, 30, 209–220. [Google Scholar] [CrossRef]
  11. Ohlan, R. The impact of population density, energy consumption, economic growth and trade openness on CO2 emissions in India. Nat. Hazards 2015, 79, 1–20. [Google Scholar] [CrossRef]
  12. Qi, Y.; Stern, N.; Wu, T.; Lu, J.; Green, F. China’s post-coal growth. Nat. Geosci. 2016, 9, 564–566. [Google Scholar] [CrossRef] [Green Version]
  13. Shi, J.Z. Supernormal Growth: China’s Economy 1979–2049; Fudan University: Shanghai, China, 2015; pp. 1–11. ISBN 978-1-938134-62-3. [Google Scholar]
  14. Cui, S.; Goldsmith, A.J.; Bahai, A. Energy-efficiency of MIMO and cooperative MIMO techniques in sensor networks. IEEE J. Sel. Areas Commun. 2006, 22, 1089–1098. [Google Scholar] [CrossRef]
  15. Greening, L.A.; Greene, D.L.; Difiglio, C. Energy efficiency and consumption—The rebound effect—A survey. Energy Policy 2000, 28, 389–401. [Google Scholar] [CrossRef]
  16. Patterson, M.G. What is energy efficiency?: Concepts, indicators and methodological issues. Energy Policy 1996, 24, 377–390. [Google Scholar] [CrossRef]
  17. European Union. European Union Action Plan for Energy Efficiency; European Union Commission: Brussels, Belgiu, 2006. [Google Scholar]
  18. Inglesi-Lotz, R.; Pouris, A. Energy efficiency in South Africa: A decomposition exercise. Energy 2012, 42, 113–120. [Google Scholar] [CrossRef] [Green Version]
  19. Repetto, R.; Austin, D. The Costs of Climate Protection: A Guide for the Perplexed; World Resources Institute, Climate Protection Initiative: Washington, DC, USA, 1997. [Google Scholar]
  20. Al-Mansour, F. Energy efficiency trends and policy in Slovenia. Energy 2011, 36, 1868–1877. [Google Scholar] [CrossRef]
  21. Wei, G.; Shuting, X.U. Spatial patterns and coupling relations between energy efficiency and industrial structure in Liaoning province. Acta Geogr. Sin. 2014, 69, 520–530. [Google Scholar]
  22. Wei, Y.M.; Hua, L. Seven energy efficiency indicators and their measurement approaches. China Soft Sci. 2010, 46, 128–137. [Google Scholar]
  23. Liao, H.; Wei, Y.M. China’s energy consumption: A perspective from divisia aggregation approach. Energy 2010, 35, 28–34. [Google Scholar] [CrossRef]
  24. Wu, Y.M. Spatial Econometric Analysis of Energy Efficiency Convergence of Chinese Provinces. In Proceedings of the Asia-Pacific Power and Energy Engineering Conference, APPEEC 2009, Wuhan, China, 27–31 March 2009; IEEE: Piscataway, NJ, USA, 2009; pp. 1–4. [Google Scholar] [CrossRef]
  25. Sun, J.W. Changes in energy consumption and energy intensity: A complete decomposition model. Energy Econ. 1998, 20, 85–100. [Google Scholar] [CrossRef]
  26. Nanni, M. Clustering Methods for Spatio-Temporal Data; University of Pisa: Pisa, Italy, 2002. [Google Scholar]
  27. Naftel, A.; Khalid, S. Classifying spatiotemporal object trajectories using unsupervised learning in the coefficient feature space. Multimed. Syst. 2006, 12, 227–238. [Google Scholar] [CrossRef]
  28. Virrantaus, K. Space–time density of trajectories: Exploring spatio-temporal patterns in movement data. Int. J. Geogr. Inf. Sci. 2010, 24, 1527–1542. [Google Scholar]
  29. Gong, X.; Pei, T.; Sun, J.; Luo, M. Review of the research progresses in trajectory clustering methods. Prog. Geogr. 2011, 30, 522–534. [Google Scholar]
  30. Wang, Y.; Lim, E.P.; Hwang, S.Y. On mining group patterns of mobile users. Lect. Notes Comput. Sci. 2003, 2736, 287–296. [Google Scholar]
  31. Laube, P.; Imfeld, S. Analyzing Relative Motion within Groups of Trackable Moving Point Objects. In Proceedings of the Geographic Information Science, Second International Conference, GIScience, Boulder, CO, USA, 25–28 September 2002; DBLP2002; Springer: Berlin, Germany, 2002; pp. 132–144. [Google Scholar]
  32. Tan, P.N.; Steinbach, M.; Kumar, V. Introduction to Data Mining; Addison-Wesley Longman Publishing, Co. Inc.: Boston, MA, USA, 2005; Volume 18, pp. 86–103. ISBN 0321321367. [Google Scholar]
  33. Agrawal, R.; Faloutsos, C.; Swami, A.N. Efficient Similarity Search in Sequence Databases. In Proceedings of the International Conference on Foundations of Data Organization and Algorithms, Chicago, IL, USA, 13–15 October 1993; Volume 730, pp. 69–84. [Google Scholar] [CrossRef]
  34. Wang, Q.; Zheng, Y.; Wu, S.; Li, T. Mechanism of energy efficiency response to industrial restructuring and energy consumption structure change. Acta Geogr. Sin. 2011, 66, 741–749. [Google Scholar]
  35. Sadriev, A.R. World Patent Practice Analysis in the Area of Energy-Efficient and Energy-Saving Technologies. Mediterr. J. Soc. Sci. 2014, 5, 283–288. [Google Scholar] [CrossRef]
  36. Pollio, G.; Uchida, K. Management background, corporate governance and industrial restructuring: The Japanese upstream petroleum industry. Energy Policy 1999, 27, 813–832. [Google Scholar] [CrossRef]
  37. Shaozhi, Z.; Zhihui, H. An Empirical Study on Industry Structure and Economic Growth-Based on the analysis of China, Guangdong and Guangzhou. Rev. Ind. 2011, 5, 55–60. [Google Scholar]
Figure 1. The spatiotemporal trajectory of energy efficiency (STEE) examples of Beijing and Guangdong.
Sustainability 10 04582 g001
Figure 2. Changes in the GDP and the energy consumption per capita of each province. The acronyms represent the names of the provinces as follows: BJ—Beijing; TJ—Tianjing; HEB—Hebei; SX—Shanxi; NMG—Inner Mongolia; LN—Liaoning; JL—Jilin; HLJ—Heilongjiang; SH—Shanghai; JS—Jiangsu; ZJ—Zhejiang; AH—Anhui; FJ—Fujian; JX—Jiangxi; SD—Shandong; HEN—Henan; HB—Hubei; HN—Hunan; GD—Guangdong; GX—Guangxi; HAN—Hainan; CQ—Chongqing; SC—Sichuan; GZ—Guizhou; YN—Yunnan; SHX—Shaanxi; GS—Gansu; QH—Qinghai; NX—Ningxia; and XJ—Xinjiang.
Sustainability 10 04582 g002aSustainability 10 04582 g002b
Figure 3. Changes in energy efficiency per capita of the 30 provinces.
Sustainability 10 04582 g003
Figure 4. Quadrant chart of the energy efficiency development trajectory of the four provincial groups.
Sustainability 10 04582 g004
Figure 5. The change of industrial structure upgrading index (ISUI) of each province.
Sustainability 10 04582 g005

