Article

Building Integrated Shading and Building Applied Photovoltaic System Assessment in the Energy Performance and Thermal Comfort of Office Buildings

by
Georgios Martinopoulos
1,2,*,
Anna Serasidou
1,
Panagiota Antoniadou
2 and
Agis M. Papadopoulos
2
1
School of Science and Technology, International Hellenic University, 14th km Thessaloniki-Moudania, EL57001 Thermi, Greece
2
Process Equipment Design Laboratory, Department of Mechanical Engineering, Aristotle University of Thessaloniki, POB 487, EL 54124 Thessaloniki, Greece
*
Author to whom correspondence should be addressed.
Sustainability 2018, 10(12), 4670; https://0-doi-org.brum.beds.ac.uk/10.3390/su10124670
Submission received: 29 October 2018 / Revised: 2 December 2018 / Accepted: 4 December 2018 / Published: 7 December 2018

Abstract

:
Non-residential and more specifically office buildings are, nowadays, an integral part of the building stock and milestones of urban areas in most of the developed and developing countries all over the world. Compared to other building types, office buildings present some of the highest specific energy consumption rates. In the present study, a typical nine-story office is assessed for a number of different building integrated retrofitting measures. Measurements of indoor environmental conditions were used in order to validate the developed simulation model of the building in EnergyPlus. Then, a number of different building integration options for photovoltaic systems and shading options are examined, in order to evaluate the best option in terms of indoor air quality, thermal comfort and energy consumption. The amount of electricity produced can meet 65% of the building’s annual electricity requirements, while the shading options can reduce energy requirements by as much as 33%. Although this in not a value that can be dismissed easily, it becomes clear that further—and more deeply aiming—measures are needed, if the building is to achieve near zero energy status.

1. Introduction

The building sector is responsible for nearly 40% of the annual final energy consumption [1]. The existing non-residential buildings are noted among its main consumers, with office buildings accounting for almost 23% of the total [2]. Commercial buildings and more specifically office buildings are, nowadays, an integral part of the building stock and milestones of urban areas in most of the developed and developing countries all over the world. Compared to other building types, office buildings present some of the highest specific energy consumption rates. Along with technological development and extended office equipment and appliances in the workplace, came an immense growth in energy demand. It is estimated that the annual consumption in office buildings in the European Union (EU) ranges between 100 and 1000 kWh/m2 [3]. The exact consumption depends mainly on the building’s location, on its envelope design, on the quality and efficiency of Heating, Ventilation and Air Conditioning (HVAC) systems and lighting, on office equipment and, eventually, on operational schedules and modes, along with the energy and environmental attitude of the building’s occupants.
In order for this type of buildings in the EU to comply with the Energy Performance of Buildings Directive (EPBD) and 2020 targets [4,5], apart from the construction of new, Nearly Zero Energy Buildings (NZEB), there is a great need for refurbishment of the building stock, including the extended use of renewable energy technologies for covering their energy demand. Apart from achieving the goals set by the EU regarding energy efficiency and the reduction of energy demand, special care should be given to ensuring indoor air quality and thermal comfort conditions, to ensure the best possible indoor environmental quality for the occupants.
A number of different strategies are available for renewable energy generation in a dense urban environment with multi-story buildings and limited roof space [6,7,8]. Facades offer, however, another surface with great potential for the integration of solar energy conversion technologies, both for new and existing buildings, with the added benefit of allowing for a seamless integration of renewable energy conversion systems in the building envelope, providing a low intrusion and aesthetically pleasing solution [9,10].
Based on the existing legislative framework, as described by the EPBD, the older 2002/91/EC [11], the current valid 2010/31/EU [4] and the new 2018/844/EU [12], the establishment of a comfortable work environment is of paramount importance, as it greatly affects its users and improves their well-being and productivity. Therefore, except for the implementation of strategies that upgrade the energy efficiency of a building, the comfort and well-being of the occupants’ should not be overlooked. To this end, many studies have indicated that for achieving a holistic evaluation of an existing building the evaluation of comfort should be considered. Yang et al. and Lombard et al. indicated that the energy consumption of buildings has a great impact on the building’s performance and on its users’ comfort [13,14]. Others, like Rupp et al. [15] and Antoniadou et al. [16] emphasized the importance of considering the human perspective in the evaluation process of a building case in order to achieve a firm evaluation.
The implementation of indoor monitoring for the determination of indoor environment conditions is nowadays widely applied, with the researchers focusing on specific thermo physical parameters. Main aspects of indoor monitoring include one or more of the following; air temperature [17,18], relative humidity [19], air velocity [20,21,22,23], globe temperature [24,25], CO2 concentration levels, lighting and glare conditions, and noise levels [26,27,28,29]. Depending on the type and size of the building, thermal comfort conditions are monitored through the Predicted Mean Vote (PMV) and Predicted Percentage of Dissatisfaction (PPD) indexes, for determining the thermal sensation and the percentage of dissatisfaction of the occupants, respectively [30,31,32]. Therefore, information regarding the indoor environmental conditions can be collected and combined with data of the external environment which in turn can lead to a holistic evaluation of the existing environmental conditions
Selecting suitable retrofitting measures in order to improve the thermal comfort conditions and the energy performance of a building at the same time can prove a challenging task [33]. Therefore, apart from actual monitoring the indoor environmental conditions, building energy simulation software is nowadays an indispensable tool for designers, engineers, and constructors, in order to decide upon and complete a retrofitting project, and deal with any uncertainty or risk that may arise during their assessment [34,35].
Several simulation programs are available and are utilized in research studies and real case applications. They can model a wide range of variables dynamically affecting energy performance in addition to calculate energy, cost, and environmental factors by taking into account both external and internal conditions, materials, systems, thermal, and visual comfort criteria [36]. Design decisions taken in the early construction or retrofitting phases of an office building can have a large impact on its energy performance. Appropriate building form, orientation, type of materials used, room dimensioning, and walls to windows ratio are some of the factors that can affect the building’s energy consumption and equally affect the occupants’ productivity [37].
To that end in the current study, the energy performance and indoor air quality of a typical nine-story office building in the center of Thessaloniki, Greece is assessed for a number of different building integrated retrofitting measures. Measurements of indoor environmental conditions were undertaken for two weeks (one during heating and one during the cooling period), and the data is used in order to validate the developed simulation model of the building in EnergyPlus. It must be noted, that as simulation models cannot account in an objective way for the preferences of occupants, the results regarding thermal comfort indices can be considered only indicative. A number of different building integration shading systems and options for photovoltaic system applications are examined, in order to evaluate the best option in terms of indoor air quality, thermal comfort, and energy consumption.

2. Materials and Methods

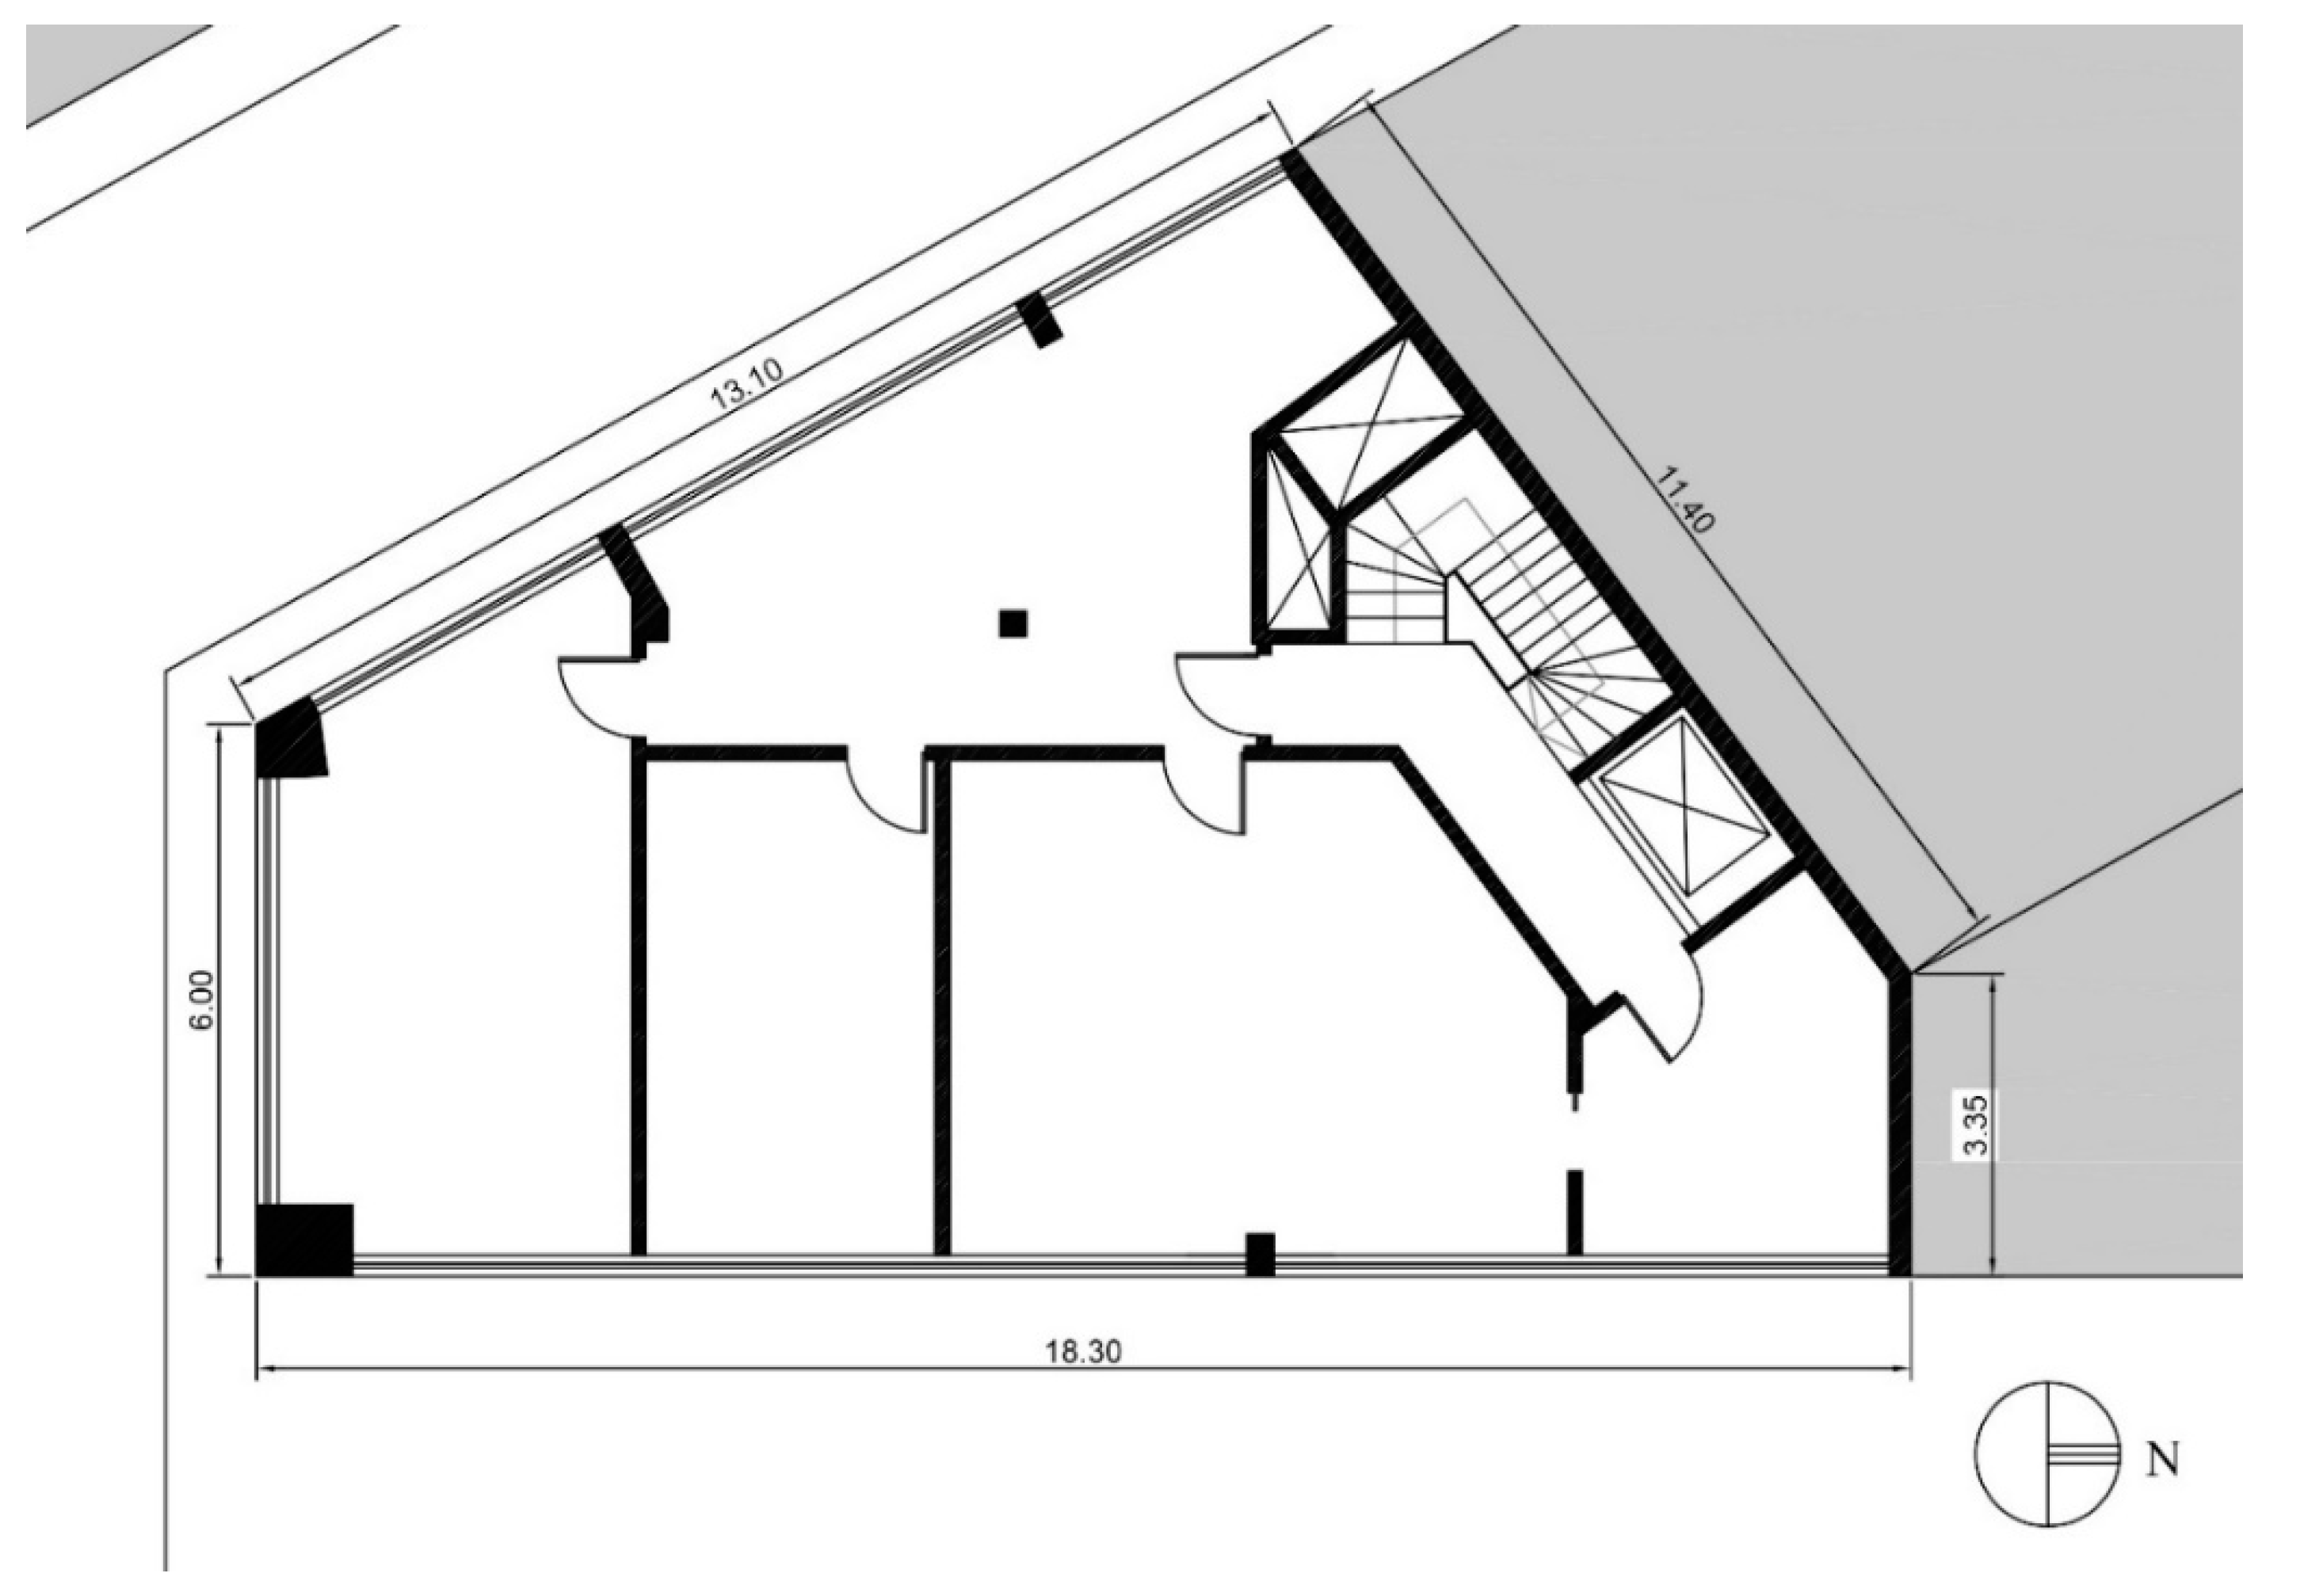
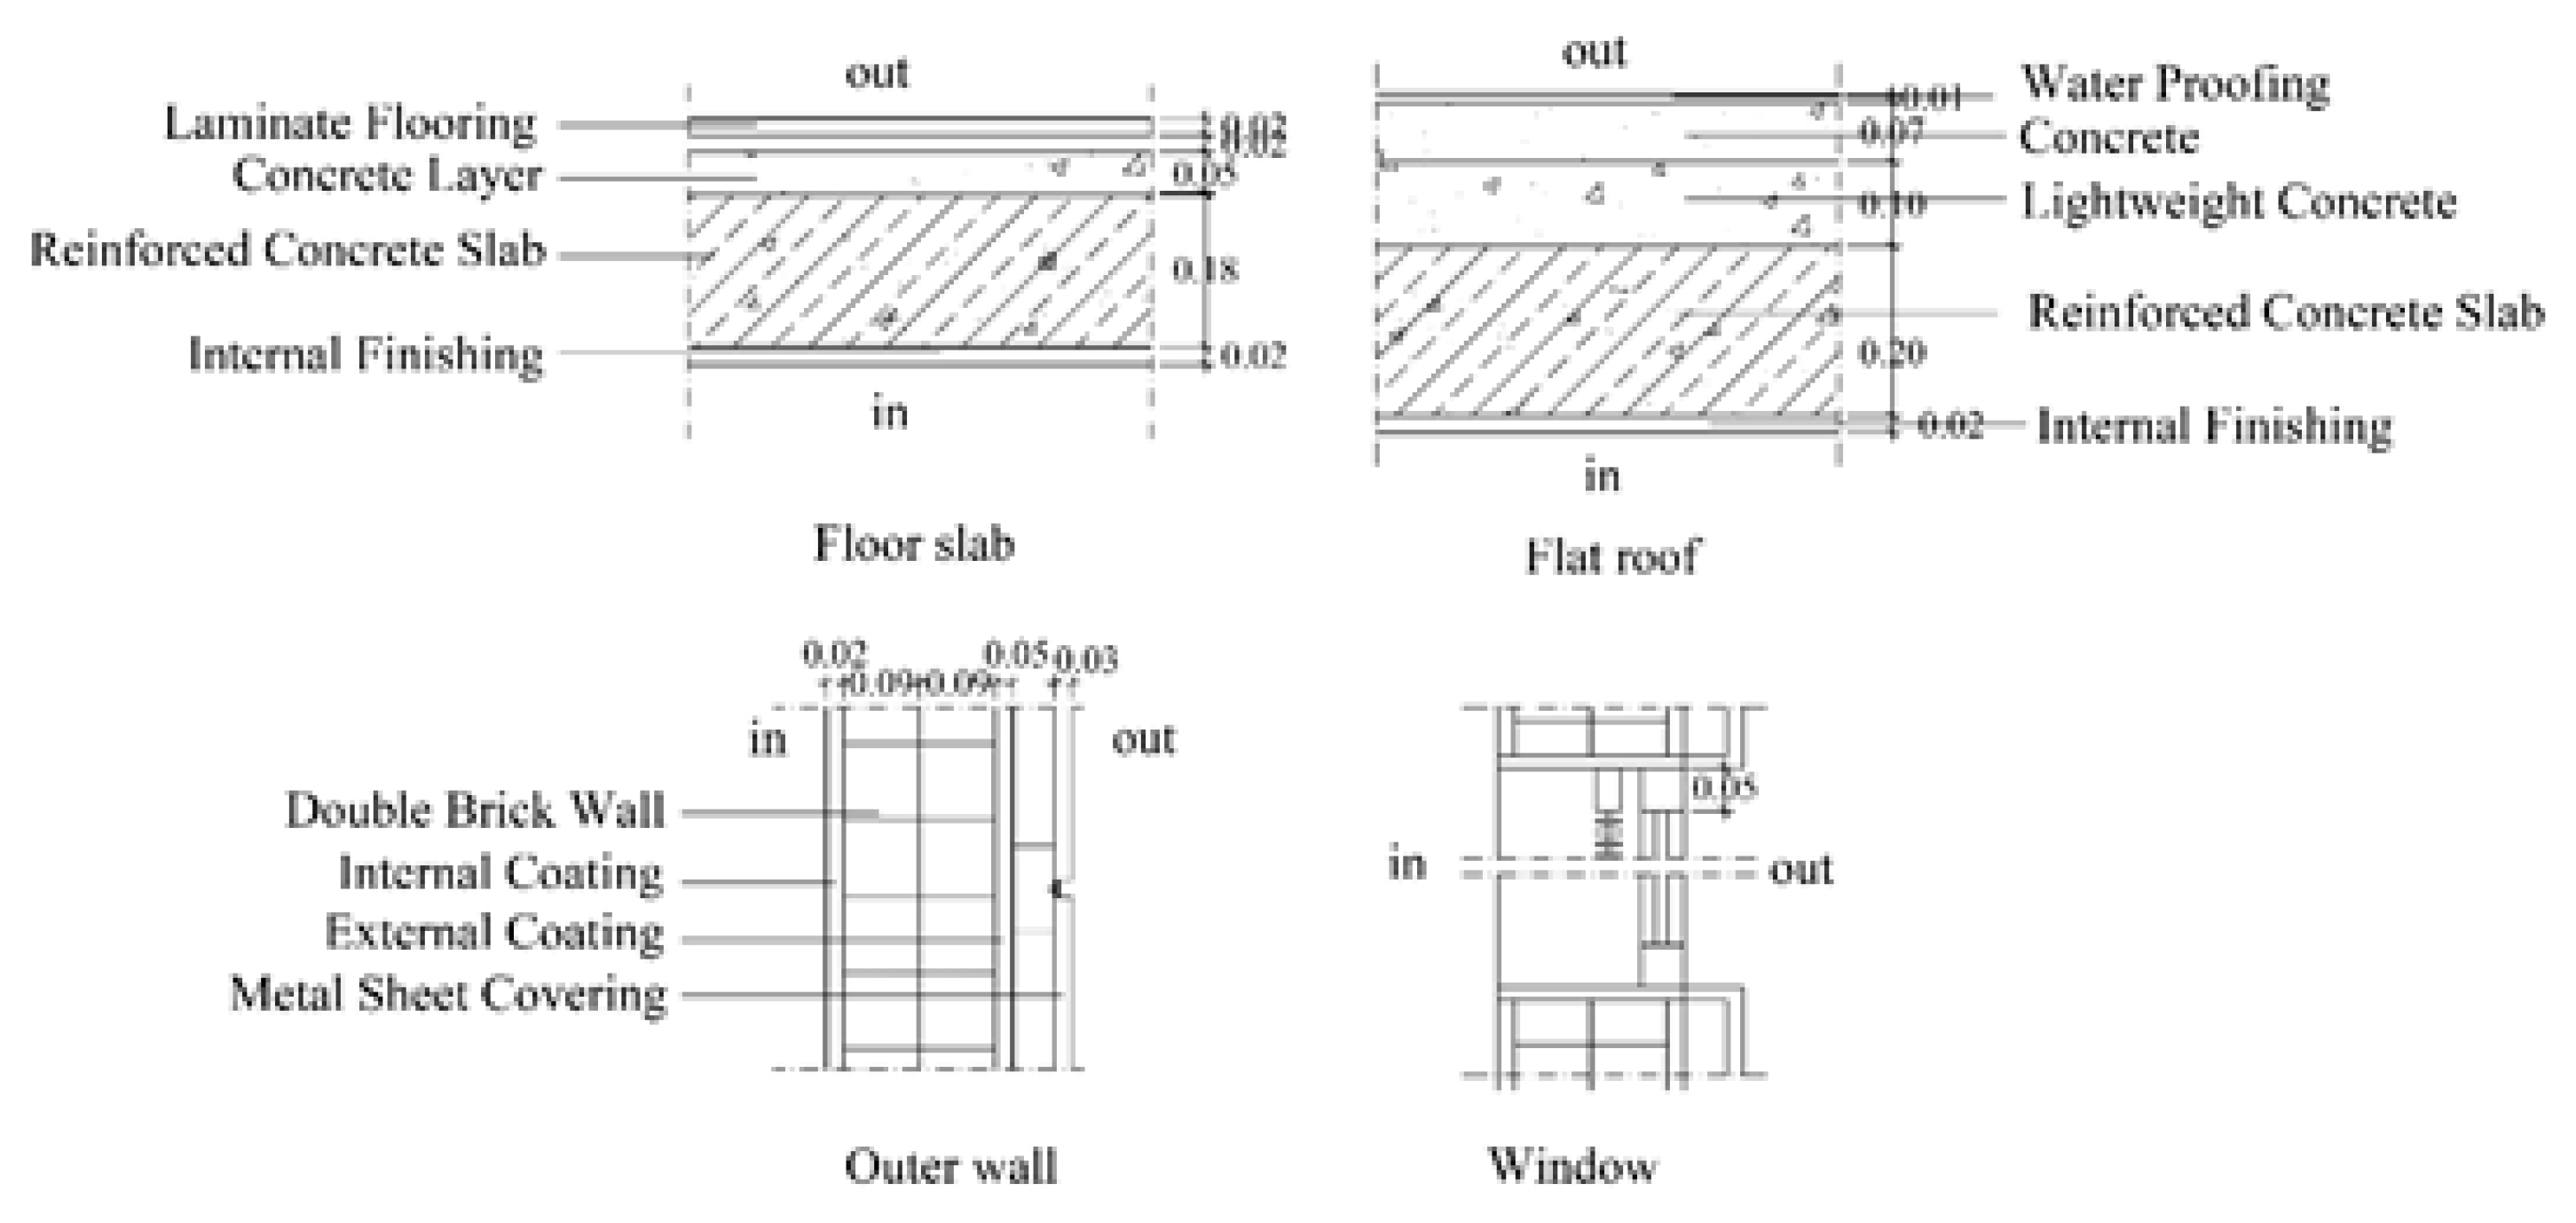
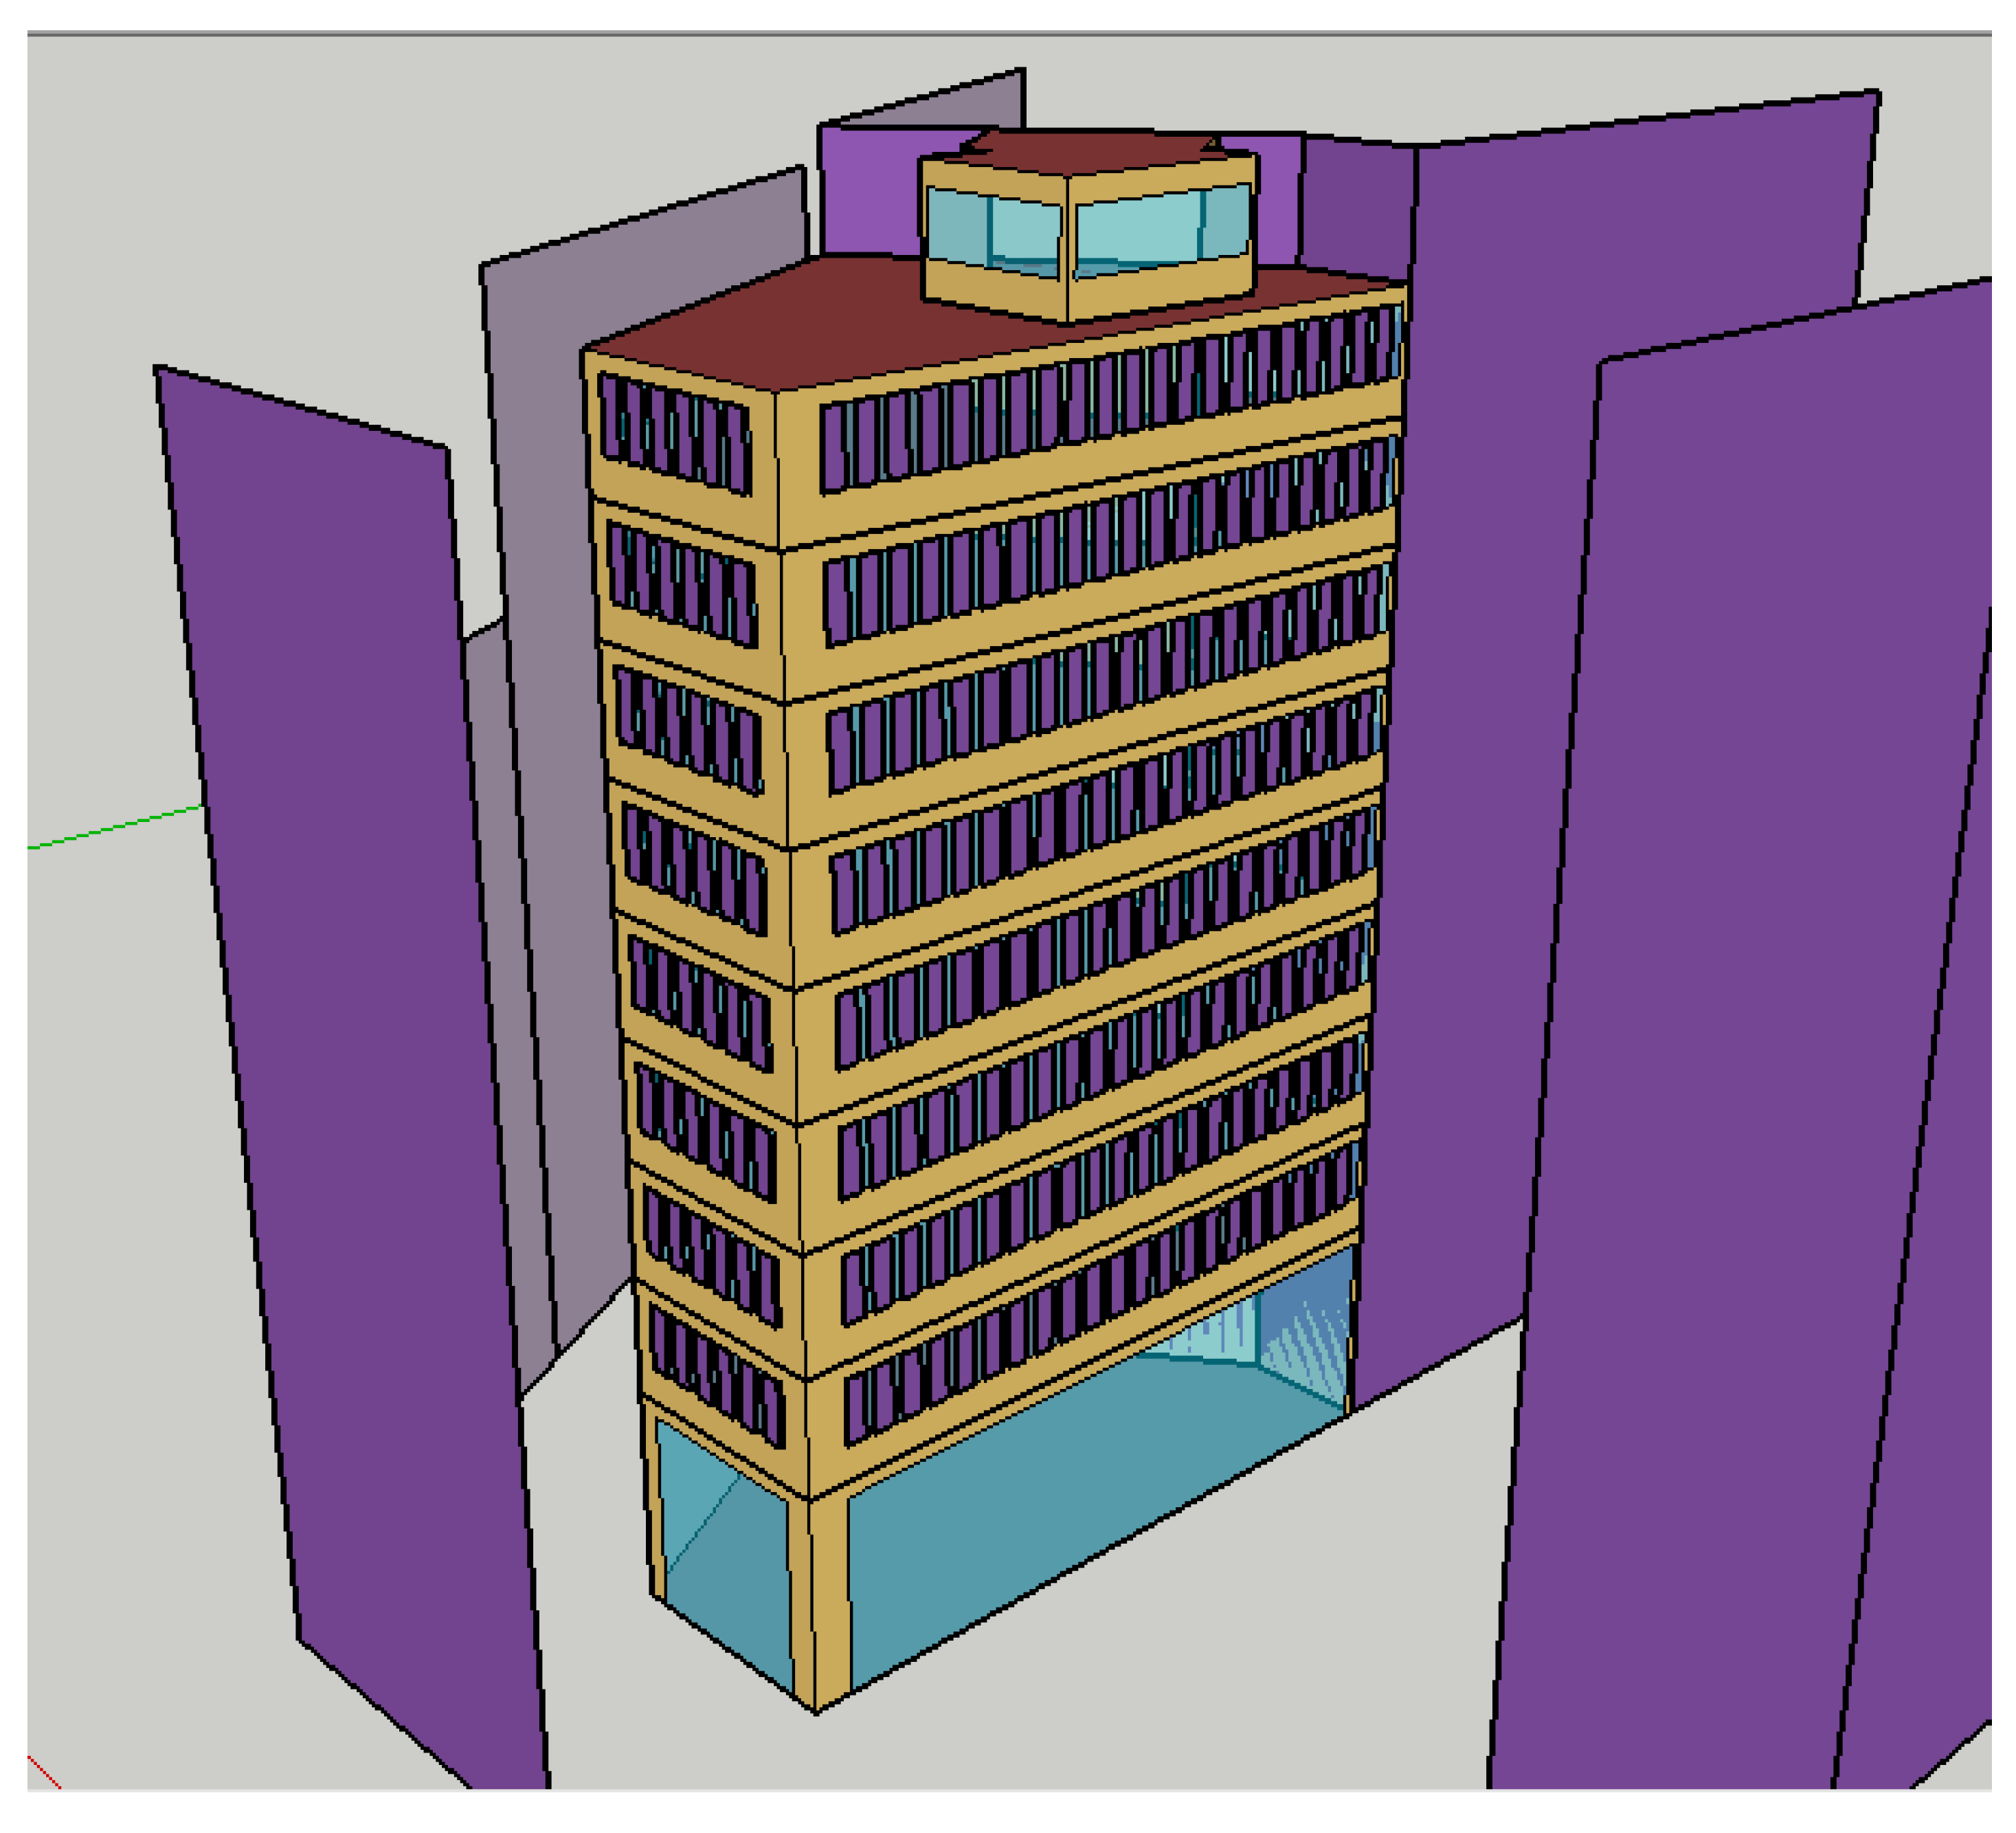
2.1. Office Building Description

According to the Hellenic Statistical Authority the majority of buildings, almost 60% [38], were constructed before 1980, resulting in them having very poor energy performance, leading to high energy losses through their envelopes and a lack in the utilization of state of the art HVAC equipment. During their lifetime, these buildings need several, minor or major retrofits, along with regular maintenance, as they experience degradation by aging, unexpected damages, or have outdated building components and techniques [39].
The main building typology that prevails in Greek urban areas, regardless of climatic conditions, is the high-rise building. According to the official data, mixed use high-rise buildings in the Municipality of Athens and Thessaloniki (the two large metropolitan areas in Greece) with dominating office usage is approximately 8% [40]. Typical construction material, in almost 65% of the cases, is reinforced concrete. The building envelopes consist of brick masonries with double brick cavity walls and extended glazing surfaces, where office use is dominant. Greek urban buildings present a significant heat storage capacity, which combined with increased external and internal loads during the cooling period and the lack of night-time ventilation and other cooling options, can lead to overheating of the interior, as heat cannot dissipate easily. Almost 40% of the high-rise urban buildings have flat roofs [38] that provide a great potential for solar systems or even for micro-wind generators. In that sense, although the older, uninsulated flat roofs account for significant losses and poor comfort conditions for the top floors throughout the year, they create ideal spaces for the integration of renewable energy utilization systems.
To that end, a typical nine-story office building in the center of Thessaloniki, Greece is used as a case-study in order to assess the energy performance, thermal comfort conditions, and make a proposal of retrofitting measures, encompassing a higher performance building envelope with the integration of BIPV systems.
The reference office building is located in the densely built center of Thessaloniki and it was constructed in 1968. It is a semi-detached building with a net surface of 1488 m2 and a volume of 4300 m3. It consists of a basement with storage spaces, a ground floor with a reception area, storage spaces and a server room, eight upper levels with offices, and a ninth mechanical and storage floor.
The shape of the building is an irregular pentagon, elongated along the N-S axis. It occupies a corner plot and is adjacent to two other office buildings on its north and northeast sides, while being detached in the three remaining facades. Each level is 3 m high, making the total height of the building 30 m.
The total heated surface of the building is 1000 m2, split among the 1st to 8th floor, as presented in Table 1. The unheated surface of the building is 488 m2, distributed in the basement, the ground floor, the 9th floor, and the staircase and elevator area in each of the eight office floors of the building. The floor plan of a typical level is presented in Figure 1.
The building materials used were the typical ones in Greece for high-rise buildings during its construction era. The bearing structure is of reinforced concrete, and the outer walls are double brick masonries with no insulation. The facades are externally cladded with composite panels; the panels consist of aluminum sheets 3 mm thick, supported by a metallic structure allowing a gap of approximately 50 mm between the external wall and the cladding.
The building is equipped with sliding aluminum windows, covering approximately 65% of the building’s façade, with double glazing and no thermal or sound insulation in their frame. The shading of the glazing is achieved only internally by horizontal wooden blinds in 75% of the offices and by curtains in the rest.
The interior materials of the offices are also typical, with painted, single brick interior walls and laminate flooring. The specific building element characteristics are summarized in Table 2 along with their maximum values as described in the relevant legislation [41], followed by their typical sections in Figure 2.
The heating of the office building is achieved with a central natural-gas-fired boiler coupled with radiators distributed among the offices, with a nominal capacity of 349 kW and a seasonal performance of 1.015, as per common practice in Greece [42]. The heating system operation schedule is from Monday to Friday, 07:00–19:00, based on the daily office operation schedule. The heating system is connected to a central thermostat.
For cooling purposes, split-type air conditioning units are utilized and mounted on the walls of each office. Most of the units have a 5 kW cooling capacity (with a typical EER of 3.23 and a SEER of 3.69). These units are manually operated by the occupants of each office, thus, there are no standard set points, but in general the temperature is never set below 26 °C. There is no mechanical ventilation system in the office building, as was the usual practice in Greek office buildings until very recently and only natural ventilation through the building’s windows enables the fresh external air to enter the building [43,44].
The lighting of the offices and the hallways is achieved by fluorescent ceiling lights, which are manually operated depending on occupancy or illuminance.
Regarding the office equipment, an in-situ survey was conducted, through observation and interviews with the staff, in order to record the installed equipment’s capacity and analyze its use by users and the operating hours of the equipment during working days, along with their overall behavior considering the use of energy. The results of this survey revealed that the operating hours of the active appliances conform to the building’s operating schedule.
Based on historical data collected from the building’s utility bills, from 2012 to 2016, the annual electricity consumption is on average 92,310 kWh. The mean annual energy consumption is 62.03 kWh/m2, while the respective value per heated area, in each of the eight typical heated floors, is 92.31 kWh/m2.

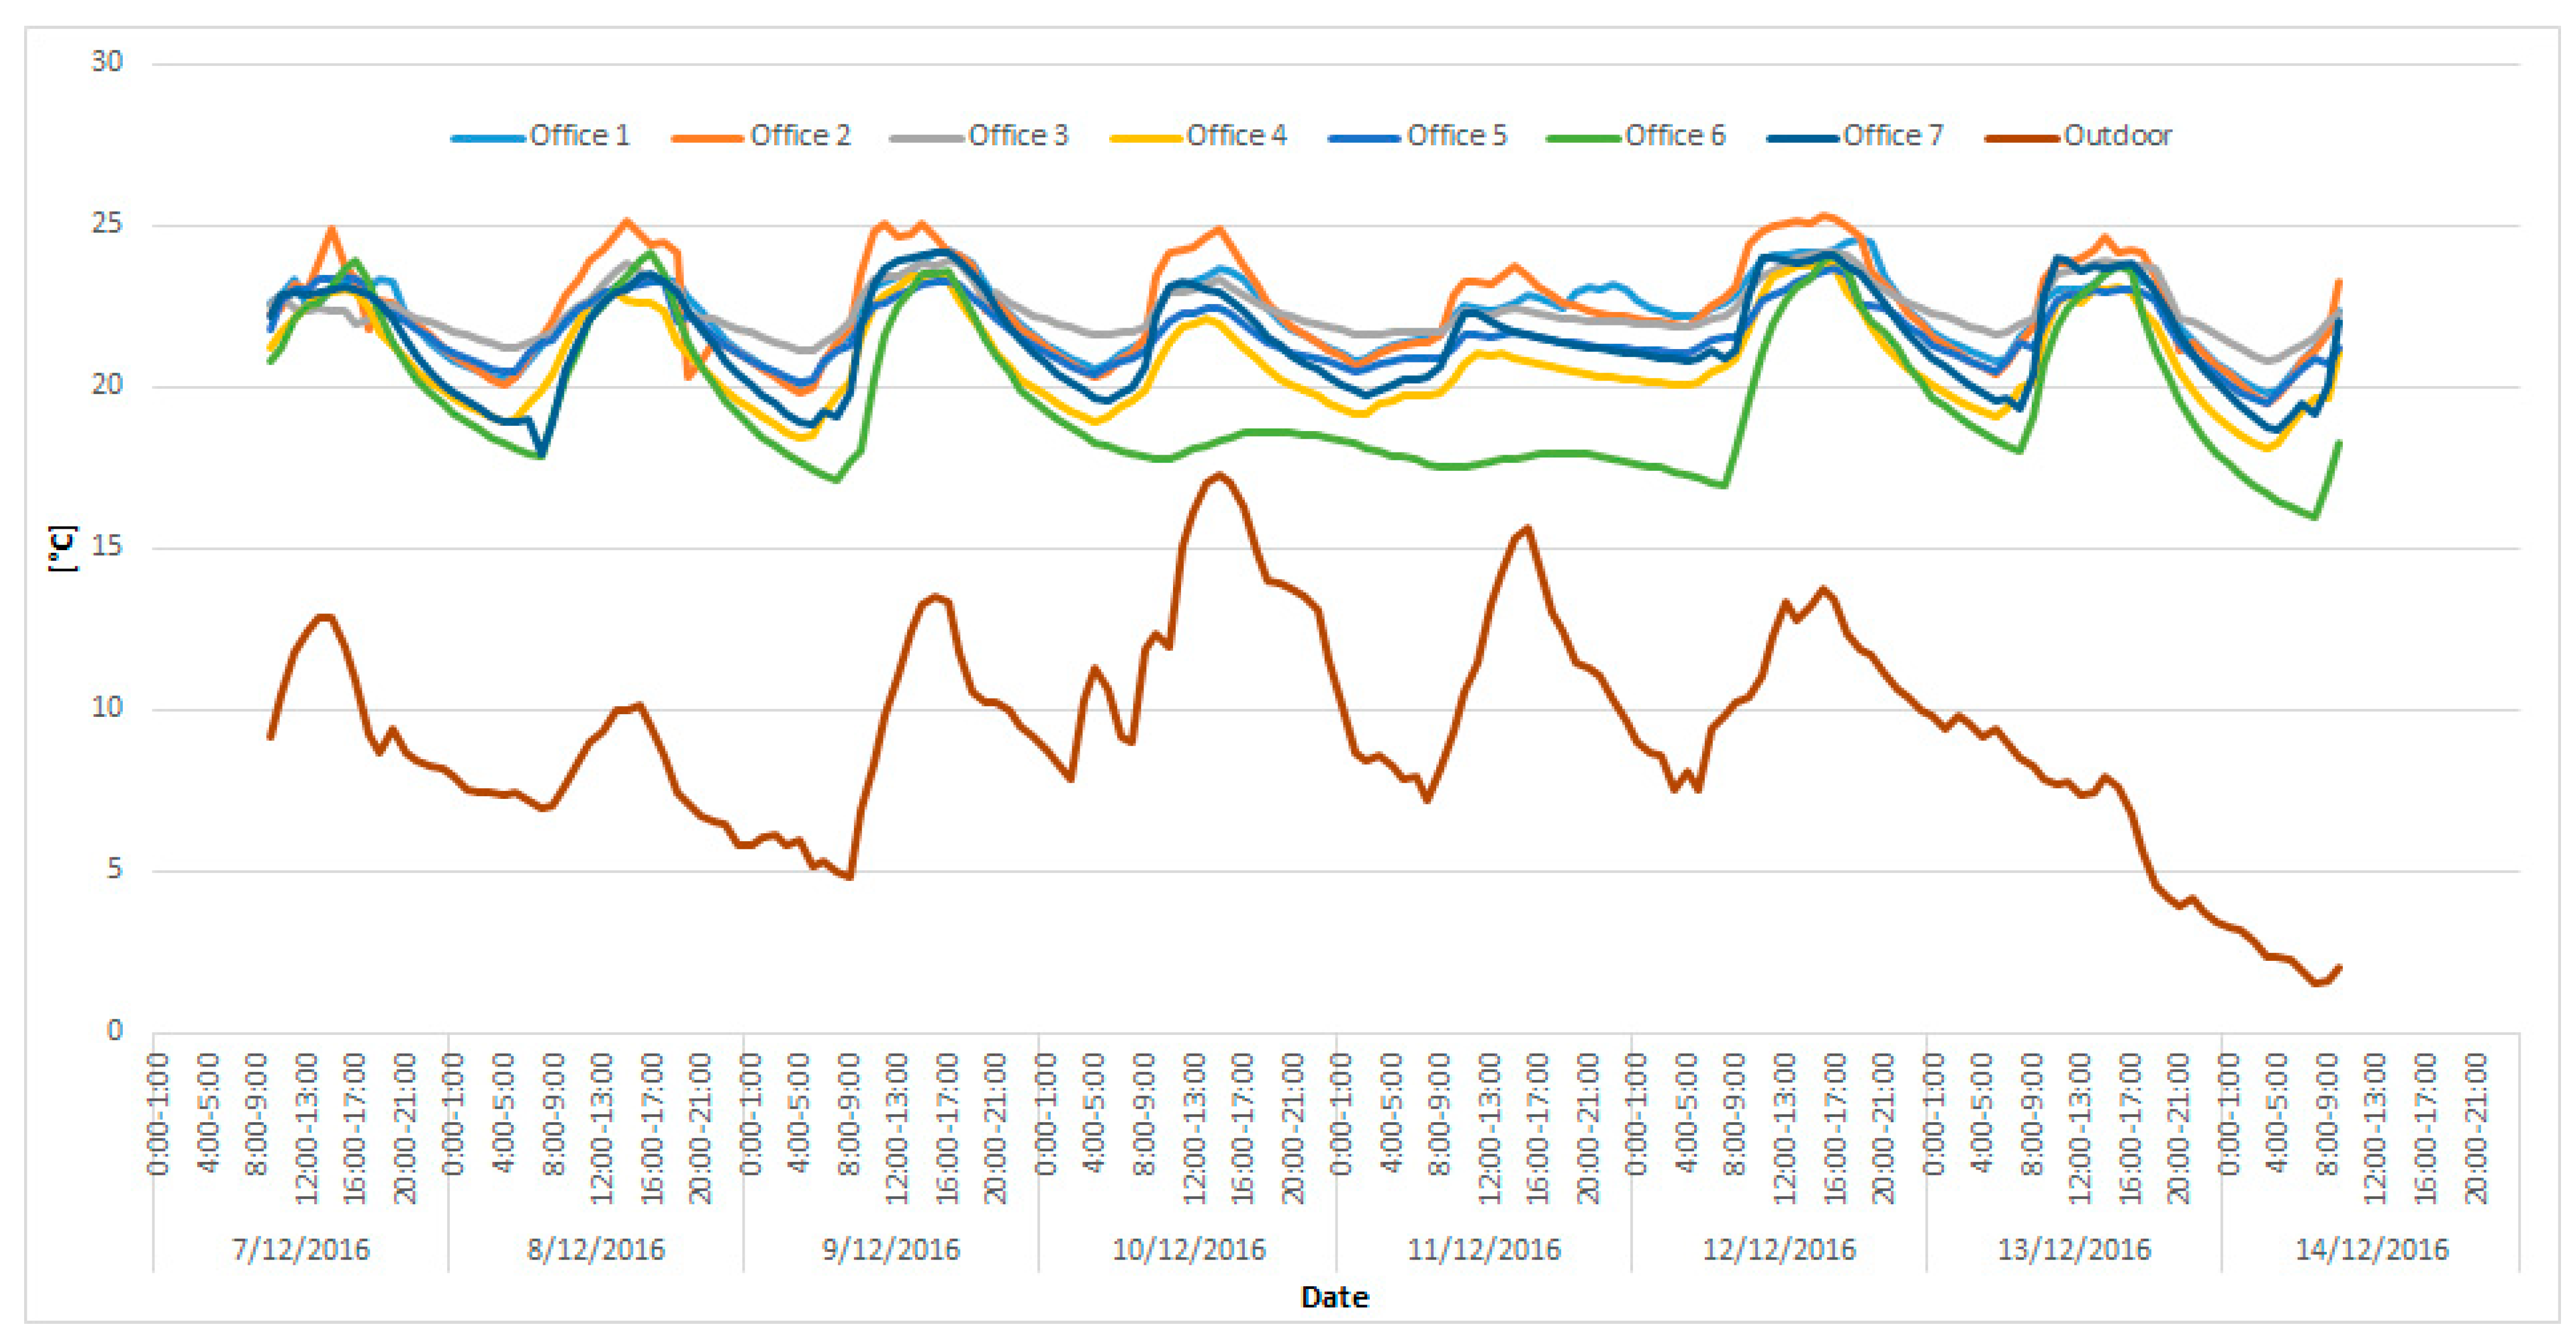
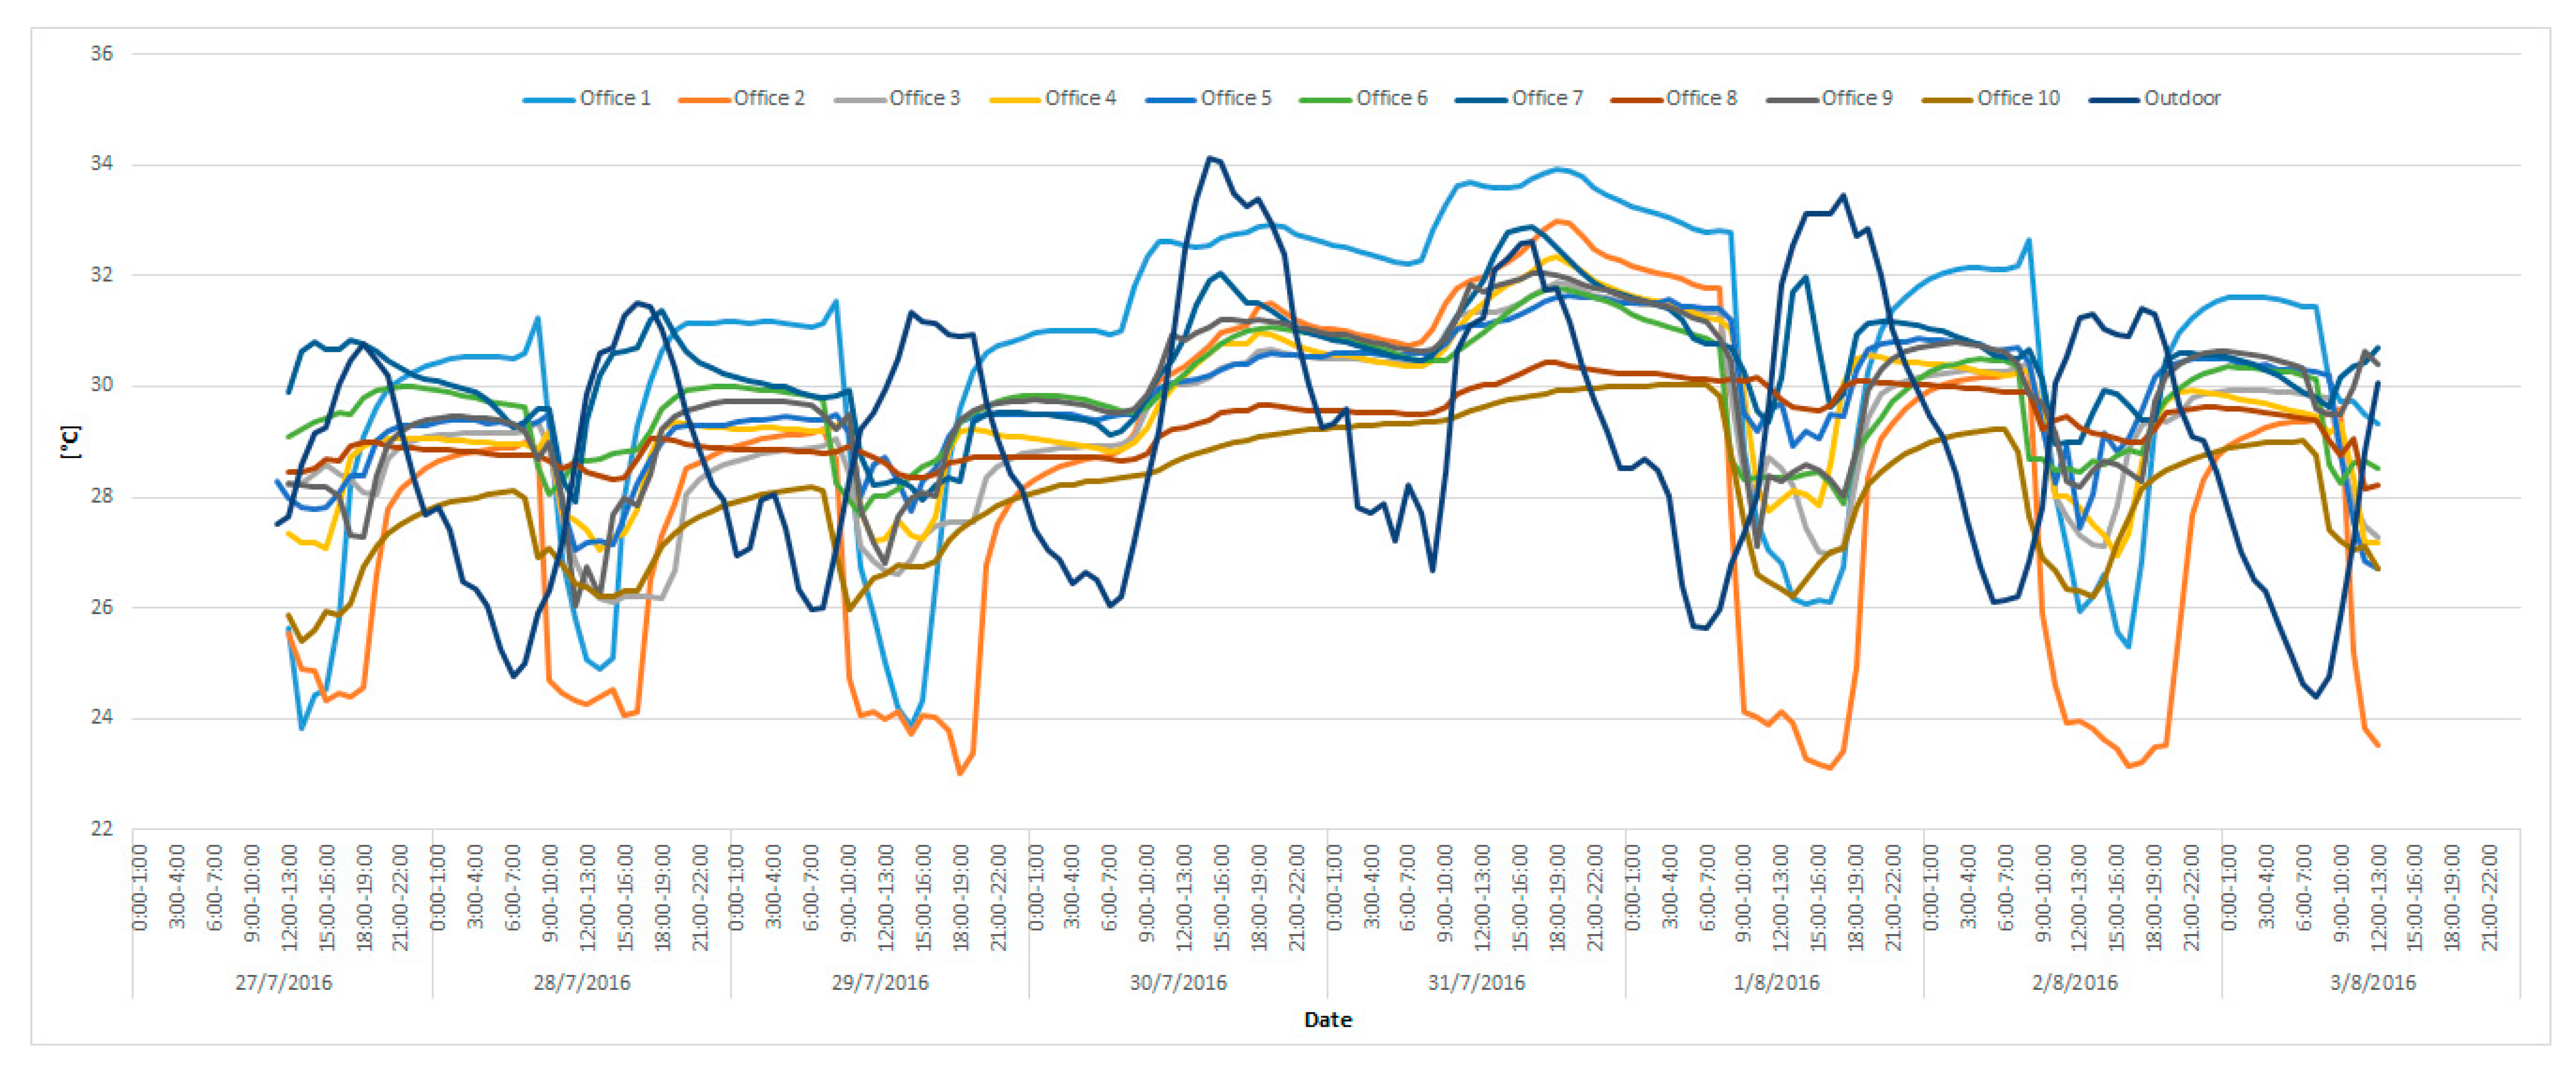
2.2. Environmental Measurements

In order to determine the indoor and outdoor environmental conditions an in-depth monitoring of a variety of thermophysical parameters was carried out with the use of dedicated equipment. For the outdoor conditions, relative humidity, ambient temperature, wind speed and direction as well as solar irradiance was measured with a dedicated meteorological station on site, while for the indoor environmental conditions a HOBO UX100-003 and a TESTO 480 with air temperature, relative humidity (RH), globe thermometer, indoor air quality (IAQ) sensor and a comfort sensor were utilized, determining both PMV and PPD indexes. In more detail, the PMV and PPD indexes were determined according to ISO 7730 considering the aforementioned parameters as well as clothing and metabolic rate. The metabolic rate was set to 70 W/m², while the values for clothing were set at 0.6 clo and 1.1 clo for the summer and winter period, respectively [45,46]. The technical specifications of the measurement equipment are presented in Table 3.
The measurements were carried out for a week, both during the winter and summer period of 2016; sensors were placed in representative office areas, to achieve a reliable and valid indoor environment evaluation. Typical office areas were chosen, which were continually occupied during the measurement periods and the sensors were placed in accordance with the requirements of the ISO 7726 standard [31]. However, the monitoring of CO2 measures and PMV/PPD indices occurred only in one office. This area was chosen as the most representative regarding its structural and architectural characteristics, as well as its occupants’ density.
Inside and outside air temperature measurements are presented in Figure 3 and Figure 4, in detail. The air temperature levels during office hours vary from 19 °C to 25 °C, demonstrating a comfortable indoor work environment for the occupants during winter. During the summer period, temperature levels ranged from 23 °C to 34 °C, with the highest temperature exhibited during the weekend, as the HVAC system does not operate. In general, the indoor conditions, when the cooling systems are in operation can be thought of as able to achieve comfortable work environment conditions.
In addition to the air temperature, the indoor air quality conditions were also evaluated. This was done by measuring and monitoring CO2 levels, as its concentration constitutes a representative index of air quality. As outlined in Annexes B and C of ASHRAE 62.1:2013, a maximum stable concentration level of CO2 at 700 ppm above the outdoor levels is recommended, as it ensures a comfortable and widely acceptable IAQ [32]. Considering that accepted levels of CO2 concentration of the external environment vary from 300 to 500 ppm, a level of 1000 to 1200 ppm as maximum indoor concentration is recommended, based on the literature [32].
As it can be seen in Figure 5, CO2 concentration levels vary during the week. During winter, the measured CO2 levels vary from 400 ppm in the morning to 1000 ppm at noon, which according to EN15251 correspond to Category V. The office area where the CO2 sensor is placed has two permanent occupants and is frequently ventilated. During summer, the analysis of measurements indicates that the CO2 levels during office hours fluctuate at lower levels corresponding to a category of II and III based on EN 15251. This differentiation between winter and summer measurements is a result of the prevailing micro-climate conditions.
The final parameter under evaluation is thermal comfort, with its conditions expressed by the PMV/PPD index. During the measurement period, the PMV index varies from −0.40 to 0.50 during winter and from 0.70 to 2.20, during the summer period corresponding to the II and III or even IV category based on ISO 15251, respectively (Figure 6).
In winter, the minimum values are monitored during early morning while the highest at 5:00 pm denoting preferable indoor environment conditions during office hours. During the cooling period, despite the use of cooling systems, the value of PMV index is quite high compared to the values monitored in winter.
The highest values are met when the cooling system is not operating; during office hours and whenever the cooling system is in operation, the PMV values indicate preferable indoor work environment conditions. Occasionally and for brief spells, an increase of the PMV index is monitored, which affects, as expected, the PPD index; however, even in those monitored, the environment conditions can be considered as appropriate for work.
Finally, in Figure 7, the mean radiant temperature is presented for the heating and cooling periods respectively.

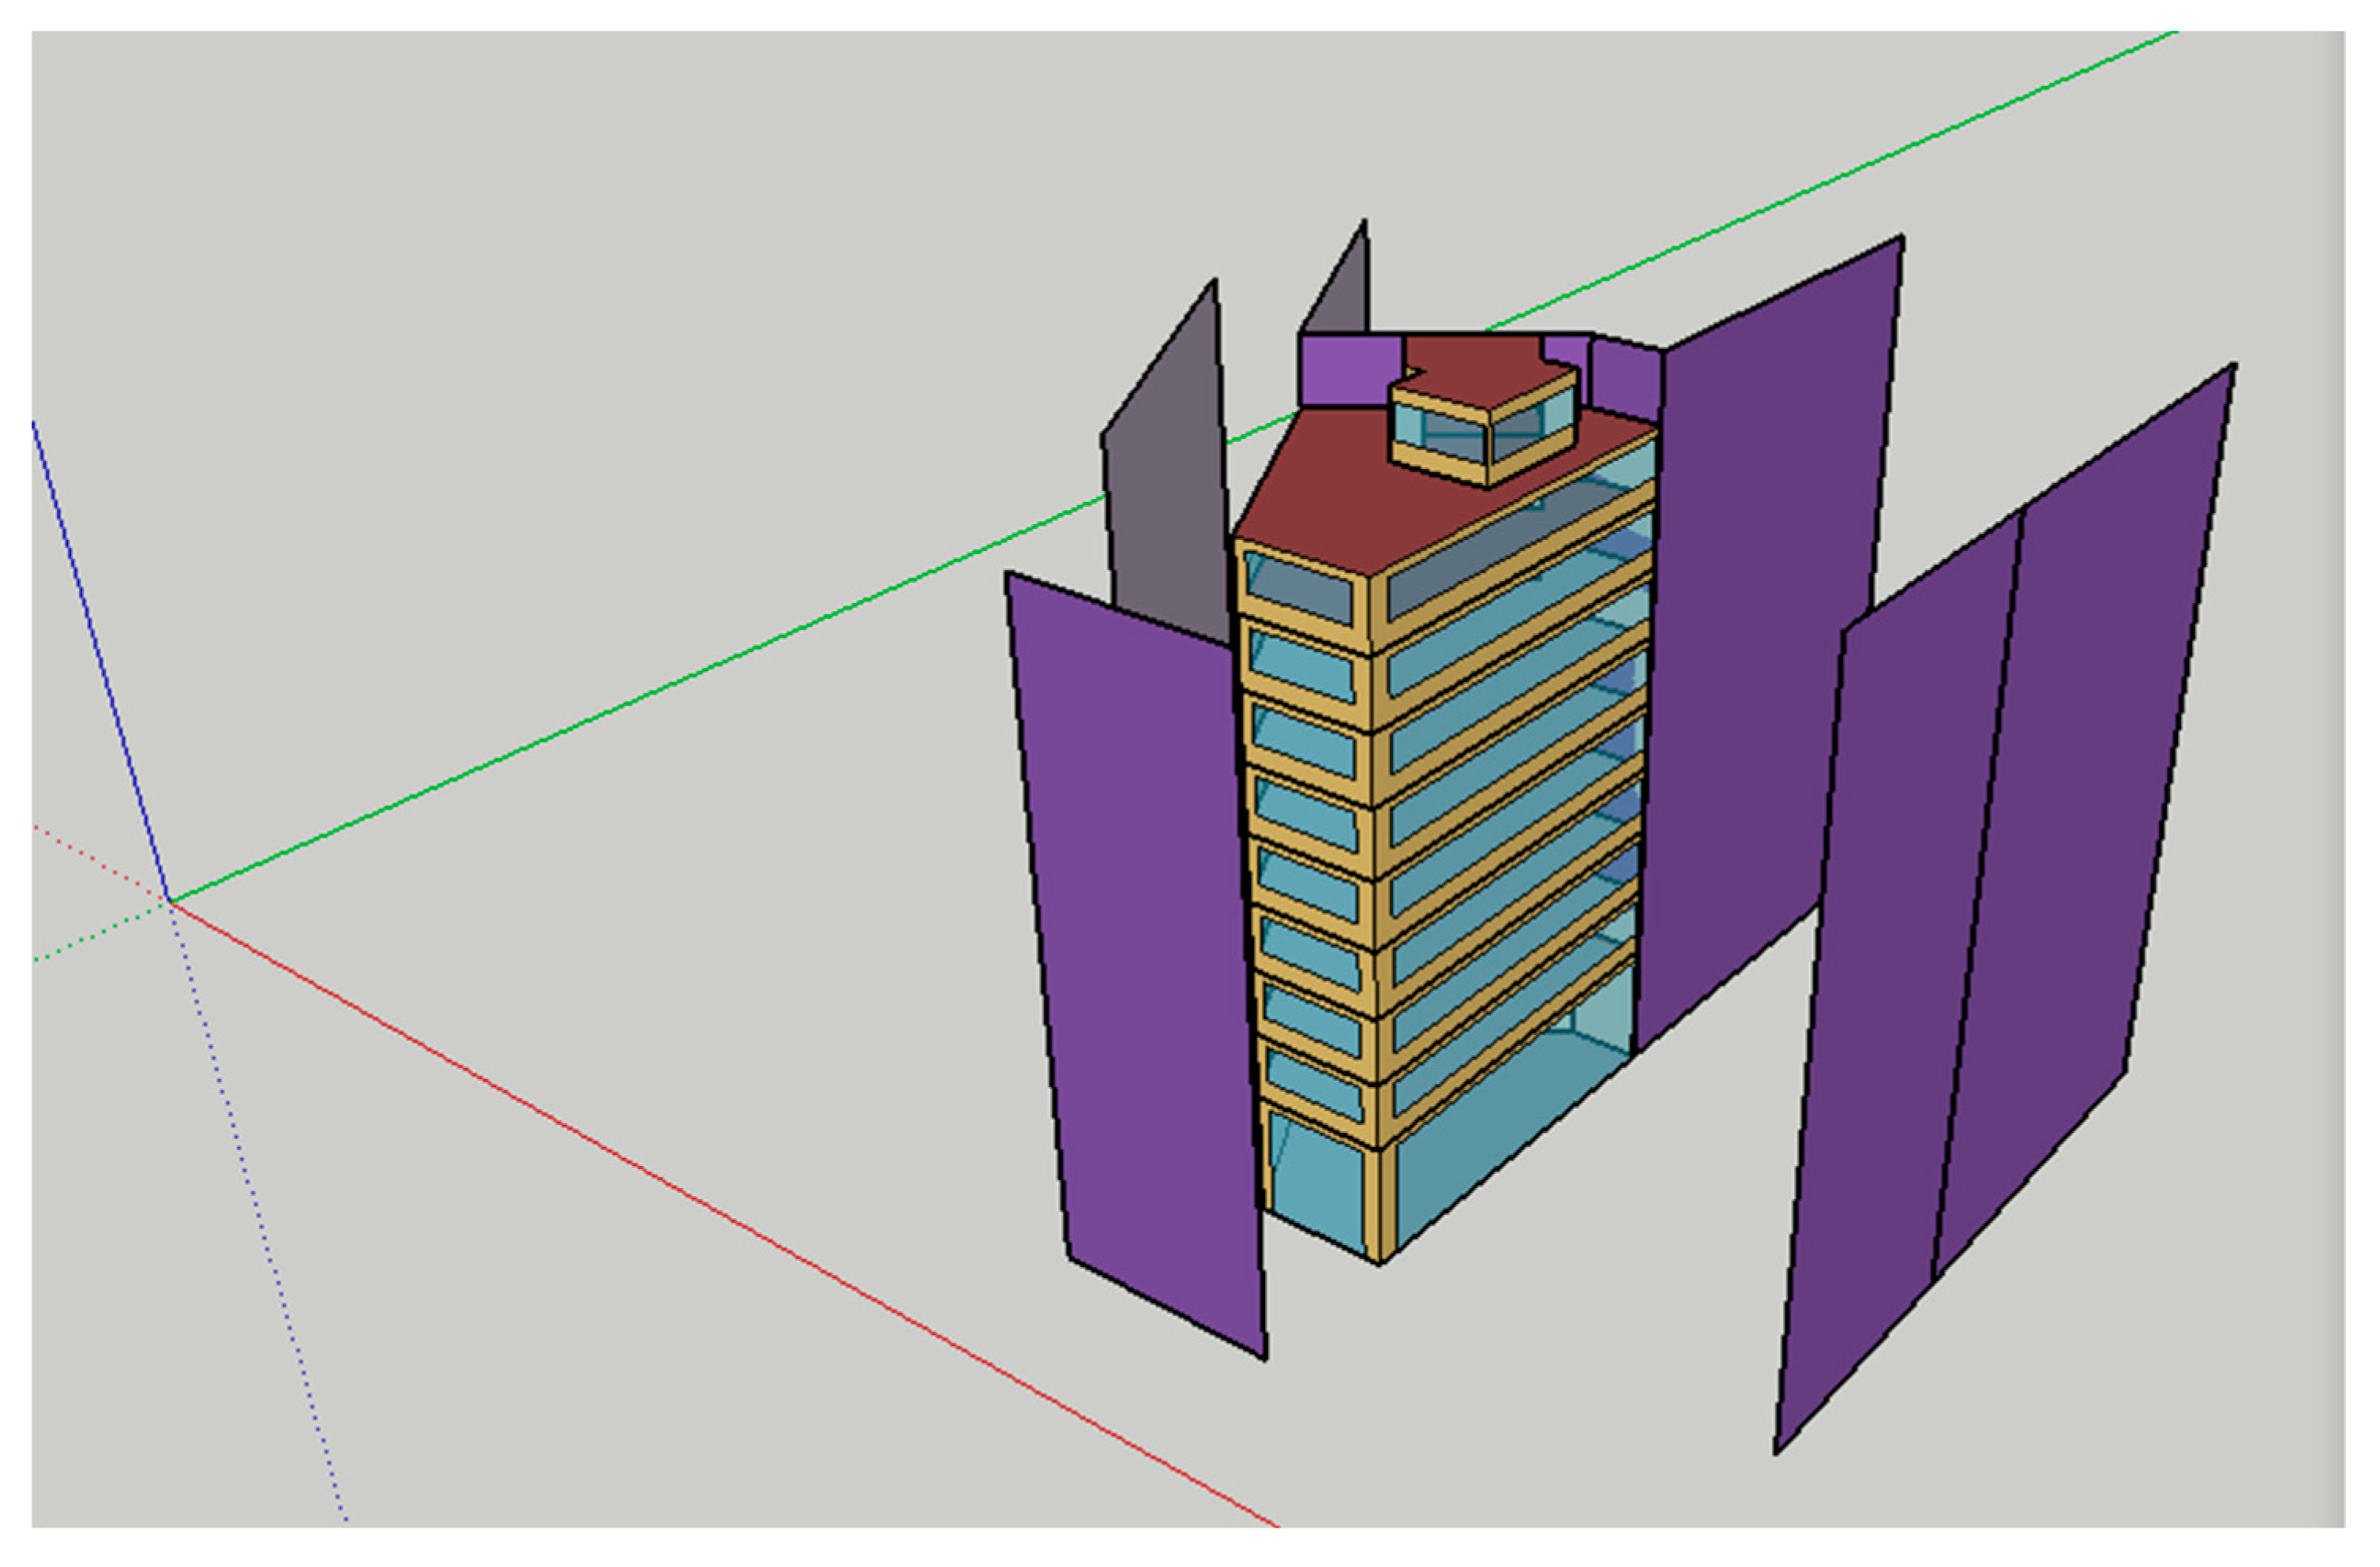
2.3. Modelling of the Building

A crucial step before considering a retrofitting proposal and choosing measures for upgrading, is evaluating the current condition of the building. Several simulation programs are available, and each simulation program has a distinct user interface and utilizes a different simulation engine in order to analyze data. In order for a retrofitting project to be implemented correctly, it is important to understand the limitations and reliability of these programs. In the current case, the building is modelled and simulated in EnergyPlus, which is developed by the US Department of Energy. It performs sub-hourly calculations integrating the load and system dynamic performance into the whole building energy balance calculations [47] and has been used extensively in the literature [48,49,50].
The geometry of the building is designed in SketchUp with the use of the free extension Euclid, which enables easy creation and modification of the geometry inputs for building energy models [51]. The building is simulated for a period of a whole year, from 01/01 until 31/12, taking into account some design assumptions.
Since the reference building is located in Thessaloniki, the International Weather for Energy Calculations (IWEC) of Thessaloniki is used in the simulation. The IWEC data files are ‘typical’ weather files suitable for use with building energy simulation programs [47]. The zoning of the building follows the use at each level. The model consists of 11 zones. Each heated level has four offices (104 m2), one reception area (21 m2) and the staircase area (17 m2). All the internal doors of the office level remain open throughout the day; thus, each level is considered to be one different thermal zone, in order to better study their energy behavior. However, the staircase area is separated from the office zones in each level, as it is an unheated space and is simulated as a separate unconditioned zone. The ground floor (Zone_0) and the 9th floor (Zone_9) are also unconditioned spaces.
The zones, as the actual building itself, are exposed to the outside air on the East, South and Southwest sides and are adiabatically in contact with the adjoining buildings on the North and Northwest sides. The 1st floor (Zone_1) is near on its lower side to the unheated ground floor and 8th floor (Zone_8) to the external air. All the other intermediate levels (Zone_2 to Zone_7) have almost identical characteristics and are adiabatically connected with the other heated zones through their floor and ceiling.
The occupancy schedule of the office building is from Monday to Friday and from 07:00 to 19:00. The office building is considered for the simulation to be closed during weekends and the bank holidays. The lighting and the equipment are considered to be switched on during occupancy hours, given the lack of any automation or control. Their operating profiles follow their real use, as determined by the in-situ survey. The mean installed power of the office equipment and appliances is simulated as 17 W/m2 for the heated zones. The respective power for the lighting is 12 W/m2 for the air-conditioned zones and 10 W/m2 for the unconditioned zones. The values were calculated based on the existing lighting fixtures and the appliances and equipment of the building. The forty people occupying the office building daily are evenly distributed among the conditioned levels and all of them are considered to be working seated, thus with a low activity level.
Since the building is located in the dense city center, all the neighboring buildings are considered as shading objects in the simulation for a more realistic result, taking into account their respective heights and the widths of the surrounding roads (Figure 8).
Regarding the heating and cooling of the building, a heating period from 01/01 until 30/04 and 20/10 until 31/12 and a cooling period from 01/05 until 19/10 were selected as the normal practice. The set temperature points in the typical office level zones are 26 °C for cooling (with a tolerance of ±1 °C) and 22 °C for heating (with a tolerance of ±1 °C). No thermostats are set in the unheated zones.

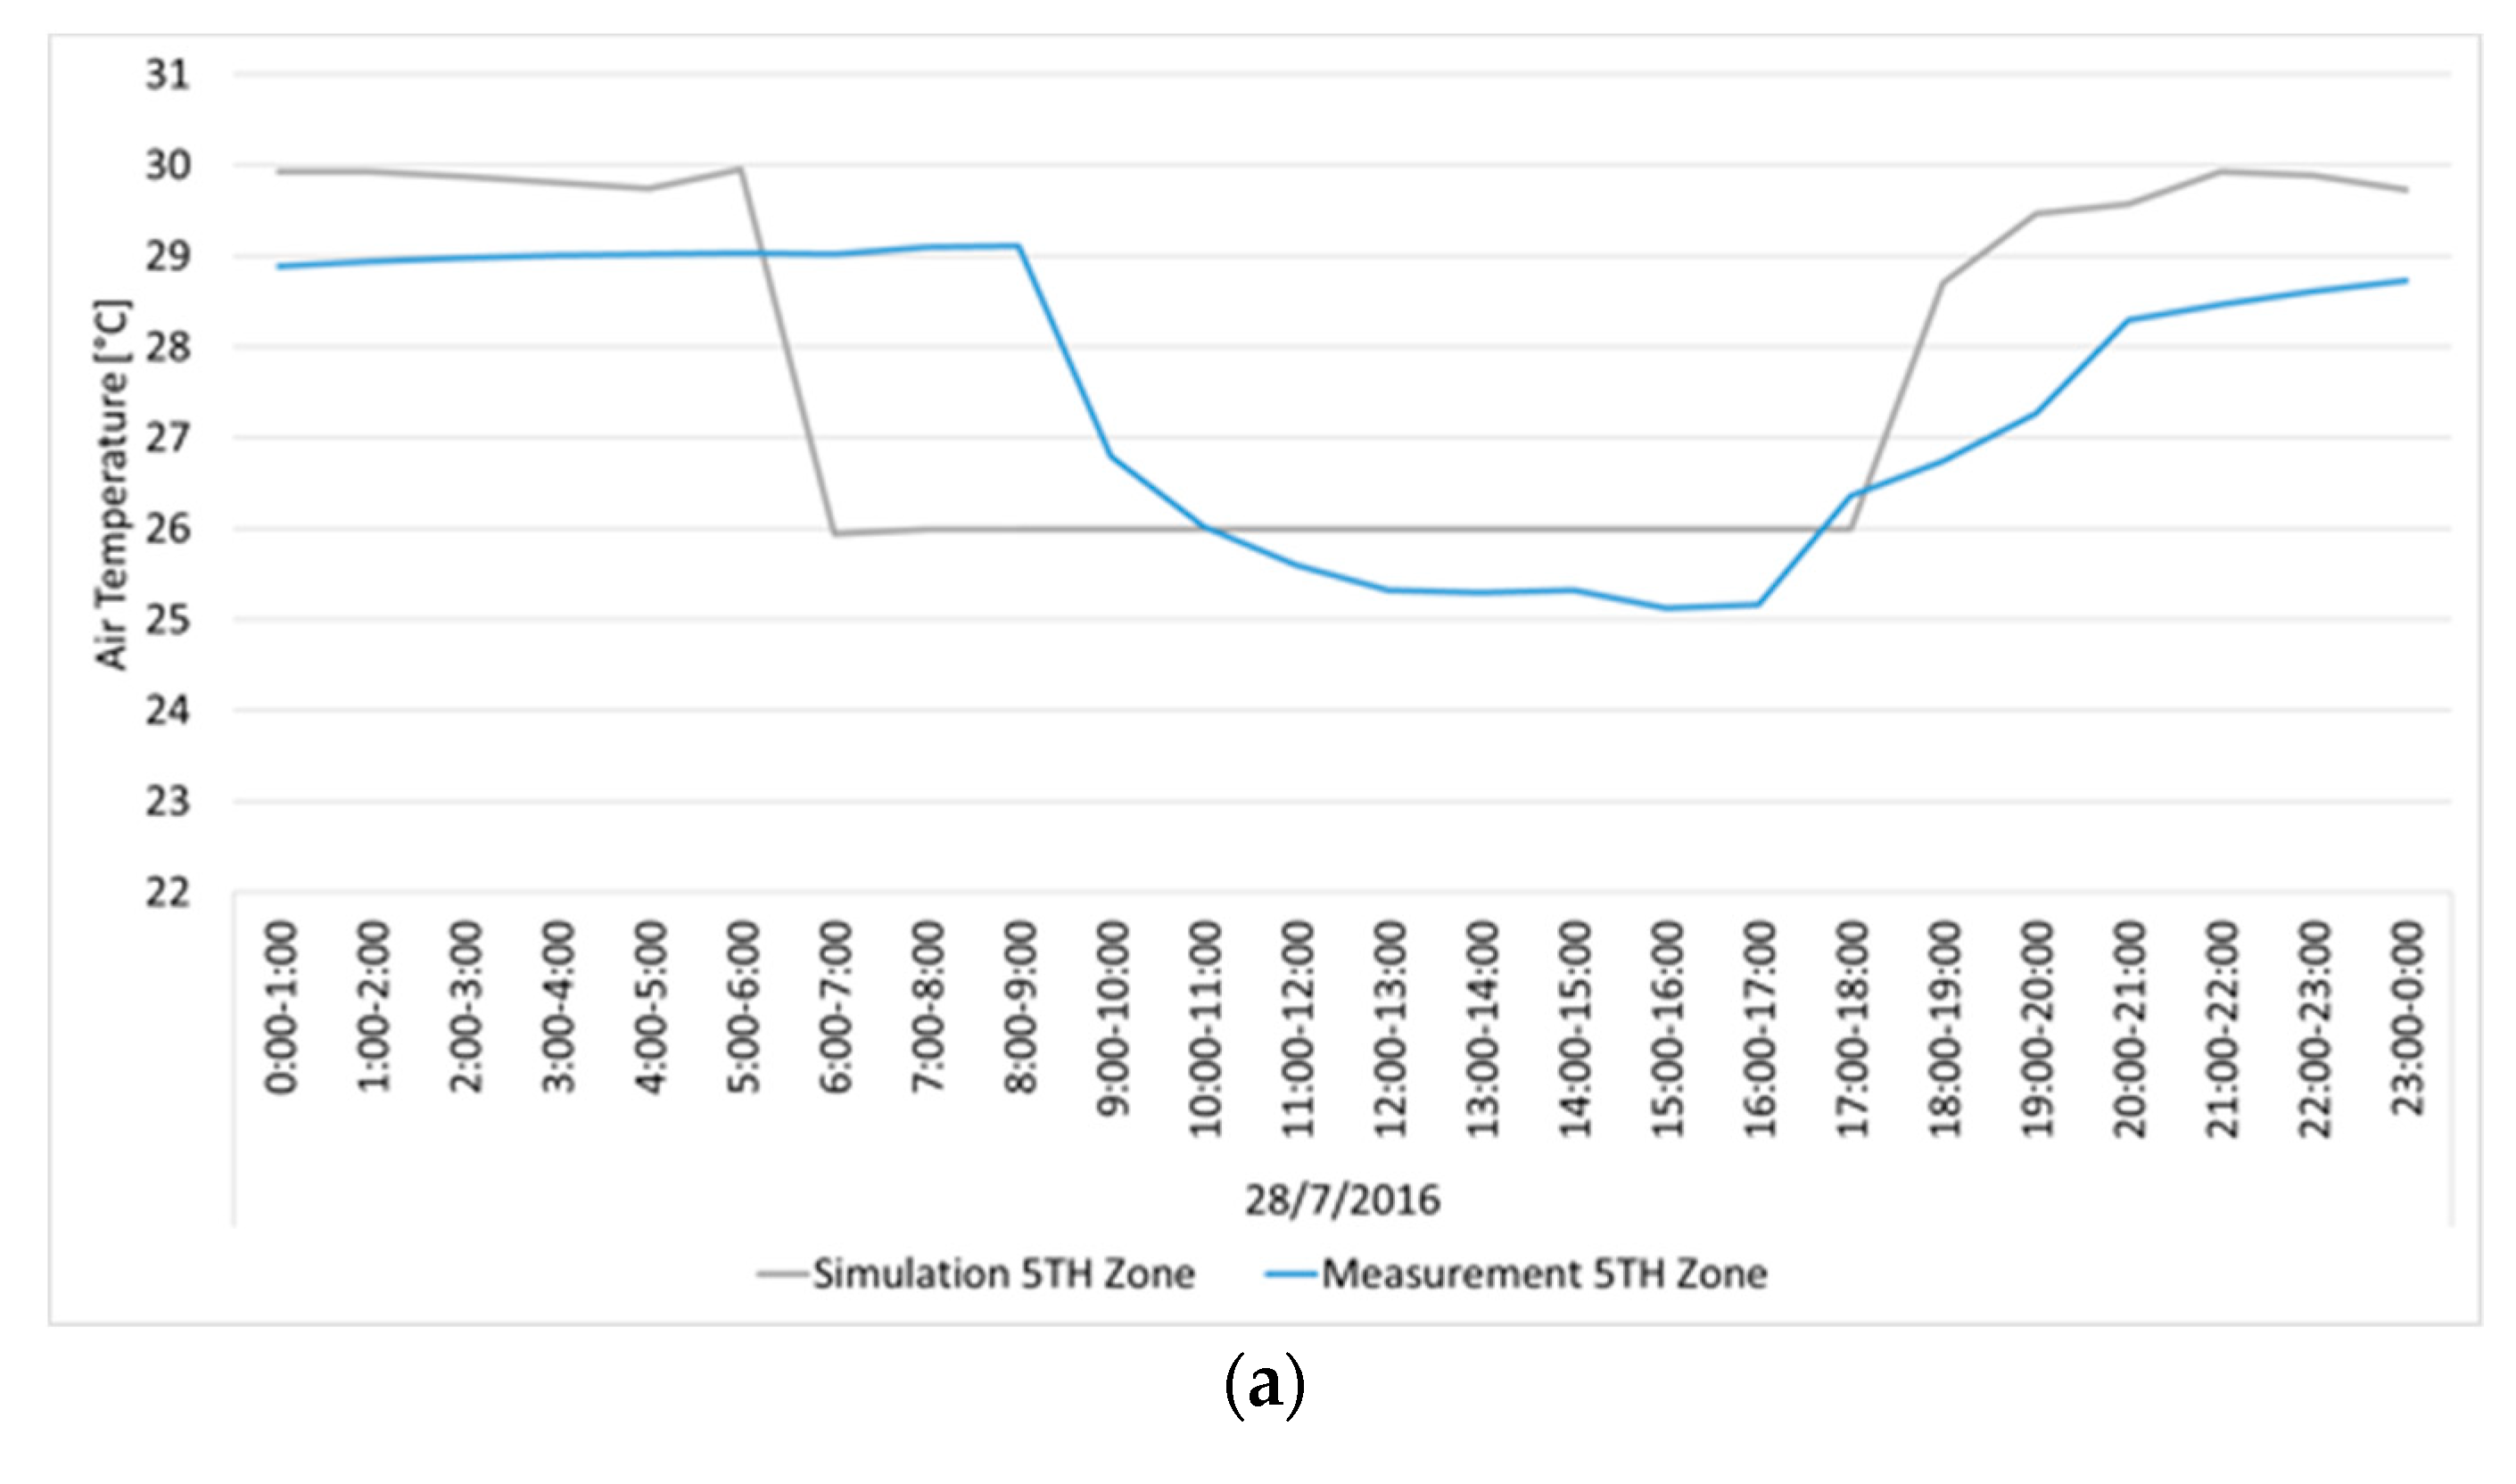
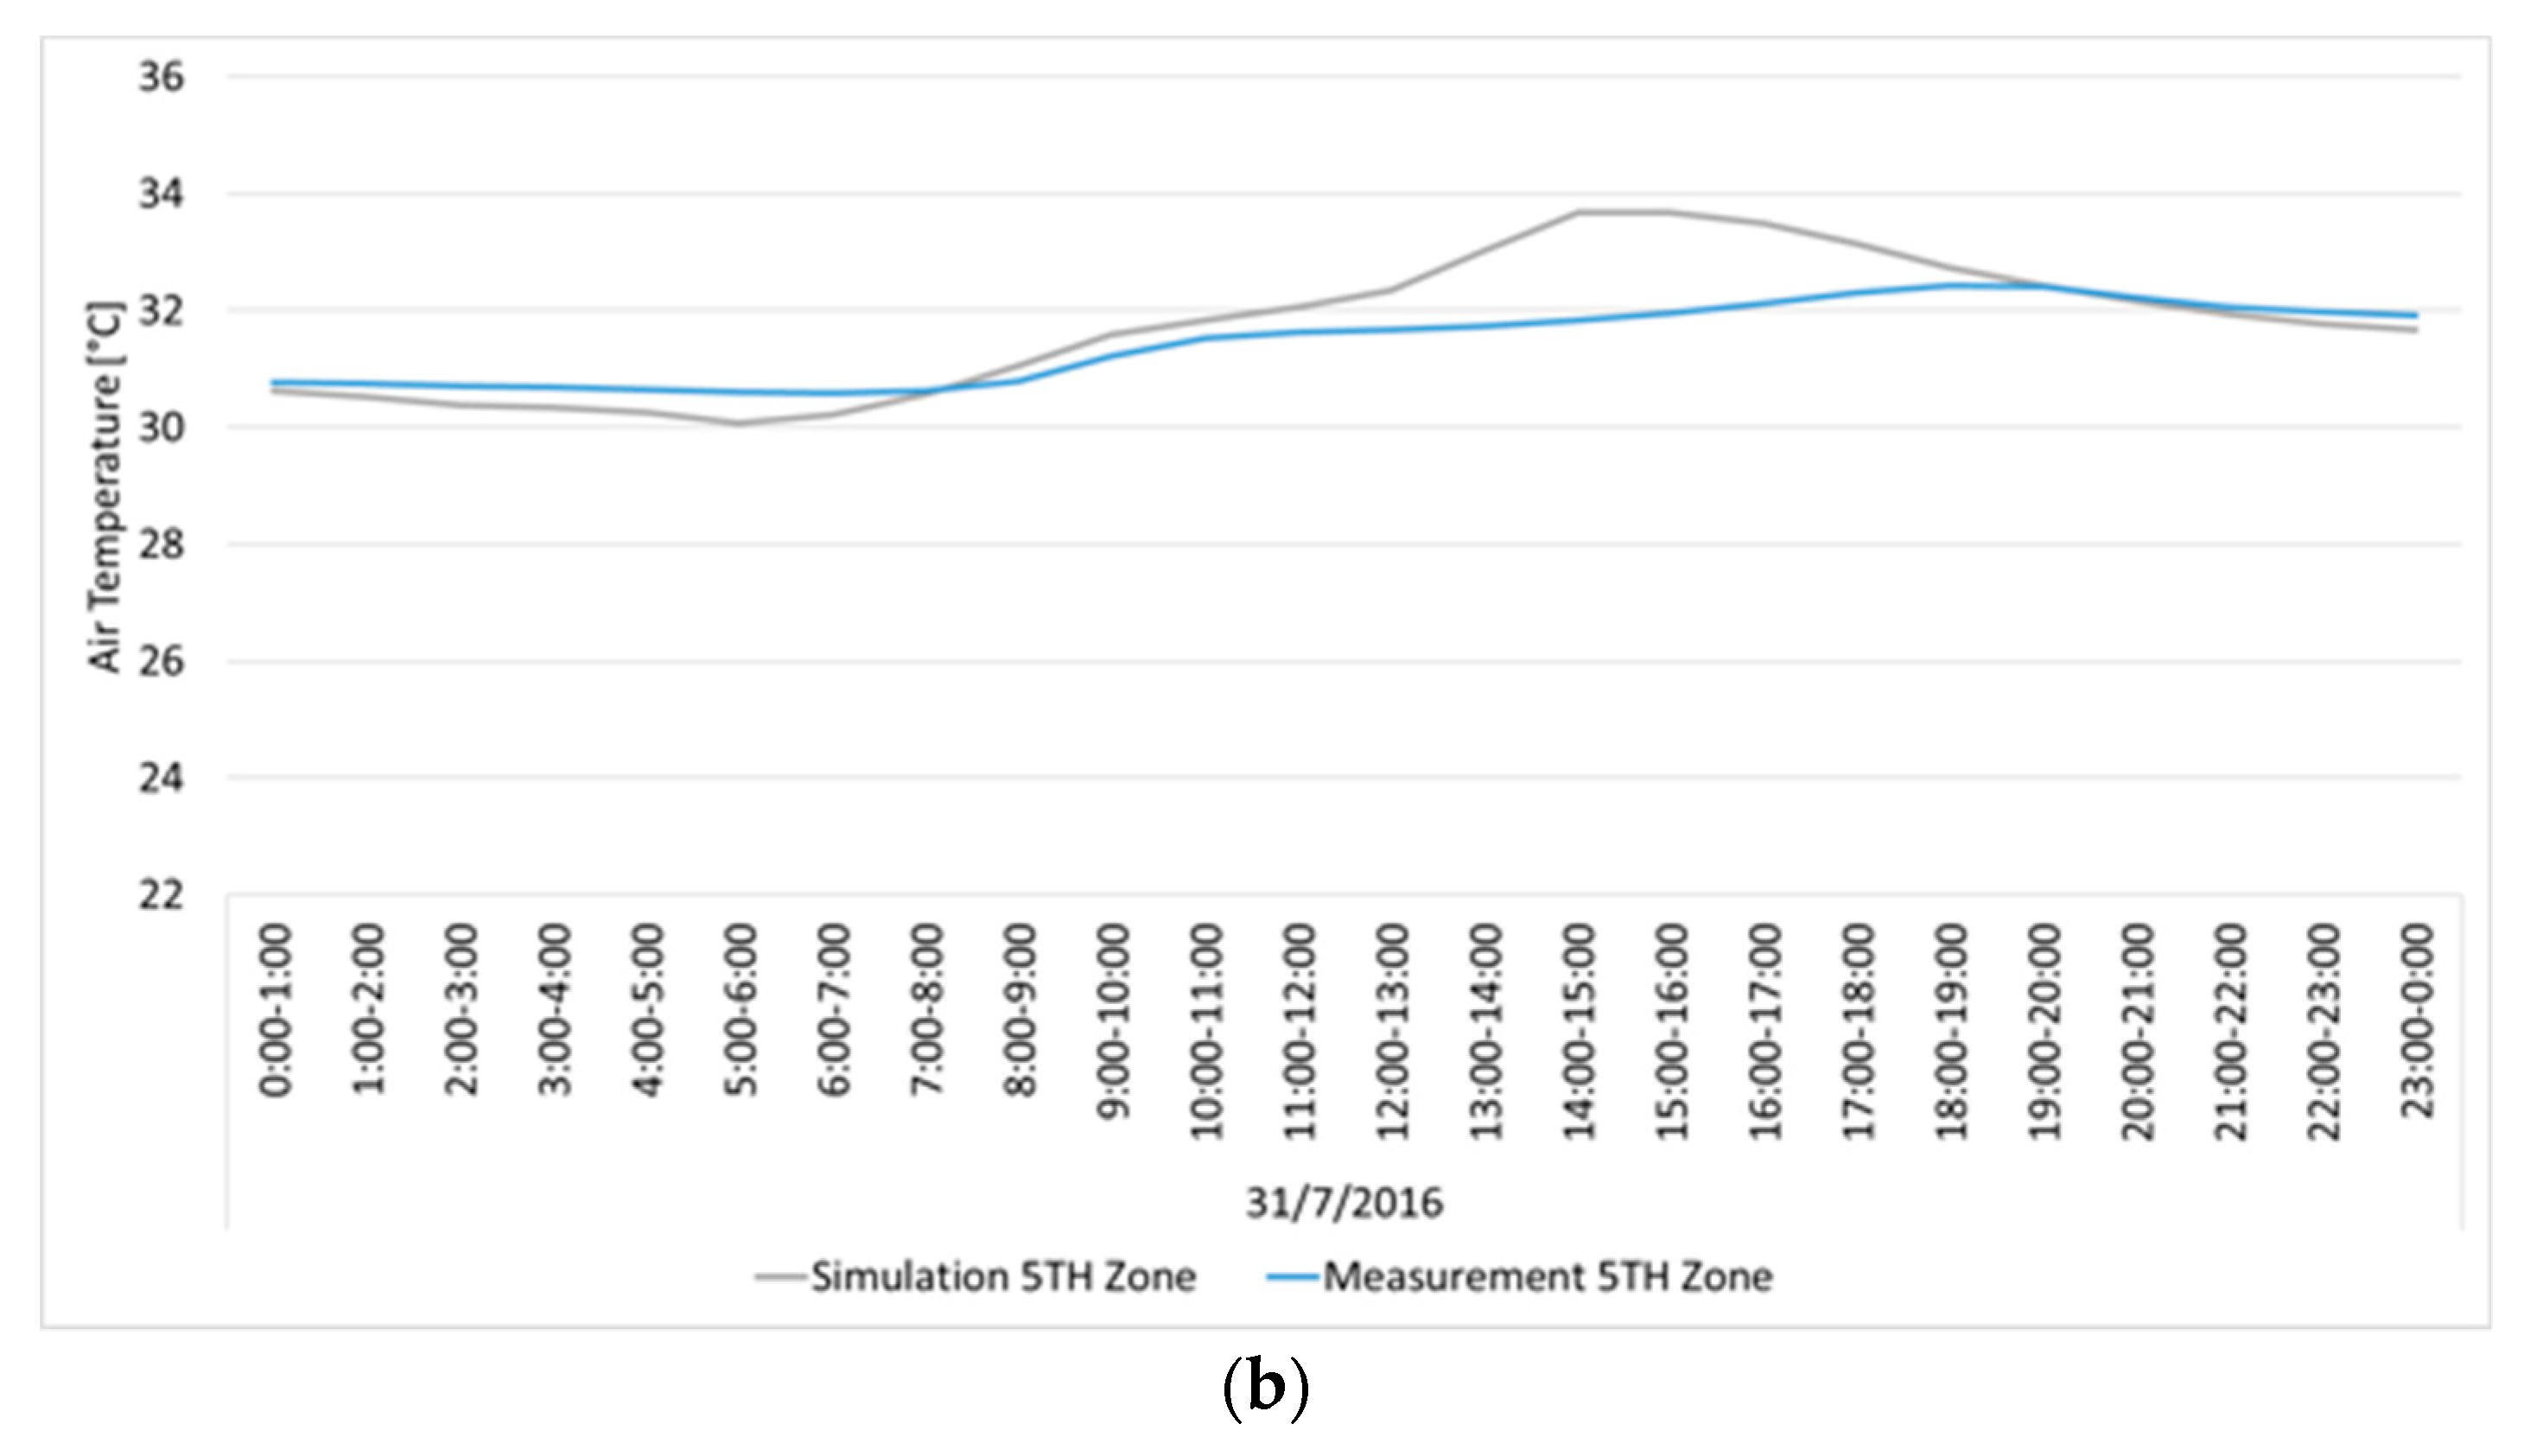
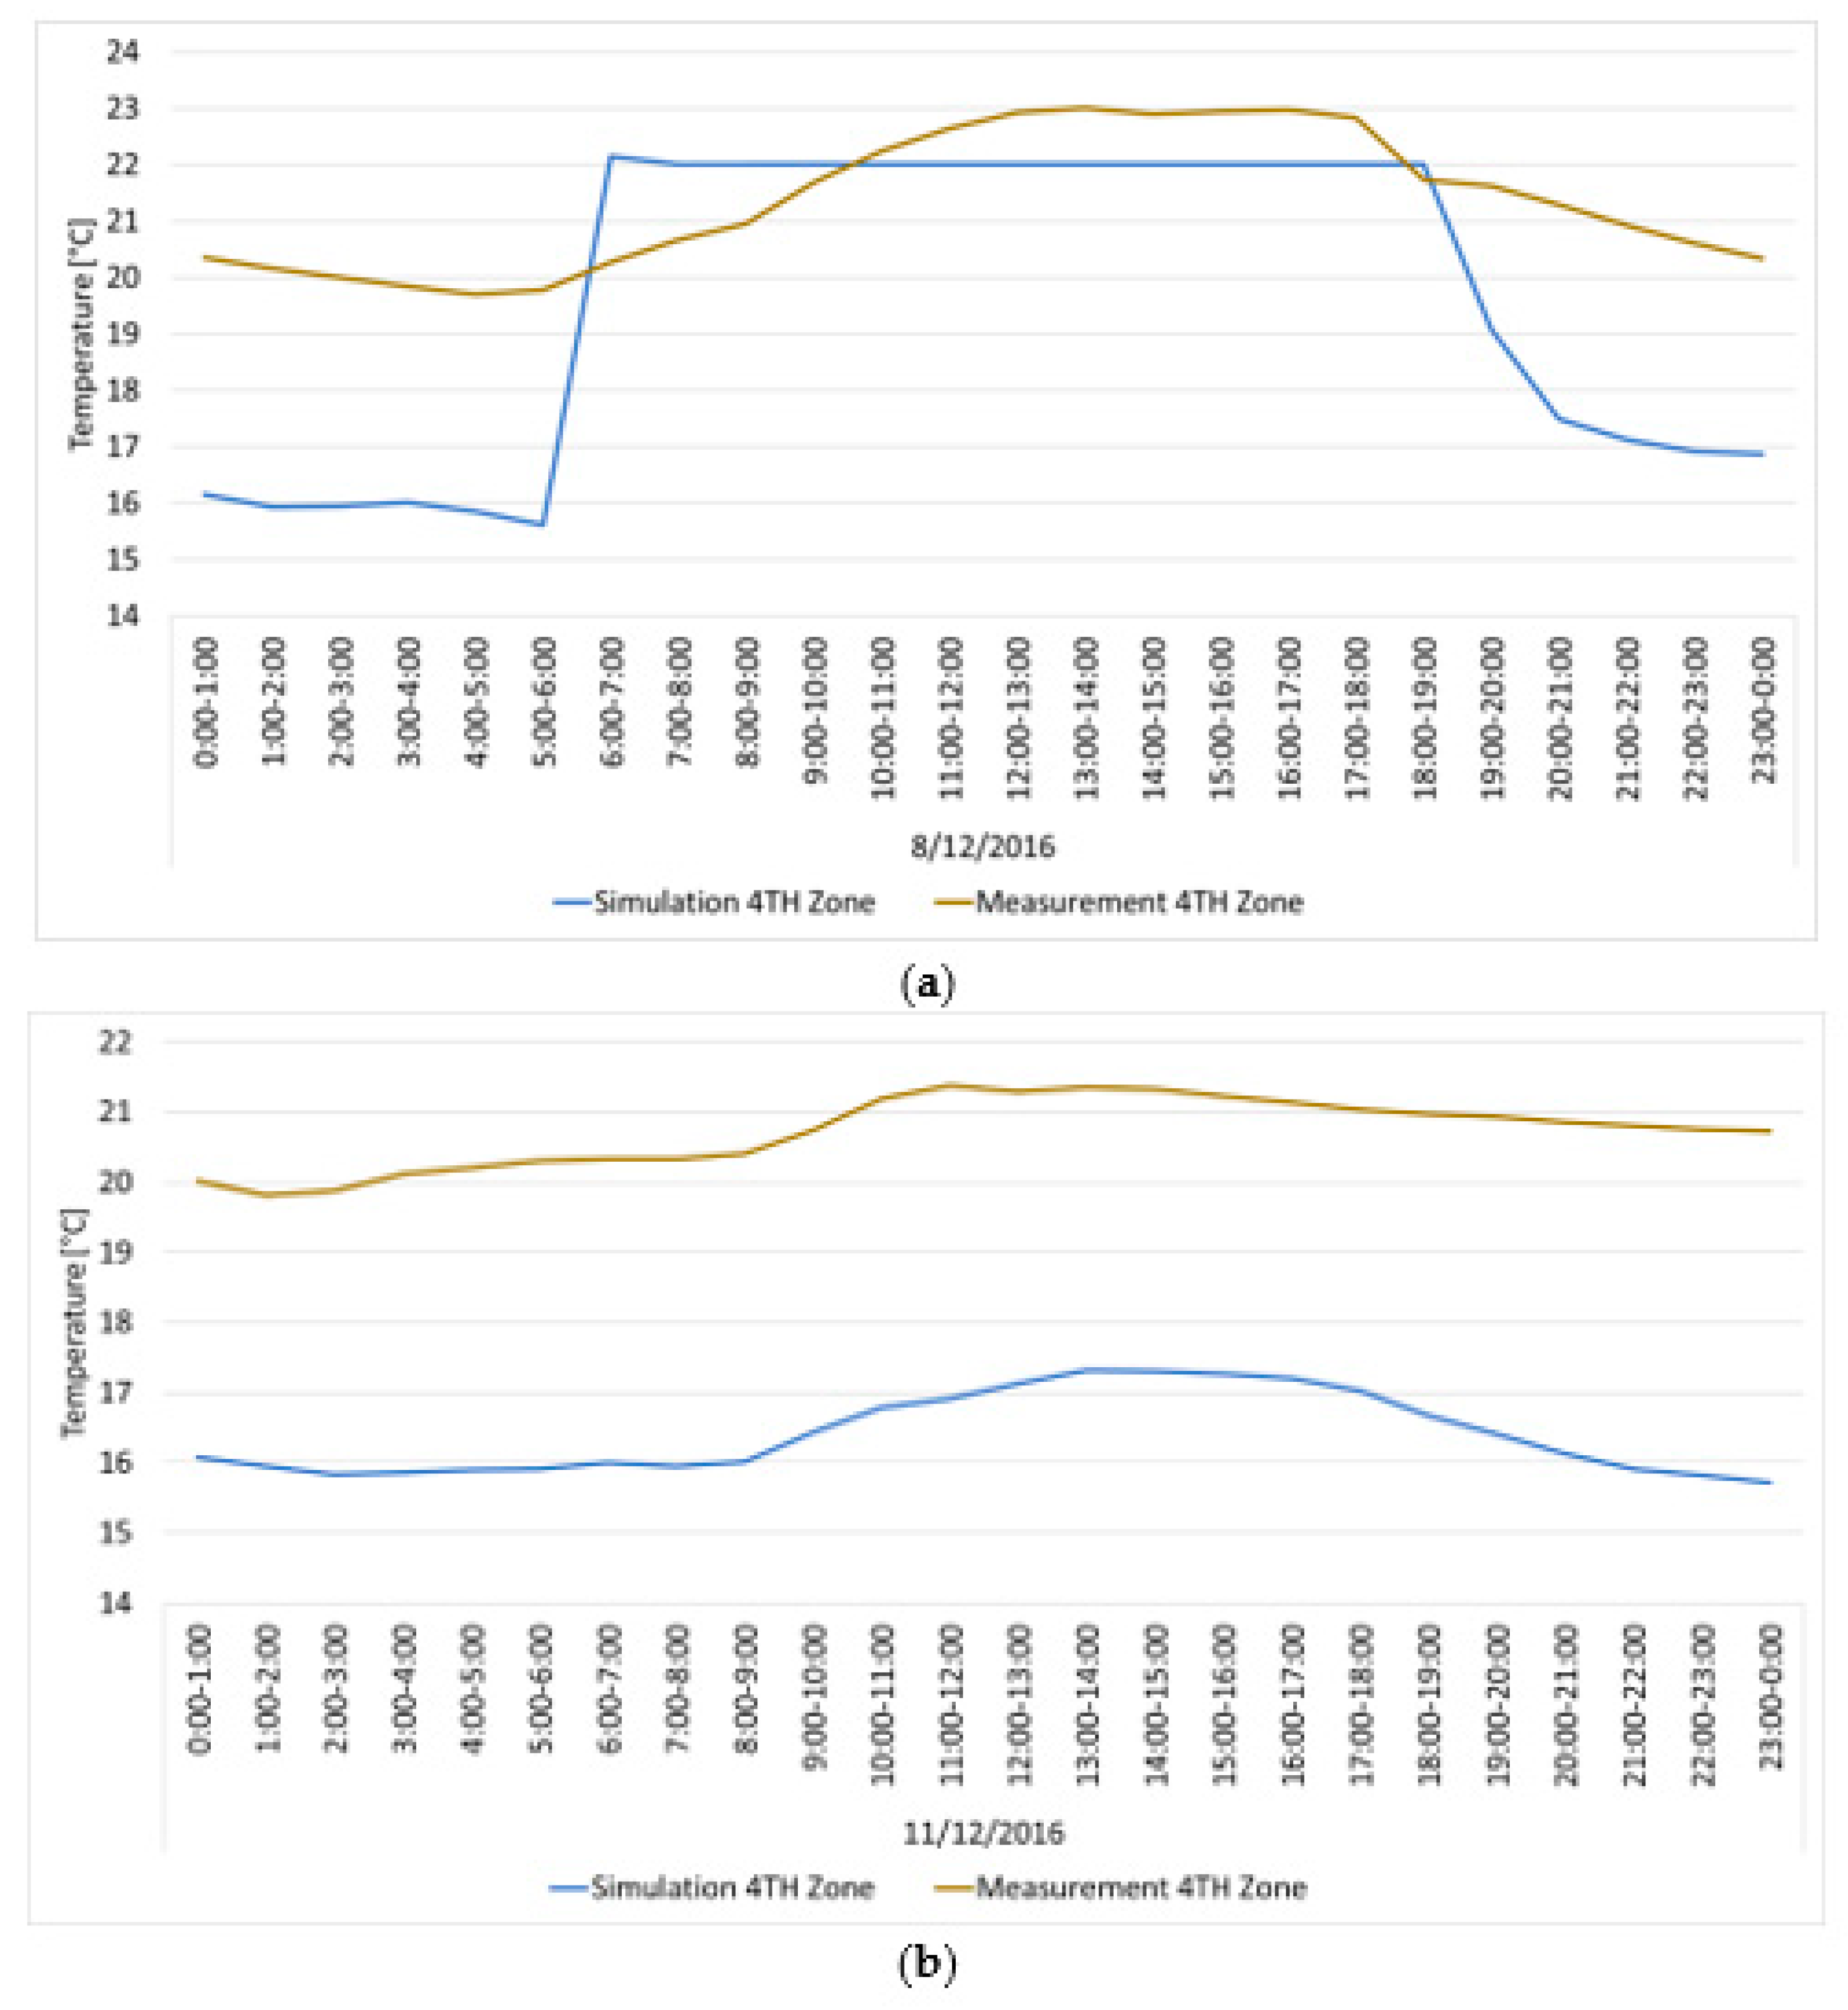
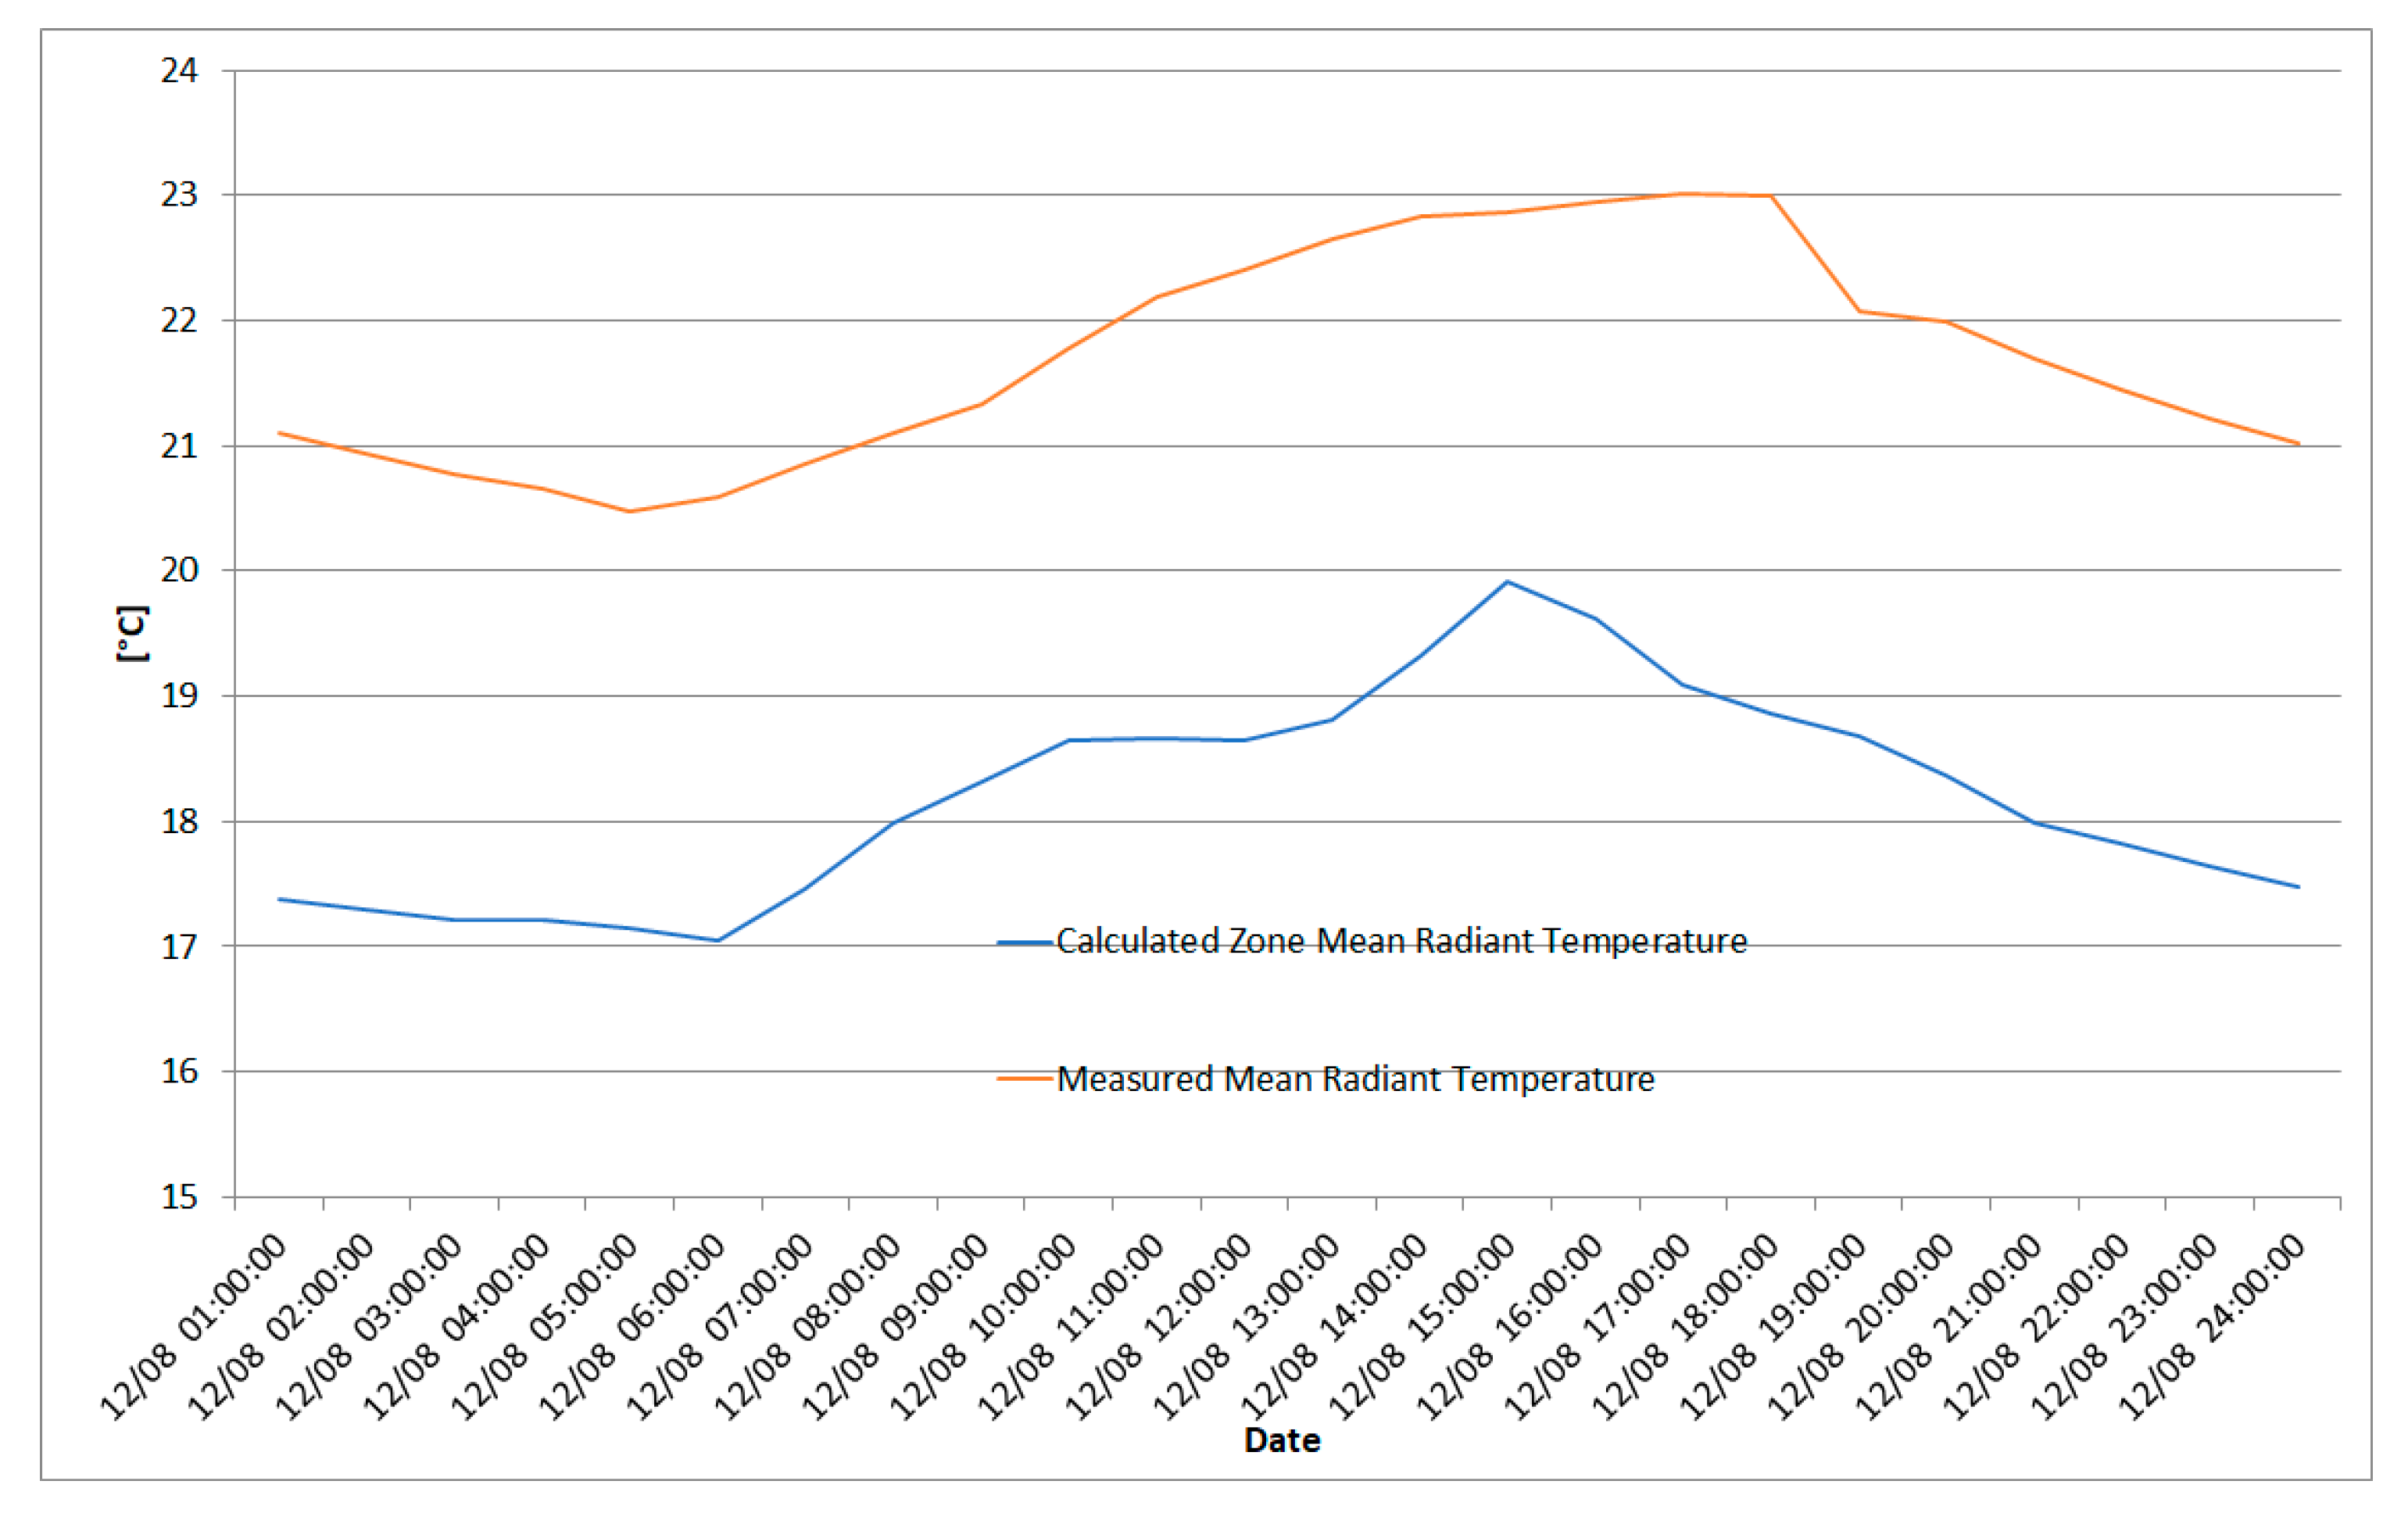
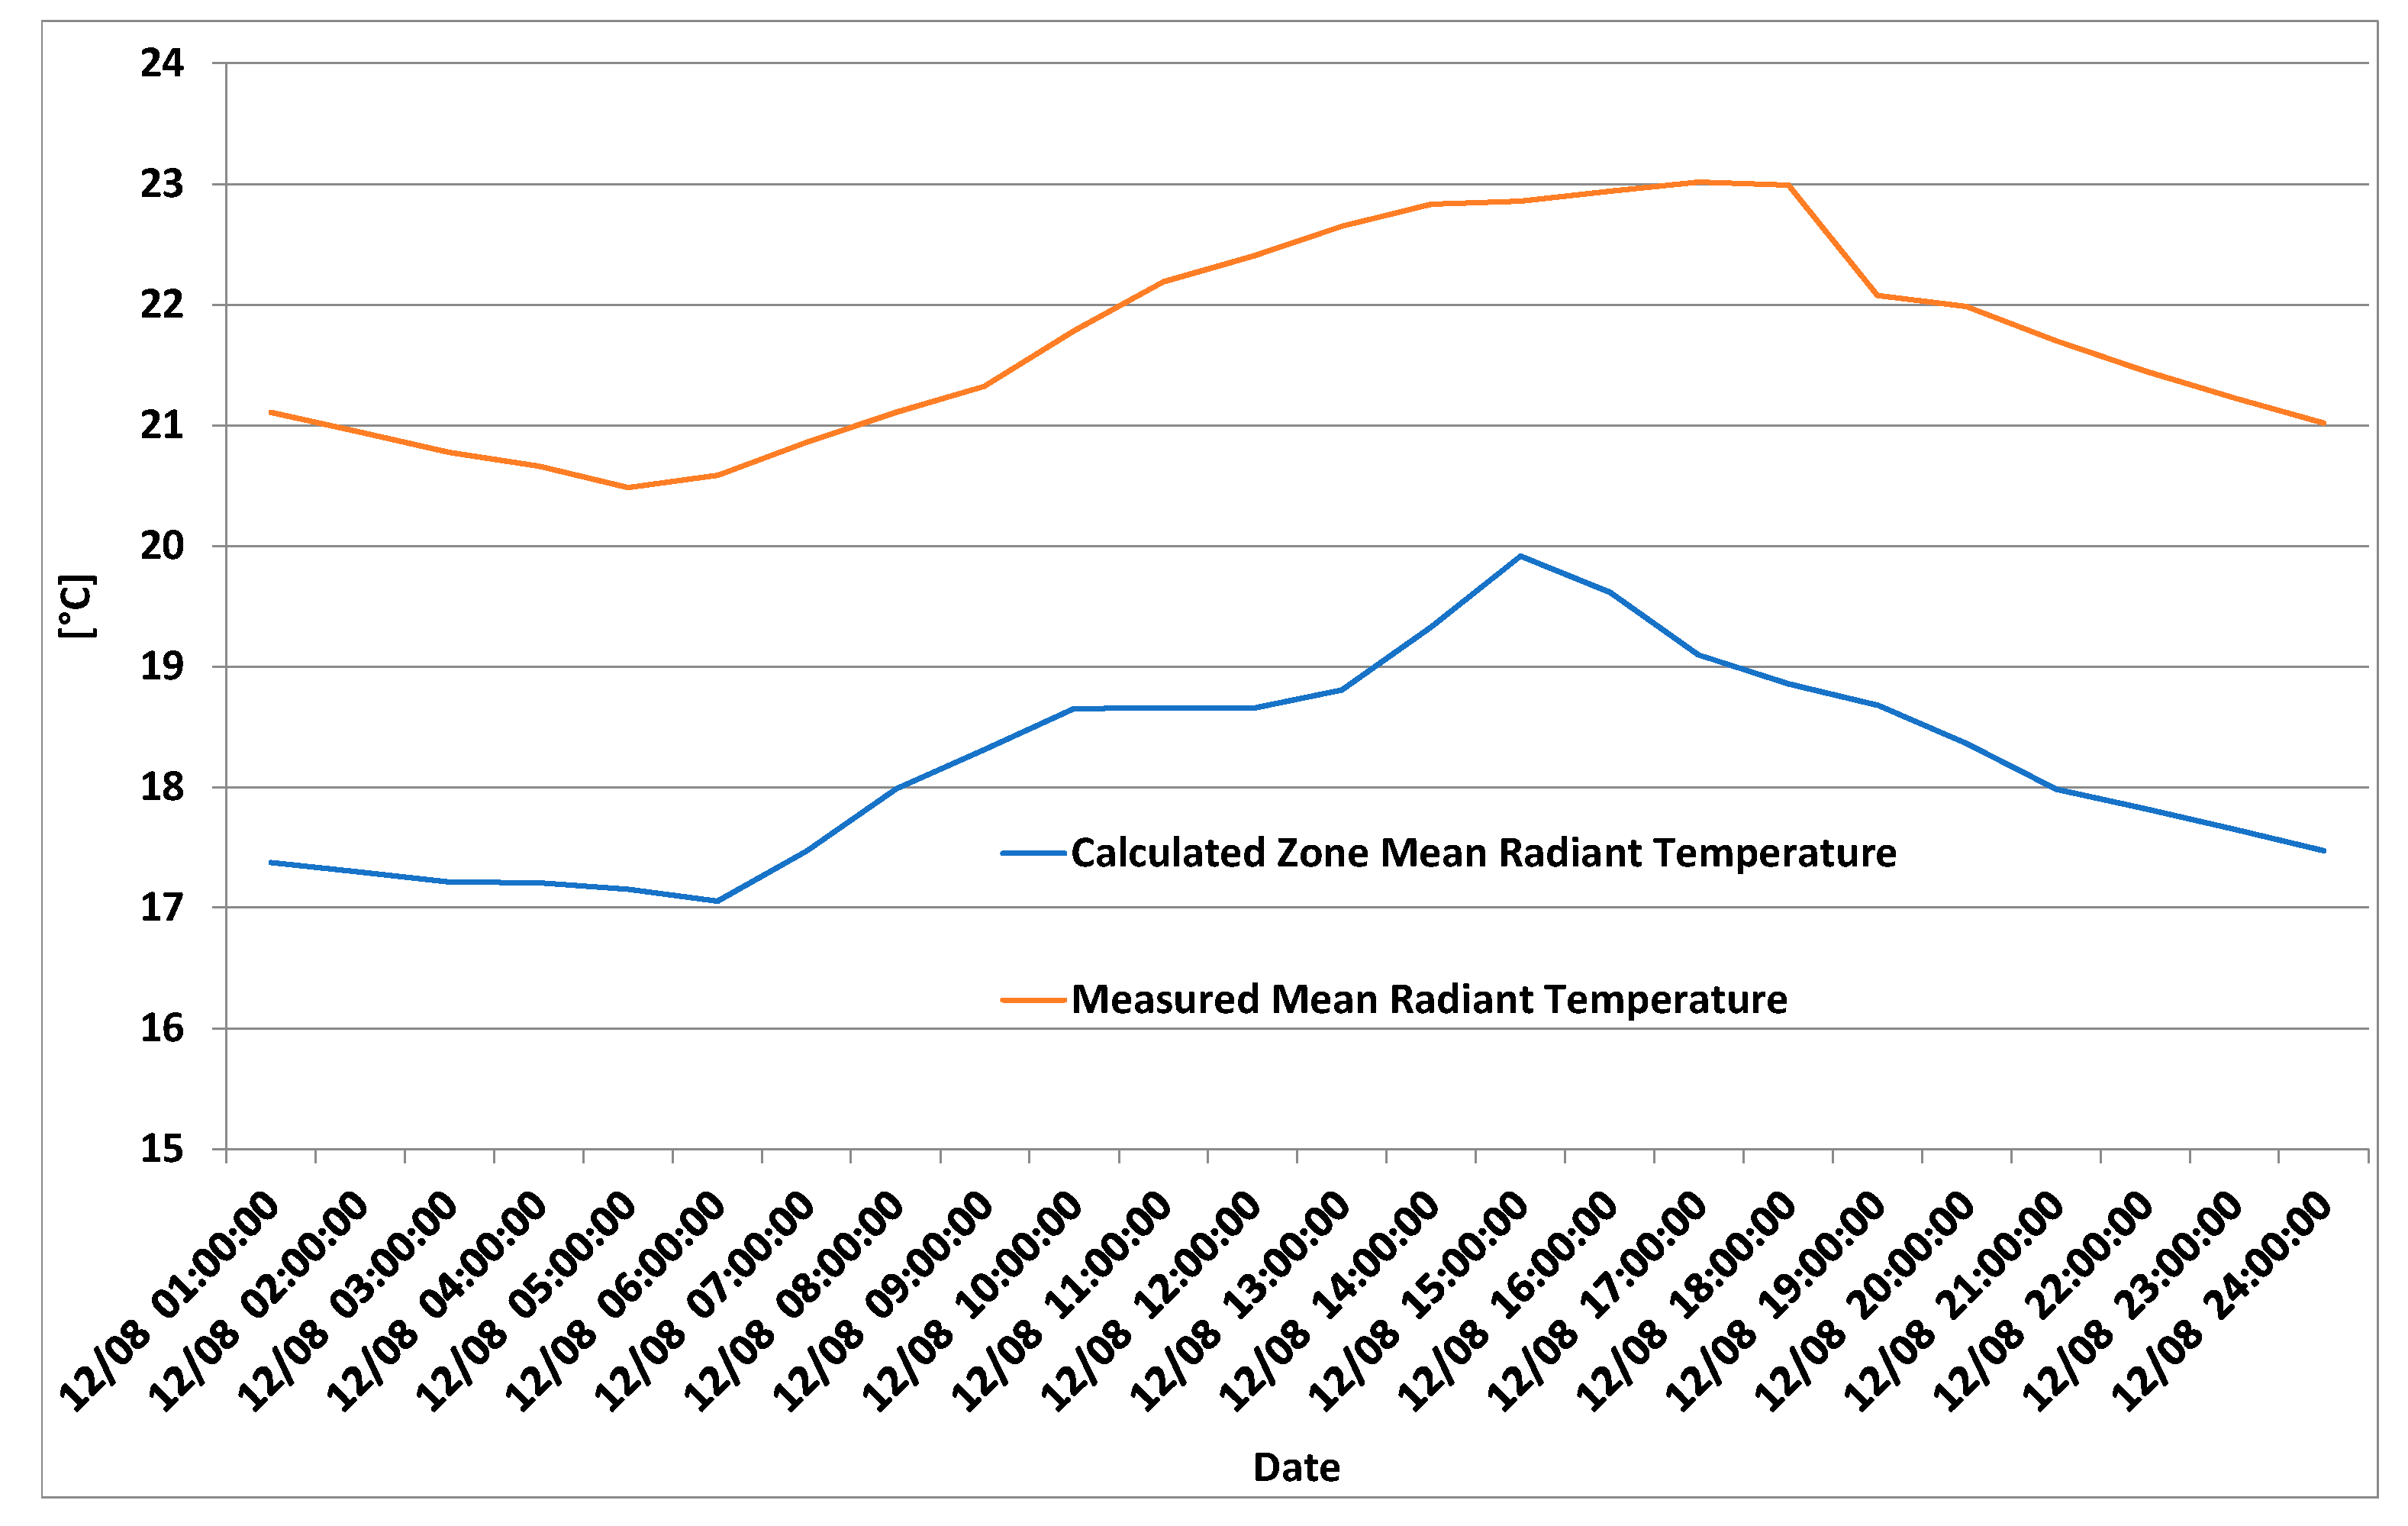
2.4. Validation of the Model

For the validation of the model, initially the simulation was run with values taken from the on-site meteorological station, and the measured internal temperature was compared with the temperature calculated by the model.
Except for the determination of indoor temperature conditions, the measured values are used for the validation of the building’s energy model. The results of the validation are presented in Figure 9 and Figure 10 regarding the summer and winter period, respectively.
It is evident that the temperature conditions calculated by the model in the initial scenario are similar to the measured indoor air temperature conditions for both office hours and weekend periods and that the model can be used, as the root mean square error (RMSE) for the cooling period varies between 0.72 and 1.48, while the normalized RMSE varies from 0.37 to 0.39, while for the heating period RMSE varies between 2.6 and 3.8 with the normalized RMSE varying from 0.8 to 2.01.
The validation of building energy simulation models is currently based on a model compliance with standard criteria, as found in the literature [52,53,54,55] depending on whether models are calibrated to monthly or hourly measured data. More specifically, in order for a building simulation model to be considered as calibrated the Coefficient of Variation of the Root Mean Square Error CV (RMSE) (%) has to be within a 30% of the measured value [55], while in the present model, the coefficient varies between 2% and 19% for the heating and cooling season, respectively, which is similar with studies available in the literature [52].
Minor deviations in the temperatures can be attributed to the building’s thermal capacity and solar loads, which are difficult to simulate accurately.
Finally, for the calibration of the model the calculated mean radiant temperature is compared with the measured one, as presented in Figure 11. For the needs of the heating system simulation, the “Ideal Loads Air System” in EnergyPlus was used, as per usual practice in order to calculate loads without modeling a full HVAC system [49]. All that is required for the ideal system are zone controls, zone equipment configurations, and the ideal loads system component. This component can be thought of as an ideal unit that mixes zone air with the specified amount of outdoor air and then adds or removes heat at 100% efficiency in order to meet the specified controls. From in the simulation we were able to calculate the mean radiant temperature per zone but, as the HVAC system is not the same as the one in the actual building the results cannot be identical and this is evident on the differences between the measured and simulated values. Nevertheless, the trend between the simulated and measured values is the same, with a RMSE of 3.5 and a normalized RSME of 1.38.

3. Results and Discussion

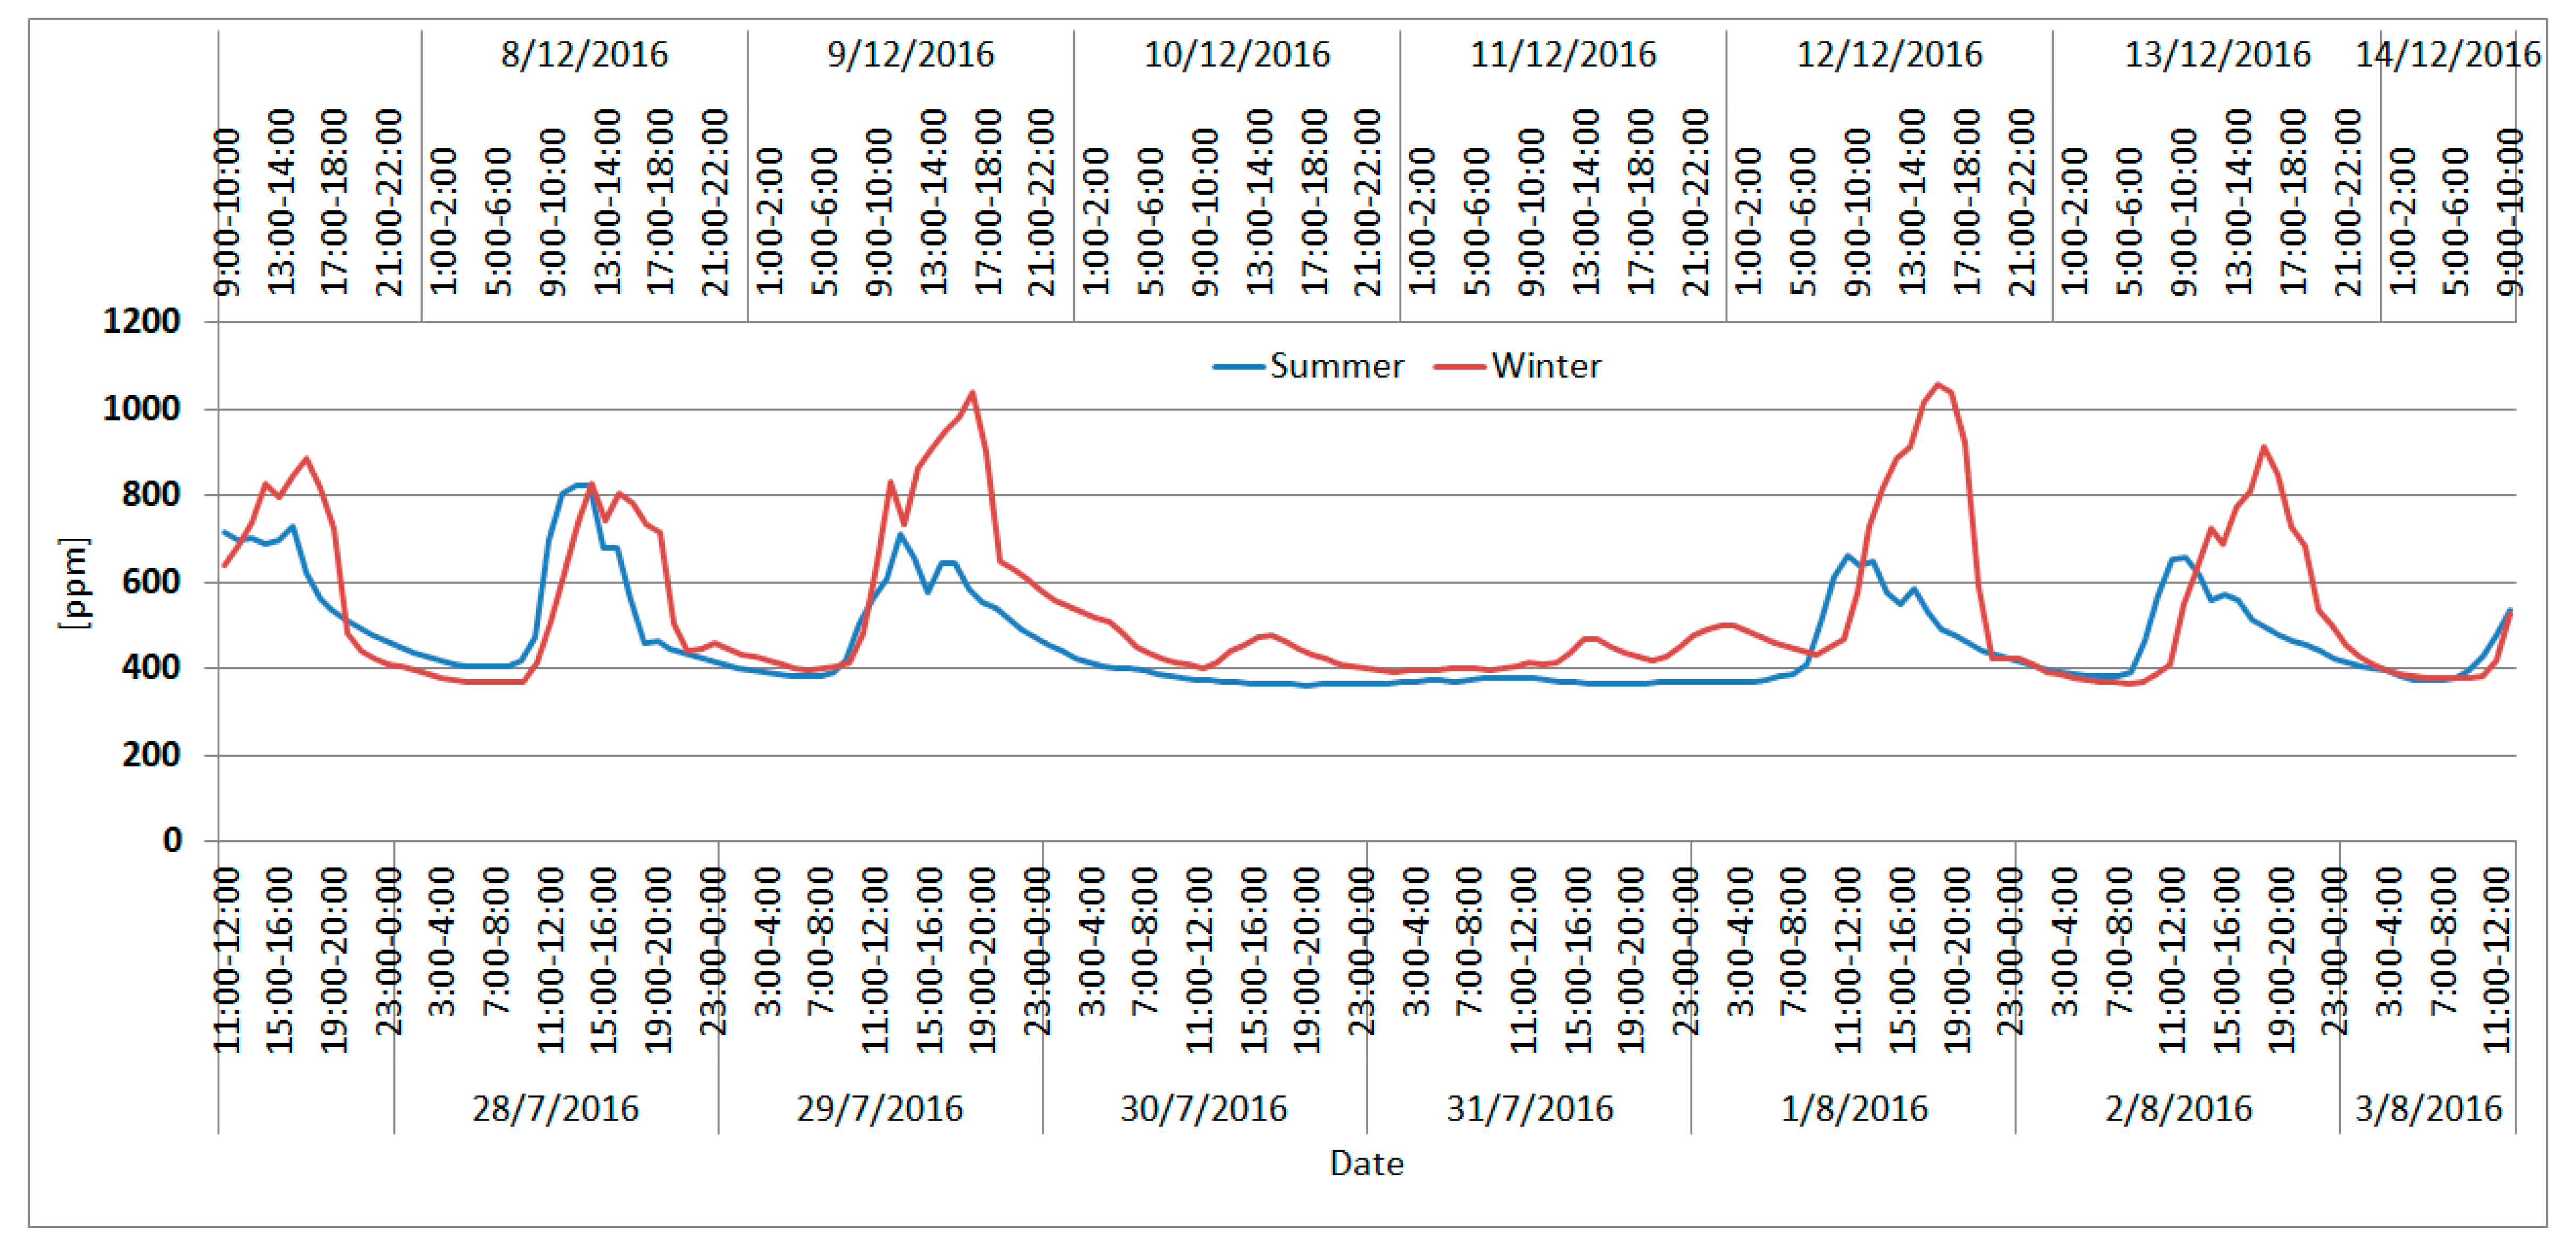
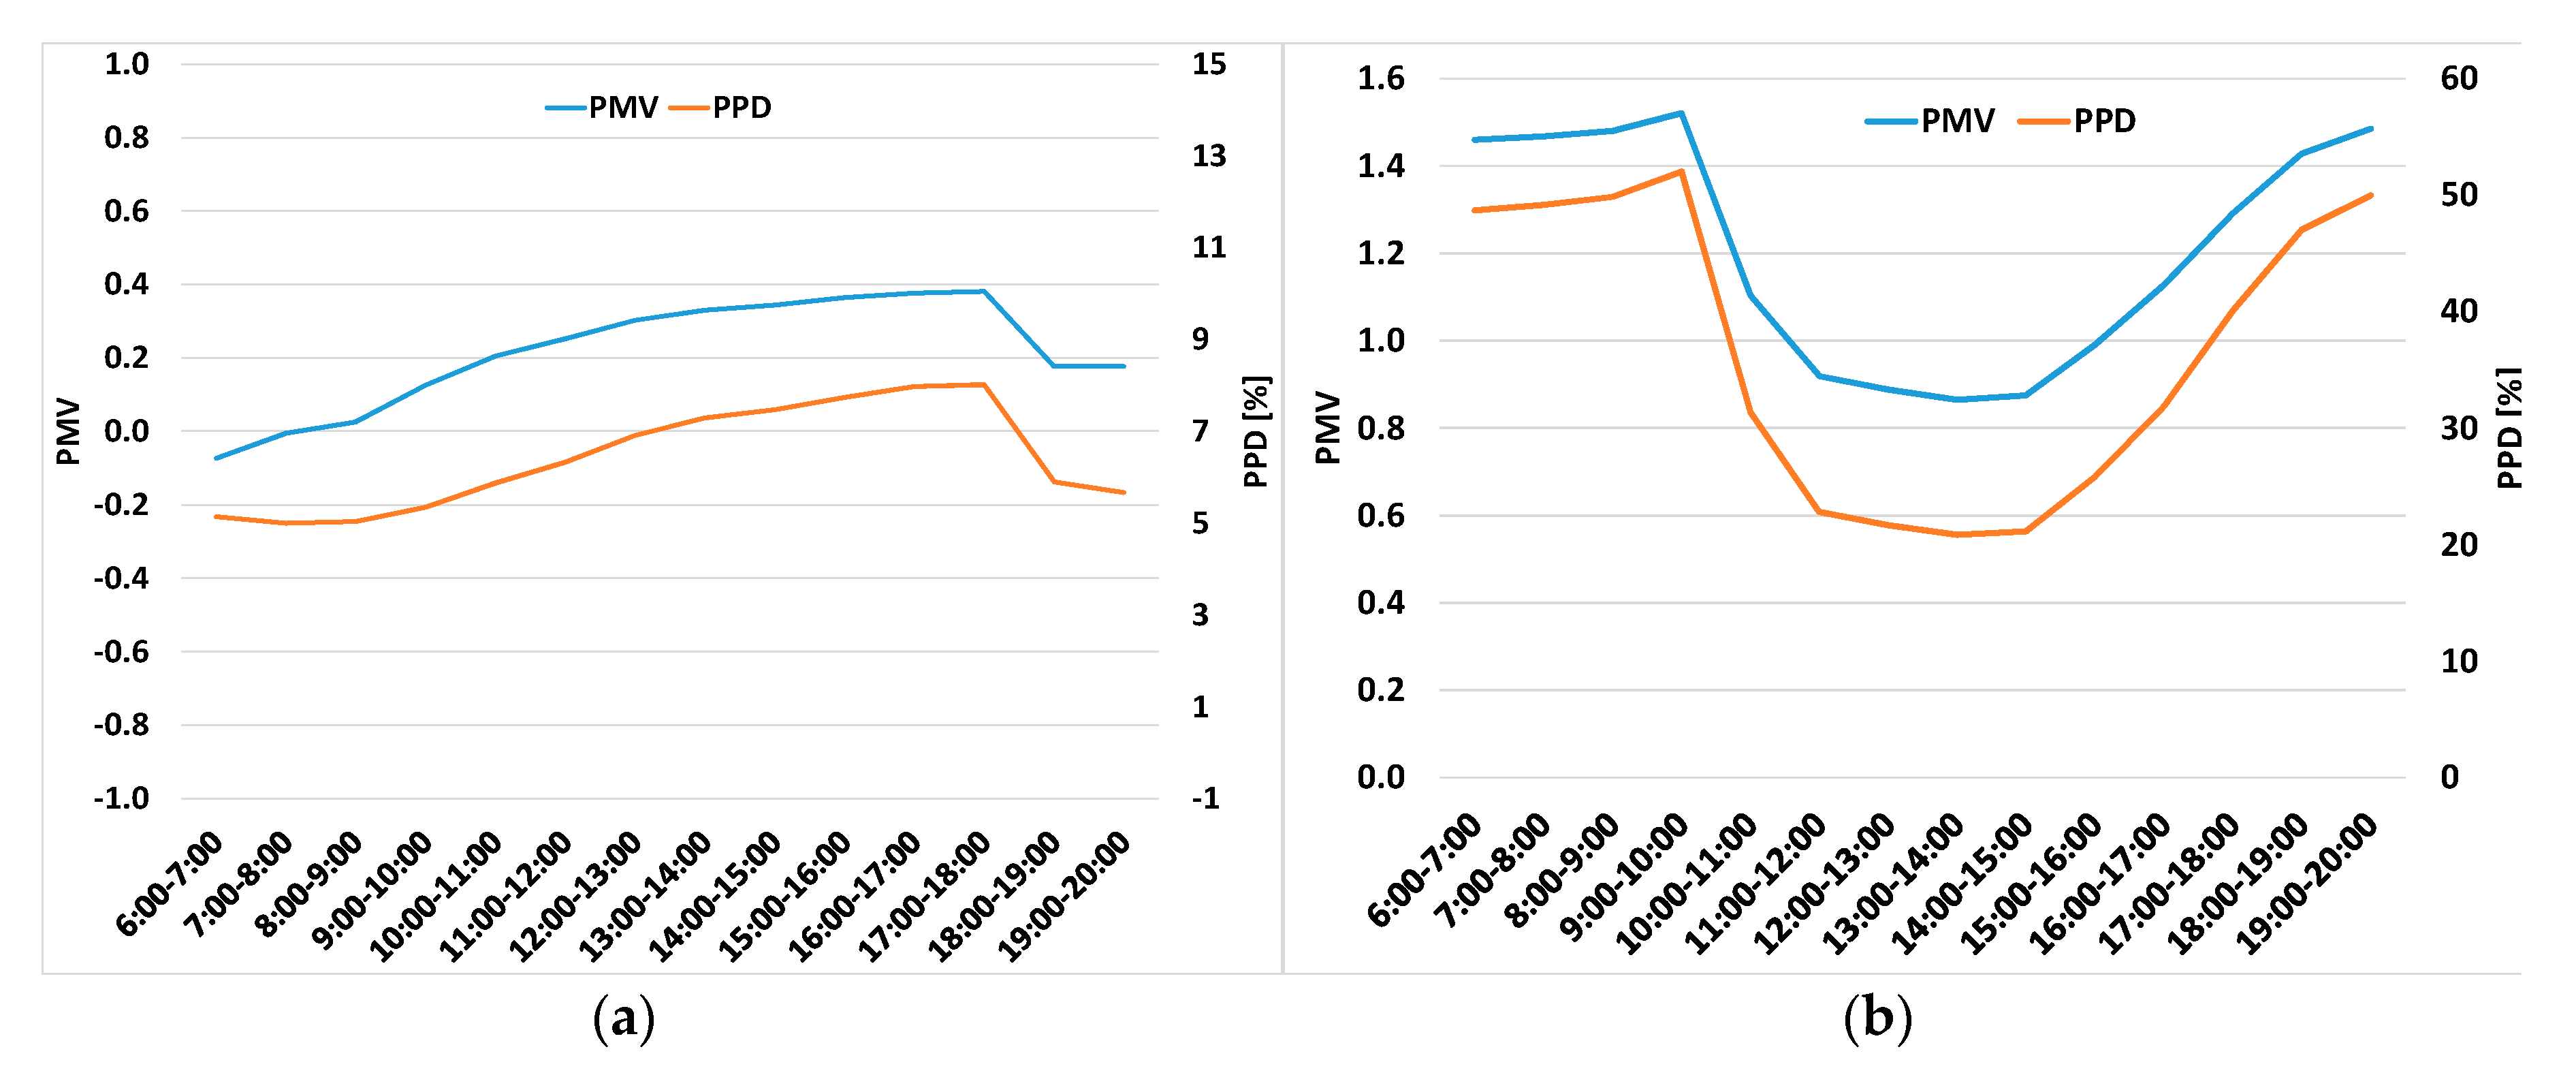
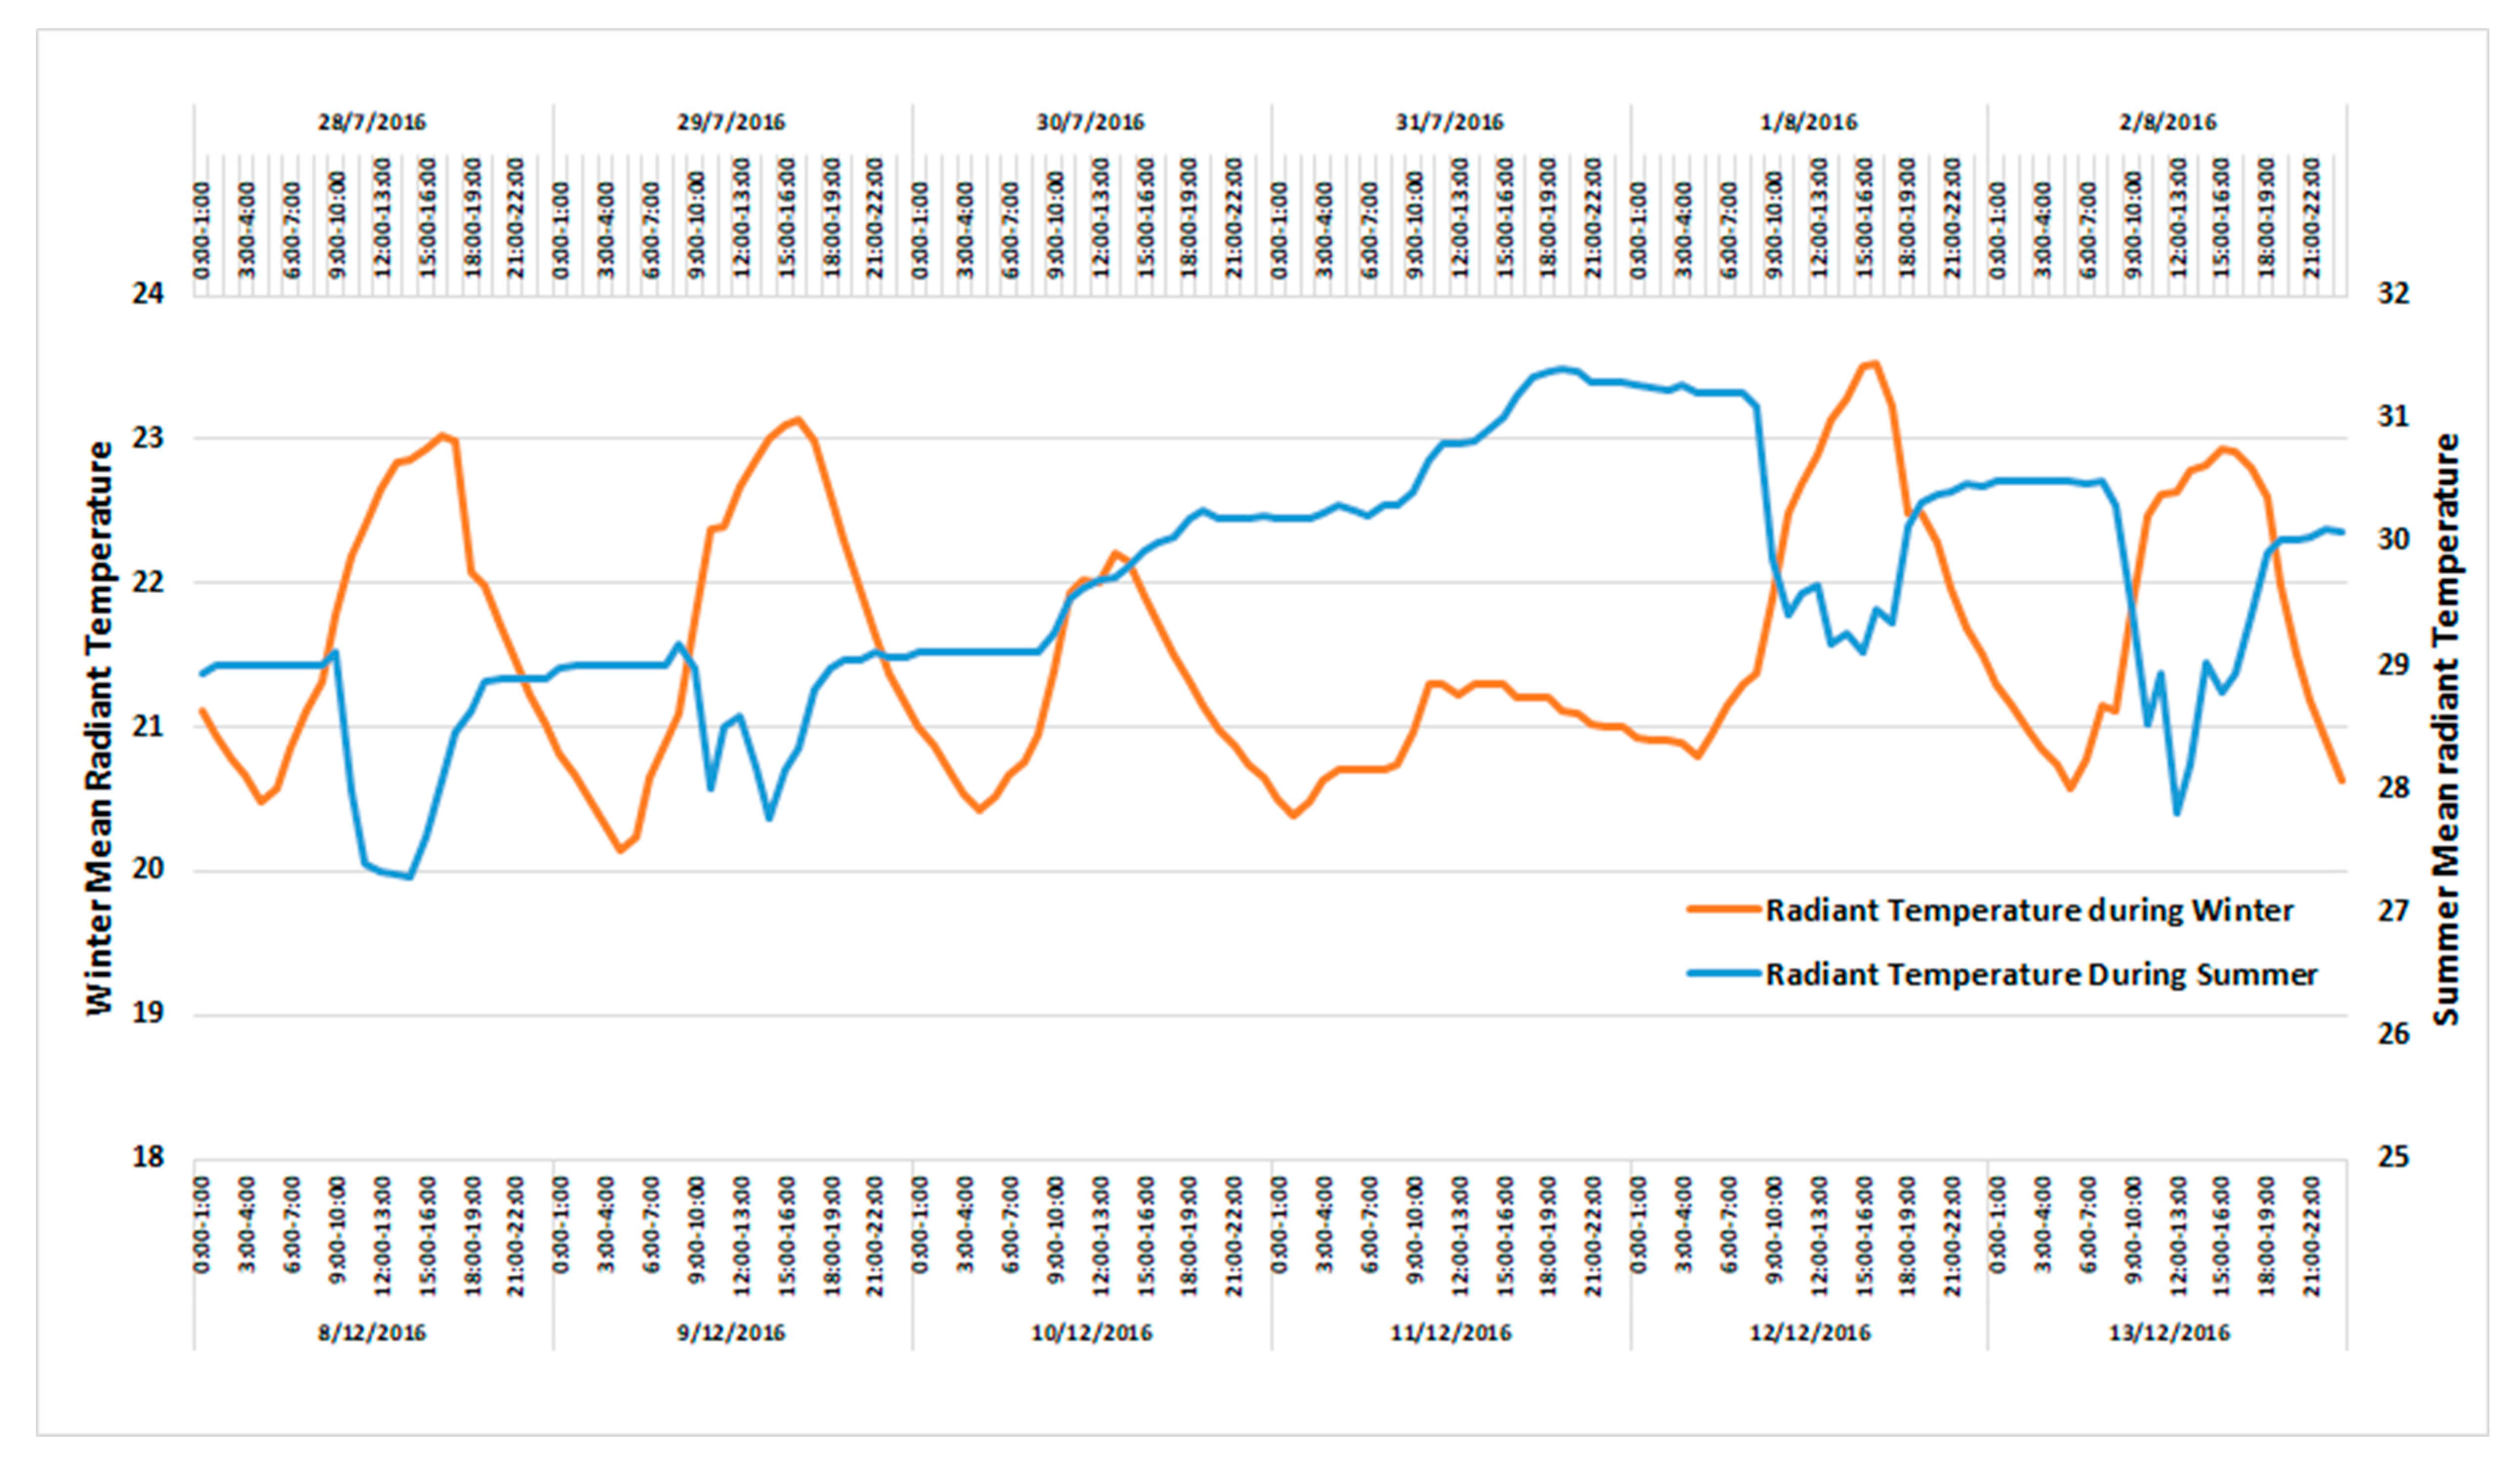
3.1. Energy Consumption and Indoor Environmental Conditions

For the base case scenario, the simulation resulted in a total annual energy demand for the office building of 79,813 kWh. Therefore, the specific energy demand of the conditioned building area is 79.81 kWh/m2. The heating demand is 31,377 kWh, the cooling one 48,436 kWh, and the respective value for lighting and equipment is 53,515 kWh. The cooling demand is almost 13% higher than the respective one for heating, as it is expected in an office building dominated by internal loads. It should be noted that the cumulative demand for cooling, lighting, and equipment, which is the total electricity demand, is 102,951 kWh. This result deviates only 6.5% from the actual, historical mean value of 92,310 kWh.
In order to achieve a holistic evaluation, the situ evaluation of the thermophysical parameters outlined that they correspond to comfortable and acceptable indoor environmental conditions as set by the relevant legislation. However, during summer there are some periods, during which the building overheats mainly due to the increased solar gains from the building’s facades, leading to mediocre indoor conditions.

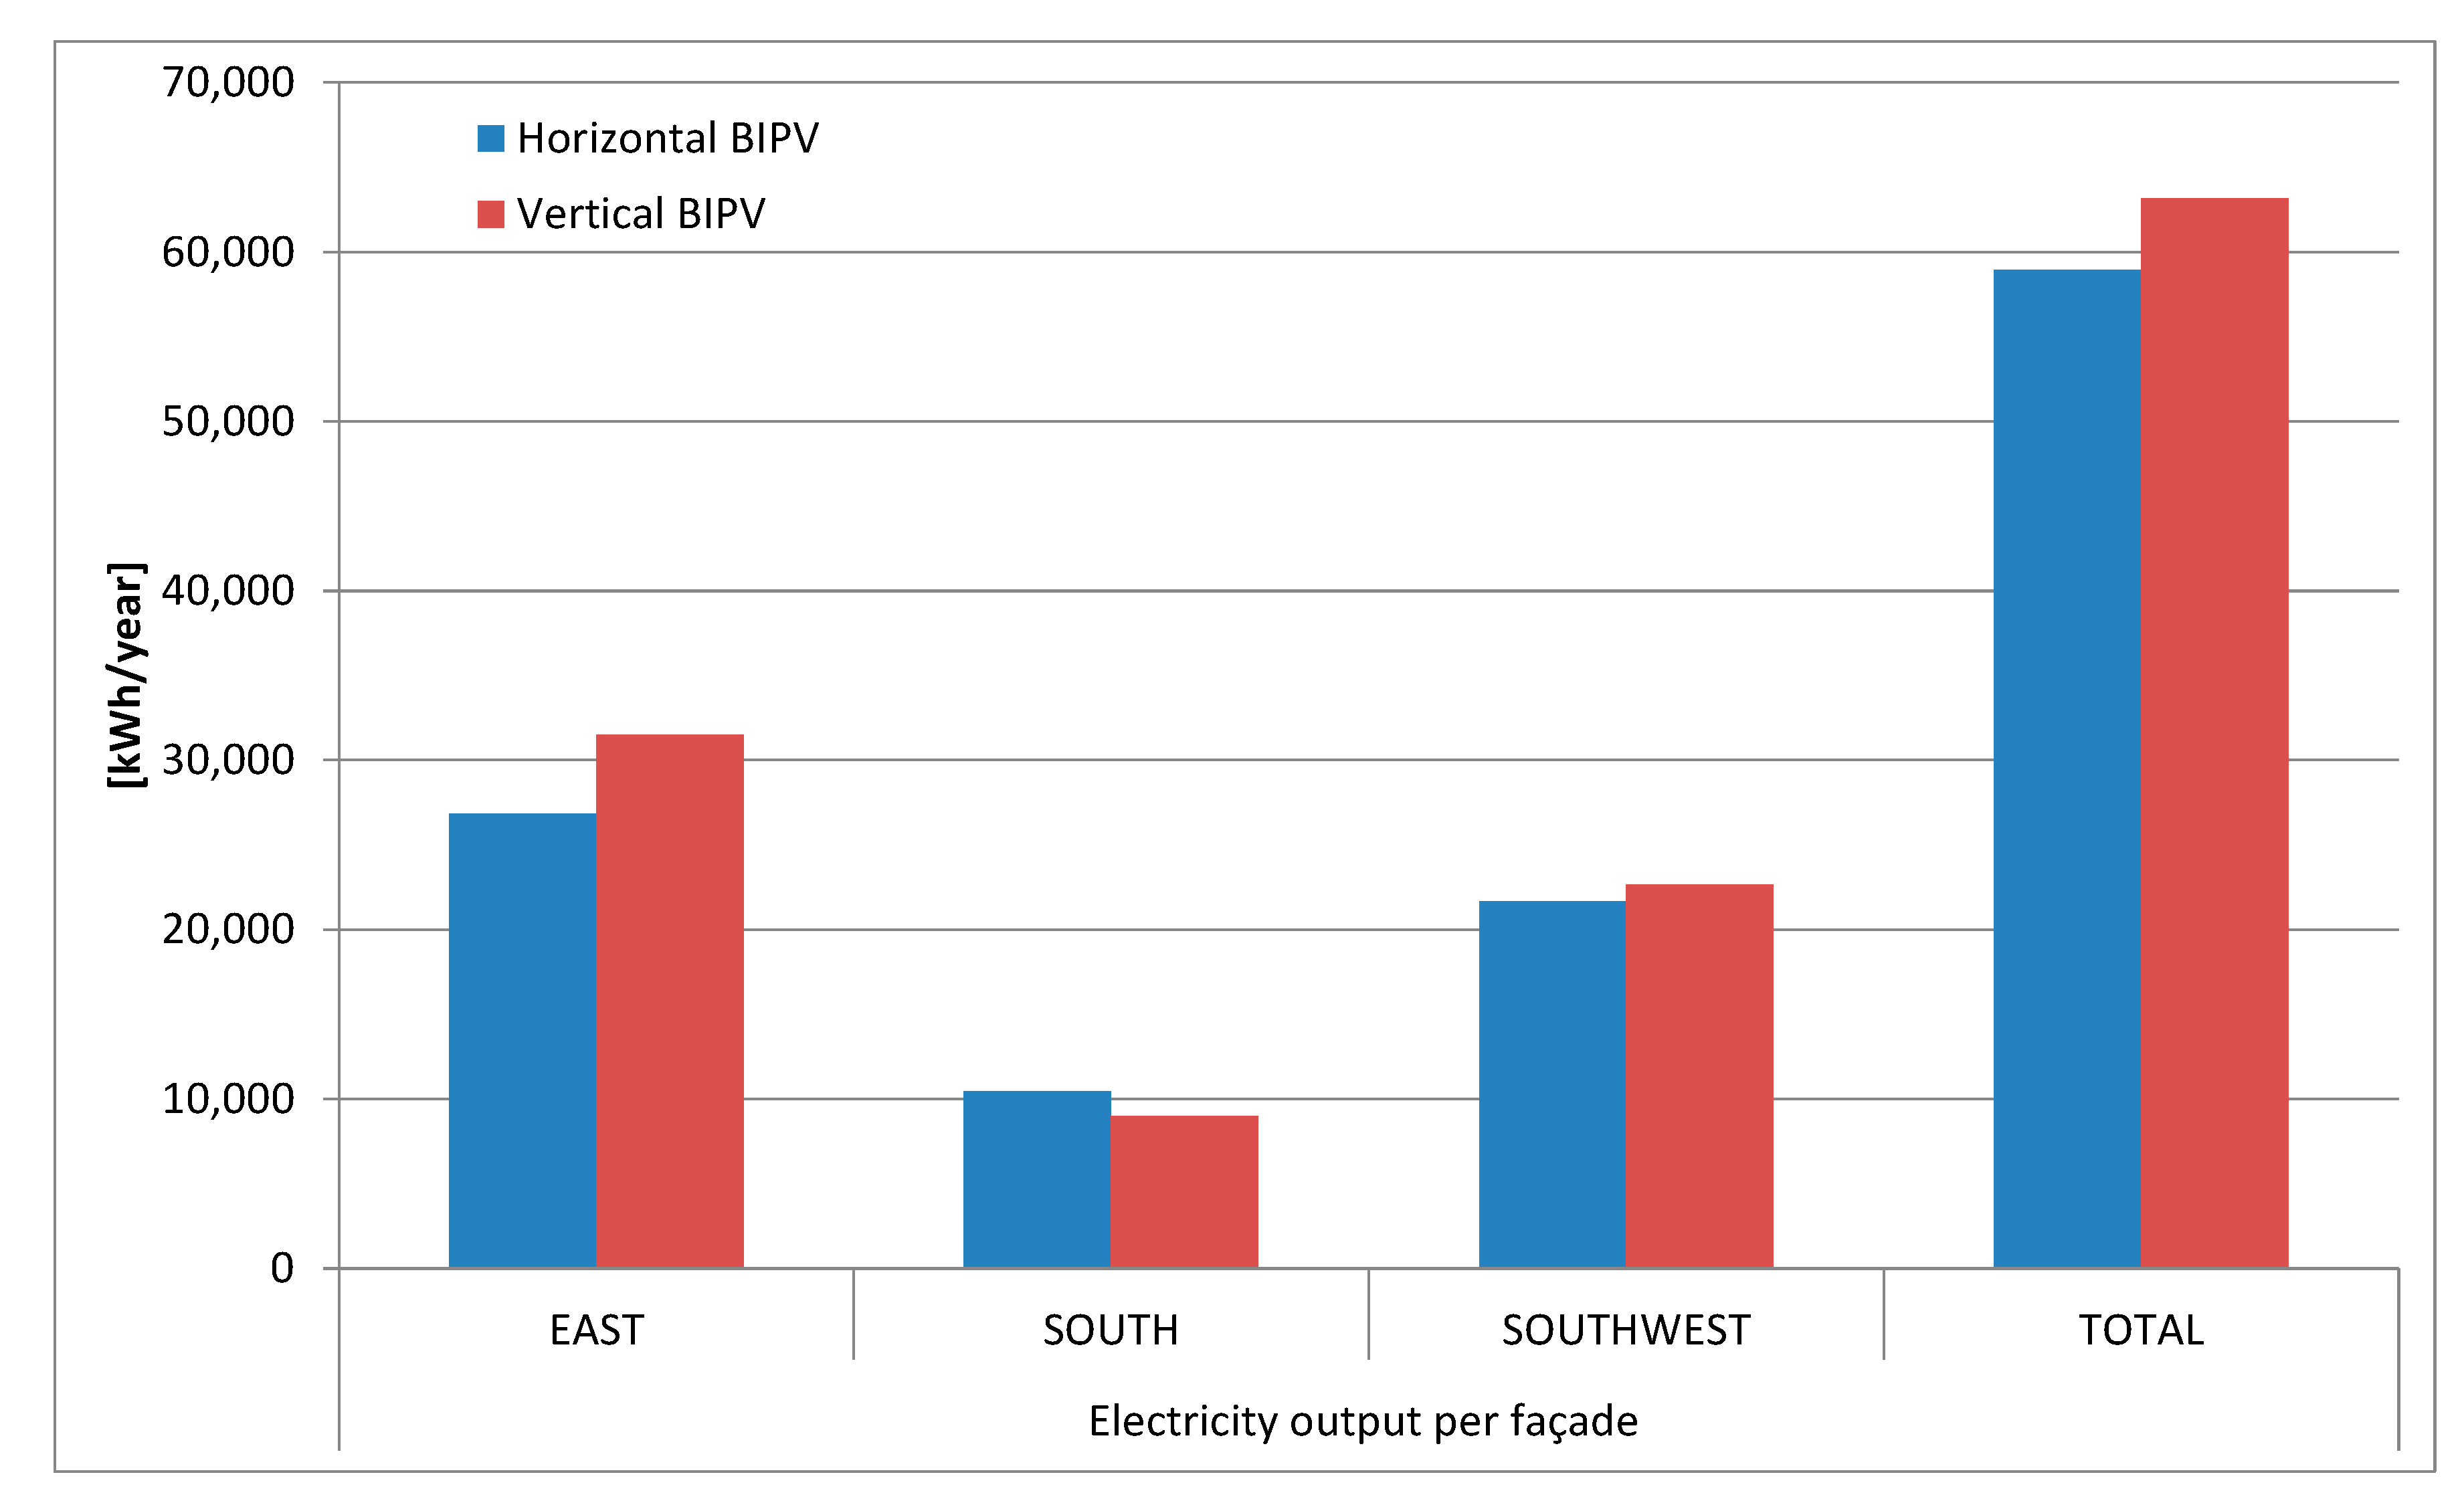
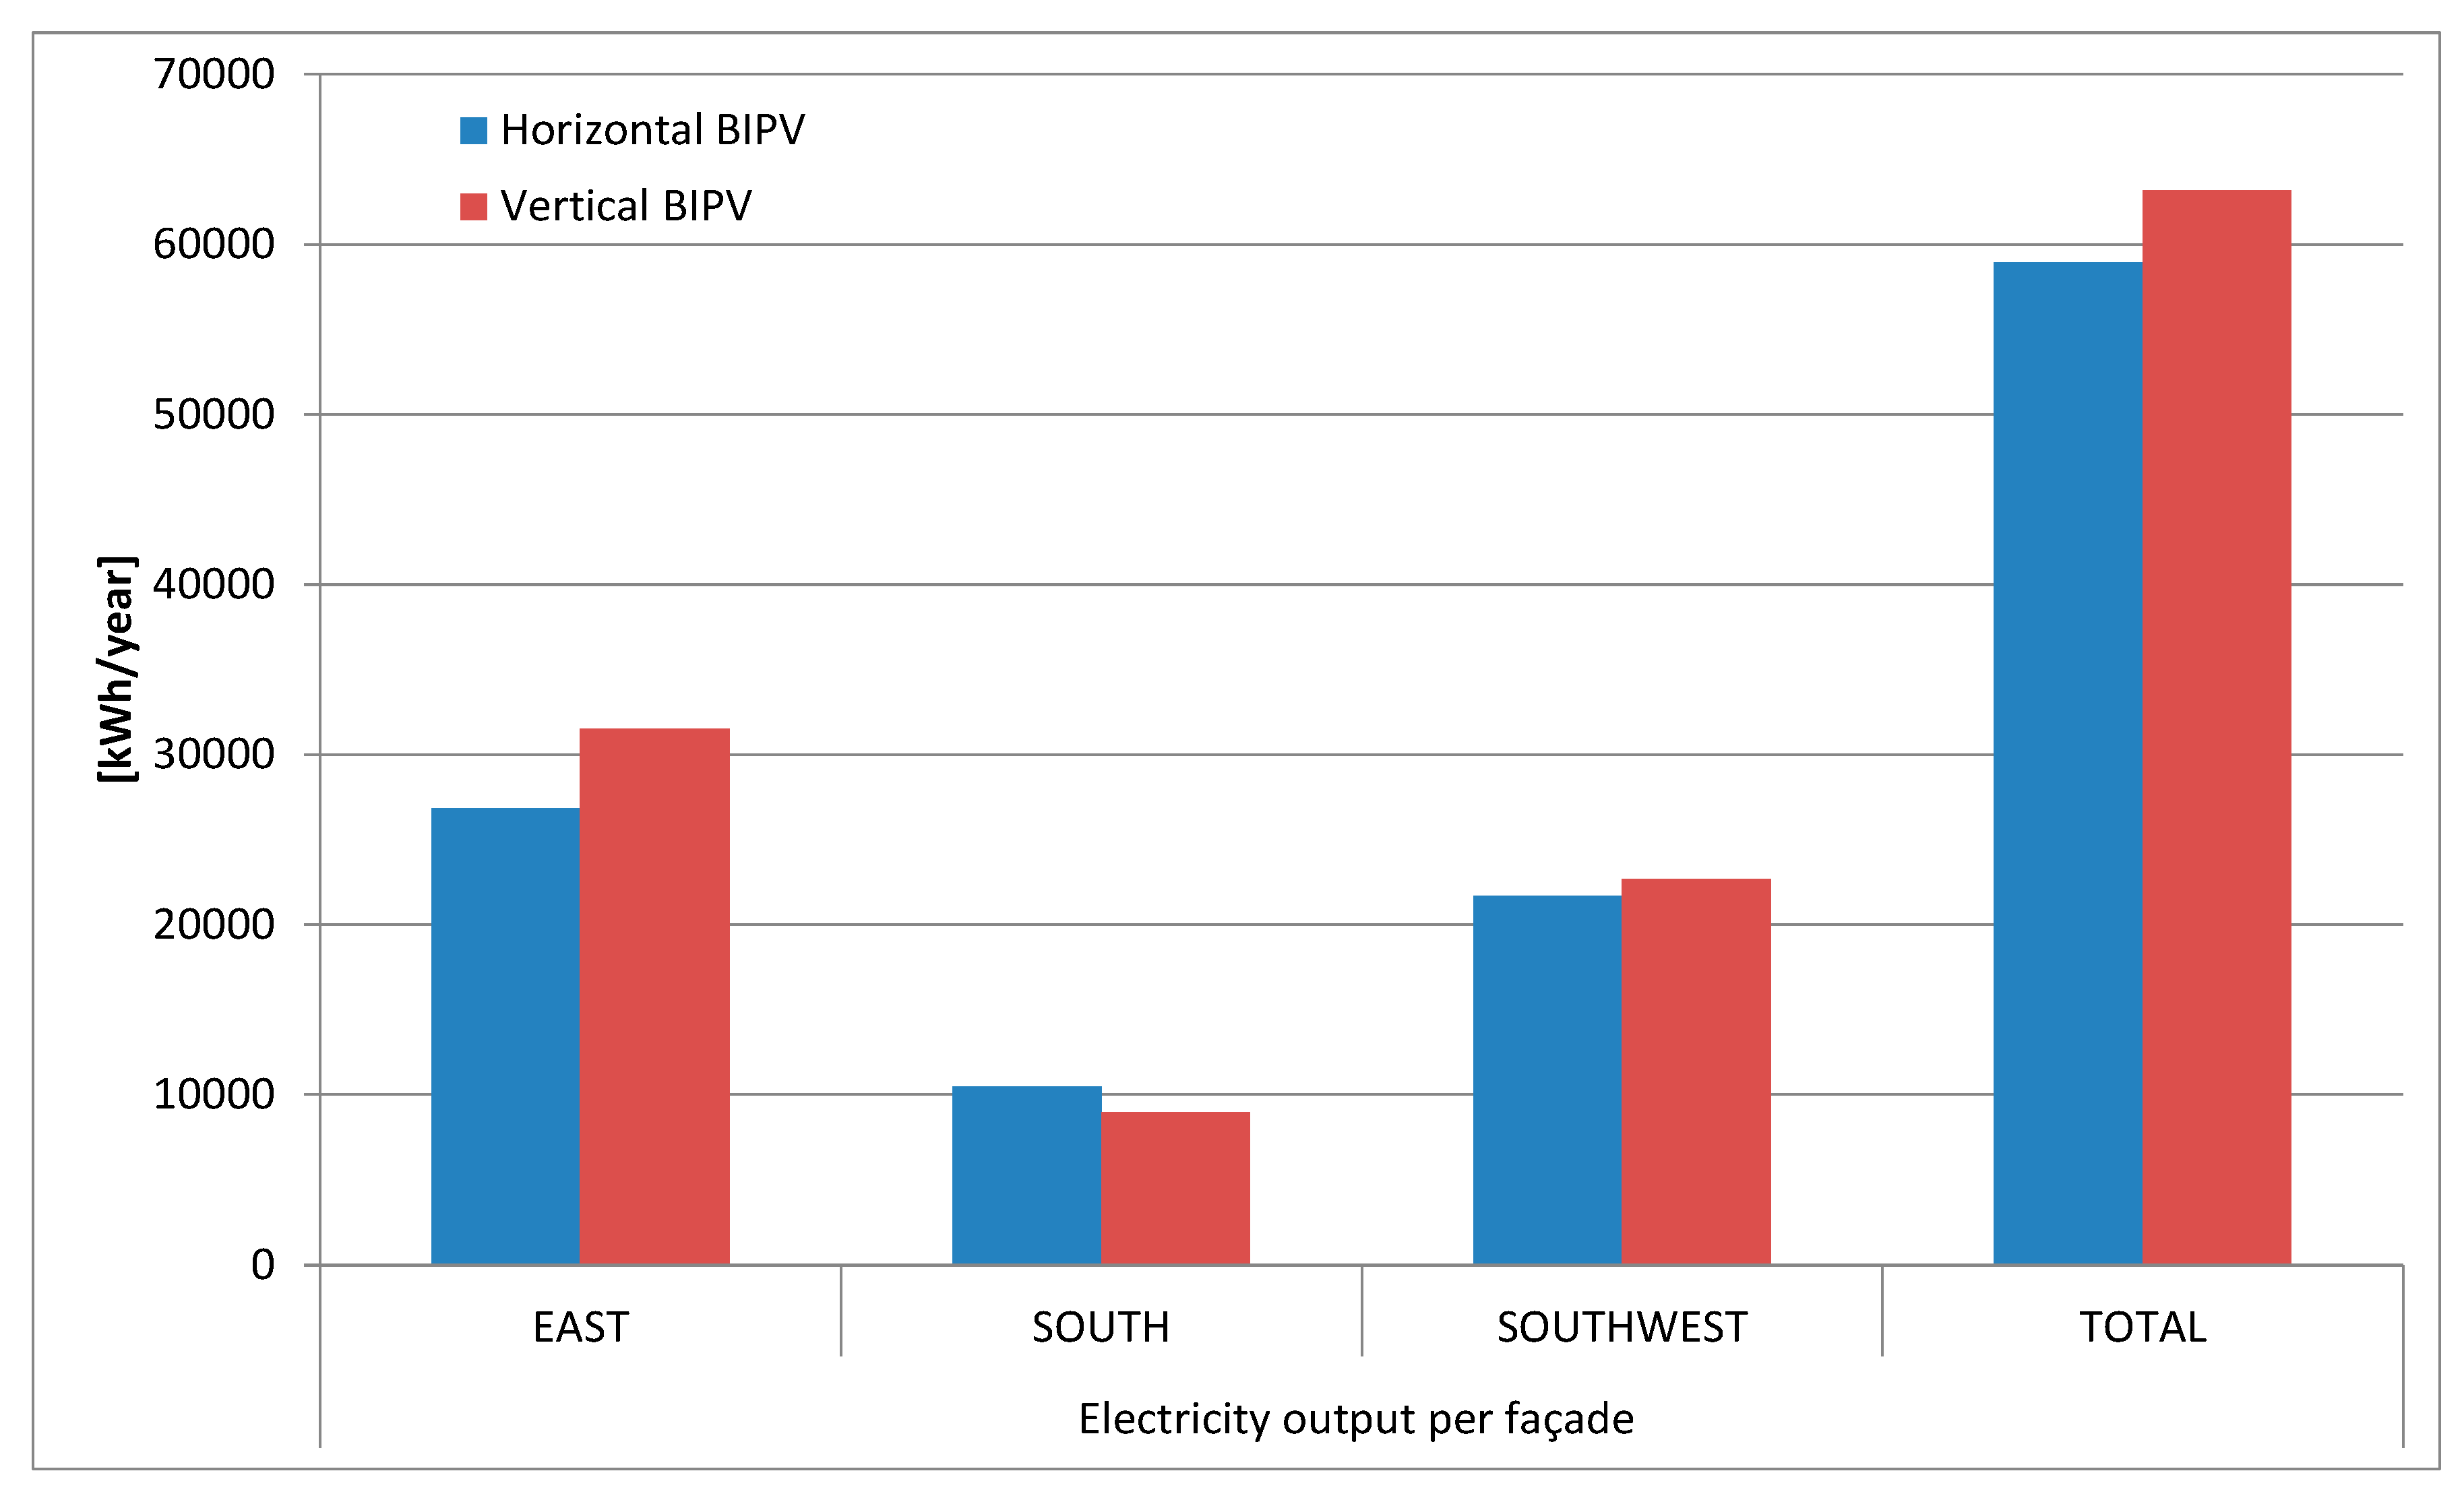
3.2. Building Integrated Shading and Building Applied Photovoltaic Retrofitting Scenarios

Following the evaluation of the existing condition of the office building, a few design proposals are investigated in order to improve the building’s energy performance through shading. Using the same assumptions as for the existing baseline building, the building model is simulated anew in EnergyPlus, with the addition of external shading devices in the transparent parts of the facades.
The four scenarios examined incorporate four variations of shading louvres: (a) fixed vertical, (b) fixed horizontal, (c) movable vertical, and (d) movable horizontal ones, considered to be covering the window areas of the three exposed facades, namely East, South, and Southwest one. The shading systems are designed in such a way as to reduce heat gains and glare, whilst maximizing the use of natural daylight in the office building.
More specifically, Scenario A examines the installation of approximately 350 fixed vertical louvres, with a surface of 0.90 m2 each, in front of the windows of the eight typical floors in the three facades (Figure 12). The distance between two adjacent louvres is set at 25 cm in order to avoid any mutual shading between the louvres throughout the day and service the easier installation of photovoltaic (PV) modules on them. The number of louvres designed for each opening varies, depending on its geometry.
In Scenario B approximately 410 m2 of horizontal louvres are used to cover the openings of the facades. Three horizontal louvres are designed per height of each window, for each one of the heated floors, with lengths varying based on the length of the opening (Figure 13). Each louvre has a width of 50 cm and is placed at approximately 55 cm away from its adjacent ones. Thus, the likelihood of over-shading or under-shading, which frequently occurs when fixed solar shading is used, is reduced to a minimum.
The remaining two scenarios, Scenario C and D, build upon the previous ones by incorporating the same geometry of louvres as in Scenario A and B respectively, with the louvres being movable instead of fixed. In Scenario C, the vertical louvres can be rotated by 90° in a longitudinal axis in the middle of the louvre blade, while in Scenario D the horizontal louvres can be rotated by 90° in a horizontal axis on their upper edge. In these scenarios (C and D) the shading louvres are simulated as fully open during the heating period, in order to maximize heat gains, and as fully closed during the cooling period.
The results of the simulations, as presented in Figure 14, show as expected, that the addition of shading greatly reduces the cooling demand, by up to 70% in Scenario D. On the other hand, the heating demand is increased by almost 35% in Scenarios A, B and D, due to the undesirable shading effect of the open louvres during the heating period.
By excluding the lighting and equipment load, which remains unaffected for all scenarios, the energy demand presents significant discrepancies between the shading scenarios. Scenario A is the least effective regarding the reduction of total energy demand, since the demand is reduced by 4910 kWh, compared to the 79,813 kWh of the baseline scenario.
As it can be observed, the movable shading systems can better optimize the flows of heat and light than the fixed ones. Since the louvres are designed to open and close seasonally, taking advantage of the path of the sun, daylight levels may be optimized whilst radiation levels are reduced to a minimum. The likelihood of over-shading during winter or under-shading during summer that frequently occur with fixed shading devices is reduced. Thus, the most promising scenario is C, with the movable vertical louvre that reduces the energy demand for heating and cooling by approximately 33% to 53,619 kWh. It is closely followed by Scenario D, which presents a 30% reduction of the demand.
The use of the blinds can double as a useful area for the integration of PV panels that can be utilized to minimize the off-site electricity requirement of the building. The proposal consists of a facade retrofitting with the installation of Building Applied Photovoltaics (BAPV) as they offer solutions that enhance the versatile function of the envelope. BAPV systems do not only offer great potential for generating electricity, but also upgrade the aesthetical and architectural form of a building as a whole.
The proposal involves the installation of the PVs on the blinds on the main façade of the building for two of the four scenarios, fixed horizontal and movable vertical blinds.
The total area available for the integration of PV’s on the blinds is given in Table 4.
The distance of the blinds is adequate so that mutual shadowing is avoided. The technical characteristics of the photovoltaics considered are presented in Table 5, and are compatible with the length and width of the blinds.
The potential for electricity production through the BAPV systems is estimated with the use of the System Advisor Model (SAM), which is used world-wide by academics and professionals analyzing, designing, and installing RES [56,57,58,59]. SAM is based on the dynamic simulation engine of TRNSYS [60] and uses hourly climatic data in the form of a Typical Meteorological Year.
By providing the software with the geometrical characteristics of the PV panels, orientation, and efficiency, the annual electricity production is calculated, along with the energy savings for each scenario. According to the existing legal framework in Greece [61], the PV arrays should be connected to the utility grid via inverters and operate under the net-metering scheme. Since the modules are designed to be integrated in various orientations, the use of multiple string inverters was selected for each façade orientation.
From the simulation results, as presented in Figure 15, it becomes apparent that both scenarios provide roughly the same amount of electricity, ranging annually from 58,945 kWh for the horizontal blinds to 63,176 kWh for the vertical ones. Thus, the energy produced from the BIPV solutions evaluated can cover more than 65% of the building’s electricity demand on an annual base.
Although the use of BIPV’s on vertical movable blinds has a higher initial cost, the added electricity production coupled with the significant reduction in the heating and cooling loads of the building highlights it as the best solution from all the scenarios investigated.

4. Conclusions

Existing office buildings present a challenge in more ways than one: They have to be refurbished, in order to improve their energy efficiency and utilize renewable to the best possible extent in order to cope with contemporary and future regulatory requirements. At the same time, indoor environmental conditions are often sub-standard and have to be improved, which is sometimes contradictory to the goal of reducing energy consumption. Both goals have to be achieved with a minimum initial investment cost in a highly competitive construction market, whilst the refurbishment work cannot disturb the work of the employees for too long, as this leads to additional costs. Finally, the regulatory framework for interventions in existing urban buildings is often rigid and restrictive. It is against this background that realistic, effective, and feasible solutions have to be elaborated.
This paper focuses on examining precisely this type of interventions, which can easily be applied to a typical 1960s’ office building, which represents some of the highest energy consumers of the Greek building sector and which also presents, exactly for all those reasons, significant potential for a meaningful and feasible energy refurbishment strategy. The proposed retrofitting measures encompass a higher performance of the building’s envelope and HVAC systems, with the integration of BIPV and BAPV systems and without getting into radical interventions on the envelope, which would be difficult to implement.
The study is based on the energy performance assessment of a typical nine-story office building in the center of Thessaloniki, and the investigation of the possibility to meet a good part of the building’s energy demand by using integrated solutions, whilst at the same time improving indoor environmental conditions, especially considering thermal and optical comfort. The scenarios investigated provide promising results in the potential for electricity production by BIPV incorporated in facades, even in dense city centers, for buildings with a variety of orientations, as they are met throughout the cities.
The amount of electricity produced can meet 65% of the building’s annual electricity requirements, while the shading options can reduce energy requirements by as much as 33%. Although this in not a value that can be dismissed easily, it becomes clear that further—and more deeply aiming—measures are needed, if the building is to achieve a nearly zero energy status.
Possible measures include an extensive upgrading of the building’s HVAC system using state of the art air-conditioning units, the installation of energy efficient lighting systems and equipment and, eventually, the use of a state-of-the-art Building Automation and Control system. The latter would truly integrate the operation of the shading, the HVAC, and the lighting system, whilst it would also provide even better thermal comfort and air quality. To that end the investigation of the cost optimal retrofitting scenario can be the scope of future research.
In conclusion, although there are significant barriers to be overcome in order to facilitate and accelerate BIPV technologies, they are rewarding solutions for retrofitting in office buildings. Their quite high initial cost may be an obstacle, but the rising energy costs on one hand and a bundle of support policies on the other can address this problem fairly easily.

Author Contributions

Conceptualization, G.M. and A.S.; Methodology, G.M. and A.M.P.; Project administration, G.M.; Resources, A.S. and P.A.; Software, G.M. and A.S.; Supervision, G.M. and A.M.P.; Validation, A.S. and P.A.; Writing—original draft, G.M., A.S., P.A. and A.M.P.; Writing—review & editing, G.M. and A.M.P.

Funding

This research received no external funding.

Conflicts of Interest

The authors declare no conflict of interest.

References

  1. Martinopoulos, G.; Papakostas, K.T.; Papadopoulos, A.M. A comparative review of heating systems in EU countries, based on efficiency and fuel cost. Renew. Sustain. Energy Rev. 2018, 90, 687–699. [Google Scholar] [CrossRef]
  2. Eurostat. Final Energy Consumption by Sector 2015. Available online: http://ec.europa.eu/eurostat/tgm/table.do?tab=table&init=1&language=en&pcode=teina225&plugin=1 (accessed on 26 June 2017).
  3. Lapillonne, B.; Sebi, C.; Pollier, K.; Mairet, N. Energy efficiency trends in buildings in the EU. Lessons from the ODYSSEE/MURE project. ADEME, Supported by Intelligent Energy Europe. 2012. Available online: http://www. odysseeindicators. org/publications/PDF/Buildings-brochure-2012.pdf (accessed on 1 December 2014).
  4. European Union. Directive 2010/75/EU of the European Parliament and of the Council. Off. J. Eur. Union 2010, 334, 17–19. [Google Scholar]
  5. European Union. Directive 2009/28/EC of the European Parliament and of the Council of 23 April 2009 on the promotion of the use of energy from renewable sources and amending and subsequently repealing Directives 2001/77/EC and 2003/30/EC. Off. J. Eur. Union 2009, 5, 16–62. [Google Scholar]
  6. Kammen, D.M.; Sunter, D.A. City-integrated renewable energy for urban sustainability. Science 2016, 352, 922–928. [Google Scholar] [CrossRef] [PubMed] [Green Version]
  7. Omer, A.M. Renewable building energy systems and passive human comfort solutions. Renew. Sustain. Energy Rev. 2008, 12, 1562–1587. [Google Scholar] [CrossRef]
  8. Martinopoulos, G.; Tsalikis, G. Diffusion and adoption of solar energy conversion systems–The case of Greece. Energy 2018, 144, 800–807. [Google Scholar] [CrossRef]
  9. Buonomano, A.; Forzano, C.; Kalogirou, S.A.; Palombo, A. Building-façade integrated solar thermal collectors: Energy-economic performance and indoor comfort simulation model of a water based prototype for heating, cooling, and DHW production. Renew. Energy 2018. [Google Scholar] [CrossRef]
  10. Mandalaki, M.; Zervas, K.; Tsoutsos, T.; Vazakas, A. Assessment of fixed shading devices with integrated PV for efficient energy use. Sol. Energy 2012, 86, 2561–2575. [Google Scholar] [CrossRef]
  11. European Union. Directive 2002/91/EC of the European Parliament and of the Council of 16 December 2002 on the energy performance of buildings. Off. J. Eur. Union 2003, 1, 65–71. [Google Scholar]
  12. European Union. Directive (EU) 2018/844 of the European Parliament and of the Council of 30 May 2018 amending Directive 2010/31/EU on the energy performance of buildings and Directive 2012/27/EU on energy efficiency. Off. J. Eur. Union 2018, 156, 75–91. [Google Scholar]
  13. Yang, L.; Yan, H.; Lam, J.C. Thermal comfort and building energy consumption implications—A review. Appl. Energy 2014, 115, 164–173. [Google Scholar] [CrossRef]
  14. Pérez-Lombard, L.; Ortiz, J.; Pout, C. A review on buildings energy consumption information. Energy Build. 2008, 40, 394–398. [Google Scholar] [CrossRef]
  15. Rupp, R.F.; Vásquez, N.G.; Lamberts, R. A review of human thermal comfort in the built environment. Energy Build. 2015, 105, 178–205. [Google Scholar] [CrossRef]
  16. Antoniadou, P.; Papadopoulos, A.M. Occupants’ thermal comfort: State of the art and the prospects of personalized assessment in office buildings. Energy Build. 2017, 153, 136–149. [Google Scholar] [CrossRef]
  17. Kuznik, F.; Virgone, J.; Johannes, K. In-situ study of thermal comfort enhancement in a renovated building equipped with phase change material wallboard. Renew. Energy 2011, 36, 1458–1462. [Google Scholar] [CrossRef]
  18. Antoniadou, P.; Papadopoulos, A.M. Development of an Integrated, Personalized Comfort Methodology for Office Buildings. Energies 2017, 10, 1202. [Google Scholar] [CrossRef]
  19. Liang, H.H.; Lin, T.P.; Hwang, R.L. Linking occupants’ thermal perception and building thermal performance in naturally ventilated school buildings. Appl. Energy 2012, 94, 355–363. [Google Scholar] [CrossRef]
  20. Asdrubali, F.; Buratti, C.; Cotana, F.; Baldinelli, G.; Goretti, M.; Moretti, E.; Baldassarri, C.; Belloni, E.; Bianchi, F.; Rotili, A.; et al. Evaluation of green buildings’ overall performance through in situ monitoring and simulations. Energies 2013, 6, 6525–6547. [Google Scholar] [CrossRef]
  21. Karava, P.; Athienitis, A.K.; Stathopoulos, T.; Mouriki, E. Experimental study of the thermal performance of a large institutional building with mixed-mode cooling and hybrid ventilation. Build. Environ. 2012, 57, 313–326. [Google Scholar] [CrossRef]
  22. Tian, L.; Lin, Z.; Wang, Q. Experimental investigation of thermal and ventilation performances of stratum ventilation. Build. Environ. 2011, 46, 1309–1320. [Google Scholar] [CrossRef]
  23. Akimoto, T.; Tanabe, S.I.; Yanai, T.; Sasaki, M. Thermal comfort and productivity-Evaluation of workplace environment in a task conditioned office. Build. Environ. 2010, 45, 45–50. [Google Scholar] [CrossRef]
  24. Gao, J.; Wang, Y.; Wargocki, P. Comparative analysis of modified PMV models and SET models to predict human thermal sensation in naturally ventilated buildings. Build. Environ. 2015, 92, 200–208. [Google Scholar] [CrossRef]
  25. Bravo, G.; González, E. Thermal comfort in naturally ventilated spaces and under indirect evaporative passive cooling conditions in hot–humid climate. Energy Build. 2013, 63, 79–86. [Google Scholar] [CrossRef]
  26. Indraganti, M.; Ooka, R.; Rijal, H.B. Thermal comfort in offices in summer: findings from a field study under the ‘setsuden’conditions in Tokyo, Japan. Build. Environ. 2013, 61, 114–132. [Google Scholar] [CrossRef]
  27. Indraganti, M.; Ooka, R.; Rijal, H.B. Thermal comfort in offices in India: Behavioral adaptation and the effect of age and gender. Energy Build. 2015, 103, 284–295. [Google Scholar] [CrossRef]
  28. Vesely, M.; Zeiler, W.; Li, R. Comparison of thermal comfort and sensation scales: A case study. In Proceedings of the 2015 Healthy Buildings Europe Conference, Eindhoven, The Netherlands, 18–20 May 2015. [Google Scholar]
  29. Paone, A.; Bacher, J.P. The Impact of Building Occupant Behavior on Energy Efficiency and Methods to Influence It: A Review of the State of the Art. Energies 2018, 11, 953. [Google Scholar] [CrossRef]
  30. Ergonomics of the Thermal Environment—Analytical Determination and Interpretation of Thermal Comfort Using Calculation of the PMV and PPD Indices and Local Thermal Comfort Criteria; ISO E. 7730; Standards Norway: Oslo, Norway, 2005.
  31. Standard, S.T. Ergonomics of the Thermal Environment—Instruments for Measuring Physical Quantities; EN ISO 7726; International Organization for Standardization: Geneva, Switzerland, 1998. [Google Scholar]
  32. American Society of Heating, Refrigerating, & Air-Conditioning Engineers. Ventilation for Acceptable Indoor Air Quality. American Society of Heating, Refrigerating and Air-Conditioning Engineers; ASME: New York, NY, USA, 2002. [Google Scholar]
  33. Ma, Z.; Cooper, P.; Daly, D.; Ledo, L. Existing building retrofits: Methodology and state-of-the-art. Energy Build. 2012, 55, 889–902. [Google Scholar] [CrossRef]
  34. Attia, S.; Hamdy, M.; O’Brien, W.; Carlucci, S. Assessing gaps and needs for integrating building performance optimization tools in net zero energy buildings design. Energy Build. 2013, 60, 110–124. [Google Scholar] [CrossRef] [Green Version]
  35. Bahadori-Jahromi, A.; Salem, R.; Mylona, A.; Godfrey, P.; Cook, D. Retrofit of a UK residential property to achieve nearly zero energy building standard. Adv. Environ. Res. 2018, 7, 13–28. [Google Scholar]
  36. Rallapalli, H.S. A Comparison of EnergyPlus and eQUEST Whole Building Energy Simulation Results for a Medium Sized Office Building. Doctoral Dissertation, Arizona State University, Tempe, AZ, USA, 2010. [Google Scholar]
  37. Gratia, E.; De Herde, A. Design of low energy office buildings. Energy Build. 2003, 35, 473–491. [Google Scholar] [CrossRef]
  38. Hellenic Statistical Authority (ELSTAT). 2011 General Census of Buildings; ELSTAT: Piraeus, Greece, 2015. [Google Scholar]
  39. Johansson, P.; Wahlgren, P. Renovation of buildings from before 1945: Status assessment and energy efficiency measures. Energy Procedia 2017, 132, 951–956. [Google Scholar] [CrossRef]
  40. Nikolaou, T.; Skias, I.; Kolokotsa, D.; Stavrakakis, G. Virtual building dataset for energy and indoor thermal comfort benchmarking of office buildings in Greece. Energy Build. 2009, 41, 1409–1416. [Google Scholar] [CrossRef]
  41. Greek Parliament. Regulation for the Energy Performance of Buildings (K.EN.A.K.); Official Gazette of the Hellenic Republic: Athens, Greece, 2010; pp. 5333–5356. [Google Scholar]
  42. Martinopoulos, G.; Papakostas, K.T.; Papadopoulos, A.M. Comparative analysis of various heating systems for residential buildings in Mediterranean climate. Energy Build. 2016, 124, 79–87. [Google Scholar] [CrossRef]
  43. Theodoridou, I.; Papadopoulos, A.M.; Hegger, M. A typological classification of the Greek residential building stock. Energy Build. 2011, 43, 2779–2787. [Google Scholar] [CrossRef]
  44. Grigoropoulos, E.; Anastaselos, D.; Nižetić, S.; Papadopoulos, A.M. Effective ventilation strategies for net zero-energy buildings in Mediterranean climates. Int. J. Vent. 2017, 16, 291–307. [Google Scholar] [CrossRef]
  45. d’Ambrosio Alfano, F.R.; Palella, B.I.; Riccio, G. Notes on the Calculation of the PMV index by means of Apps. Energy Procedia 2016, 101, 249–256. [Google Scholar] [CrossRef]
  46. d’Ambrosio Alfano, F.R.; Palella, B.I.; Riccio, G.; Malchaire, J. On the Effect of Thermophysical Properties of Clothing on the Heat Strain Predicted by PHS Model. Ann. Occup. Hyg. 2016, 60, 231–251. [Google Scholar] [CrossRef]
  47. Crawley, D.B.; Lawrie, L.K.; Pedersen, C.O.; Winkelmann, F.C. Energy plus: Energy simulation program. ASHRAE J. 2000, 42, 49–56. [Google Scholar]
  48. Villarino, J.I.; Villarino, A.; Fernández, F.Á. Experimental and modelling analysis of an office building HVAC system based in a ground-coupled heat pump and radiant floor. Appl. Energy 2017, 190, 1020–1028. [Google Scholar] [CrossRef]
  49. Martinopoulos, G.; Kikidou, V.; Bozis, D. Energy Assessment of Building Physics Principles in Secondary Education Buildings. Energies 2018, 11, 2929. [Google Scholar] [CrossRef]
  50. Zhang, R.; Hong, T. Modeling of HVAC operational faults in building performance simulation. Appl. Energy 2017, 202, 178–188. [Google Scholar] [CrossRef] [Green Version]
  51. Big Ladder Software. Euclid. 2017. Available online: https://bigladdersoftware.com/projects/euclid/ (accessed on 2 December 2017).
  52. Royapoor, M.; Roskilly, T. Building model calibration using energy and environmental data. Energy Build. 2015, 94, 109–120. [Google Scholar] [CrossRef]
  53. Ruiz, G.R.; Bandera, C.F. Validation of Calibrated Energy Models: Common Errors. Energies 2017, 10, 1587. [Google Scholar] [CrossRef]
  54. Coakley, D.; Raftery, P.; Keane, M. A review of methods to match building energy simulation models to measured data. Renew. Sustain. Energy Rev. 2014, 37, 123–141. [Google Scholar] [CrossRef]
  55. Larochelle Martin, G.; Monfet, D.; Nouanegue, H.F.; Sansreret, S.; Lavigne, K. Calibration of EnergyPlus HVAC models using optimization. In Proceedings of the IBPSA, eSim 2016 Conference, Hamilton, Canada, 3–4 May 2016. [Google Scholar]
  56. Martinopoulos, G. Life Cycle Assessment of solar energy conversion systems in energetic retrofitted buildings. J. Build. Eng. 2018, 20, 256–263. [Google Scholar] [CrossRef]
  57. Alashkar, A.; Gadalla, M. Thermo-economic analysis of an integrated solar power generation system using nanofluids. Appl. Energy 2017, 191, 469–491. [Google Scholar] [CrossRef]
  58. Brodrick, P.G.; Brandt, A.R.; Durlofsky, L.J. Optimal design and operation of integrated solar combined cycles under emissions intensity constraints. Appl. Energy 2018, 226, 979–990. [Google Scholar] [CrossRef]
  59. Tsalikis, G.; Martinopoulos, G. Solar energy systems potential for nearly net zero energy residential buildings. Sol. Energy 2015, 115, 743–756. [Google Scholar] [CrossRef]
  60. Trnsys, A. Transient System Simulation Program; University of Wisconsin: Madison, WI, USA, 2000. [Google Scholar]
  61. Law B3583/2014, Production of Renewable Energy Sources from Self-Producers with Net Metering in Accordance with Law 3468/2006, Athens, Greece, 2014. (In Greek)
Figure 1. Floor plan of typical levels (1 to 8).
Sustainability 10 04670 g001
Figure 2. Sections of typical building elements.
Sustainability 10 04670 g002
Figure 3. Temperature levels of the external and all the indoor environment of the under evaluation building during winter.
Sustainability 10 04670 g003
Figure 4. Temperature levels of the external and all the indoor environment of the under evaluation building during summer.
Sustainability 10 04670 g004
Figure 5. CO2 levels of the under evaluation building, during winter and summer monitoring.
Sustainability 10 04670 g005
Figure 6. Variation of Predicted Mean Vote (PMV) index in the under evaluation building, during a typical day in: (a) winter (8 December 2016) and (b) summer (28 July 2016) along with the respective Predicted Percentage of Dissatisfaction (PPD) rates.
Sustainability 10 04670 g006
Figure 7. Variation of the mean radiant temperature, during the heating and cooling season.
Sustainability 10 04670 g007
Figure 8. Building model with the constructive elements of the envelope and the surrounding shading surfaces (SketchUp–Euclid).
Sustainability 10 04670 g008
Figure 9. Comparison of simulated and measured indoor air temperature during a typical office day (28 July 2016) (a) and typical weekend day (31 July 2016) (b) during summer.
Sustainability 10 04670 g009aSustainability 10 04670 g009b
Figure 10. Comparison of simulated and measured indoor air temperature during a typical office day (8 December 2016) (a) and typical weekend day (11 December 2016) (b) during winter.
Sustainability 10 04670 g010
Figure 11. Comparison of simulated and measured indoor mean radiant temperature during a typical office day (8 December 2016) during winter.
Sustainability 10 04670 g011aSustainability 10 04670 g011b
Figure 12. Building model with vertical louvres.
Sustainability 10 04670 g012
Figure 13. Building model with horizontal louvres.
Sustainability 10 04670 g013
Figure 14. Monthly Energy demand for various shading scenarios.
Sustainability 10 04670 g014
Figure 15. Electricity production for the Building Applied Photovoltaics (BAPV) scenarios.
Sustainability 10 04670 g015aSustainability 10 04670 g015b
Table 1. Building Specifications per floor.
Heated Surface (m²)Unheated Surface (m²)
Basement-170
Ground floor-142
Typical floors (1st to 8th)12517
9th floor-40
Total1000488
Table 2. Building elements characteristics.
Building ElementsU-Values (W/m2K)Max U-Values (W/m²K)–Zone D
Double brick wall with metal sheet outer layer (no insulation)1.050.33
Concrete slab with tiled floor with no insulation (Ground floor)2.500.35
Concrete slab with laminate flooring with no insulation (offices)2.100.35
Flat roof3.300.35
Doors/Windows3.102.60
Table 3. Technical Characteristics of the Equipment used.
Sensor PlacementMeasuring ParameterRangeAccuracySensor Type
Indoor EnvironmentAir temperature−20 °C to 70 °C±0.21 °CHOBO UX100-003
Air Relative Humidity15% to 95% RH±3.5% RH
Radiant temperature0 to +120 °CType K thermocouple, class1TESTO 480 with Globe thermometer, IAQ and comfort sensor
Air velocity0 to +5 m/s±0.03 m/s
CO2 concentration0 to 10,000 ppm±75 ppm
PMV/PPD based on ISO 7730 algorithm−3 to +3±0.001
Outdoor EnvironmentAir temperature−40 °C to 80 °C±0.20 °C
Air Relative Humidity0% to 100% RH±2% RH
Air speed0 to 40 m/s0.5%
Solar Irradiance0–2000 W/m²<3%
Table 4. Area Available for photovoltaics per façade.
ScenarioPV Area in m² per Façade
EASTSOUTHSOUTHWEST
Horizontal BIPV20356146
Vertical BIPV15243116
Table 5. Technical characteristics of the photovoltaic panels.
Maximum Power (Pmax) (V)75
Max Power Voltage (Vmpp) (V)9.05
Max Power Current (Impp) (A)8.04
Open circuit Voltage (Voc) (V)11.19
Closed circuit Current (Isc) (A)8.59
Module efficiency13%
Dimensions (Χ × Υ × Ζ) (mm)1000 × 534 × 42
Operating Temperature (°C)−40 °C to +90 °C

