Spatiotemporal Variation and Inequality in China’s Economic Resilience across Cities and Urban Agglomerations


1
Institute of Regional and Urban-Rural Development, Wuhan University, 299 Bayi Road, Wuhan 430072, China
2
School of Tourism Management, Colorado State University, Fort Collins, CO 80523, USA
3
School of Earth and Environmental Sciences, The University of Queensland, Brisbane 4072, Australia
4
School of Urban and Regional Science, East China Normal University, Shanghai 200241, China
5
Institute for Global Innovation and Development, East China Normal University, Shanghai 200241, China
6
Institute of Eco-Chongming, East China Normal University, Shanghai 200241, China
*
Authors to whom correspondence should be addressed.
†
The correspondence authors contributed equally to this work.
Sustainability 2018, 10(12), 4754; https://0-doi-org.brum.beds.ac.uk/10.3390/su10124754
Submission received: 11 November 2018
/
Revised: 9 December 2018
/
Accepted: 11 December 2018
/
Published: 13 December 2018
(This article belongs to the Special Issue Economic Geography: Location, Innovation and Sustainable Development)
Abstract
:Economic resilience is a critical indicator of the sustainable development of an urban economy. This paper measures the urban economic resilience (UER) of 286 major cities in China from six indicators—economic growth, opening up, social development, environmental protection, natural conditions, and technological innovation—using a subjective and objective weighting method and the Technique for Order of Preference by Similarity to Ideal Solution (TOPSIS) methods. Furthermore, kernel density estimation (KDE) was used to reveal the spatial and temporal trends in UER across cities, and a social opportunity function was applied to access the opportunity for economic resilience and the fairness of opportunities for economic resilience in 19 urban agglomerations in China. The results show that the UER was, in general, low across all cities but increased over time. Geographically, the UER disperses from the eastern coast to inland cities. Amongst urban agglomerations in China, the economic resilience opportunity index also varies spatially and increases over time. On the other hand, the opportunity fairness index of UER remained largely stable and substantial inequalities exist across all urban agglomerations, indicating the need for differentiated policy intervention to ensure equality and the sustainable development of the region. The methodology developed in this research can also be applied in other cities and regions to test its re-applicability and to understand the UER in different contexts.
1. Introduction
The term “resilience” originates from engineering physics. The ecologist Holling (1973) used this term to describe the ability of a system to maintain stability or return to an original state after suffering an external perturbation [1]. Economists have also used the concept of resilience to explain complex interactions in global markets, and used economic resilience to define the ability of an economy to respond to risks. Such resilience is the result of evolutionary interactions among the economy, the external environment, effective governance, and other determinants [2].
Due to the accelerating process of economic globalization, world economies are increasingly interconnected and influenced by many external factors. The increasing awareness of such factors as environmental crises has strengthened people’s understanding of economic vulnerability, thus stimulating new paths for urban development [3]. After perturbation by an external factor, some regions can quickly regain new stability and re-establish economic growth. Conversely, the economy can also respond sluggishly and be unable to recover in other areas [4]. In order to explore the driving factors behind the heterogeneous responses across regions, the concept of urban economic resilience (UER) was introduced [5]. This concept helps to explain the regional differences in resilience after economic shocks. Urban policy-makers have shown strong interest in applying UER to promote sustainable economic development, with resilience highlighted as critical to Britain’s budget in 2014 [6]. Thus, urban economic resilience has become a research hotspot in urban economics, regional economics, development economics, economic geography, and other disciplines [7].
Internationally, research on urban economic resilience can be divided into two stages [8]: Stage 1 (2002–2010), where studies on UER were based on the equilibrium theory, including two kinds of cognitive approaches: engineering resilience and ecological resilience; and Stage 2 (2010–present), where research is formulated based on evolutionary resilience. The equilibrium theory emphasizes the ability of a region to recover from an economic crisis. It suggests that urban economic resilience is drawn from the stability of a region’s structure and organization when facing a crisis [9]. The engineering resilience approach emphasizes the stability of the urban economy, focusing on the resilience of the socio-economic system after the impact. In this model, a region only has one equilibrium state [10]. Conversely, the ecological resilience approach claims that each region is a complex organization with multiple equilibrium states rather than a single equilibrium state [11]. This approach focuses on long-term economic development after a perturbation [12]. However, both approaches are of limited use in measuring UER, as they only consider the unemployment rate and the degree of GDP change before and after an economic crisis [13,14,15].
Recently, the approach to assess urban economic resilience has shifted from the equilibrium theory to the evolution theory [16], although the implications of this theory are yet to be fully understood. With this theoretical shift, the research focus is changing from understanding a region’s ability to resist external threats to a focus on adapting to the complex external environments where those threats exist [17]. Thus, in the field of evolutionary economic geography, UER is defined as a continuous and constantly changing process. It is an intrinsic property of the region and evolves dynamically in response to changes in the external environment. The region acquires new knowledge from the outside world and continuously evolves and adapts to changes. This adaptive system characterizes the nature of urban economic sustainable development [18,19]. There are two main methods to evaluate UER under the evolution theory regime: the index system method [20] and the core variable method [21], but both methods have certain limitations.
First, the formation of the causal relationship between urban economic resilience and the urban economic system is unclear. The index selection method may not be representative of all urban economies, limiting the external validity of the results. Similarly, the core variable method only adopts the core variables of GDP and unemployment rate, which may not fully reflect the complex interactions in UER. Further research is also required to explore both methods in order to assess the trends in UER observations before and after a perturbation. Regional economic resilience can enhance the key attributes of the economic system in a long-term and sustainable way [22]. Furthermore, understanding resilience would require a new way of thinking about sustainability. By definition, resilience depends on being able to adapt to unprecedented and unexpected changes [23]. After an economic perturbation or crisis, sustainable development and economic resilience can reduce social welfare losses and reduce the negative effects of economic stimulus policies. Together, these can help to enhance urban economic resilience, if carefully managed.
There is little research on the economic resilience of cities in China [8,22]. China’s economic growth is in the process of structural transformation. Factors such as labor supply, resource and environmental costs, advancements in technology, and external market demands are changing rapidly. Due in part to these changes, some industries are facing the challenge of exceeding their full capacity, which may impact on UER. In light of this, this paper aims at addressing three research questions: (1) How can we measure UER holistically in the context of Chinese cities? (2) Is the spatial distribution of UER heterogeneous or does it vary across all cities in China? (3) Does each city in an urban agglomeration have equal access to social opportunities? To address these questions, we first constructed a comprehensive evaluation framework based on evolutionary theory to measure urban economic resilience from six dimensions: economic development, opening up, environmental protection, social development, natural conditions, and technological innovation. We used a subjective and objective weighting method to weight each of these factors and applied this framework to evaluate the UER of 286 cities in China from 2004 to 2016. The Technique for Order of Preference by Similarity to Ideal Solution (TOPSIS) was used to rank the UER across the 286 cities. The Kernel Density Estimation (KED) method was used to explain the evolution of economic resilience in the 286 cities from 2004 to 2016. Furthermore, the equality of opportunities for economic resilience in China’s 19 agglomerations was assessed using the social opportunity and opportunity equality indexes to reveal the spatiotemporal variation in China’s economic resilience across cities and urban agglomerations.
The rest of the paper is organized as follows. The next section introduces the materials and methods we use. Then, the third section presents results that illustrate the spatiotemporal evolution of the UER across 286 cities and 19 urban agglomerations, followed by discussion and conclusion in the last section.
2. Materials and Methods
2.1. Construction of the Indicator System
According to evolutionary economic geography, UER can be considered as an intrinsic feature of a region [22]. It is a historical path dependence that is continuously self-reinforcing due to urban historical heritage and external environmental influences [24]. This historical path depends on the industrial structure, the organization of production, social politics, the ecological culture, and the climate of innovation formed by long-term evolution [25]. From the evolutionary perspective, if a region can identify adaptive locks to its destructive changes, this region can enhance its adaptability and improve the region’s economic resilience [26]. For example, Martin and Sunley (2007) [18] identified effectively several “unlocking” mechanisms that can improve urban resilience, including (1) innovations generated by the use of heterogeneous economic entities; (2) introduction and integration of external resources; (3) diversified industrial development; and (4) economic structural transformation and upgrading. The improvement of UER is a continuous process, in part through these mechanisms. Briguglio et al. (2006) quantified the economic resilience of 86 countries through a series of indicators, such as macroeconomic stability, micro-market efficiency, good economic governance, and social development [27]. On a different scale, Guillaumont (2009) constructed the national scale, spatial location, specialization, natural shock, and trade impact as indicators of the economic vulnerability of a region [28]. In general, the less economic vulnerability a region has, the stronger the region’s economic resilience is.
We constructed an indicator system consisting of 25 indicators to assess UER across all China from 2004 to 2016, except for 12 prefecture-level cities. These indicators were selected according to three broad criteria––data availability, comparability with indicators drawn from the literature, and regional variation––to measure UER from six dimensions: economic growth, opening up, social development, environmental protection, natural conditions, and technological innovation. Data used to operationalize the indicator system were sourced from either the China Urban Statistical Yearbook (2005–2017) or the statistical yearbook for the province in which the city is located. The 12 cities excluded from this analysis include Sansha and Zhanzhou in Hainan Province; Bijie and Tongren in Guizhou Province; Rikeze, Changdu, Linzhi, Shannan, and Naqu in Tibet Autonomous Region; Haidong in Qinghai Province; and Hami and Tulufan in Xinjiang Uygur Autonomous Region, where no data is available for the duration of our study period.
(1) Economic growth is characterized by macroeconomic stability and micro-market efficiency [27]. Fiscal expenditures can reflect the government’s policies on investment, construction, and development of urban infrastructure and welfare. Strong financial growth helps policy-makers to formulate flexible economic policies and more effectively resist the negative impact of a crisis or perturbation on the economy. The proportions of industry and the number of employees in tertiary industry can be used to estimate industrial diversification. A more diversified industrial structure can act as a “shock absorber” to eliminate the negative impact of economic shifts in the region. In turn, this can help to improve the overall adaptability of the urban economy [29]. Furthermore, urban land under construction can act as a proxy for the speed of urban construction and development; and indicators such as employment, per capita GDP, and fixed asset investment can be used to measure the stability of economic development in a region and, thus, UER.
(2) To measure the extent of opening up, we chose the number of foreign investment projects in the region [30]. The international economic crisis is one of the factors contributing to the economic recession of the city. The opening up of the larger economic market and the technical level of export goods and services can in part reflect the economic fragility within the international community and may limit external economic crises to the internal region.
(3) In terms of social development, the number of Internet-connected devices, such as mobile phones, can indicate the saturation of social development and the efficiency of social progress. Additionally, as society grows more socially advanced, the quality of education will also increase. Education expenditure and the number of colleges and universities can be used as indicators of the quality of education. In particular, highly skilled people trained with higher education can be transformed into valuable human resources and become an endogenous driving force of urban development.
(4) For environmental protection, green development is a pathway for economic growth and social development that focuses on efficiency and sustainability [30]. Green indicators are associated with sustainable economic development. To a certain extent, the green industry can promote the adjustment of economic structure, breaking through constraints, managing the risks brought about from the environment, and promoting the sustainable development of the economy.
(5) Indicators measuring natural conditions include both the population and the size of the administrative area, as they can measure the city’s natural resistance and potentially reduce the vulnerability of a city’s economy [28]. A flexible multi-skilled workforce can be used as a shock mitigation tool for the crisis. By transferring resources within a city, it is relatively easy to meet the shocks of negative external demand. Cities with larger administrative areas and larger populations have greater resistance to non-human crisis factors, such as natural disasters, thus reducing the interference of natural factors on urban economic development.
(6) For technological innovation, a measure of new technologies must be selected. However, the economic development in China has started to slow down. The rapid development of resource consumption is not sustainable due to this slowed development [31,32]. To measure this, we selected the total number of academic publications, innovative talents, the number of patents, and technology funds to measure the overall strength of technological innovation in each region. Strong scientific and technological innovation can assist in reducing excessive dependence on material production for economic development. Continuous innovation can enhance value chains and products to improve quality and efficiency, thus improving the region’s ability to cope with and adapt to risks and challenges.
Table 1 lists all indicators and how they are operationalized using data from various sources. The weighting of each indicator was obtained by a subjective and objective comprehensive weighting method, which is introduced in the next section.
2.2. Analytical Methods
We used the subjective and objective weighting method to assign weight to each of the indicators we constructed to assess UER. Other methods, including the TOPSIS model, Kernel Density Estimation, and Social Opportunity Function, were used to rank the 286 cities’ UER and explore the spatiotemporal variation and inequality in China’s economic resilience across cities and urban agglomerations.
2.2.1. Subjective and Objective Weighting Method
In order to create a representative index, the subjective weighting method and the objective weighting method were used to jointly determine the weight of the indicators that satisfy the subjective and objective conditions [33].
2.2.2. The TOPSIS Model
We used TOPSIS as a multi-criteria decision analysis model to evaluate China’s urban economic resilience using economic resilience indicators in 286 cities from 2004 to 2016. By measuring the closeness of the sample to be evaluated and an “optimal plan”, the ranking of the evaluation samples is achieved [34,35,36]. A four-step approach was used to create the TOPSIS model.
Step 1: Construct a standardized matrix: X = {xij}m×n, to standardize all indicators:
where xij is the normalized value of the jth indicator of the ith city.
Step 2: Determine the “optimal plan” X+ and “worst plan” X−:
where xi+ is the optimal value of the indicator and xi− is the worst value of the indicator.
Step 3: Calculate the sum distance between the individual samples and :
where Di is the weight coefficient between the indicator data.
Step 4: Calculate the relative closeness of each sample to the “ideal” sample:
where, Ci is the closeness of the ith sample and the “optimal plan”; 0 ≤ Ci ≤ 1.
2.2.3. Kernel Density Estimation
We used kernel density estimation to reveal the spatial and temporal trends in UER across 286 cities in China from 2004 to 2016. Kernel density estimation is a density function used to estimate unknown values based on the probability theory using a nonparametric test method [37,38,39,40]. This function was used in this study to produce a smooth surface of UER across the country based on values of the 286 cities. For a set of data x1, x2, …, xn, the kernel density estimate takes the form of:
where, h is the window width, and the kernel function k is a weighting function. There are many methods for estimating nuclear density, including Gaussian kernel, Epanechnikov kernel, triangular kernel, and quadratic kernel. The selection of the kernel size is based on the intensity of grouped data. This study uses a Gaussian kernel function:
Silverman (1986) noted in the case of large samples that different kernel functions do not strongly impact on the estimator, but the selection of window width h can bias the estimator. The choice of window width determines the accuracy of kernel density estimation and the smoothness of the kernel density map [41]. The window width in this research is set to h = 0.9SN−0.8, according to Silverman (1986), where N is the number of cities and S is the standard deviation of the values across all cities.
2.2.4. Social Opportunity Function
Drawing on the inclusive research of Ifzal Ali (2007) and Hyun Hwa Son (2010), we used the social opportunity function [42,43] to address our third research question on whether cities in urban agglomeration have equal access to social opportunities to gain economic resilience. We used the economic resilience of 286 cities in China to measure the equality of opportunity for economic resilience across 19 urban agglomerations in China [44].
3. Results
3.1. Spatiotemporal Evolution of UER across 286 Cities in China
3.1.1. Temporal Variations
The temporal change in UER across all 286 cities in China was measured from 2004 to 2016 using our comprehensive index system. The results were grouped into three categories based on their geographical regions—east, middle, and west—with the average UER in each region calculated and presented in Table 2. The results show that the average score of UER increased from 0.0562 in 2004 to 0.740 in 2016. The economic resilience of various regions increased each year; for example, in the eastern region, the score of UER increased from 0.0888 in 2004 to 0.1101 in 2006. Thus, there is a clear spatial variation in UER across different regions in China. The UER in the eastern region is much higher than that in the central or the western regions. We can infer that the gap between the economic resilience of the central and western regions has widened over time. During the study period, the economic resilience of the eastern region increased by 0.0213, and the central and western regions increased by 0.0175 and 0.0144, respectively. The UER in the eastern region increased faster than in the central and western regions. Similarly, the average UER in the eastern region is higher than the average of all cities, while the average of UER in the central and western regions is lower than the nationwide average. The developed economic foundation, strong material conditions, high level of opening up, and a good environment for scientific and technological progress in the eastern region have contributed to further improvement of UER in that region, and sustainable economic development. On the other hand, regions in the central and western part of the country lack the capacity for their large state-owned enterprises to transform and open up to the new markets, and their economic resilience is poor and not conducive to sustainable economic development. Although programmes such as the ‘development of the western region’ and the ‘rise of the central region’ have been launched and have improved the economic resilience of the central and western regions, there is still a large gap between these and the eastern region.
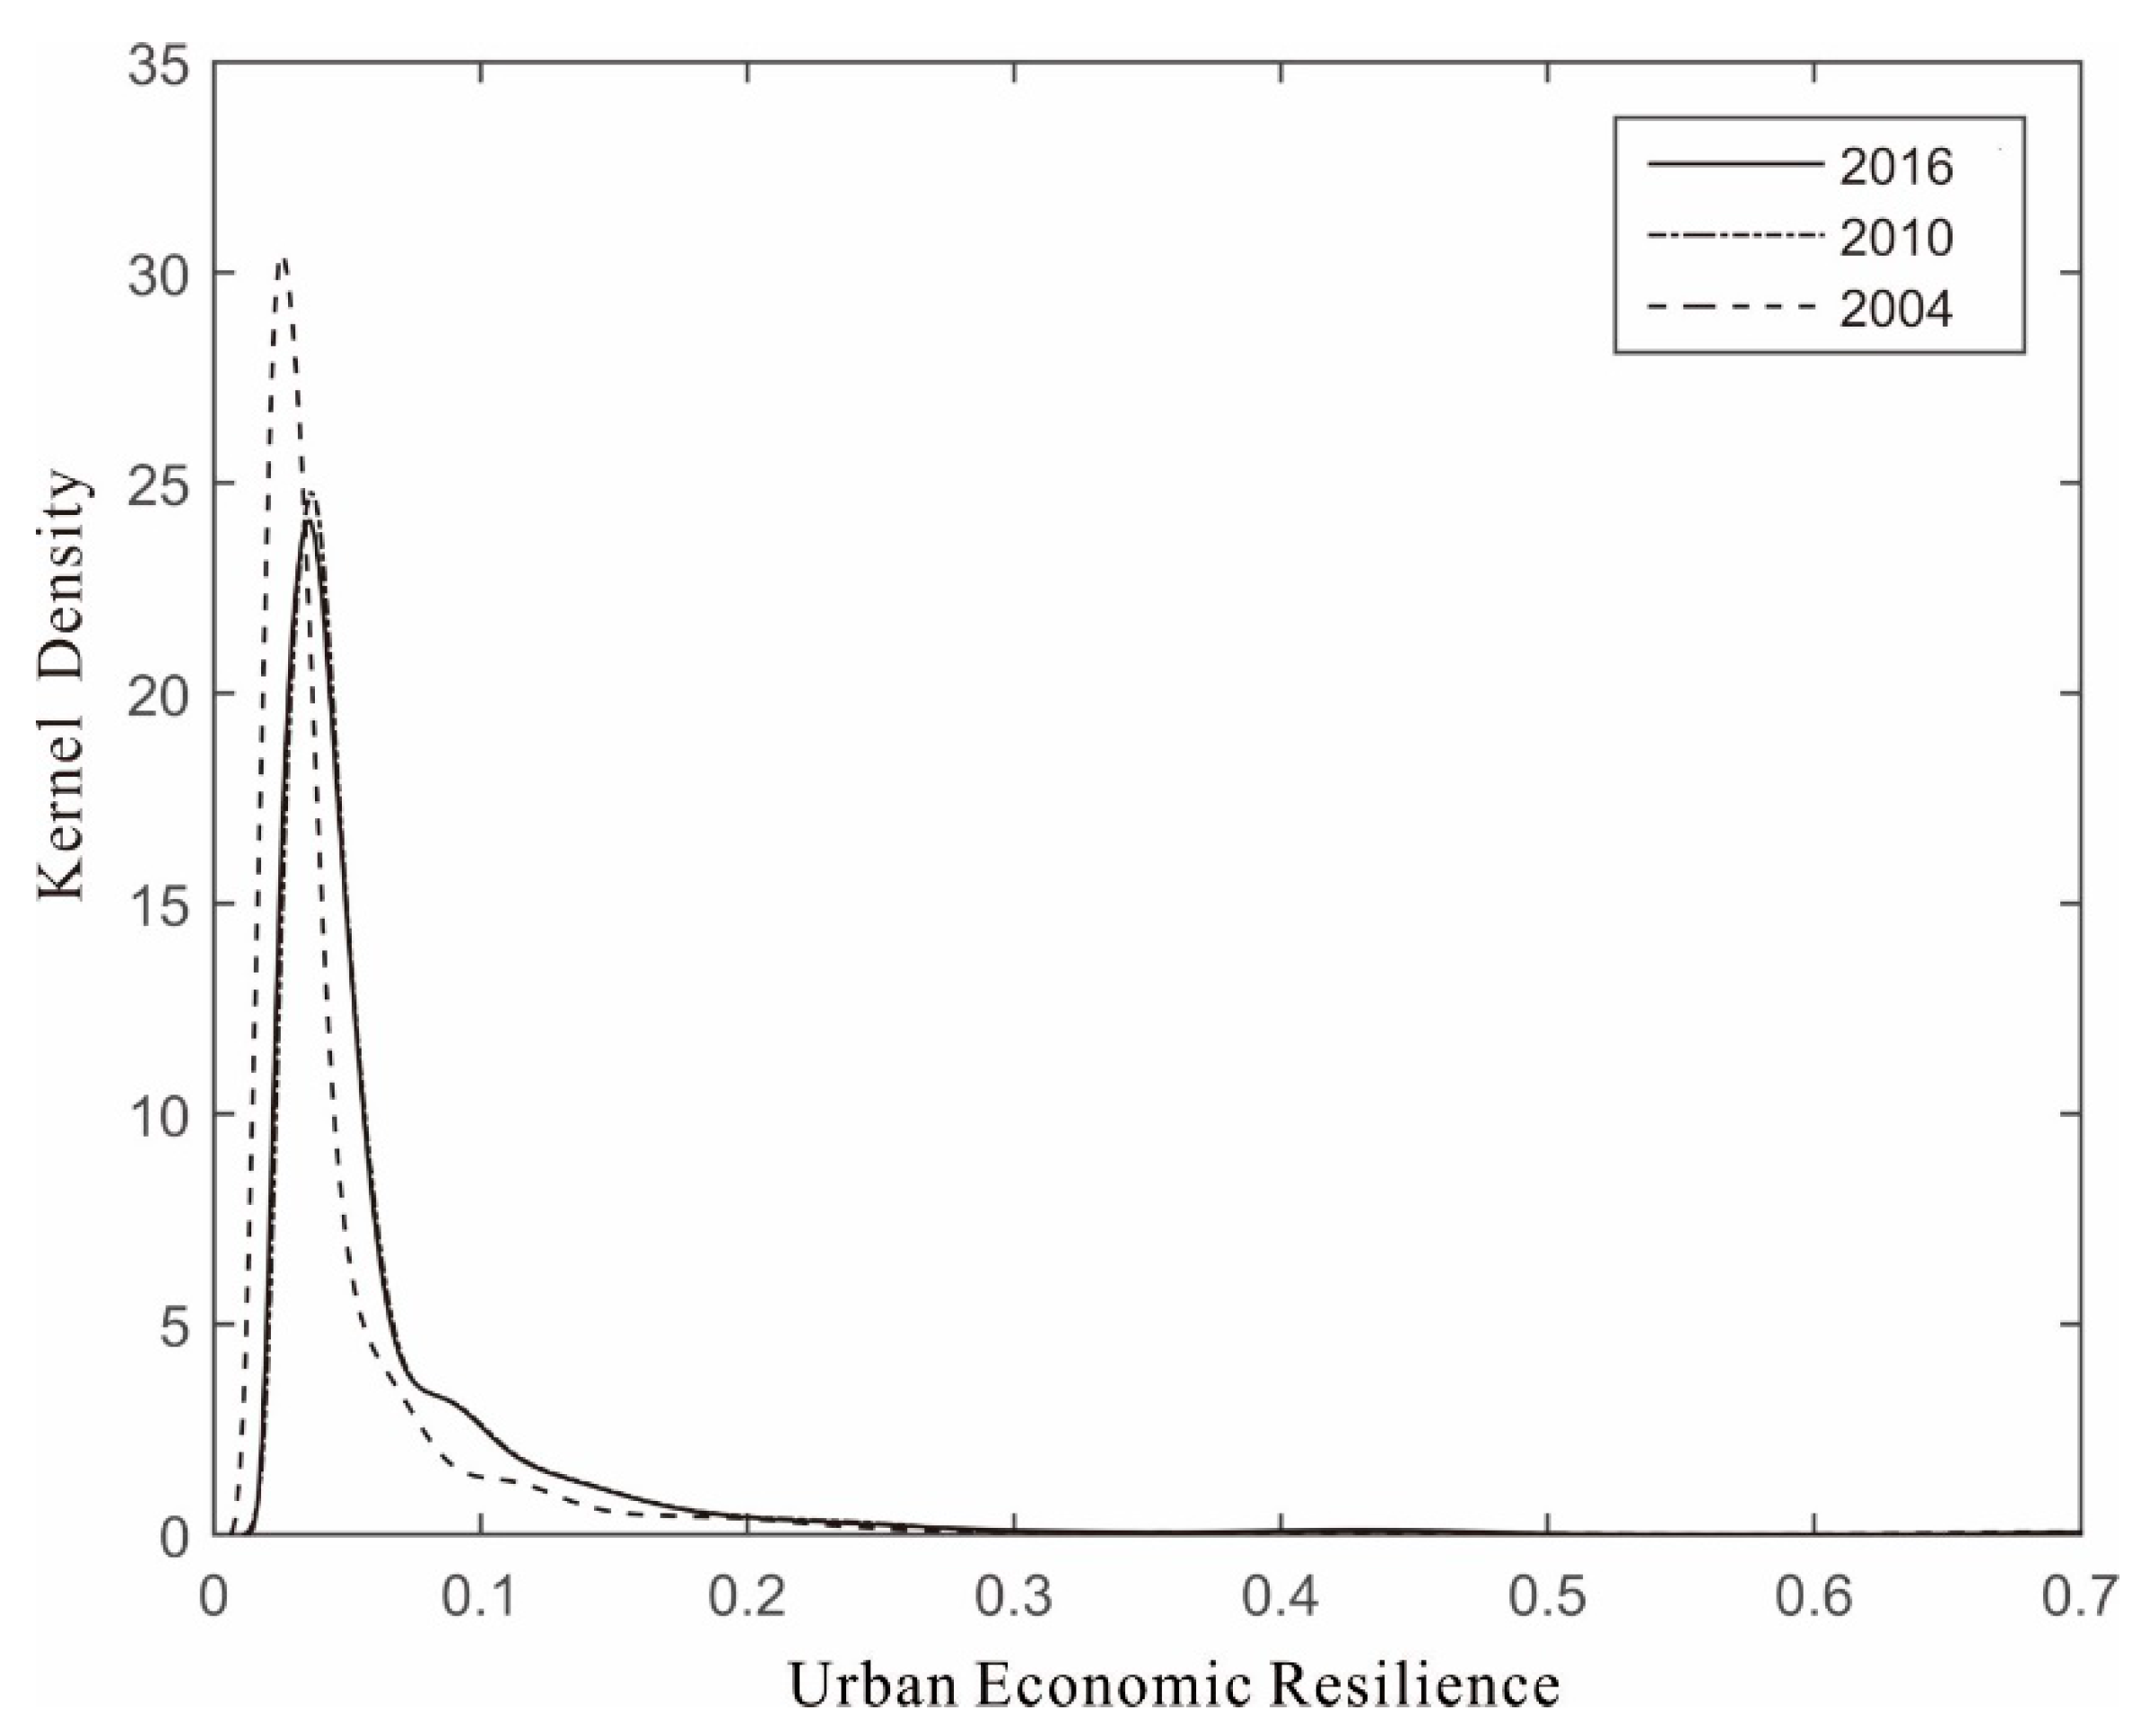
Results from the kernel density estimate are plotted against UER in 2004, 2010, and 2016 (Figure 2). This figure illustrates a one-peak distribution of UER in Chinese cities over all three time points, indicating that the difference in economic resilience across cities is large, with no substantial changes over time, and the economic resilience in most cities has a UER value between 0 and 0.1. Only a small number of cities have an economic resilience above 0.1. In contrast, the peak value of the kernel density in 2004 reached over 30. The proportion of cities with low economic resilience is far greater than those with high economic resilience, resulting in low overall economic resilience of Chinese cities. This peak UER value decreased rapidly to less than 25 in 2010, and, by 2016, the peak value was further reduced but at a much slower pace, with the number of lower UER cities reduced as well, indicating that the UER in Chinese cities grew faster in the 2004–2010 period than in the 2010–2016 period. On the other hand, the peak points of the three kernel density curves moved gradually toward the right side of the x-axis, indicating an increasing tendency toward economic resilience in Chinese cities.
Furthermore, the near identical shape of the UER distributions in 2010 and 2016 and their deviation from the 2004 chart with a higher tail after the value 0.1 indicate that cities with low economic resilience were gaining resilience at a faster speed, slowly reducing the gap in cities with high and low economic resilience in recent years (Figure 2).
3.1.2. Spatial Variations
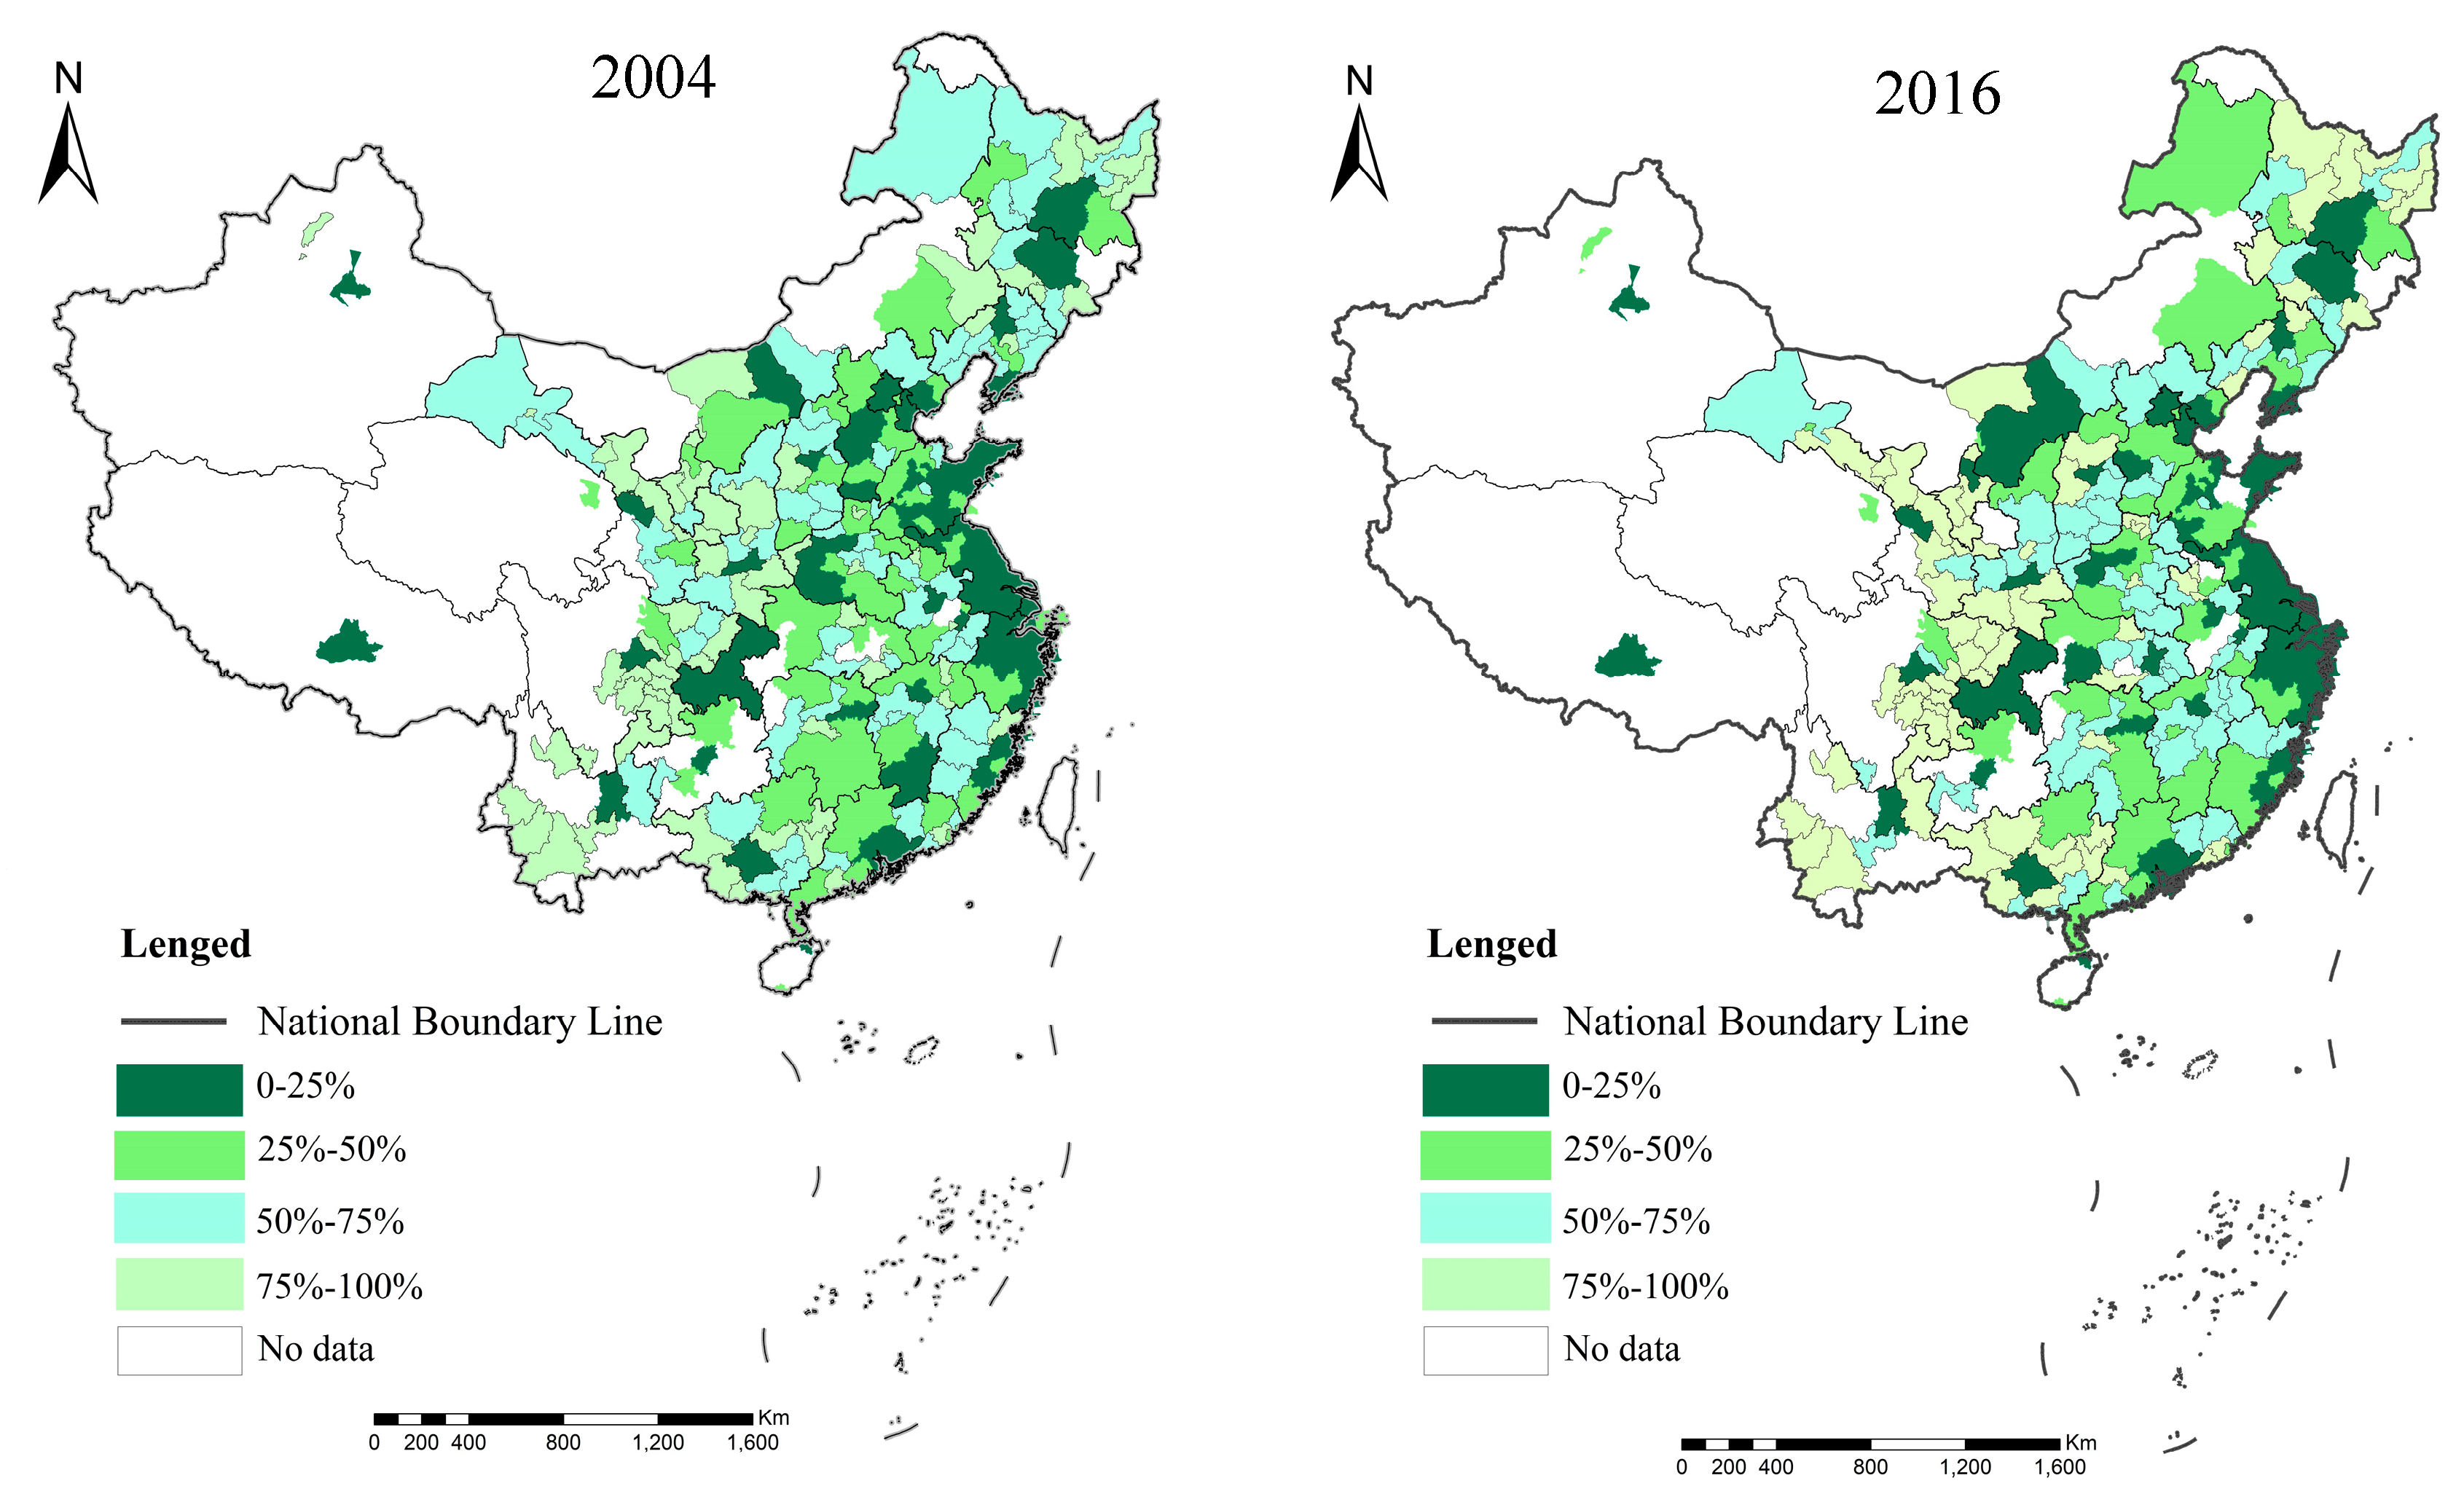
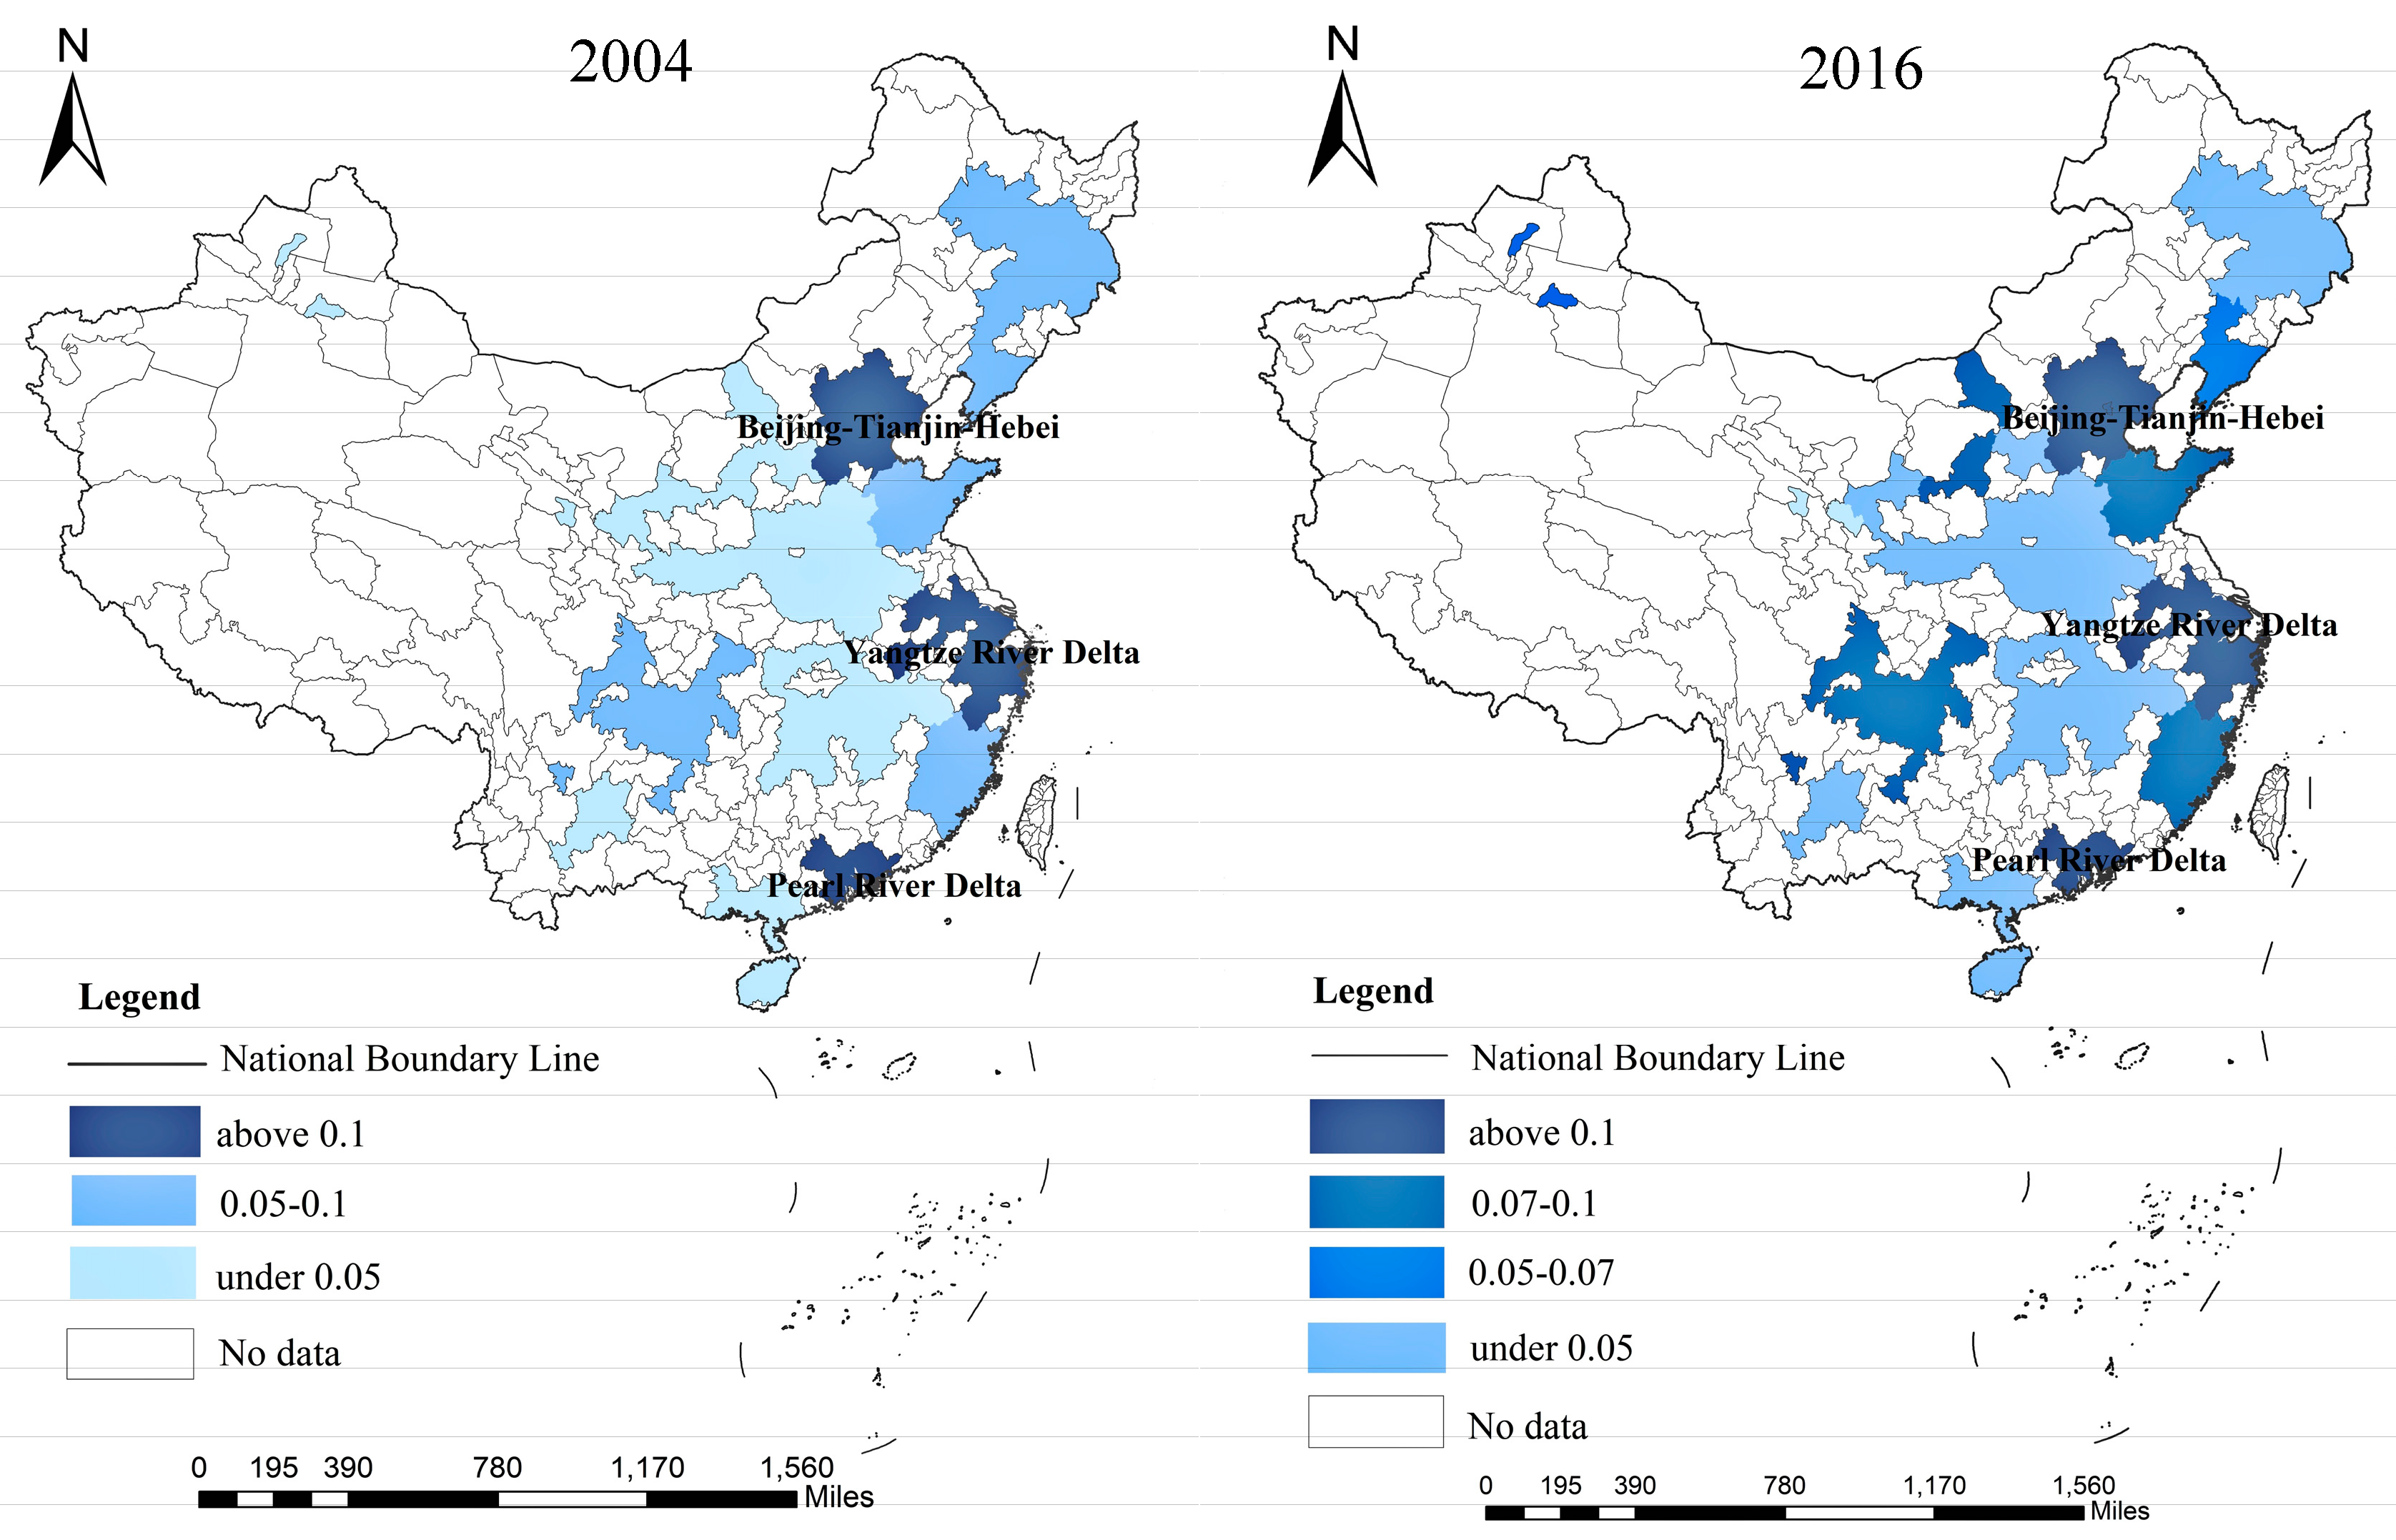
According to the quartile measurement of economic resilience of 286 cities in China (Appendix A Table A1), the spatial distribution map of China’s UER in 2004 and 2016 is drawn (Figure 3).
Figure 3 shows that the UER scores of the 286 cities are not evenly distributed, with cities in the top 25% of economic resilience located on the eastern and northern coast of China. In 2016, Beijing, Shanghai, and Shenzhen ranked in the top three with 0.76, 0.69, and 0.44, respectively. Next, Suzhou, Chongqing, Tianjin, Guangzhou, Chengdu, Hangzhou, and Nanjing ranked 4th to 10th. Compared with 2004, the first two rankings did not change. Shenzhen made the fastest progress, rising by three places, moving from the sixth to the third, and Hangzhou rose from tenth to ninth. The top 10 cities in China’s urban economic resilience are located in eastern China, except Chengdu and Chongqing.
In 2016, the top 25% of cities in China’s UER are generally municipalities or provincial capitals. Other cities are generally located in the eastern coastal areas of China. These mainly include the core cities of Beijing-Tianjin-Hebei, the Yangtze River Delta, the Pearl River Delta, Chengdu-Chongqing, Central Henan, and the middle reaches of the Yangtze River. Among these cities, their economic resilience is much higher than cities around them. Compared with 2004, the top 25% of the economic resilience in 2016 is more spatially dispersed in eastern China. Looking to the central and western regions, the uneven distribution of economic resilience in various regions has improved to some extent from 2004 to 2016. In 2016, China’s UER ranking included cities within the top 25–75% of selected cities, scattered throughout all provinces in China. Although compared with 2004 the scores have improved slightly, the pattern of the proportion of cities with lower UER scores has not changed. In 2016, compared with the 25% of cities in China’s UER in 2004, these low-scoring cities were mainly located in western China. It shows that the western region’s sustainable development capability is poor and its economic resilience is weak.
3.2. Economic Resilience and Opportunity Index across Urban Agglomerations
3.2.1. Spatial Distribution of Economic Resilience of Urban Agglomerations
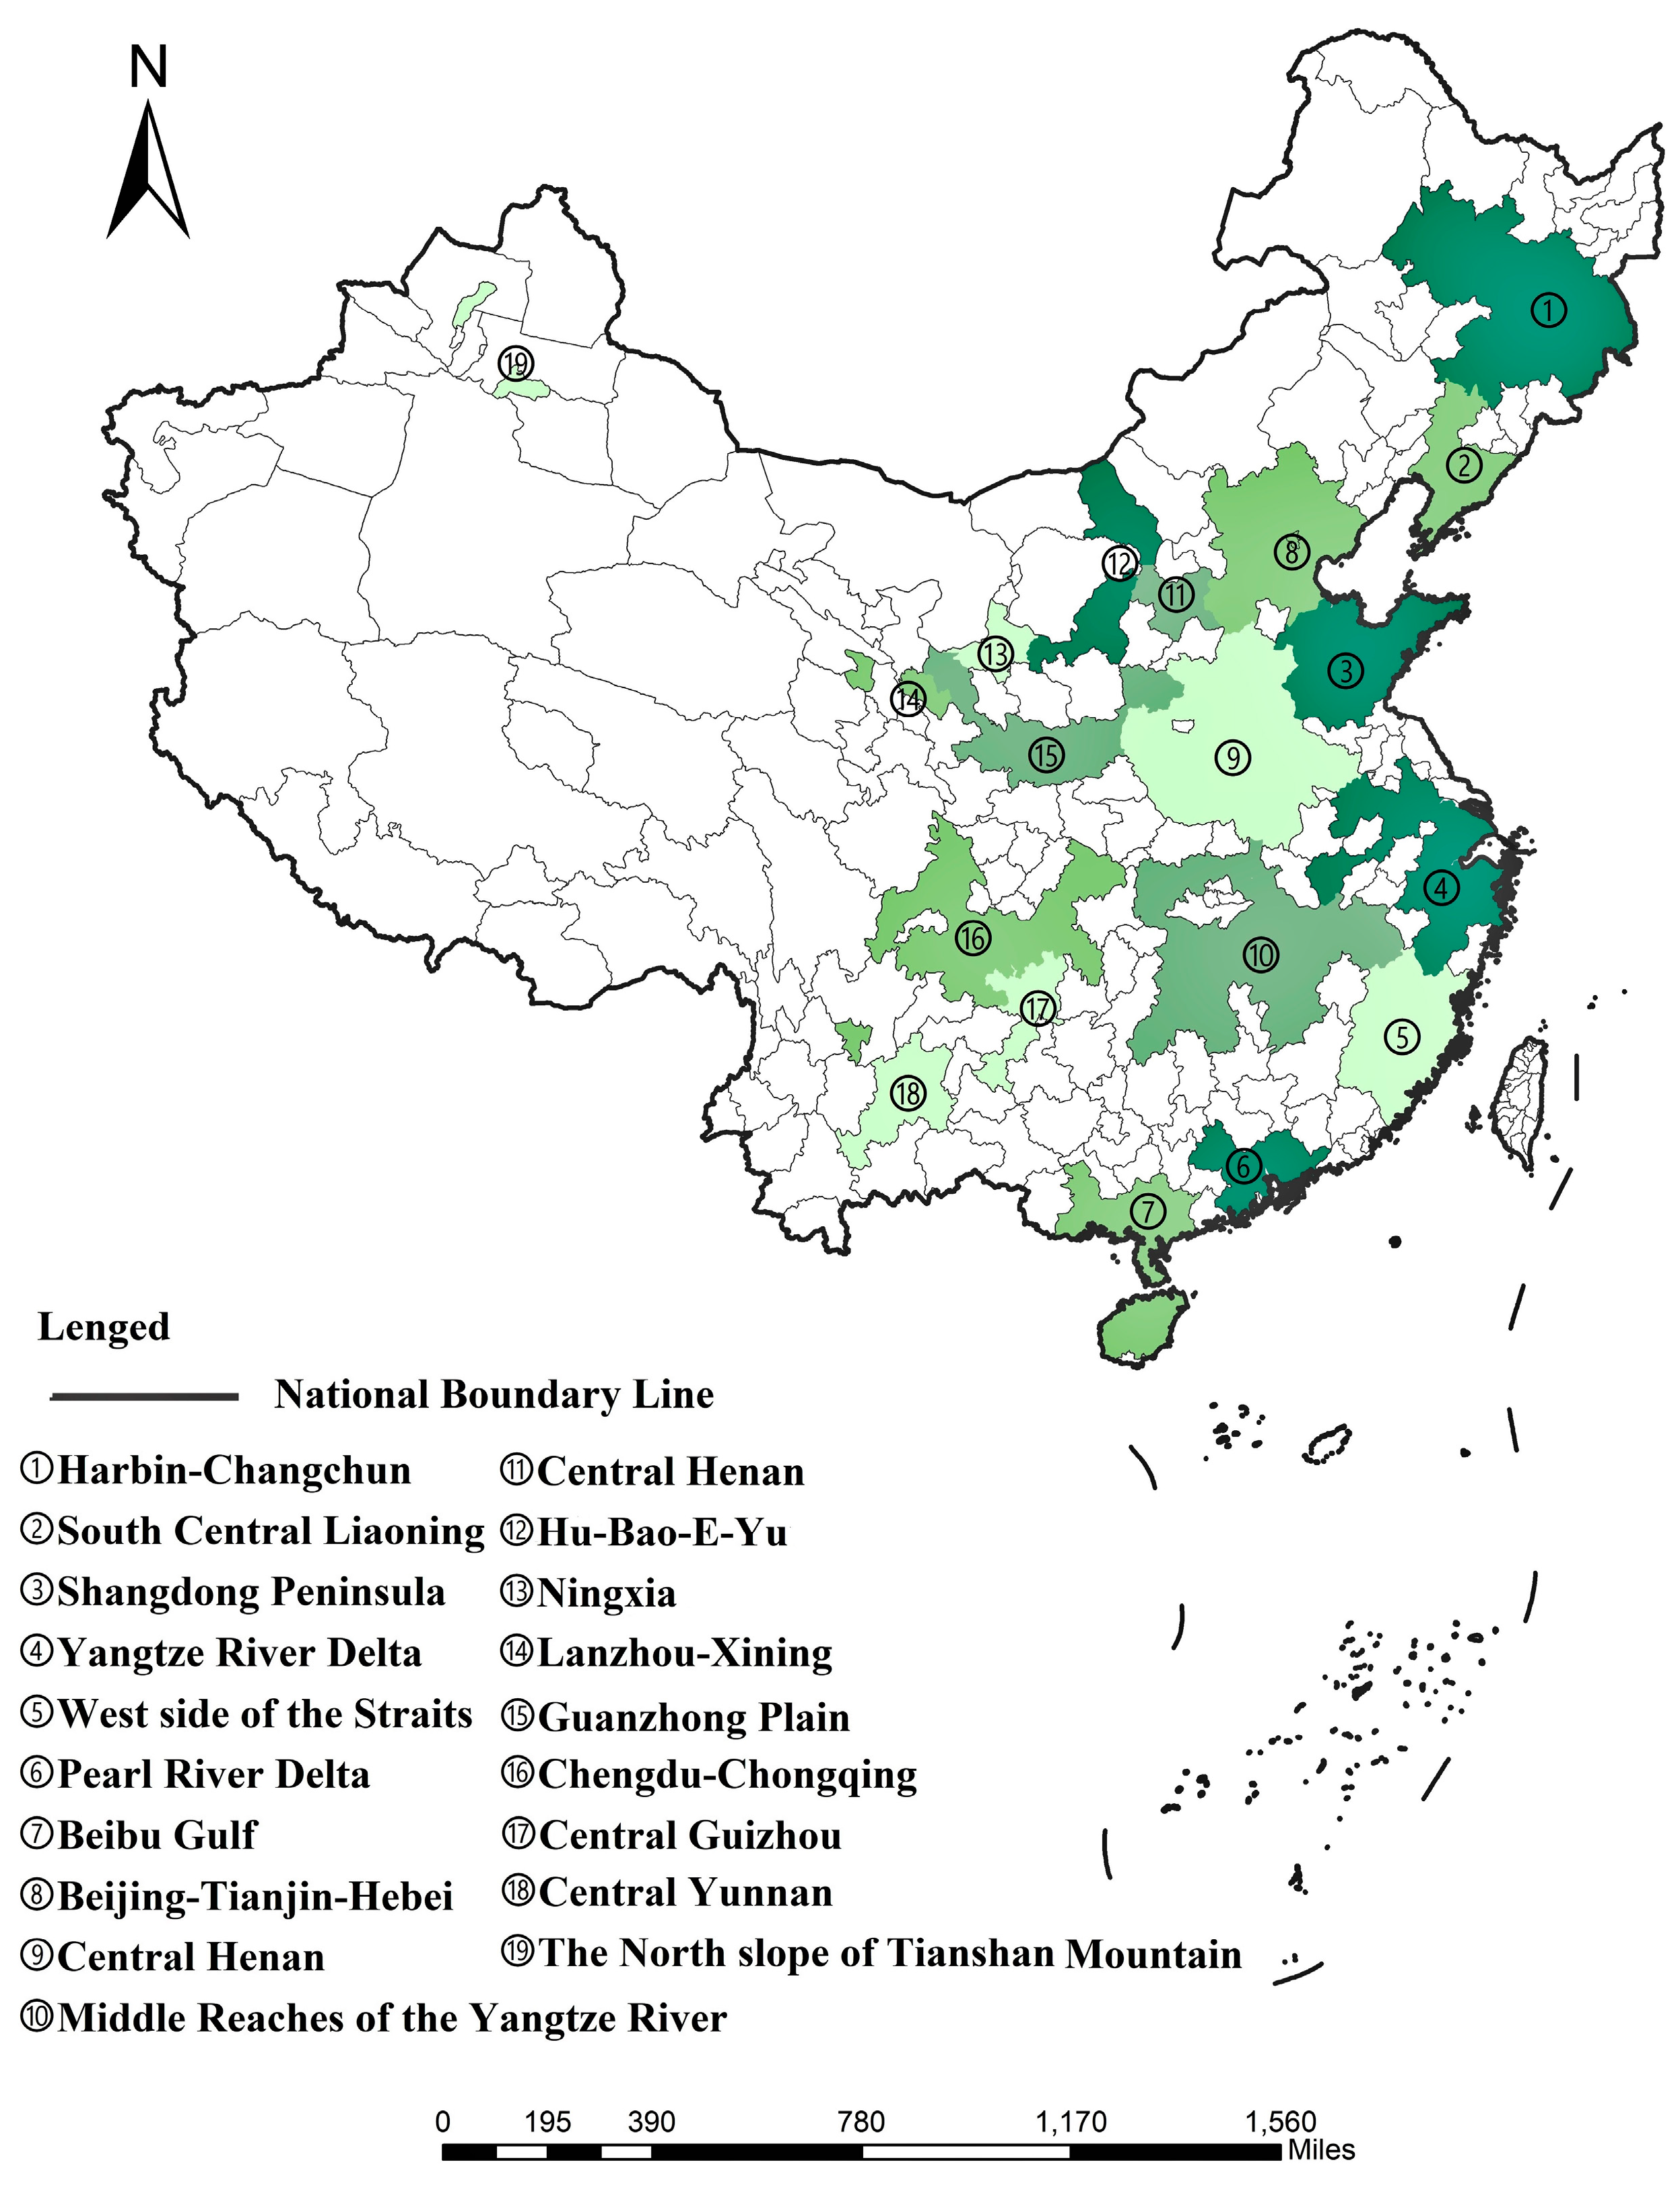
The Chinese government has proposed that 19 urban agglomerations (Figure 4) will be built during the 13th Five-Year Plan period (2016–2020), namely: Beijing-Tianjin-Hebei, Central Shanxi, Hu-Bao-E-Yu, South Central Liaoning, Harbin-Changchun, Yangtze River Delta, West side of the Straits, Central Henan, Shandong Peninsula, Middle reaches of the Yangtze River, Pearl River Delta, Beibu Gulf, Chengdu-Chongqing, Central Guizhou, Central Yunnan, Guanzhong Plain, Lanzhou-Xining, Ningxia, and the North slope of Tianshan Mountain. Including the Beijing-Tianjin-Hebei, the Yangtze River Delta and the Pearl River Delta are together positioned as a world-class city group. The 19 urban agglomerations include almost all provincial capital cities in the provincial-level regions, forming a regional economic development pattern centered on provincial capitals, economically developed cities, and regional central cities.
Summarizing the UER within the urban agglomerations as important centers of economic resilience, most of the economic resilience of the urban agglomerations in 2004 is concentrated below 0.05. In 2016, the economic resilience of most urban agglomerations is between 0.05 and 0.1 (Figure 5), and the economic resilience of each urban agglomeration has mostly increased. The three most economically resilient urban agglomerations in 2004 were the Beijing-Tianjin-Hebei, Pearl River Delta, and Yangtze River Delta urban agglomerations. These urban agglomerations are also the three most economically developed regions in China. The three urban agglomerations with the lowest economic resilience are the Lanzhou-Xining, the Beibu Gulf, and the Ningxia urban agglomerations, all located in the western region of China. In 2016, there were no major fundamental changes in the economic resilience pattern of China’s urban agglomerations. Some of the observed changes were that the Pearl River Delta urban agglomeration had become China’s most economically resilient urban agglomeration, and the Beijing-Tianjin-Hebei urban agglomeration ranked second, with the Yangtze River Delta urban agglomeration still ranked third. Although the relative position of economic resilience of other urban agglomerations had changed, the basic pattern of economic resilience of China’s urban agglomerations did not change, and the trend from the eastern coastal areas to the western inland areas has been decreasing.
3.2.2. Opportunity Index and Opportunity Equity Index of China’s Urban Agglomeration
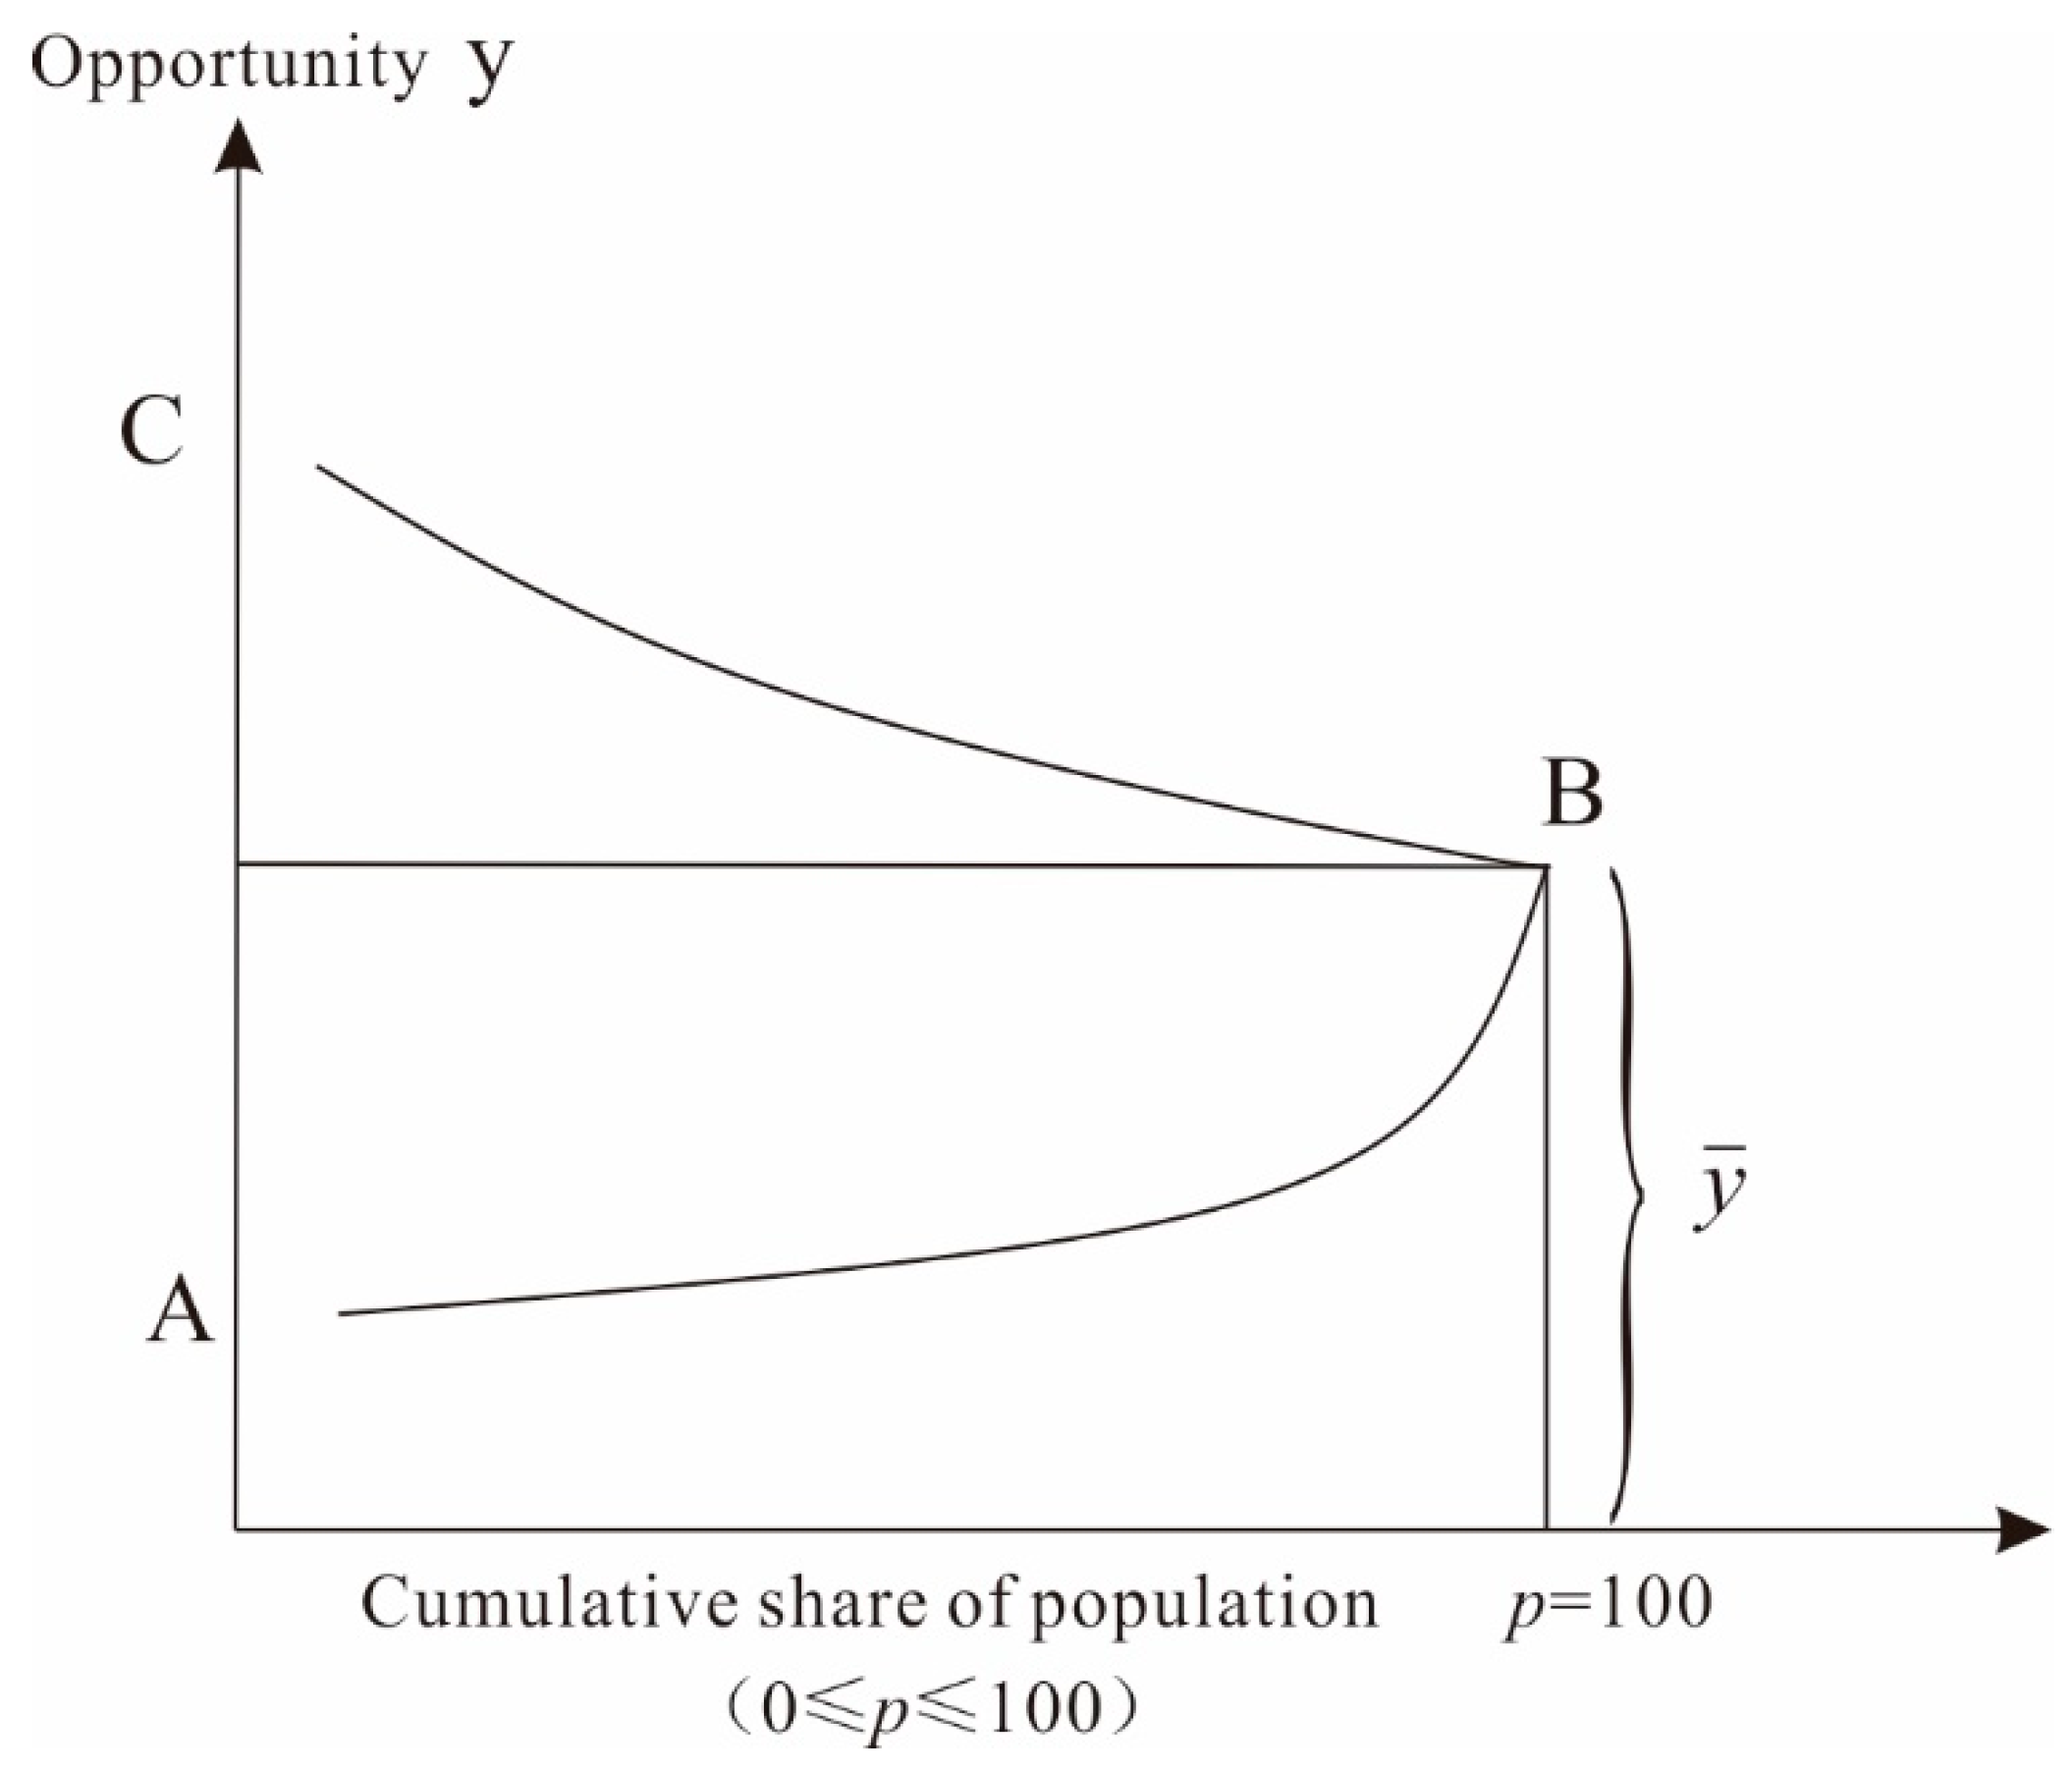
Based on the previous calculations of the economic resilience of 286 cities in China from 2004 to 2016, the opportunity index was calculated (Table 3). From the perspective of time, with the rapid economic development in 2004–2016, the economic resilience opportunity index of each urban agglomeration has been increasing. The economic resilience opportunity curve increases with time, as social opportunity expands, as illustrated in curve AB (Figure 1). It shows that the economic resilience opportunities of urban agglomerations are not fair during the study period, and cities with higher economic resilience within urban agglomerations are more likely to obtain development space than cities with lower economic resilience. Among them, the economic resilience index of the Yangtze River Delta and the Pearl River Delta urban agglomeration increased at the greatest rate, both 37.03%, followed by the Ningxia urban agglomeration and the Lanzhou-Xining urban agglomeration, which increased by 31.62% and 31.57%, respectively. In 2004–2008, the economic resilience opportunity index of each urban agglomeration increased, and the UER opportunity index of most urban agglomerations increased significantly. Due to the impact of the economic crisis in the second half of 2008, the growth rate of the economic resilience index of most urban agglomerations slowed down markedly. The Beijing-Tianjin-Hebei, the central Shanxi, and the North slope of Tianshan Mountain urban agglomerations showed a small decline. In 2012–2016, the UER opportunity index stabilized, the Chengdu-Chongqing urban agglomeration’s index increased by 0.0119, followed by the Yangtze River Delta urban agglomeration, which increased by 0.0094; the North slope of Tianshan Mountain urban agglomeration decreased by 0.0015, while the Lanzhou-Xining urban agglomeration declined at 0.0014, and the urban agglomeration in central and southern Liaoning fell by 0.0003.
From the perspective of space, the UER opportunity index of various urban agglomerations in China shows spatial non-equilibrium. According to the average of the 2004–2016 UER opportunity index, the 19 urban agglomerations were divided into three categories using Jenks’ natural breaks method. The first level is the Yangtze River Delta, Chengdu-Chongqing, Pearl River Delta, and Beijing-Tianjin-Hebei urban agglomeration. The economic resilience index of these four urban agglomerations (Yangtze River Delta, Chengdu-Chongqing, Pearl River Delta, Beijing-Tianjin-Hebei) is the highest. Except for the Chengdu-Chongqing urban agglomeration, the other three urban agglomerations are located on the eastern coast. The region is currently the largest urban agglomeration in China, with a total of 62 cities, and its average economic resilience index is above 0.1. These regions have developed economies, a relatively high degree of openness to the outside world, and close economic linkages between cities. These regions also have significant spillover effects, such as factor flows, technological innovation, and technology diffusion, which have led to a steady increase in the economic resilience of surrounding cities. The Chengdu-Chongqing urban agglomeration is positioned as the economic center of Southwest China, with Chongqing and Chengdu as the central cores, with a total of 17 cities. It is an urban agglomeration with a large regional role: it actively undertakes industrial transfer, and fosters and expands industrial clusters. In addition, the agglomeration has rapid economic development, strong urban service functions, and a wide hinterland. It has clear effects on the radiation belts in China’s inland areas, a high economic resilience index, and a strong sustainable development capability. The second level is the Hu-Bao-E-Yu, Harbin-Changchun, South Central Liaoning, West side of the Straits, Central Henan, Middle Reaches of Yangtze River, Guanzhong Plain, Shandong Peninsula, and Beibu Gulf urban agglomeration. The average economic resilience index of urban agglomerations at this level is 0.03–0.1, including 124 cities, accounting for 59.6% of the 19 urban agglomerations. In addition, improving the economic resilience of second-tier urban agglomerations is key to improving China’s overall economic resilience. Although the UER opportunity index of this type of urban agglomeration is at an intermediate level, it is different from the first-level area of the UER opportunity index. This second-tier UER still has great room for improvement, so the city’s sustainable development capacity needs to be promoted. The third level is the Central Shanxi, Central Guizhou, Central Guizhou, Lanzhou-Xining, Ningxia, and North Slope of the Tianshan Mountain urban agglomeration. The average economic resilience opportunity index of this group is relatively lower, all below 0.03, a total of 22 cities. Except for the urban agglomerations in Central Shanxi, others are mainly located in western China. The industrial structure of these cities is relatively simple, it is easy to be locked in by the city, and the ability for scientific and technological innovation and transfer is poor. Therefore, the city’s economic resilience is poor, and its ability to sustain economic development needs to be improved.
During the study period (2004–2016), the opportunity fairness index of economic resilience in different urban agglomerations varied greatly. Nonetheless, the nationwide average opportunity fairness index did not change greatly, from an average of 0.93 in 2004 to 0.92 in 2016, and the overall performance was unfair. At the end of the study, the economic resilience opportunity fairness index of the five urban agglomerations in the South-Central Liaoning, the Yangtze River Delta, the West side of the Straits, the Chengdu-Chongqing, and the North Slopes of the Tianshan Mountain was greater than 1. This indicated that the economic resilience of these urban agglomerations is small, and each city is in the development of urban agglomerations. A fairer opportunity is observed, and, thus, the overall opportunity for the economic resilience of these urban agglomerations is fair.
In particular, the economic resilience of the Yangtze River Delta urban agglomeration moved from non-fairness to fairness during the research period. The Yangtze River Delta urban agglomeration with Shanghai as the core is the most developed urban agglomeration in China, and is internationally recognized as such. In urban agglomerations, the internal UER is balanced, and each city can obtain relatively equal development opportunities. The economic resilience of the Beijing-Tianjin-Hebei and the Pearl River Delta urban agglomerations, which are the three major urban agglomerations in China, have not been fair during the research period. Although the opportunity index is high, it is not conducive to the sustainable economic development of urban agglomerations. Whether it is from the echelon structure of economic development or the economic relationship with the central city, the Yangtze River Delta urban agglomeration is superior to the Beijing-Tianjin-Hebei and the Pearl River Delta urban agglomeration, so it also has a more balanced economic resilience.
In addition, the economic resilience of the 12 urban agglomerations in Central Shanxi, Hu-Bao-E-Y, Harbin-Changchun, Shandong Peninsula, Central Henan, Middle Reaches of Yangtze River, Beibu Gulf, Central Guizhou, Central Yunnan, Guanzhong Plain, Lanzhou-Xining, and Ningxia is not fair. The opportunity fairness index of economic resilience needs to be improved in these areas. The economic resilience of most urban agglomerations in the country is variable across geographic areas, with higher values within the eastern coast. If this is not addressed, it will seriously restrict the improvement of the sustainable development ability of these urban agglomerations.
4. Discussion and Conclusions
Based on the evolutionary theory of UER, this paper considers that UER is a complex system composed of multiple dimensions, including urban economic growth, opening up, social development, environmental protection, natural conditions, and technological innovation. Our results show that cities in China have been developing to withstand external environmental impacts through its dynamic evolution process, thereby achieving sustainable development of the urban economy. Some key findings are presented and discussed below.
First, our results show a single peak distribution of the UER in Chinese cities from 2004 to 2016, with a low UER in a large number of cities and an overall low value in all cities. This single-peak pattern remains unchanged from 2004 to 2016, with a small variation in the peak value and a reduced difference between the peak and low values in later years. This result indicates clear spatial heterogeneity and non-equilibrium in economic resilience across cities in China. The spatial variation of the UER shows that the top 25% of cities with comprehensive economic resilience are located in the eastern coastal areas and the northern coastal areas of China, while the bottom 25% of the cities are mostly located in western China. China’s UER remains at a low level for much of the study period, which is not conducive to the high-quality growth and sustainable development of its economy. Therefore, in the future, it is necessary to implement a regionally coordinated development strategy and give full flexibility to utilize the comparative advantages of each city. It is anticipated that this will promote the development of each city towards the direction of high-quality and sustainable development.
Second, the economic resilience opportunity index of the 19 urban agglomerations increased over time, and the economic resilience opportunity curve largely follows that AB curve as illustrated in Sun (2018) (Figure 1). Cities with higher economic resilience within an urban agglomeration are more likely to obtain development space than those with lower economic resilience. In China, large spatial variation exists in the economic resilience opportunity index in cities across various urban agglomerations. The four urban agglomerations in China—the Yangtze River Delta, Chengdu-Chongqing region, the Pearl River Delta, and the Beijing-Tianjin-Hebei region—have the highest economic resilience opportunity index, followed by the nine urban agglomerations of Hu-Bao-E-Yu, Harbin-Changchun, South Central Liaoning, West side of the Straits, Central Henan, Middle Reaches of Yangtze River, Guanzhong Plain, Shandong Peninsula, and Beibu Gulf as the second-tier regions, in terms of their level of economic resilience. Six other urban agglomerations, including Central Shanxi, Central Guizhou, Central Guizhou, Lanzhou-Xining, Ningxia, and North of the Tianshan Mountain region, are ranked at the third-tier with lower economic resilience. In order to reduce the differences across the different tiers of cities and improve the overall economic resilience of Chinese cities, it is critical to optimize and further develop the urban agglomerations in the eastern region. Government policies should consider measures to (1) maintain a trend toward sustainable development in the eastern urban agglomerations, (2) foster and expand the urban agglomerations in the central and western regions, (3) break the regional blockade to support regional development and improve overall economic resilience.
Third, the economic resilience opportunity index of each urban agglomeration varied significantly over time (2004–2016). However, the average opportunity fairness index amongst all urban agglomerations decreased marginally from 0.93 in 2004 to 0.92 in 2016. There is substantial inequality amongst cities in almost all urban agglomerations. A marginal difference in economic resilience exists in some urban agglomerations, such as the South-Central Liaoning, Yangtze River Delta, the West side of Straits, Chengdu-Chongqing, and North of the Tianshan Mountain region; these regions show greater e quity in the equality of economic development opportunities across different cities within the urban agglomeration. On the other hand, substantial inequalities exist in other urban agglomerations, such as the two major ones in China: Beijing-Tianjin-Hebei and the Pearl River Delta urban agglomerations. Compared with the other major urban agglomeration—the Yangtze River Delta urban agglomeration—the opportunities for economic development of small cities within those two major urban agglomerations are less favorable, and it is not as easy to gain development space as it is for other larger cities in these urban agglomerations.
Accordingly, there are opportunities in China to build world-class urban agglomerations in the Beijing-Tianjin-Hebei region and the Pearl River Delta. This will continuously improve the competition of those urban agglomerations. We suggest that future policy in China should not only foster a new competitive advantage for existing cities and urban agglomerations, to improve the system and policy environment and reduce administrative intervention, but also to create greater equality across cities within the urban agglomerations. A friendly environment is better to enhance the ability of the economy to withstand risks and sustainable development. We should establish and improve the coordination mechanism for the development of urban agglomerations, and promote the coordinated division of industry, the division of labor, infrastructure, ecological protection, and environmental governance across cities, to achieve efficient and integrated development of urban agglomerations.
The study contributes to advancing the concept, assessment, and methodology of UER and how this can be applied to assess the spatial and temporal variation of Chinese cities and urban agglomerations. The methodology developed in this research can also be applied in other cities and regions to test its re-applicability and to understand the UER in different contexts. Further research would be required to explore and understand the formation mechanism of UER and potentially provide an early warning mechanism of economic shock in Chinese cities. This will be the main direction for future expansion of this research.
Author Contributions
H.Y., Y.L., C.L., and F.F. produced the paper, and all co-authors contributed to the data collection and analysis.
Funding
This work was supported by the National Science Foundation of China (NSFC) Funded Projects for Distinguished Young Scholars [Nos. 41501141 and 41501136]; the Major program of the Chinese National Social Science Foundation [No. 18ZDA040]; the China Scholarship Council (CSC) Project [No. 201706275035]; the Wuhan University Research Fund for Young Scholar Teams in Humanities & Social Sciences [No. WHU2016024]; the Wuhan University Humanities and Social Sciences Independent Research Project [No. 2018QN089]; the Shanghai Pujiang Program [No. 17PJC030] and the Fundamental Research Funds for Central University [No. CCNU18TS018].
Acknowledgments
The authors are grateful to the anonymous referees who provided valuable comments and suggestions to significantly improve the quality of the paper.
Conflicts of Interest
The authors declare no conflict of interest.
Appendix A

Table A1.
Urban economic resilience ranking in China from 2004 to 2016.
| City | 2004 | 2016 | City | 2004 | 2016 | City | 2004 | 2016 | ||||||
|---|---|---|---|---|---|---|---|---|---|---|---|---|---|---|
| Score | Rank | Score | Rank | Score | Rank | Score | Rank | Score | Rank | Score | Rank | |||
| Beijing | 0.7288 | 1 | 0.7630 | 1 | Ganzhou | 0.0508 | 70 | 0.0545 | 97 | Jingdezhen | 0.0235 | 234 | 0.0372 | 193 |
| Shanghai | 0.6683 | 2 | 0.6980 | 2 | Suqian | 0.0445 | 84 | 0.0545 | 98 | Fangchengang | 0.0158 | 276 | 0.0372 | 194 |
| Shenzhen | 0.3307 | 6 | 0.4421 | 3 | Jiujiang | 0.0441 | 85 | 0.0544 | 99 | Shaoyang | 0.0352 | 127 | 0.0369 | 195 |
| Suzhou | 0.4704 | 3 | 0.4343 | 4 | Longyan | 0.0320 | 152 | 0.0538 | 100 | Heyuan | 0.0319 | 154 | 0.0368 | 196 |
| Chongqing | 0.4120 | 4 | 0.4009 | 5 | Xinyu | 0.0253 | 207 | 0.0538 | 101 | Chuzhou | 0.0300 | 174 | 0.0368 | 197 |
| Tianjin | 0.3578 | 5 | 0.3916 | 6 | Xiangtan | 0.0360 | 120 | 0.0538 | 102 | Hengshui | 0.0313 | 162 | 0.0367 | 198 |
| Guangzhou | 0.2657 | 7 | 0.3234 | 7 | Lishui | 0.0368 | 111 | 0.0537 | 103 | Fuyang | 0.0346 | 132 | 0.0366 | 199 |
| Chengdu | 0.2013 | 12 | 0.2763 | 8 | Dezhou | 0.0397 | 97 | 0.0536 | 104 | Liaoyuan | 0.0189 | 266 | 0.0365 | 200 |
| Hangzhou | 0.2093 | 10 | 0.2543 | 9 | Rizhao | 0.0350 | 128 | 0.0529 | 105 | Yingtan | 0.0188 | 267 | 0.0364 | 201 |
| Nanjing | 0.2093 | 9 | 0.2490 | 10 | Changde | 0.0396 | 99 | 0.0528 | 106 | Yiyang | 0.0302 | 173 | 0.0364 | 202 |
| Nantong | 0.2255 | 8 | 0.2639 | 11 | Quzhou | 0.0345 | 133 | 0.0527 | 107 | Baoji | 0.0242 | 224 | 0.0363 | 203 |
| Wuhan | 0.1856 | 13 | 0.2234 | 12 | Liuan | 0.0313 | 161 | 0.0526 | 108 | Xianyang | 0.0255 | 204 | 0.0362 | 204 |
| Changzhou | 0.2175 | 11 | 0.2029 | 13 | Hengyang | 0.0445 | 83 | 0.0524 | 109 | Yulin | 0.0322 | 149 | 0.0361 | 205 |
| Qingdao | 0.1630 | 16 | 0.1972 | 14 | Xining | 0.0378 | 106 | 0.0520 | 110 | Wulanchabu | 0.0252 | 209 | 0.0360 | 206 |
| Yangzhou | 0.1705 | 14 | 0.1876 | 15 | Xinxiang | 0.0409 | 95 | 0.0518 | 111 | Chizhou | 0.0267 | 192 | 0.0360 | 207 |
| Xian | 0.1601 | 17 | 0.1842 | 16 | Yueyang | 0.0359 | 121 | 0.0516 | 112 | Deyang | 0.0229 | 238 | 0.0359 | 208 |
| Ningbo | 0.1458 | 18 | 0.1815 | 17 | Shaoguan | 0.0383 | 105 | 0.0512 | 113 | Beihai | 0.0205 | 254 | 0.0358 | 209 |
| Wuxi | 0.1233 | 22 | 0.1678 | 18 | Datong | 0.0431 | 88 | 0.0510 | 114 | Fuzhou | 0.0299 | 178 | 0.0358 | 210 |
| Yancheng | 0.1670 | 15 | 0.1658 | 19 | Maoming | 0.0410 | 94 | 0.0509 | 115 | Tianshui | 0.0341 | 139 | 0.0356 | 211 |
| Dongguan | 0.1273 | 19 | 0.1570 | 20 | Benxi | 0.0308 | 165 | 0.0508 | 116 | Chaozhou | 0.0258 | 201 | 0.0354 | 212 |
| Changzhou | 0.1137 | 26 | 0.1549 | 21 | Hulunbeier | 0.0315 | 159 | 0.0507 | 117 | Xianyang | 0.0245 | 220 | 0.0351 | 213 |
| Zhengzhou | 0.1244 | 21 | 0.1507 | 22 | Putian | 0.0338 | 142 | 0.0506 | 118 | Chaoyang | 0.0264 | 197 | 0.0350 | 214 |
| Zhenjiang | 0.1224 | 23 | 0.1489 | 23 | Zaozhuang | 0.0354 | 125 | 0.0503 | 119 | Puyang | 0.0257 | 202 | 0.0347 | 215 |
| Foshan | 0.1031 | 32 | 0.1482 | 24 | Yingkou | 0.0319 | 153 | 0.0499 | 120 | Huainan | 0.0268 | 191 | 0.0343 | 216 |
| Dalian | 0.1164 | 25 | 0.1428 | 25 | Zhenjiang | 0.0411 | 92 | 0.0498 | 121 | Hanzhong | 0.0274 | 188 | 0.0340 | 217 |
| Xiamen | 0.1059 | 31 | 0.1374 | 26 | Guilin | 0.0411 | 93 | 0.0497 | 122 | Jingzhou | 0.0296 | 180 | 0.0343 | 218 |
| Jinan | 0.1097 | 29 | 0.1374 | 27 | Zhaoqing | 0.0365 | 113 | 0.0490 | 123 | Baishan | 0.0185 | 268 | 0.0340 | 219 |
| Shenyang | 0.1122 | 28 | 0.1340 | 27 | Suzhou | 0.0345 | 134 | 0.0488 | 124 | Huludao | 0.0293 | 181 | 0.0337 | 220 |
| Hefei | 0.1079 | 30 | 0.1330 | 29 | Zhangjiajie | 0.0415 | 91 | 0.0487 | 125 | Bayanzhuoer | 0.0155 | 278 | 0.0338 | 221 |
| Huaian | 0.1264 | 20 | 0.1296 | 30 | Sanming | 0.0265 | 196 | 0.0486 | 126 | Yizhou | 0.0300 | 175 | 0.0337 | 222 |
| Harbin | 0.1130 | 27 | 0.1284 | 31 | Bengbu | 0.0359 | 122 | 0.0483 | 127 | Shizuishan | 0.0148 | 282 | 0.0333 | 223 |
| Zhouhai | 0.0732 | 46 | 0.1236 | 32 | Mudanjiang | 0.0361 | 118 | 0.0479 | 128 | Bozhou | 0.0310 | 163 | 0.0332 | 224 |
| Erduosi | 0.0433 | 87 | 0.1235 | 33 | Fushun | 0.0300 | 177 | 0.0479 | 129 | Longnan | 0.0303 | 170 | 0.0332 | 225 |
| Chuangchun | 0.0970 | 33 | 0.1208 | 34 | Liaocheng | 0.0365 | 114 | 0.0474 | 130 | Qinzhou | 0.0269 | 190 | 0.0329 | 226 |
| Lianyungang | 0.1171 | 24 | 0.1182 | 35 | Jiaozuo | 0.0306 | 167 | 0.0469 | 131 | Zhangye | 0.0253 | 208 | 0.0329 | 227 |
| Fuzhou | 0.0889 | 35 | 0.1155 | 36 | Shuozhou | 0.0263 | 198 | 0.0468 | 132 | Dingxi | 0.0330 | 145 | 0.0323 | 228 |
| Shaoxing | 0.0836 | 37 | 0.1149 | 37 | Binzhou | 0.0358 | 123 | 0.0465 | 133 | Loudi | 0.0240 | 229 | 0.0322 | 229 |
| Zhongshan | 0.0772 | 40 | 0.1110 | 38 | Anyang | 0.0368 | 110 | 0.0461 | 134 | Tieling | 0.0249 | 214 | 0.0321 | 230 |
| Kunming | 0.0909 | 34 | 0.1095 | 39 | Jiayuguan | 0.0114 | 285 | 0.0460 | 135 | Baishan | 0.0246 | 219 | 0.0320 | 231 |
| Yantai | 0.0729 | 45 | 0.1033 | 40 | Shiyan | 0.0355 | 124 | 0.0459 | 136 | Huaibei | 0.0219 | 244 | 0.0320 | 232 |
| Nanchang | 0.7710 | 41 | 0.1108 | 41 | Tongliao | 0.0242 | 225 | 0.0455 | 137 | Guyuan | 0.0308 | 166 | 0.0317 | 233 |
| Wenzhou | 0.0843 | 36 | 0.1006 | 42 | Kaifeng | 0.0332 | 144 | 0.0451 | 138 | Jieyang | 0.0233 | 236 | 0.0314 | 234 |
| Wulumuqi | 0.0720 | 47 | 0.1005 | 43 | Xuchang | 0.0308 | 164 | 0.0451 | 139 | Hechi | 0.0302 | 172 | 0.0313 | 235 |
| Taiyuan | 0.0797 | 39 | 0.1003 | 44 | Chifeng | 0.0340 | 140 | 0.0447 | 140 | Leshan | 0.0218 | 246 | 0.0312 | 236 |
| Xuzhou | 0.0817 | 38 | 0.0991 | 45 | Huangshan | 0.0303 | 171 | 0.0442 | 141 | Yibin | 0.0240 | 228 | 0.0308 | 237 |
| Baotou | 0.0505 | 71 | 0.0984 | 46 | Qingyuan | 0.0346 | 135 | 0.0441 | 142 | Lvliang | 0.0247 | 216 | 0.0307 | 238 |
| Huhehaote | 0.0606 | 60 | 0.0965 | 47 | Mianyang | 0.0385 | 102 | 0.0440 | 143 | Zigong | 0.0204 | 256 | 0.0306 | 239 |
| Quanzhou | 0.0783 | 44 | 0.0964 | 48 | Jiuquan | 0.0249 | 215 | 0.0439 | 144 | Nanchong | 0.0279 | 187 | 0.0305 | 240 |
| Jiaxing | 0.0694 | 49 | 0.0960 | 49 | Zhangjiakou | 0.0373 | 108 | 0.0439 | 145 | Qujing | 0.0285 | 183 | 0.0304 | 241 |
| Guiyang | 0.0763 | 42 | 0.0958 | 50 | Songyuan | 0.0265 | 195 | 0.0439 | 146 | Luzhou | 0.0245 | 221 | 0.0303 | 242 |
| Dongying | 0.0321 | 150 | 0.0920 | 51 | Zhumadian | 0.0384 | 103 | 0.0438 | 147 | Shanwei | 0.0248 | 215 | 0.0300 | 243 |
| Weihai | 0.0530 | 67 | 0.0919 | 52 | Qiqihaer | 0.0395 | 101 | 0.0436 | 148 | Fuxin | 0.0238 | 230 | 0.0295 | 244 |
| Taizhou | 0.0640 | 56 | 0.0913 | 53 | Changzhi | 0.0324 | 147 | 0.0433 | 149 | Jixi | 0.0236 | 231 | 0.0294 | 245 |
| Shijiazhuang | 0.0760 | 43 | 0.0912 | 54 | Yangquan | 0.0292 | 182 | 0.0433 | 150 | Qitaihe | 0.0243 | 223 | 0.0292 | 246 |
| Taizhou | 0.0674 | 50 | 0.0879 | 55 | Anqing | 0.0360 | 118 | 0.0430 | 151 | Luohe | 0.0198 | 258 | 0.0292 | 247 |
| Zibo | 0.0574 | 65 | 0.0877 | 56 | Xinyang | 0.0366 | 112 | 0.0426 | 152 | Heihe | 0.0252 | 210 | 0.0292 | 248 |
| Huizhou | 0.0655 | 53 | 0.0867 | 57 | Pingdingshan | 0.0354 | 126 | 0.0424 | 153 | Siping | 0.0211 | 249 | 0.0292 | 249 |
| Lanzhou | 0.0663 | 52 | 0.0862 | 58 | Shangqiu | 0.0371 | 109 | 0.0423 | 154 | Chongzuo | 0.0208 | 251 | 0.0291 | 250 |
| Jinhua | 0.0650 | 55 | 0.0860 | 59 | Heze | 0.0383 | 104 | 0.0422 | 155 | Suizhou | 0.0196 | 261 | 0.0291 | 251 |
| Wuhu | 0.0608 | 59 | 0.0859 | 60 | Jinzhou | 0.0317 | 157 | 0.0421 | 156 | Yunfu | 0.0318 | 156 | 0.0291 | 252 |
| Weifang | 0.0665 | 51 | 0.0839 | 61 | Jinzhong | 0.0339 | 141 | 0.0419 | 157 | Baiyin | 0.0221 | 241 | 0.0289 | 253 |
| Tangshan | 0.0598 | 61 | 0.0839 | 62 | Shangrao | 0.0377 | 106 | 0.0418 | 158 | Lijiang | 0.0234 | 236 | 0.0284 | 254 |
| Nanning | 0.0704 | 48 | 0.0827 | 63 | Xiaogan | 0.0347 | 130 | 0.0417 | 159 | Pingliang | 0.0240 | 227 | 0.0284 | 255 |
| Jinlin | 0.0655 | 54 | 0.0806 | 64 | Tonghua | 0.0298 | 179 | 0.0415 | 160 | Suihua | 0.0263 | 199 | 0.0283 | 256 |
| Haikou | 0.0638 | 57 | 0.0798 | 65 | Nanping | 0.0266 | 194 | 0.0414 | 161 | Wuzhou | 0.0295 | 262 | 0.0282 | 257 |
| Huzhou | 0.0543 | 66 | 0.0785 | 66 | Huangshi | 0.0250 | 211 | 0.0413 | 162 | Jinchang | 0.0108 | 286 | 0.0281 | 258 |
| Luoyang | 0.0614 | 58 | 0.0768 | 67 | Jincheng | 0.0283 | 185 | 0.0413 | 163 | Dazhou | 0.0235 | 232 | 0.0280 | 259 |
| Zhoushan | 0.0429 | 89 | 0.0763 | 68 | Yangjiang | 0.0246 | 218 | 0.0411 | 164 | Guigang | 0.0266 | 193 | 0.0279 | 260 |
| Yichang | 0.0433 | 86 | 0.0731 | 69 | Laiwu | 0.0263 | 200 | 0.0408 | 165 | Hebi | 0.0147 | 284 | 0.0277 | 261 |
| Lasa | 0.0586 | 63 | 0.0715 | 70 | Dandong | 0.0305 | 169 | 0.0406 | 166 | Guangan | 0.0206 | 253 | 0.0273 | 262 |
| Jining | 0.0575 | 64 | 0.0695 | 71 | Meizhou | 0.0363 | 117 | 0.0405 | 167 | Shuangyashan | 0.0214 | 247 | 0.0270 | 263 |
| Yinchuang | 0.0473 | 79 | 0.0694 | 72 | Xuancheng | 0.0305 | 168 | 0.0505 | 168 | Tongchuan | 0.0157 | 277 | 0.0268 | 264 |
| Daqing | 0.0255 | 205 | 0.0693 | 73 | Yongzhou | 0.0304 | 116 | 0.0404 | 169 | Baoshan | 0.0235 | 233 | 0.0267 | 265 |
| Kelamayi | 0.0141 | 284 | 0.0685 | 74 | Liaoyang | 0.0244 | 222 | 0.0404 | 170 | Wuwei | 0.0205 | 255 | 0.0265 | 266 |
| Xiyang | 0.0472 | 80 | 0.0682 | 75 | Tongling | 0.0195 | 263 | 0.0404 | 171 | Guangyuan | 0.0241 | 226 | 0.0264 | 267 |
| Linxi | 0.0592 | 62 | 0.0673 | 76 | Jingmen | 0.0254 | 206 | 0.0401 | 172 | Ankang | 0.0213 | 248 | 0.0263 | 268 |
| Langfang | 0.0457 | 82 | 0.0667 | 77 | Panzhihua | 0.0149 | 281 | 0.0401 | 173 | Baise | 0.0219 | 243 | 0.0262 | 269 |
| Anshan | 0.0491 | 74 | 0.0666 | 78 | Sanmenxia | 0.0224 | 240 | 0.0398 | 174 | Hezhou | 0.0219 | 242 | 0.0258 | 270 |
| Sanya | 0.0474 | 78 | 0.0662 | 79 | Anshun | 0.0344 | 135 | 0.0396 | 175 | Zhongwei | 0.0211 | 250 | 0.0255 | 271 |
| Taian | 0.0481 | 77 | 0.0646 | 80 | Ezhou | 0.0167 | 273 | 0.0395 | 176 | Zhaotong | 0.0225 | 239 | 0.0521 | 272 |
| Jiangmen | 0.0489 | 75 | 0.0636 | 81 | Jiamusi | 0.0318 | 155 | 0.0393 | 177 | Bazhong | 0.0256 | 203 | 0.0250 | 273 |
| Wuhai | 0.0205 | 254 | 0.0601 | 82 | Yanan | 0.0207 | 243 | 0.0392 | 178 | Meishan | 0.0175 | 270 | 0.0243 | 274 |
| Binzhou | 0.0406 | 96 | 0.0593 | 83 | Pingxiang | 0.0249 | 212 | 0.0392 | 179 | Qingyang | 0.0171 | 272 | 0.0243 | 275 |
| Liuzhou | 0.0396 | 98 | 0.0579 | 84 | Xingtai | 0.0343 | 137 | 0.0391 | 180 | Puer | 0.0233 | 237 | 0.0242 | 276 |
| Baoding | 0.0520 | 68 | 0.0575 | 85 | Ningde | 0.0246 | 217 | 0.0391 | 181 | Laibin | 0.0197 | 259 | 0.0239 | 277 |
| Handan | 0.0501 | 72 | 0.0575 | 86 | Jian | 0.0344 | 136 | 0.0390 | 182 | Ziyang | 0.0162 | 274 | 0.0238 | 278 |
| Panjin | 0.0284 | 184 | 0.0571 | 87 | Yichun | 0.0320 | 151 | 0.0389 | 183 | Yanan | 0.0199 | 267 | 0.0235 | 279 |
| Zhangzhou | 0.0395 | 100 | 0.0569 | 88 | Huanggang | 0.0347 | 129 | 0.0386 | 184 | Lincang | 0.0150 | 279 | 0.0234 | 280 |
| Nanyang | 0.0516 | 69 | 0.0568 | 89 | Liupanshui | 0.0274 | 189 | 0.0384 | 185 | Shangluo | 0.0196 | 260 | 0.0223 | 281 |
| Shantou | 0.0483 | 76 | 0.0568 | 90 | Yuncheng | 0.0341 | 138 | 0.0383 | 186 | Yichun | 0.0192 | 265 | 0.0222 | 282 |
| Qinhuangdao | 0.0461 | 81 | 0.0565 | 91 | Chengde | 0.0281 | 186 | 0.0382 | 187 | Neijiang | 0.0158 | 279 | 0.0221 | 283 |
| Zunyi | 0.0496 | 73 | 0.0559 | 92 | Yuxi | 0.0218 | 245 | 0.0381 | 188 | Hegang | 0.0173 | 269 | 0.0220 | 284 |
| Zhouzhou | 0.0365 | 115 | 0.0558 | 93 | Linfen | 0.0316 | 158 | 0.0381 | 189 | Suining | 0.0174 | 271 | 0.0219 | 285 |
| Maanshan | 0.0335 | 143 | 0.0556 | 94 | Zhoukou | 0.0314 | 160 | 0.0381 | 190 | Wuzhong | 0.0150 | 280 | 0.0204 | 286 |
| Yulin | 0.0300 | 176 | 0.0555 | 95 | Weinan | 0.0323 | 148 | 0.0375 | 191 | |||||
| Cangzhou | 0.0427 | 90 | 0.0554 | 96 | Haihua | 0.0330 | 146 | 0.0373 | 192 | |||||
References
- Holling, C.S. Resilience and stability of ecological systems. Annu. Rev. Ecol. Syst. 1973, 4, 1–23. [Google Scholar] [CrossRef]
- Hill, E.W.; Wial, H.; Wolman, H. Exploring Regional Economic Resilience; Working Paper, 2008-04; Institute of Urban and Regional Development: Berkeley, CA, USA, 2008. [Google Scholar]
- Pike, A.; Dawley, S.; Tomaney, J. Resilience, adaptation and adaptability. Camb. J. Reg. Econ. Soc. 2010, 3, 59–70. [Google Scholar] [CrossRef]
- Christopherson, S.; Michie, J.; Tyler, P. Regional resilience: Theoretical and empirical perspectives. Camb. J. Reg. Econ. Soc. 2010, 3, 3–10. [Google Scholar] [CrossRef]
- Dawley, S.; Pike, A.; Tomaney, J. Towards the resilient region: Policy activism and peripheral region development. SERC Discuss. 2010, 8, 650–667. [Google Scholar]
- Osborne, G. Budget 2014 Speech: UK Chancellor George Osborne [EB/OL]. Available online: https://www.gov.uk/government/speeches/chancellor-george-osbornes-budget-2014-speech (accessed on 23 April 2015).
- Martin, R.L. Regional economic resilience, hysteresis and recessionary shocks. J. Econ. Geogr. 2012, 12, 1–32. [Google Scholar] [CrossRef]
- Chen, M.Y. An international literature review of regional economic resilience: Theories and practices based on the evolutionary perspective. Prog. Geogr. 2017, 11, 1435–1444. [Google Scholar]
- Boschma, R.; Martin, R.L. Constructing an evolutionary economic geography. J. Econ. Geogr. 2007, 7, 537–548. [Google Scholar] [CrossRef]
- Pimm, S.L. The complexity and stability of economic systems. Nature 1984, 307, 321–326. [Google Scholar] [CrossRef]
- Holling, C.S. Understanding the complexity of economic, ecological and social systems. Ecosystems 2010, 4, 390–405. [Google Scholar] [CrossRef]
- Rose, A.; Liao, S.-Y. Modelling regional economic resilience to disasters: A computable general equilibrium model of water service disruptions. J. Reg. Sci. 2005, 45, 75–112. [Google Scholar] [CrossRef]
- Simmie, J.; Martin, R.L. The economic resilience of regions: Towards an evolutionary approach. Camb. J. Reg. 2010, 3, 27–43. [Google Scholar] [CrossRef]
- Hassink, R. Regional resilience: A promising concept to explain differences in regional economic adaptability? Camb. J. Reg. 2010, 1, 45–58. [Google Scholar] [CrossRef]
- Balland, P.A.; Rigby, D.; Boschma, R. The technological resilience of US cities. Camb. J. Reg. 2015, 2, 167–184. [Google Scholar] [CrossRef]
- Hudson, R. “Resilient Regions in an uncertain world: Wishful thinking or practical reality”. Camb. J. Reg. 2012, 1, 11–25. [Google Scholar] [CrossRef]
- Simin, S. Resilience: A bridging concept or a dead end. Urban Plan. Int. 2015, 2, 8–12. [Google Scholar]
- Martin, R.L.; Sunley, P.J. Complexity thinking and evolutionary economic geography. J. Econ. Geogr. 2007, 7, 16–45. [Google Scholar] [CrossRef]
- Fingleton, B.; Garretsen, H.; Martin, R.L. Recessionary shocks and regional employment: Evidence on the resilience of U.K. regions. J. Reg. Sci. 2012, 1, 109–133. [Google Scholar] [CrossRef]
- McInroy, N.; Longlands, S. Productive Local Economies: Creating Resilient Places; CLES-Centre for Local Economic Strategies: Manchester, UK, 2010; pp. 5–28. [Google Scholar]
- Brakman, S.; Garretsen, H.; Van Marrewijk, C. Regional resilience across Europe: On urbanization and the initial impact of the Great Recession. Camb. J. Reg. 2015, 2, 309–312. [Google Scholar] [CrossRef]
- Sun, J.W.; Sun, X.Y. Research Progress of Regional Economic Resilience and Exploration of Its Application in China. Econ. Geogr. 2017, 37, 1–9. [Google Scholar] [CrossRef]
- Hassink, R. The strength of weak lock-ins: The renewal of the West münster land textile industry. Environ. Plan. A 2007, 39, 1147–1165. [Google Scholar] [CrossRef]
- Grabher, G. The weakness of strong ties: The lock-in of regional development in the Ruhr Area. In The Embedded Firm: On the Socio-Economics of Industrial Networks; Routledge: London, UK, 1993; pp. 255–277. [Google Scholar]
- Pike, A.; Rodríguez-Pose, A.; Tomaney, J. Local and Regional Development. Local Reg. Dev. 2006, 7, 217–219. [Google Scholar]
- Hudson, R. “Rethinking change in old industrial regions: Reflecting on the experiences of North East England”. Environ. Plan. A 2005, 37, 581–596. [Google Scholar] [CrossRef]
- Briguglio, L.; Cordina, G.; Farrugia, N. Conceptualizing and measuring economic resilience. Build. Econ. Resil. Small States 2006, 265–288. Available online: https://s3.amazonaws.com/academia.edu.documents/45634778/resilience_index.pdf?AWSAccessKeyId=AKIAIWOWYYGZ2Y53UL3A&Expires=1544604979&Signature=PI6PIKIEu1nxsQjdEQeC2ufGMaU%3D&response-content-disposition=inline%3B%20filename%3DConceptualizing_and_measuring_economic_r.pdf (accessed on 12 December 2018).
- Guillaumont, P. An Economic Vulnerability Index: Its Design and Use for International Development Policy. Oxf. Dev. Stud. 2009, 37, 193–228. [Google Scholar] [CrossRef] [Green Version]
- Frenken, K.; Boschma, R. “A theoretical framework for economic geography: Industrial dynamics and urban growth as a branching process”. J. Econ. Geogr. 2007, 7, 635–649. [Google Scholar] [CrossRef]
- Zhang, Y.; Qi, W.; Wei, J.C.; Zhou, Z.X. Transformation of economic development mode and construction of regional resilience—A study based on DEA theory. China Sci. Technol. Forum 2012, 1, 81–88. [Google Scholar]
- Wang, S.; Zhang, J.; Fan, F. The symbiosis of scientific and technological innovation efficiency and economic efficiency in China—An analysis based on data envelopment analysis and logistic model. Technol. Anal. Strateg. Manag. 2019, 31, 67–80. [Google Scholar] [CrossRef]
- Fan, F.; Du, D.; Wang, X. The measure and characteristics of spatial-temporal evolution of China’s science and technology resource allocation efficiency. J. Geogr. Sci. 2014, 24, 492–508. [Google Scholar] [CrossRef]
- Liu, J.X. A decision-making method with preference information for index attributes. Syst. Eng. Theory Pract. 1998, 2, 54–57. [Google Scholar]
- Zhu, Z.; Zhang, L.; Ye, X.W. Comprehensive Benefit Evaluation of Land Use Based on TOPSIS Method. Econ. Geogr. 2011, 10, 139–144. [Google Scholar]
- Awasthi, A.; Chauhan, S.S.; Goyal, S.K. A multi-criteria decision making approach for location planning for urban distribution centers under uncertainty. Math. Comput. Model. 2011, 53, 98–109. [Google Scholar] [CrossRef]
- Zhang, H.; Gu, C.L.; Gu, L.W.; Zhang, Y. The evaluation of tourism destination competitiveness by TOPSIS & information entropy—A case in the Yangtze River Delta of China. Tour. Manag. 2011, 32, 443–451. [Google Scholar]
- Epanechnikov, V.A. Non-parametric estimation of a multivariate probability density. Theory Probab. Appl. 1969, 14, 153–158. [Google Scholar] [CrossRef]
- Wang, S.; Sun, C.; Lin, X.; Zou, W. Sustainable Development in China’s Coastal Area: Based on the Driver-Pressure-State-Welfare-Response Framework and the Data Envelopment Analysis Model. Sustainability 2016, 6, 958. [Google Scholar] [CrossRef]
- Liu, Y.; Zeng, C.; Cui, H.; Song, Y. Sustainable Land Urbanization and Ecological Carrying Capacity: A Spatially Explicit Perspective. Sustainability 2018, 10, 3070. [Google Scholar] [CrossRef]
- Zhang, X.; He, J.; Deng, Z.; Ma, J.; Chen, G.; Zhang, M.; Li, D. Comparative Changes of Influence Factors of Rural Residential Area Based on Spatial Econometric Regression Model: A Case Study of Lishan Township, Hubei Province, China. Sustainability 2018, 10, 3403. [Google Scholar] [CrossRef]
- Silverman, B.W. Density Estimation for Statistics and Data Analysis; Chapman and Hall: London, UK, 1986. [Google Scholar]
- Ali, I.H.; Son, H. Measuring inclusive growth. Asian Dev. Rev. 2007, 1, 11–31. [Google Scholar]
- Jacques, S.; Hyun, S. On the link between Bonferroni index and the measurement of inclusive growth. Econ. Bull. 2010, 1, 421–428. [Google Scholar]
- Du, Z.X.; Xiao, W.D.; Zhan, L. The context of inclusive growth theory, the essence and policy connotation. Chin. Rural Econ. 2010, 11, 4–14. [Google Scholar]
- Sun, C.; Liu, L.; Tang, Y. Measuring the Inclusive Growth of China’s Coastal Regions. Sustainability 2018, 10, 2863. [Google Scholar] [CrossRef]
Figure 1.
The opportunity curve.

Figure 2.
Estimation of China’s urban economic resilience kernel density from 2004 to 2016.

Figure 3.
Spatial distribution of urban economic resilience ranking in china from 2004 to 2016.

Figure 4.
A schematic diagram of the spatial distribution of 19 Urban Agglomerations in China.

Figure 5.
Spatial distribution of economic resilience of China’s urban agglomerations scores from 2004 to 2016.
Figure 5.
Spatial distribution of economic resilience of China’s urban agglomerations scores from 2004 to 2016.

Table 1.
China’s urban economic resilience evaluation index system.
| Total Target Level | Sub-Target Layer | Indicator Layer | AHP Weight | Entropy Weight | Comprehensive Weight |
|---|---|---|---|---|---|
| China’s urban economic resilience evaluation index system | Economic growth index | X1: Number of employees in the tertiary industry (10,000 people) | 0.0291 | 0.0397 | 0.0870 |
| X2: The third industry accounts for the proportion of GDP (%) | 0.1070 | 0.0070 | 0.0441 | ||
| X3: Total employment (10,000 people) | 0.0514 | 0.0375 | 0.0920 | ||
| X4: Urban construction land (square kilometers) | 0.0069 | 0.0346 | 0.0002 | ||
| X5: Fixed assets investment (ten thousand yuan) | 0.0111 | 0.0209 | 0.0004 | ||
| X6: GDP per capita (yuan) | 0.1070 | 0.0126 | 0.0830 | ||
| X7: Local public finance expenditure (ten thousand yuan) | 0.0177 | 0.0276 | 0.1023 | ||
| Opening up index | X8: Foreign direct investment contract projects (a) | 0.0296 | 0.1066 | 0.0567 | |
| X9: The actual amount of foreign investment used in the year (US$10,000) | 0.0591 | 0.0646 | 0.0579 | ||
| Social development index | X10: Education expenditure (ten thousand yuan) | 0.0071 | 0.0513 | 0.0956 | |
| X11: Number of colleges and universities(a) | 0.0146 | 0.0565 | 0.0007 | ||
| X12: Internet broadband access users (10,000 households) | 0.0156 | 0.0310 | 0.0012 | ||
| X13: Mobile phone year-end users (10,000 households) | 0.0156 | 0.0245 | 0.0003 | ||
| Environmental protection index | X14: General industrial solid waste comprehensive utilization rate (%) | 0.1844 | 0.0038 | 0.0003 | |
| X15: Sewage treatment plant centralized treatment rate (%) | 0.1064 | 0.0034 | 0.0011 | ||
| X16: Harmless treatment rate of domestic garbage (%) | 0.0555 | 0.0023 | 0.0010 | ||
| X17: Green coverage rate in built-up areas (%) | 0.0393 | 0.0036 | 0.0021 | ||
| Natural condition index | x18: Household registration population at the end of the year (10,000 people) | 0.0149 | 0.0122 | 0.0004 | |
| X19: Natural growth rate (%) | 0.0088 | 0.0066 | 0.0008 | ||
| X20: Administrative area land area (square kilometers) | 0.0063 | 0.0259 | 0.0006 | ||
| X21: Population density | 0.0149 | 0.0151 | 0.0004 | ||
| Technological Innovation Index | X22: Science and technology expenditure (ten thousand yuan) | 0.0264 | 0.0795 | 0.1089 | |
| X23: Number of scientific research and technical service employees (10,000 people) | 0.0401 | 0.2011 | 0.0876 | ||
| X24: The total number of Chinese and English papers (Article) | 0.0264 | 0.0370 | 0.0875 | ||
| X25: Three major patent licenses (a) | 0.0694 | 0.0591 | 0.0879 |
Table 2.
Average score of urban economic resilience (UER) in cities across three geographical regions in China.
Table 2.
Average score of urban economic resilience (UER) in cities across three geographical regions in China.
| Region | 2004 | 2005 | 2006 | 2007 | 2008 | 2009 | 2010 | 2011 | 2012 | 2013 | 2014 | 2015 | 2016 |
|---|---|---|---|---|---|---|---|---|---|---|---|---|---|
| Eastern | 0.0888 | 0.0889 | 0.1091 | 0.1093 | 0.1091 | 0.1089 | 0.1092 | 0.1094 | 0.1097 | 0.1097 | 0.1098 | 0.1098 | 0.1101 |
| Central | 0.0430 | 0.0425 | 0.0556 | 0.0561 | 0.0558 | 0.0556 | 0.0568 | 0.0572 | 0.0585 | 0.0586 | 0.0591 | 0.0594 | 0.0605 |
| Western | 0.0370 | 0.0368 | 0.0503 | 0.0503 | 0.0501 | 0.0495 | 0.0500 | 0.0503 | 0.0502 | 0.0504 | 0.0509 | 0.0511 | 0.0514 |
| Average | 0.0562 | 0.0560 | 0.0718 | 0.0719 | 0.0716 | 0.0713 | 0.0718 | 0.0723 | 0.0728 | 0.0729 | 0.0732 | 0.0732 | 0.0740 |
Table 3.
The economic resilience opportunity index and opportunity equity index of 19 urban agglomerations in China.
Table 3.
The economic resilience opportunity index and opportunity equity index of 19 urban agglomerations in China.
| Urban Agglomeration | Opportunity Index | Opportunity Fairness Index | ||||||
|---|---|---|---|---|---|---|---|---|
| 2004 | 2008 | 2012 | 2016 | 2004 | 2008 | 2012 | 2016 | |
| Beijing-Tianjin-Hebei | 0.1051 | 0.1441 | 0.1398 | 0.1442 | 0.67 | 0.73 | 0.72 | 0.71 |
| Central Shanxi | 0.0253 | 0.0306 | 0.0304 | 0.0333 | 0.78 | 0.74 | 0.74 | 0.77 |
| Hu-Bao-E-Yu | 0.0343 | 0.0435 | 0.0448 | 0.0487 | 0.91 | 0.84 | 0.84 | 0.86 |
| South-Central-Liaoning | 0.0629 | 0.0807 | 0.0852 | 0.0849 | 1.09 | 1.04 | 1.08 | 1.01 |
| Harbin-Changchun | 0.0511 | 0.0605 | 0.0632 | 0.0670 | 0.94 | 0.90 | 0.91 | 0.91 |
| Yangtze River Delta | 0.1820 | 0.2110 | 0.2400 | 0.2494 | 0.96 | 1.01 | 1.15 | 1.16 |
| West side of the Straits | 0.0473 | 0.0675 | 0.0676 | 0.0754 | 1.02 | 1.04 | 1.09 | 1.14 |
| Shandong Peninsula | 0.0567 | 0.0700 | 0.0712 | 0.0735 | 0.95 | 0.91 | 0.91 | 0.89 |
| Central Henan | 0.0353 | 0.0410 | 0.0428 | 0.0480 | 0.92 | 0.88 | 0.88 | 0.90 |
| Middle reaches of the Yangtze River | 0.0379 | 0.0441 | 0.0462 | 0.0506 | 0.80 | 0.73 | 0.76 | 0.77 |
| Pearl River Delta | 0.0826 | 0.1062 | 0.1254 | 0.1327 | 0.66 | 0.67 | 0.76 | 0.76 |
| Beibu Gulf | 0.0352 | 0.0398 | 0.0414 | 0.0451 | 1.02 | 0.93 | 0.95 | 0.95 |
| Chengdu-Chongqing | 0.1579 | 0.1663 | 0.1738 | 0.1857 | 1.45 | 1.39 | 1.48 | 1.45 |
| Central Guizhou | 0.0222 | 0.0255 | 0.0270 | 0.0289 | 0.90 | 0.88 | 0.89 | 0.89 |
| Central Yunnan | 0.0257 | 0.0284 | 0.0303 | 0.0323 | 0.89 | 0.85 | 0.86 | 0.86 |
| Guanzhong Plain | 0.0401 | 0.0456 | 0.0545 | 0.0576 | 0.84 | 0.75 | 0.89 | 0.85 |
| Lanzhou-Xining | 0.0234 | 0.0302 | 0.0356 | 0.0342 | 0.78 | 0.80 | 0.95 | 0.82 |
| Ningxia | 0.0199 | 0.0235 | 0.0249 | 0.0291 | 0.97 | 0.82 | 0.82 | 0.83 |
| North slope of Tianshan Mountain. | 0.0095 | 0.0138 | 0.0121 | 0.0106 | 1.06 | 1.02 | 1.02 | 1.01 |
© 2018 by the authors. Licensee MDPI, Basel, Switzerland. This article is an open access article distributed under the terms and conditions of the Creative Commons Attribution (CC BY) license (http://creativecommons.org/licenses/by/4.0/).
Share and Cite
MDPI and ACS Style
Yu, H.; Liu, Y.; Liu, C.; Fan, F. Spatiotemporal Variation and Inequality in China’s Economic Resilience across Cities and Urban Agglomerations. Sustainability 2018, 10, 4754. https://0-doi-org.brum.beds.ac.uk/10.3390/su10124754
AMA Style
Yu H, Liu Y, Liu C, Fan F. Spatiotemporal Variation and Inequality in China’s Economic Resilience across Cities and Urban Agglomerations. Sustainability. 2018; 10(12):4754. https://0-doi-org.brum.beds.ac.uk/10.3390/su10124754
Chicago/Turabian StyleYu, Haichao, Yan Liu, Chengliang Liu, and Fei Fan. 2018. "Spatiotemporal Variation and Inequality in China’s Economic Resilience across Cities and Urban Agglomerations" Sustainability 10, no. 12: 4754. https://0-doi-org.brum.beds.ac.uk/10.3390/su10124754
Note that from the first issue of 2016, this journal uses article numbers instead of page numbers. See further details here.