Article

What Is Left for Our Next Generation? Integrating Ecosystem Services into Regional Policy Planning in the Three Gorges Reservoir Area of China

1
College of Biology and Environmental Sciences, Jishou University, Jishou 416000, China
2
CAS Key Laboratory of Mountain Ecological Restoration and Bioresource Utilization & Ecological Restoration Biodiversity Conservation Key Laboratory of Sichuan Province, Chengdu Institute of Biology, Chinese Academy of Sciences, Chengdu 610041, China
3
State Key Laboratory of Urban and Regional Ecology, Research Centre for Eco-Environmental Sciences, Chinese Academy of Sciences, Beijing 100085, China
*
Authors to whom correspondence should be addressed.
These authors contributed equally.
Submission received: 14 November 2018 / Revised: 10 December 2018 / Accepted: 14 December 2018 / Published: 20 December 2018
(This article belongs to the Special Issue Sustainable Wildlife Ecology and Conservation)

Abstract

:
Land use/Land cover (LULC) changes as a result of policy planning influence ecosystem structures, processes, and functions, which are the basis for providing a wide range of ecosystem services (ES). There is an increasing consensus about the importance of integrating ES into ecological policy but quantifying the potential impacts of different policy on ES has proven difficult. We designed a remote sensing, geographic information system and scenario analysis-based approach to estimate and analyze the relationship between ES (soil conservation and carbon sequestration) and ecological policy designed to improve human welfare in the Chongqing municipality in the upper reaches of the Three Gorges Reservoir Area, China; a densely populated, highly modified watershed with serious soil erosion and flood hazard. Three alternative scenarios in 2050 were modeled for the Three Gorges Reservoir Area watershed. The model GEOMOD was used to predict future LULC changes due to policy planning. The ES models (Universal Soil Loss Equation model and Carnegie-Ames-Stanford Approach model) were designed to inform decisions, with an aim to align economic forces with conservation. We examine policy effectiveness by comparing scenarios for 2050 (Scenario1: Maintain current policy with no considerations of ES; Scenario2: Integrate ES into policy planning; Scenario3: Integrate ES into policy planning in view of the need of local people). Scenario-based LULC change analysis revealed that if the current afforestation policy continues (scenario 1), total ES would be further increased in 2050 due to expansion of forest cover. However, by targeting policy to improve ES provision (scenarios 2 and 3), ecological risks of soil loss can be significantly reduced and carbon sequestration enhanced. Scenario 3, thus, provided the best future environmental development scenario considering the need of local people in each region for ES. This scenario will theoretically help the Three Gorges Dam to harvest more ecological benefits through improvements in soil conservation and carbon sequestration. This study highlights the observation that including ES in policy planning and has a great potential to generate opportunities to maximize ES. This study highlights that including ES in policy planning has a great potential to generate opportunities to maximize ES. Hence, there is a need to encourage proper implementation of ecological policy to maintain and improve ES.

1. Introduction

Ecosystem services (ES) are tied to sustainable use of environmental resources and human development [1,2,3]. Nevertheless, ES are increasingly threatened by anthropogenic disturbances [4,5], which can assume many forms such as urbanization, land conversion, habitat destruction and water resource utilization. A large amount of the terrestrial ecosystems has been converted either to managed forest and agriculture or to residential systems due to the basic needs of humans, driven by population growth [6]. On the other side, some ecological policies leading human disturbances such as afforestation and natural forest protection have played an active role in ES improvement [7]. Generally, the earth surface is undergoing a constant land use/land cover (LULC) change due to a variety of human disturbances. Thus, LULC changes have usually been regarded as a proxy of human disturbances. Recently, with the emergence of widespread environmental pollution and ecological degradation [8], Chinese government has implemented a series of ecological policies in order to alleviate the negative environmental impacts on ES [9,10], which will lead to an enormous change in LULC in the future. Hence, exploring the impacts of LULC change on ES can provide a foundation for maintaining and improving ES, which are vital for sustainable development.
Over the past decades, great progress has been made in understanding the coupling mechanisms between ES and human welfare [1,5,10]. A lot of research achievements have contributed for providing vital information for regional ecosystem management, and various methods for ES evaluation have been developed extensively from case studies representing diverse spatial scales and sites [11,12,13]. However, it is still a great challenge to provide credible, spatially explicit information on ES provision [14] and to understand the impacts of LULC change on ES provision [15]. In addition, very few attempts have been made to model or project future ES under scenario-based LULC changes [14], which is extremely critical for maintaining sustainable supply of ES through scientific management and policy design [15].
Chongqing municipality, located on the upper reaches of the Three Gorges Reservoir Area in China, was a key area in this western development campaign (Some compare the campaign to the Marshall Plan). Moreover, Chongqing government received large investments and incentives for growth from the central government [13]. Recently, rapid population growth and urban expansion in the area have intensified the demand for food, housing, and commercial products [16], leading to a number of environmental issues. Agricultural, livestock, and industrial production (largely intensive development) are responsible for significant growth in greenhouse gas emissions [17]. Moreover, natural disasters, such as soil erosion, still seriously threaten the ecological safety of the Three Gorges Reservoir Area [13]. To mitigate the ecological problems in Three Gorges Reservoir Area brought about by rapid population growth, urban expansion and global warming, the Chongqing government has implemented a series of ecological policies including the Chongqing Forest Project, the Grain to Green Program and basic farmland protection [9]. The Chongqing Forest Project aims to protect and rebuild forest through bans on logging, artificial afforestation and aerial seed afforestation, which also includes urban forest planning, rural forest planning, road forest planning, river forest planning and nursery forest planning. Moreover, The implementation targets of these forest planning programs are mainly arable land (including slope steepness < 25° farmland). On the other hand, the Grain to Green Program aims to convert cropland on steep slopes to forest by providing farmers with grain and cash subsidies. Slope steepness > 25° is the main criterion by which plots are chosen for inclusion in the Grain to Green Program [9]. Increasing forest cover through the Grain to Green Program is an important way to reduce soil erosion in Three Gorges Reservoir Area [12]. In addition, to prevent a food crisis resulting from cropland conversion, basic farmland protection was taken into account; since then, agricultural land with high food production value has been given strong protection when slope steepness is less than 25°. This has led to dramatic changes in regional LULC with potentially important implications for ES and public health [18]. In view of this, it is imperative as well as scientifically significant to investigate how to apply ecological principles to improve the traditional environmental resource management structure, and to understand environmental resource management mechanisms to effectively enhance ES and safeguard public health during the rapid population growth and urban expansion process.

2. Materials and Methods
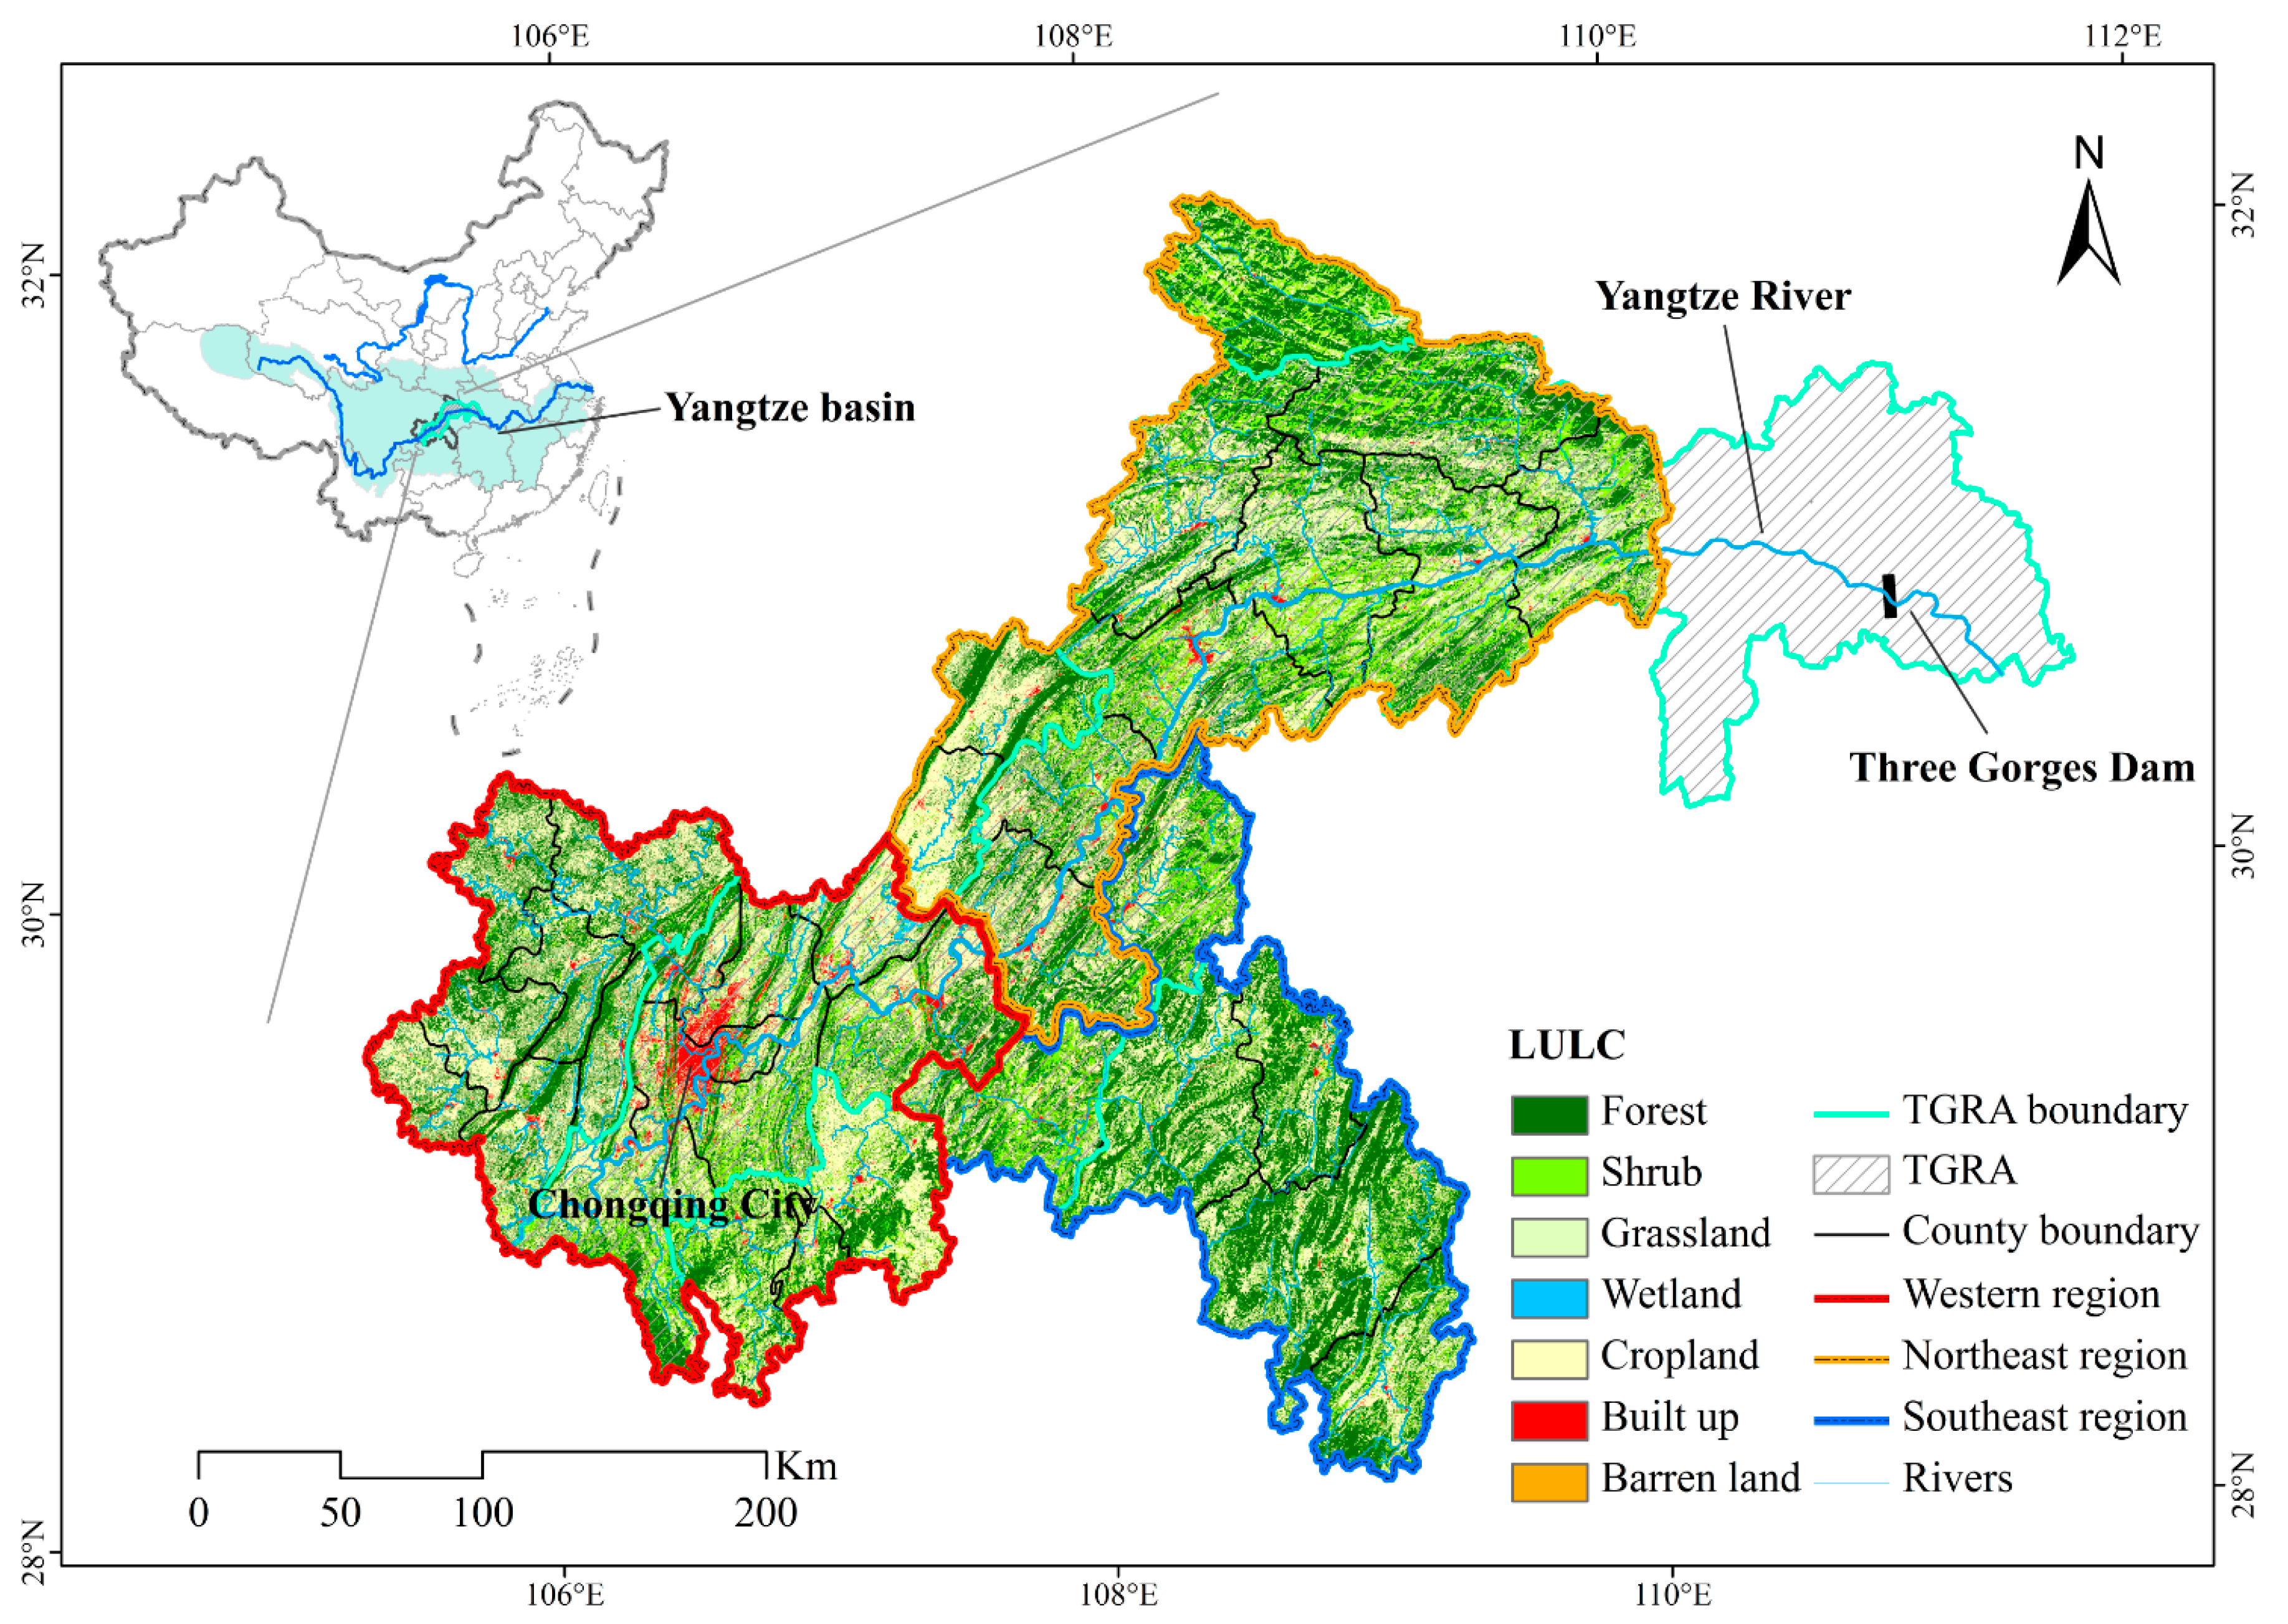
2.1. Study Area

The study area (Chongqing municipality) is situated between 105°11′–110°11′ E and 28°10′–32°13′ N and is located in the upper reaches of the Three Gorges Reservoir Area, which covers the lower section of the upper reaches of the Yangtze River (Figure 1). The Three Gorges Reservoir Area has a significant impact on the Yangtze basin, not only because the Three Gorges Dam (111°00′12″ E, 30°49′23″ N) is the world’s largest hydropower project [19], but also because the Yangtze basin is home to the world’s largest river basin population (>450 million people) [20]. Thus, the study area has been designated as one of the most important zones for ecological security in China [18]. The study area has a total population of 20.1 million, and covers an area of 82,400 km2, most of which is rugged terrain. Approximately 76% of the study area is mountainous, 18% is hilly, and only 6% is plains. The elevation of the region is higher to the east and lower to the west. Forest and cropland are the two dominant LULC types. The dominant soil types are Ultlsols, based on USDA soil taxonomy. The region has a subtropical monsoon climate and, for most of the year, experiences humid conditions with an annual mean temperature of 17–19 °C. The mean annual precipitation reaches approximately 1100 mm [13]. Rainfall is unevenly distributed and 85% of the annual rainfall occurs during summer (6–9 months). Moreover, Chongqing includes three planning regions: the northeast region (ecological restoration region), the southeast region (ecological preservation region), and the west region (economic development region). The government established these regions based on the local population, economy, and environmental characteristics.

2.2. Data Sources

LULC maps with 90 m resolution for 2000, 2005, and 2010 were produced by the Institute of Remote Sensing and Digital Earth, Chinese Academy of Sciences, using Landsat-TM and Landsat-ETM+ images with overall classification accuracy ranging from approximately 82.2% to 86.4% [13]. Meteorological data (including precipitation, temperature, and total solar radiation at a monthly scale) from 2000 to 2010 were provided by the Chinese National Metrological Information Center/China Meteorological Administration. Digital elevation model (DEM) data with approximate 90 m resolution were derived from the Shuttle Radar Topography Mission. The soil map and related attributes (including the mass percentages of clay, silt, sand, and soil organic matter) were acquired from the second National Soil Survey of China at a scale of 1:1,000,000. The Moderate Resolution Imaging Spectroradiometer (MODIS) normalized difference vegetation index (NDVI) dataset from 2000 to 2010 also was used in the study, with a resolution of 250 m. To represent the production of various types of products comparably and consistently, the food-supply calories data was used in the study [8]. Observed data for ES model validation were collected from Chongqing government (http://www.cqwater.gov.cn/), the soil and water conservation bulletin and several published works [21,22]. The validation data, which included annual average soil erosion (t/ha−1, metric tons per hectare) in 2000, 2005, and 2010, were collected from the soil and water conservation bulletin; net primary productivity (NPP, g C m−2) in 2004 obtained from a published work [21]. In order to predict the future LULC maps, we also used five driving variables viz. agricultural protection, distance to roads and rivers, slope, and two variables of ES potential (soil conservation and carbon sequestration) [23]. These drivers were selected because of their likelihood of influencing LULC change patterns [24,25].

2.3. Policy Scenarios

Scenario 1 (Maintain current policy) reflects the implementation of the current ecological policy. According to the current ecological policy, the transition assumptions in scenario 1 were that the lands near roads and riversides, lands with a slope angle > 25°, as well as non-farmland reserve, would likely be randomly transformed to forests. Scenario 2 (Integrate ES into policy planning) placed greater emphasis on the improvement of ES provision, and the implementation of policy not only took account of the above-mentioned transition assumptions, but also considered the maximized potential of ES (maximization of ES value of combined selected afforestation lands in total area) [23]. Namely, the area for afforestation has higher priority if its location can potentially increase ES provision. Compared with scenario 2, scenario 3 (Integrate ES into policy planning in view of the need of local people) allowed more reasonable spatial planning for ecological policy by considering demand and supply characteristics (needs of residents in three different regions for ES and the availability of existing ES in those regions) of ES in different region. Due to the spatial variability of ecological background and economic development in Chongqing, the priorities of ecological policy should not be the same at all locations. With more than half of GDP and population distributed in the Western region, rapid population growth and urban expansion in the area have intensified greenhouse gas emissions. Thus, the regional policy in the West region should commit to afforestation near the roads and riversides, where the factories are densely distributed, as a means to reduce emission of greenhouse gas and improve air quality. The Northeast region, located in the upper reaches of the Three Gorges Dam, is facing serious soil erosion risk, which is significant to the ecological security of the lower Yangtze basin. To address devastating soil erosion, the government should implement afforestation in this region. The ecosystems in the Southeast region are fragile and facing serious ecological degradation (such as soil loss). It is widely believed that ecological policy, decreasing soil erosion and enhancing carbon sequestration can bring huge benefits to local people. A set of driving variables used in the scenario modeling were created based on the transition assumptions in each scenario.

2.4. LULC Simulation

The GIS-based GEOMOD model as a LULC change model was used to predict the future distribution of the forest landscape after implementation of various policy scenarios. GEOMOD is one of the most commonly used models for predicting forestation processes [25,26]. To unify the units of measurement for the different variables, we first normalized each variable using the “Fuzzy” method in the IDRISI GIS model (https://clarklabs.org/). A suitability map was produced showing the transition probabilities from LULC state 1 (e.g., non-forest) to state 2 (e.g., forest). The suitability of a pixel for forest land was derived from the properties of the integrated driving variables, which were produced using a multi-criteria evaluation method [27] by combining multiple driving variables. The model searches for pixels with the highest suitability values for conversion from state 1 to state 2 and vice versa. More detailed information about the GEOMOD model can be found in Pontius [25]. Calibration and validation are vital for assuring the GEOMOD model produces accurate results [28]. In our study, calibration and validation were executed by reference to Estoque’s research [24]. The alternative that resulted in the highest agreement between the simulated LULC 2010 and the actual LULC 2010 was used to simulate the LULC in 2050. The best neighborhood options in this study were the 9 × 9 search width for forestation.

2.5. ES Models

We analyzed the degrees of two key services in the study area: soil conservation and carbon sequestration. These ES were selected based on their significant role in this area, relevancies to ecological policy and the availability of data. We applied USLE, CASA, and InVEST models to analyze ES provision in each scenario.
(1) Soil Conservation
Soil erosion displaces (sediment-bound) nutrients and reduces edaphic fertility; moreover, sedimentation results in lower hydropower output and structural damage to hydropower facilities [29]. In this study, we used the soil erosion reduction during the study period as a measure of soil conservation improvement. The function of soil erosion based on Universal Soil Loss Equation model (USLE) [30,31] was expressed as:
S E a = R × K × L S × C × P
where SEa represents for the actual soil erosion rates for each pixel (t ha−1 yr−1); R is rainfall erosivity factor (MJ mm ha−1 h−1 yr−1), and was computed using monthly average precipitation and an empirical equation [12]; K is the soil erodibility factor (t ha h ha−1 MJ−1 mm−1), and was calculated using the modified equation based on the Erosion/Productivity Impact Calculator model [32]; LS is a dimensionless topographic factor, and was calculated based on the methods with the help of an arc macro language script in ArcGIS software [33,34]; C is dimensionless vegetation cover factor, and was estimated using the form of NDVI [12]; and P is the dimensionless conservation practice factor, and was calculated using the slope-based Wener method [31].
(2) Carbon sequestration
Carbon sequestration is the process of long-term capture and storage of atmospheric CO2 [35,36], and is proposed as a mitigation of global warming. To quantify the amount of CO2 sequestrated annually by an ecosystem, we estimated net ecosystem productivity (NEP) as a proxy of carbon sequestration [36,37], defined as follows:
N E P = N P P R h = N P P 0.592 × R s 0.714
where NEP denotes the amount of carbon sequestration for each pixel (g C m−2 yr−1); NPP is net fixation of CO2 by vegetation (g C m−2 yr−1), and was computed in Carnegie-Ames-Stanford Approach mode (CASA) [11,38] on the basis of light-use efficiency [39]; Rh is heterotrophic respiration (g C m−2 yr−1); and Rs is soil respiration from terrestrial ecosystems (g C m−2 yr−1) and was calculated according to Chen’s research [40].

2.6. Model Validation

(1) GEOMOD Validation
It is impractical to assess the accuracy of ecological policy predictions for 2050 because future policy developments are uncertain. However, in an effort to validate the GEOMOD model, a suitability map for the year 2000 (derived from current policy) was used in conjunction with level of afforestation in 2000 to predict the forest in 2010. The applicability and reliability of the model were assessed by comparing the simulated 2010 forest map with the actual 2010 forest classification map, using the VALIDATE module in the IDRISI software (Table 1) with an overall agreement of 93%. Moreover, a high Kappa agreement (Kno) of 89% was obtained, and the agreement between the two maps in terms of location and quantity of each category was approximately 86%. These results revealed that current ecological policy played a fundamental role in determining the locations of future forests.
(2) ES model validation
The distributions of ES, including soil erosion (at county level) and net primary productivity (at quadrat level, 1 km2) were modeled using USLE and CASA models. To verify the relevant model’s regional applicability and reliability, the results were validated using Pearson correlations based on observed and statistical data [23]. Significant correlations were found between the simulated results and observation-based data (Table 2).

3. Results

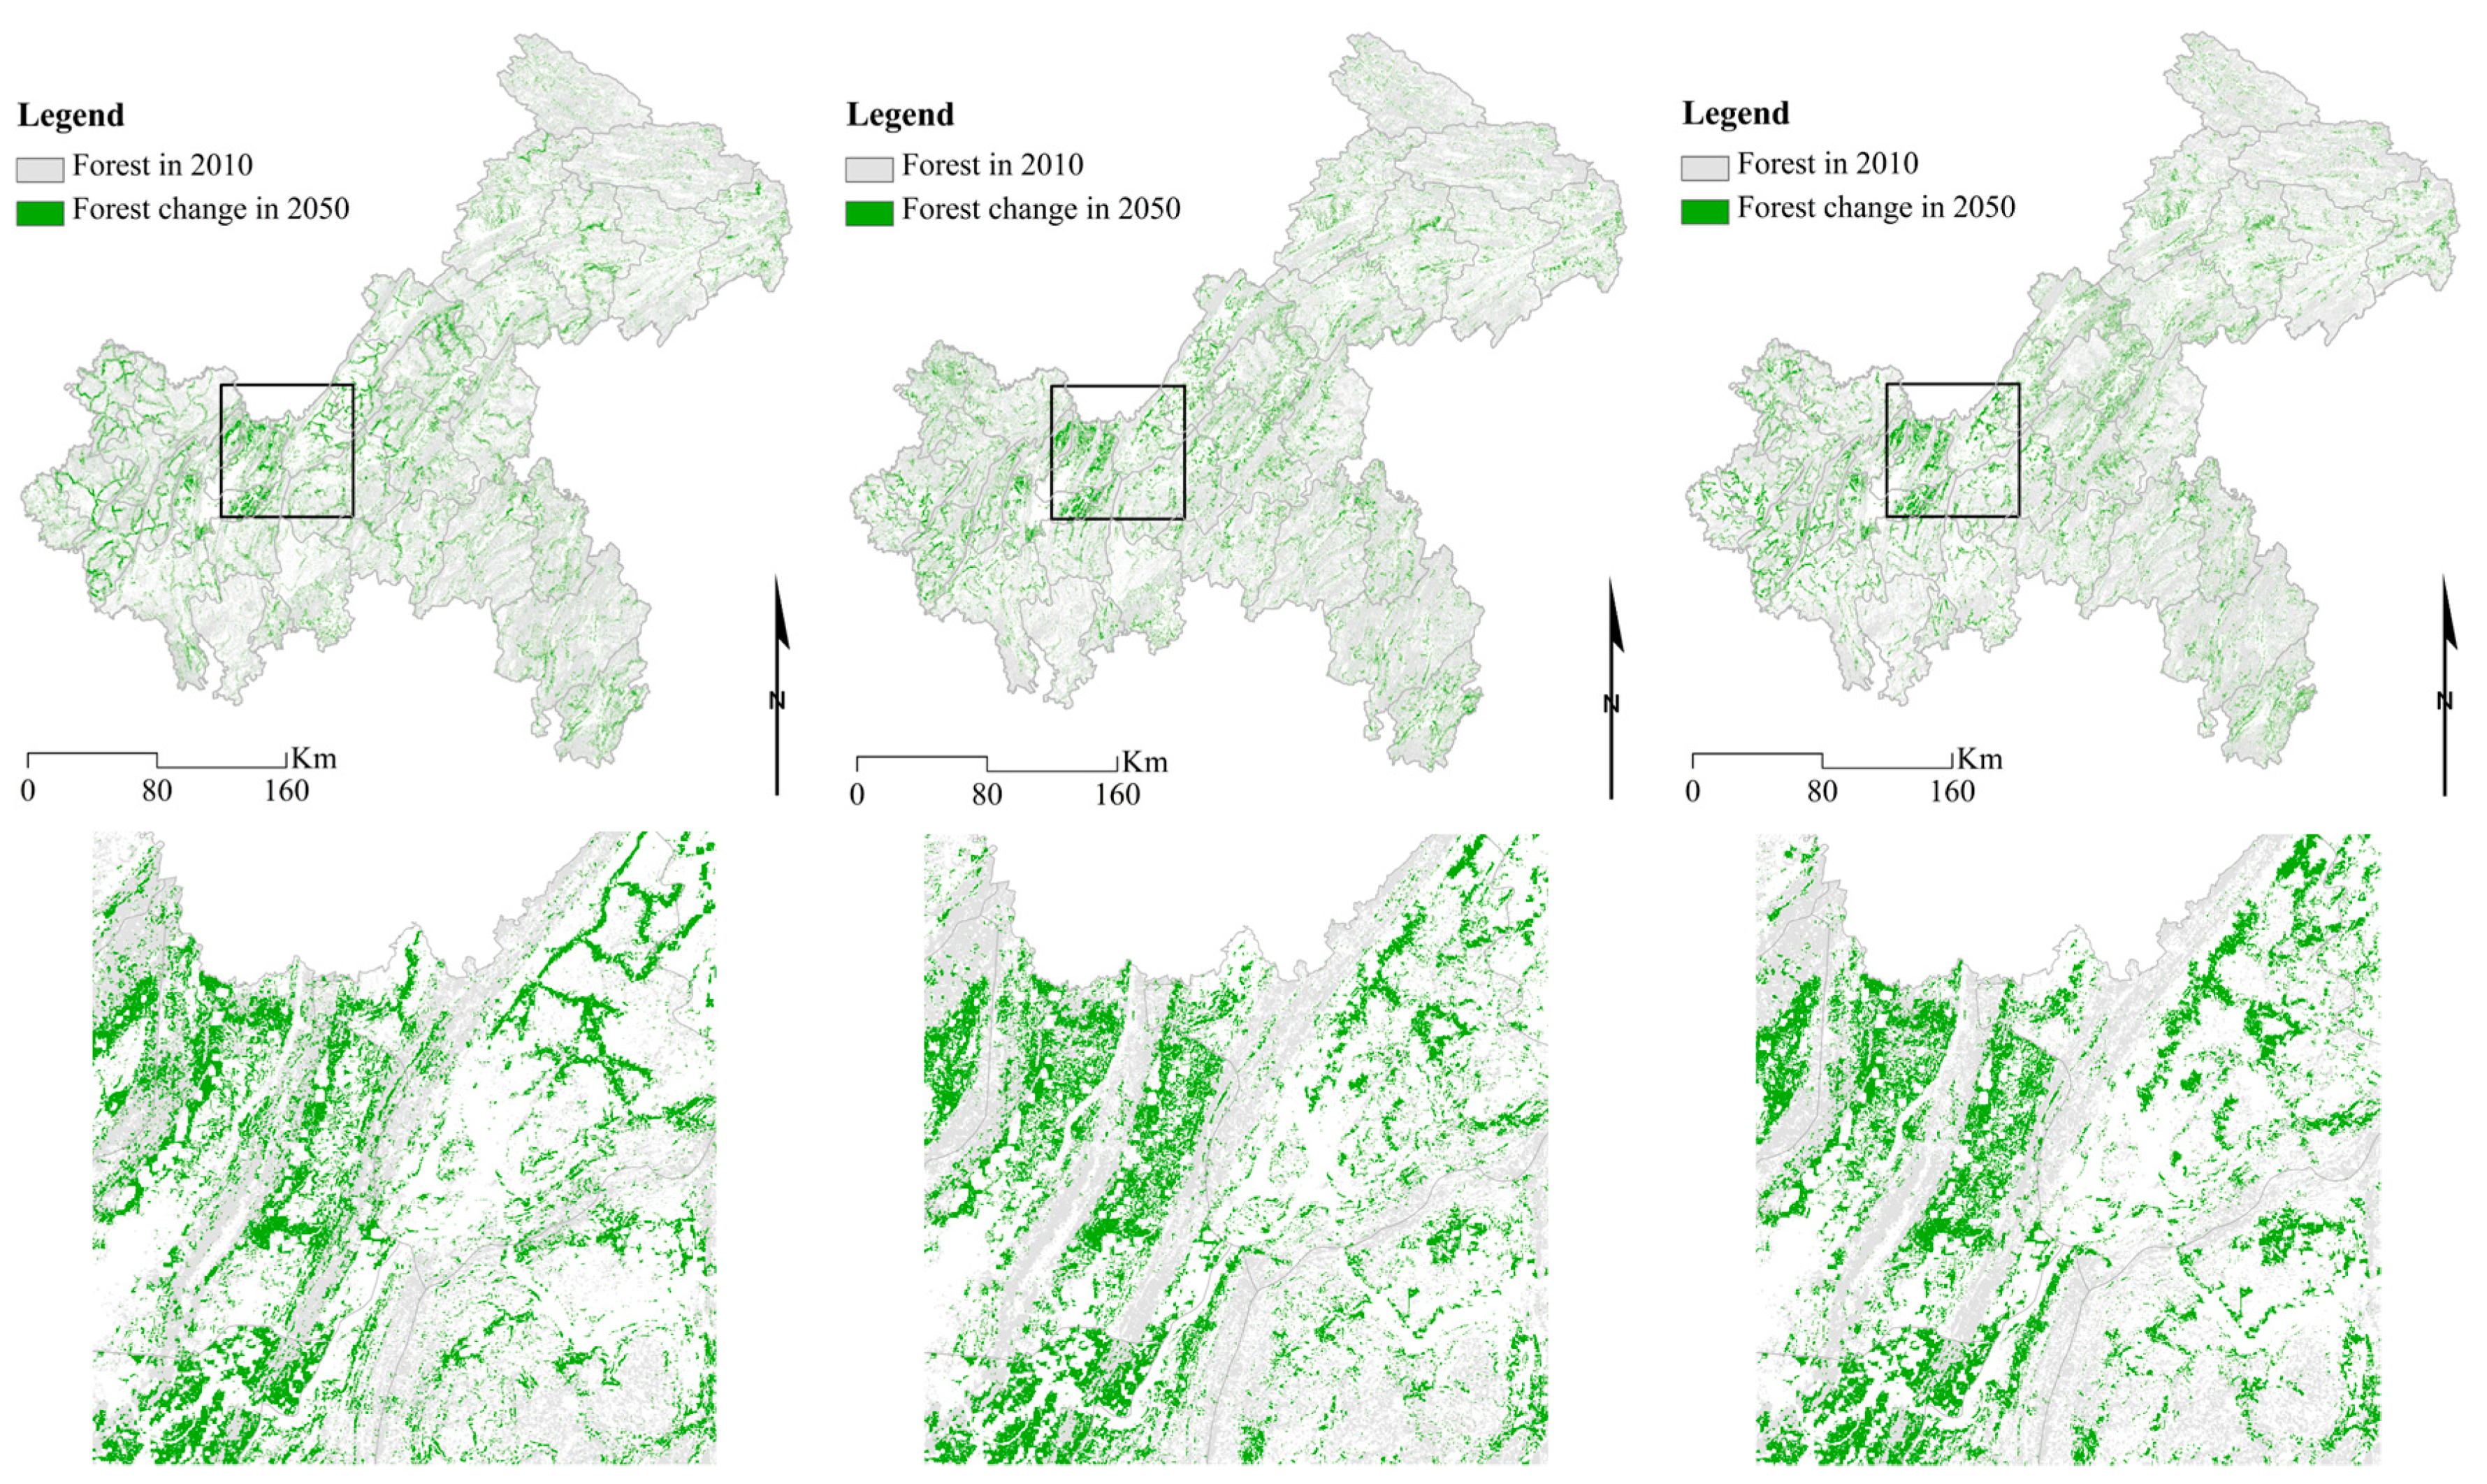
3.1. Projected Future LULC Trends

Significant changes in LULC have been driven by current policy, particularly in relation to the Chongqing Forest Project and Grain to Green Program. Figure 2 shows the results of the scenario-based LULC change modeling between 2010 and 2050. The predominant LULC change types during the study period were cropland, which occupied approximately 36.14% of the study area in 2010, 27.66% in scenario 1, 26.23% in scenario 2, and 26.36% in scenario 3 (Table 3). The low proportions of cropland in all scenarios reflect the fact that the ecological policy of transition from cultivated land to forest was effective. Spatial discrepancies in forest changes existed among the scenarios. Scenario 1 showed that major change was concentrated near the road and river networks, while the distributions of forest change in scenarios 2 and 3 were different. In scenario 2 and 3, extension of forest cover mainly occurred in hilly areas near the road and river networks, including areas with steep slopes and high elevation. The change tendencies of forest cover in scenarios 2 and 3 were approximately consistent, but some regional discrepancies existed.

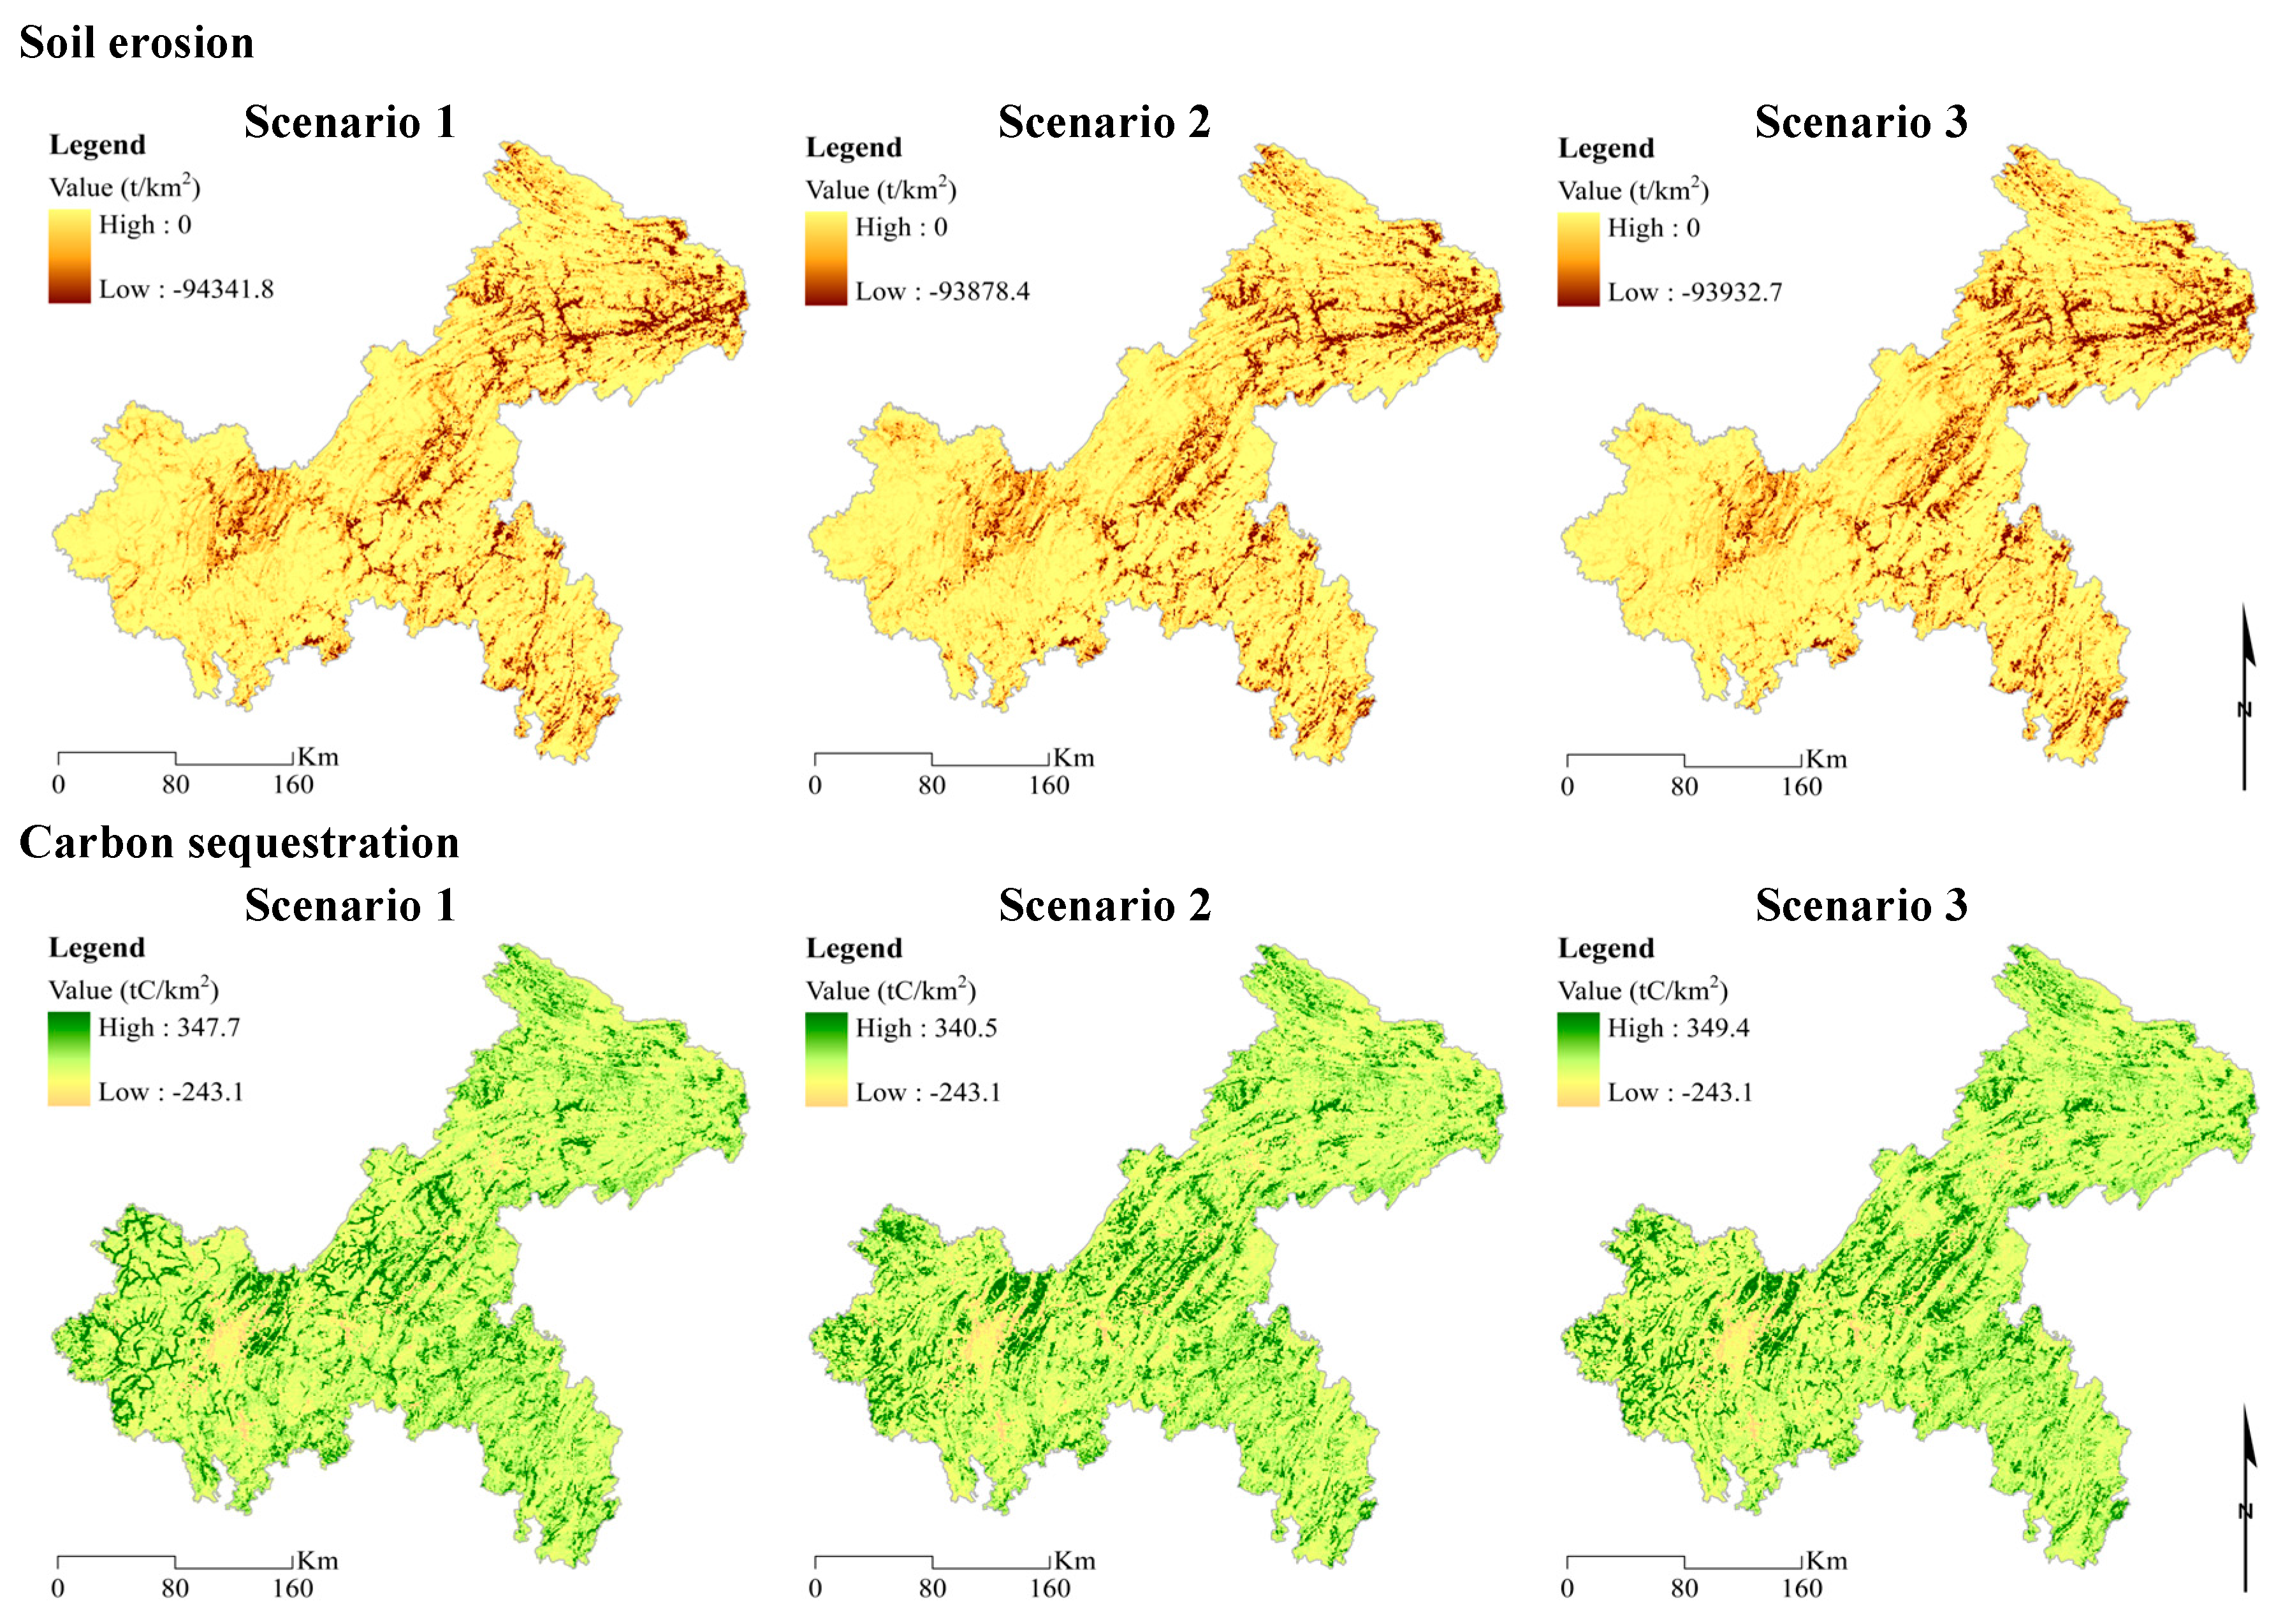
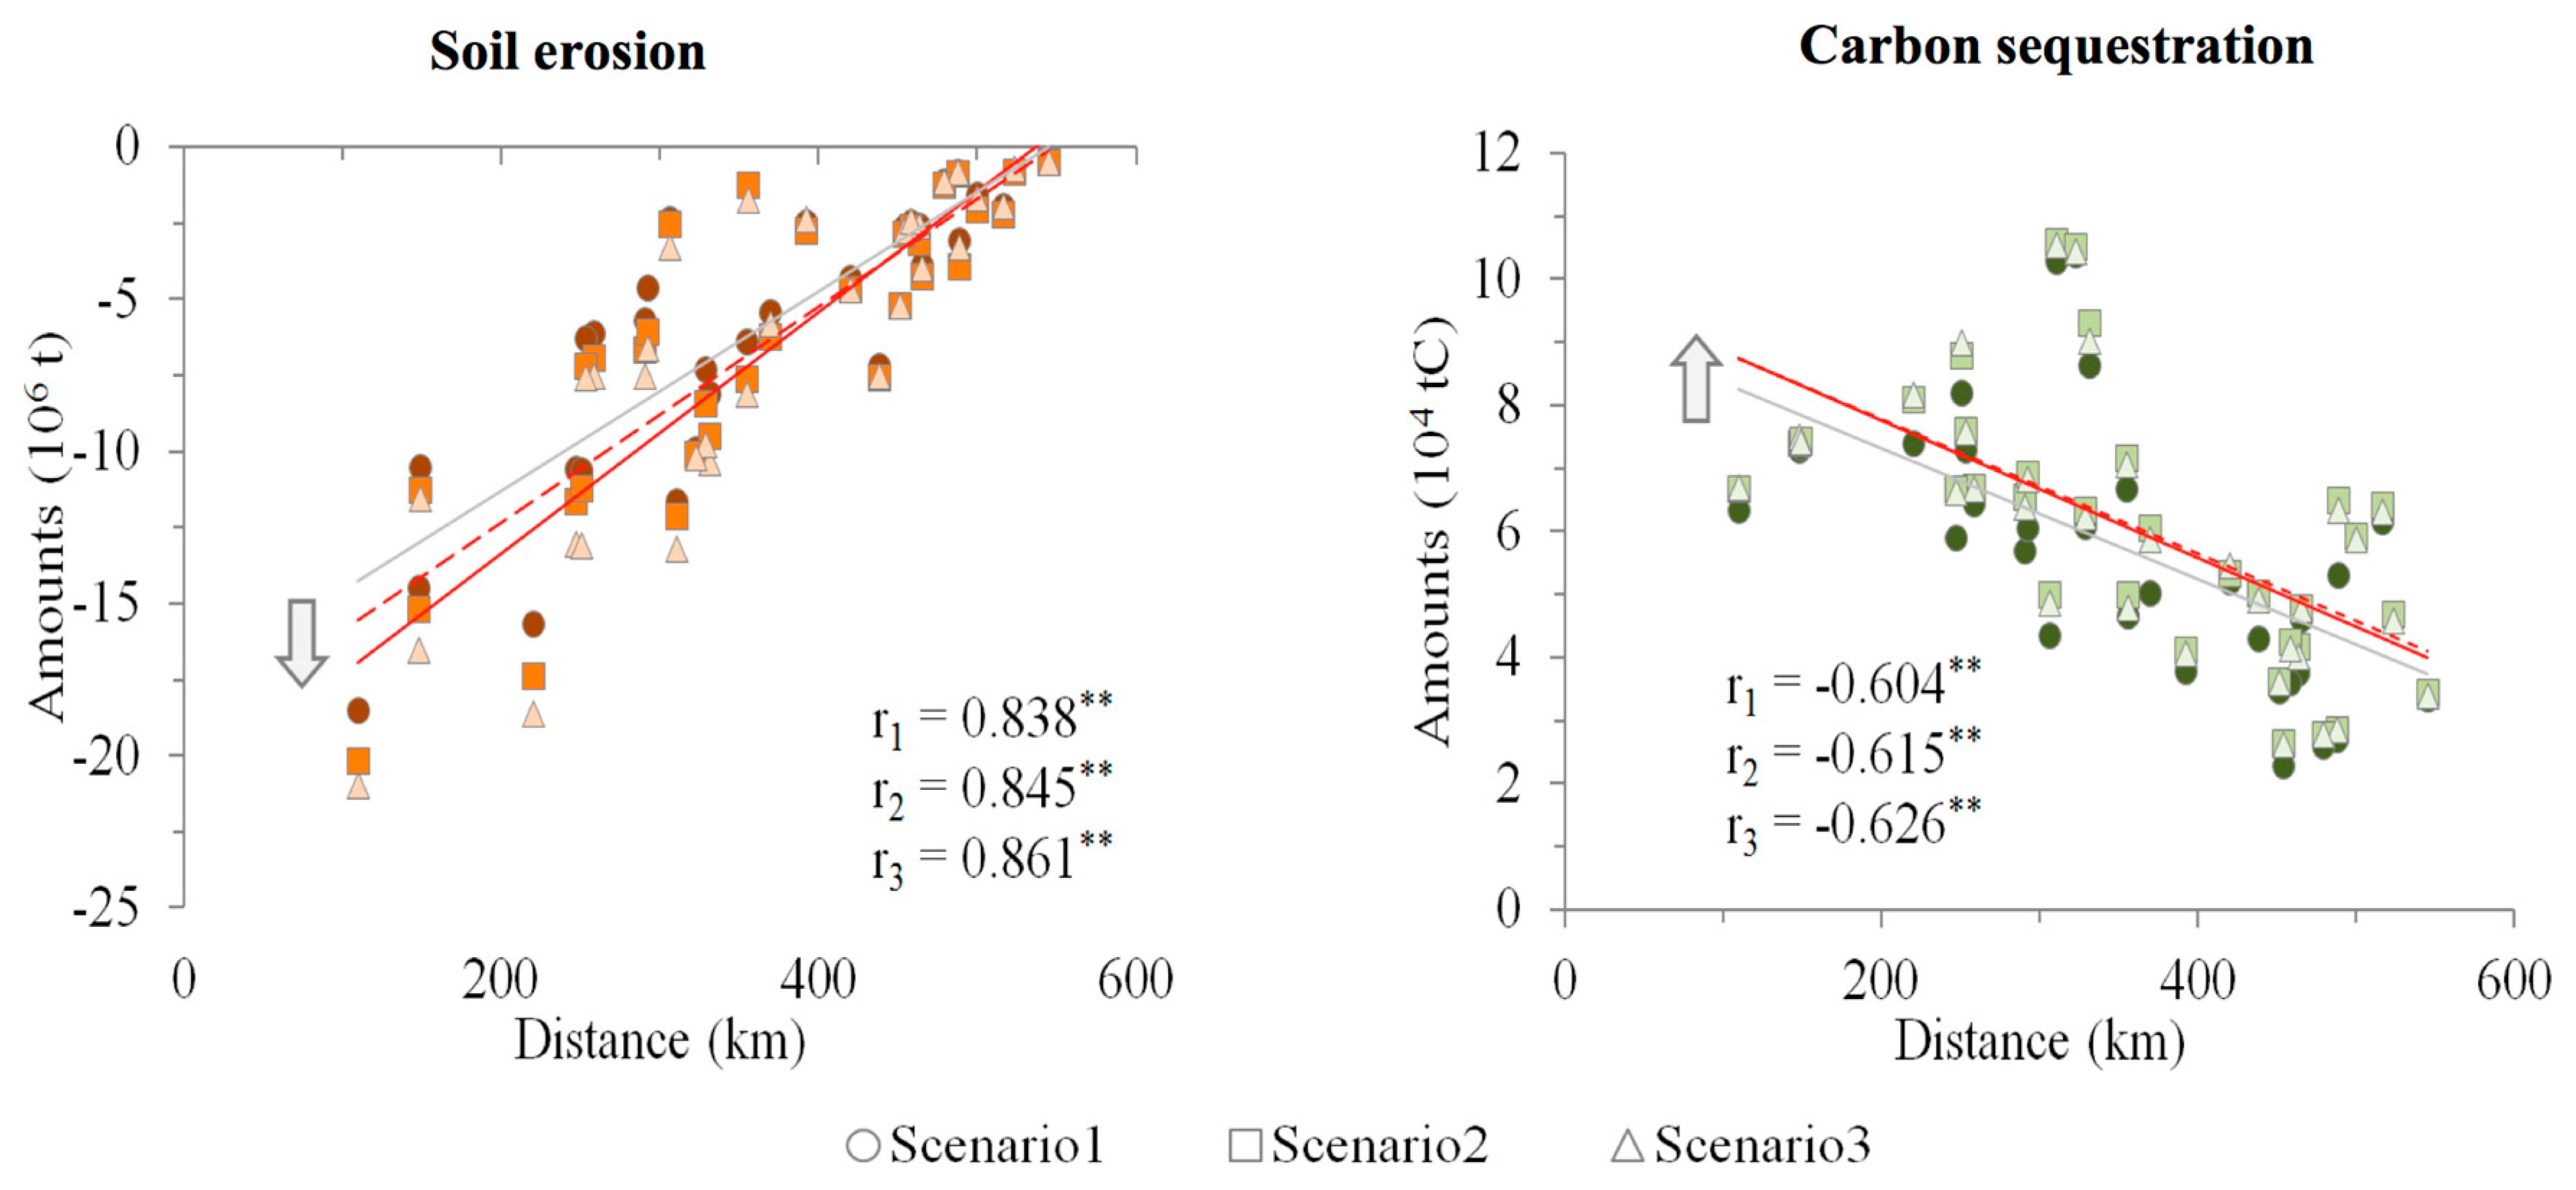
3.2. Potential Impact of Future LULC Changes on ES

The spatial changes of ES in all scenarios from 2010 to 2050 are shown in Figure 3. The areas with high values for soil erosion prevention (values < −100 t ha1) were mainly distributed in the northeastern and southeastern mountains, especially in areas with steep slopes and high elevation where serious risks of soil erosion remained. An obvious increase in carbon sequestration (values > 0.5 t C ha1) occurred in the western mountains. The total ES in all scenarios were further increased due to expansion of forest cover. Scenario 1 presented the most realistic LULC patterns for 2050; however, it also yielded the lowest growth in ES provision, compared with scenarios 2 and 3. In general, the amount of soil erosion was decreased dramatically in scenario 3 with the reduction of 2.28 × 10⁸ t (percentage change, 29.12%). Furthermore, carbon sequestration was highly increased in scenario 2 with the increment of 1.98 × 10⁶ t C (percentage change, 29.11%) (Table 4).
LULC changes (from 2010 to 2050) accompanied by ES changes indicate that local human welfare and public health will be strongly affected, especially in relation to the changes nearby the Three Gorges Dam [13]. Figure 4 represent the relationship between the ES changes and distance to Three Gorges Dam in each scenario. Each dot represents a county, circle (scenario 1), square (scenario 2), triangle (scenario 3). The gray line (scenario 1), red dashed line (scenario 2), red line (scenario 3) are the linear trend. The r1 (scenario 1), r2 (scenario 2) and r3 (scenario 3) are the Pearson Correlation Coefficient. The scatterplot in Figure 4 shows that there are excellent correlations between ES changes and distance to the Three Gorges Dam. Consequently, the results revealed that the shorter the distance to the Three Gorges Dam, the greater the changes in soil erosion and carbon sequestration.

4. Discussion

Feasible policy to assure sustainable development and ecological protection in the Three Gorges Reservoir Area is needed. Chongqing municipality is threatened by serious environmental problems (soil erosion, floods and drought) due to rapid population growth, economic development, and global warming [41]. By linking improvement of ES to policy decisions, scenario-based analysis can help governments at all levels effectively address the main ecological challenges through diversification of the types of policy targets.
This study explored and compared the potential impacts of future LULC changes driven by regional policy planning on ES provision involving three scenarios. These scenarios presented a ‘conservative’ assumption that the existing regional planning was not disrupted. We supposed that this assumption could be valid as long as the local government continued to focus on afforestation. Among the three scenarios we examined, scenario 1 involved the continuation of current policy, which simply assumed “one size fits all” with no consideration of spatial heterogeneity in improving ES. Scenario 1 presented the most realistic LULC patterns for 2050; however, it also yielded the lowest growth in the provision of ES, which indicates lower policy efficiency than could be achieved by adjusting current policy decisions based on the distribution of areas where ES had high potential to be improved to a greater extent. Scenarios 2 and 3 on the other hand that integrated ES into policy planning by considering the spatial heterogeneity of ES potential, could provide better services in terms of significant improvements in soil conservation and carbon sequestration, a conclusion supported by the findings of other researchers [12,24]. Our results indicate that site selection for the Chongqing Forest Project and the Grain to Green Program should be carefully considered.
The Three Gorges Dam is sensitive to the effects of soil erosion depending on the distances of vulnerable areas from the dam [42]. Sites close to the dam may pose a potential ecological threat to the Three Gorges Dam because they lack the mitigation that is naturally provided by distance. The shorter the distance to the Three Gorges Dam, greater are the changes in soil erosion and carbon sequestration. This relationship can be explained by the fact that land conversion occurred easily in areas closer to the Three Gorges Dam that had less human activity interferences, due to lower land transfer costs [43] and more natural protection. Among all scenarios, scenario 3 presented a better option than scenario 2 because of its enhanced soil conservation and carbon sequestration in areas close to the Three Gorges Dam. Serious soil erosion and flooding are apt to occur near the Three Gorges Dam [42,44]. Hence, by aligning supply and demand characteristics of ES with environmental goals in each region, scenario 3 helps effectively address some of Chongqing municipality’s challenges. And it also represents a new systematic planning approach in the decision-making process by considering more input and feedback from local people.

5. Conclusions

Predicted LULC changes in the future caused by policy, as well as changes to ES in Chongqing municipality, will have significant ecological effects on the downstream Three Gorges Reservoir Area. It is a challenge to find feasible policy solutions to secure sustainable development while maintaining the ecological security of the Three Gorges Reservoir Area. To address this challenge, ES can be comparatively analyzed in different scenarios using models such as GEOMOD, USLE and CASA. Projections indicate that Chongqing municipality will experience a process of land conversion from farmland to forests as a result of the implementation of current policy, which will also alter the provision of ES. However, current policy is not optimal because it does not consider potential areas for improvements of ES that might cope with ecological risks while providing better supplementary ES. In Chongqing municipality, a policy planning that considers the demand and supply characteristics of ES in each region will be superior to the current policy. Such an approach presents the best future environmental development scenario for Chongqing municipality and will help assure the integrity of Three Gorges Dam by delivering more ecological benefits through improvements in soil conservation and carbon sequestration. Thus, linking ES to policy planning based on spatial characteristics is a key step toward efficient analysis before policy implementation and will provide superior outcomes over a “one size fits all” approach. The results from this study provide suggestions for policy-makers and stakeholders to achieve sustainable development of ecological environment and to safeguard public health.

Author Contributions

All authors worked together to design this study. Y.X. contributed to initiating and conceiving the topic of this paper; Q.X. and Y.X. collected the data and did the analysis; Q.X., Y.X. and K.P. wrote the draft of this paper; all authors contributed substantially to modify and revise this paper.

Funding

This research was funded by the National Key Research and Development Program, grant number 2016YFC0502101, the National Natural Science Foundation of China, grant number 31700544, and the Chinese Academy of Sciences (CAS) “Light of West China” Program, grant number 2016XBZG_XBQNXZ_B_005.

Acknowledgments

We thank Pinghan Liang for his help during the preparation of the manuscript. The authors would like to thank the relevant members of the government departments in Chongqing for their support in data collection and grateful to editors and anonymous reviewers for their very helpful comments and constructive feedback. We also thank Bikram Pandey and International Science Editing (http://www.internationalscienceediting.com) for polishing language in this manuscript.

Conflicts of Interest

The authors declare no conflict of interest.

References

  1. Daily, G.C. (Ed.) Nature’s Services: Societal Dependence on Natural Ecosystem; Island Press: Washington, DC, USA, 1997. [Google Scholar]
  2. Costanza, R.; d’Arge, R.; de Groot, R.; Farber, S.; Grasso, M.; Hannon, B.; Limburg, K.; Naeem, S.; O’Neill, R.; Paruelo, J.; et al. The value of the world’s ecosystem services and natural capital. Nature 1997, 387, 253–260. [Google Scholar] [CrossRef]
  3. Millennium Ecosystem Assessment (MA). Ecosystems and Human Well-Being: Synthesis; Island Press: Washington, DC, USA, 2005. [Google Scholar]
  4. Balvanera, P.; Daily, G.C.; Ehrlich, P.R.; Ricketts, T.H.; Bailey, S.A.; Kremen, C.; Pereira, H. Conserving biodiversity and ecosystem services. Science 2001, 291, 2047. [Google Scholar] [CrossRef]
  5. Swetnam, R.D.; Fisher, B.; Mbilinyi, B.P.; Munishi, P.K.; Willcock, S.; Ricketts, T.; Mwakalila, S.; Balmford, A.; Burgess, N.D.; Marshall, A.R.; et al. Mapping socio-economic scenarios of land cover change: A GIS method to enable ecosystem service modelling. J. Environ. Manag. 2011, 92, 563–574. [Google Scholar] [CrossRef]
  6. Botequilha Leitáo, L.; Miller, J.; Ahern, J.; McGarigal, K. Measuring Landscapes: A Planner’s Handbook; Island Press: Washington, DC, USA, 2006. [Google Scholar]
  7. Rey Benayas, J.M.; Newton, A.C.; Diaz, A.; Bullock, J.M. Enhancement of biodiversity and ecosystem services by ecological restoration: A meta-analysis. Science 2009, 325, 1121–1124. [Google Scholar] [CrossRef] [PubMed]
  8. Ouyang, Z.Y.; Zheng, H.; Xiao, Y.; Polasky, S.; Liu, J.G.; Xu, W.H.; Wang, Q.; Zhang, L.; Xiao, Y.; Rao, E.M.; et al. Improvements in ecosystem services from investments in natural capital. Science 2016, 352, 1455–1459. [Google Scholar] [CrossRef] [PubMed]
  9. Liu, J.G.; Li, S.X.; Ouyang, Z.Y.; Tam, C.; Chen, X.D. Ecological and socioeconomic effects of China’s policy for ecosystem services. Proc. Natl. Acad. Sci. USA 2008, 105, 9477–9482. [Google Scholar] [CrossRef] [PubMed]
  10. Zheng, H.; Robinson, B.E.; Liang, Y.C.; Polasky, S.; Ma, D.C.; Wang, F.C.; Ruckelshaus, M.; Ouyang, Z.Y.; Daily, G.C. Benefits, costs, and livelihood implications of a regional payment for ecosystem service program. Proc. Natl. Acad. Sci. USA 2013, 110, 16681–16686. [Google Scholar] [CrossRef] [PubMed] [Green Version]
  11. Potter, C.; Klooster, S.; Myneni, R.; Genovese, V.; Tan, P.N.; Kumar, V. Continental scale comparisons of terrestrial carbon sinks estimated from satellite data and ecosystem modeling 1982–1998. Glob. Planet. Chang. 2003, 39, 201–213. [Google Scholar] [CrossRef]
  12. Fu, B.J.; Liu, Y.; Lü, Y.H.; He, C.S.; Zeng, Y.; Wu, B.F. Assessing the soil erosion control service of ecosystems change in the Loess Plateau of China. Ecol. Complex. 2011, 8, 284–293. [Google Scholar] [CrossRef]
  13. Xiao, Y.; Ouyang, Z.Y.; Xu, W.H.; Xiao, Y.; Zheng, H.; Xian, C.F. Optimizing hotspot areas for ecological planning and management based on biodiversity and ecosystem services. Chin. Geogr. Sci. 2016, 26, 256–269. [Google Scholar] [CrossRef] [Green Version]
  14. Nelson, E.; Mendoza, G.; Regetz, J.; Polasky, S.; Tallis, H.; Cameron, D.R.; Chan, K.M.A.; Daily, G.C.; Goldstein, J.H.; Kareiva, P.; et al. Modeling multiple ecosystem services, biodiversity conservation, commodity production, and tradeoffs at landscape scales. Front. Ecol. Environ. 2009, 7, 4–11. [Google Scholar] [CrossRef] [Green Version]
  15. Lawler, J.J.; Lewis, D.J.; Nelson, E.; Plantinga, A.J.; Polasky, S.; Withey, J.C.; Helmers, D.P.; Martinuzzi, S.; Pennington, D.; Radeloff, V.C. Projected land-use change impacts on ecosystem services in the United States. Proc. Natl. Acad. Sci. USA 2014, 111, 7492–7497. [Google Scholar] [CrossRef] [PubMed] [Green Version]
  16. Hunter, L.M.; Manuel, D.J.G.G.; Stevenson, M.; Karish, K.S.; Toth, R.; Edwards, T.C., Jr.; Lilieholm, R.J.; Cablk, M. Population and land use change in the California Mojave: Natural habitat implications of alternative futures. Popul. Res. Policy Rev. 2003, 22, 373–397. [Google Scholar] [CrossRef]
  17. Yuan, F.F.; Wang, Z.H. Development Paths of Low-Carbon Economics in Chongqing under Background of Climate Change. Policy Manag. 2010, 13, 26–35. (In Chinese) [Google Scholar]
  18. Xiao, Y.; Xiao, Q.; Ouyang, Z.; Qin, M. Assessing changes in water flow regulation in Chongqing region, China. Environ. Monit. Assess. 2015, 187, 1–13. [Google Scholar] [CrossRef] [PubMed]
  19. Nilsson, C.; Reidy, C.A.; Dynesius, M.; Revenga, C. Fragmentation and flow regulation of the world’s large river systems. Science 2005, 308, 405–408. [Google Scholar] [CrossRef] [PubMed]
  20. Yang, S.L.; Gao, A.; Hotz, H.J.; Zhu, J.; Dai, S.B.; Li, P. Trends in annual discharge from the Yangtze River to the sea (1865–2004). Hydrol. Sci. J. 2005, 50, 825–836. [Google Scholar] [CrossRef]
  21. Luo, T.X. Patterns of Net Primary Productivity for Chinese Major Forest Types and Its Mathematical Models. Available online: https://www.dissertationtopic.net/doc/1605787 (accessed on 18 December 2018).
  22. Ni, J. Estimating net primary productivity of grasslands from field biomass measurements in temperate northern China. Plant. Ecol. 2004, 174, 217–234. [Google Scholar] [CrossRef]
  23. Xiao, Y.; Xiao, Q. Identifying key areas of ecosystem services potential to improve ecological management in Chongqing City, southwest China. Environ. Monit. Assess. 2018, 190, 258. [Google Scholar] [CrossRef]
  24. Estoque, R.C.; Murayama, Y.J. Examining the potential impact of land use/cover changes on the ecosystem services of Baguio city, the Philippines: A scenario-based analysis. Appl. Geogr. 2012, 35, 316–326. [Google Scholar] [CrossRef]
  25. Pontius, R.G.; Cornell, J.D.; Hall, C.A.S. Modeling the spatial pattern of land-use change with GEOMOD2: application and validation for Costa Rica. Agric. Ecosyst. Environ. 2001, 85, 191–203. [Google Scholar] [CrossRef] [Green Version]
  26. Pontius, R.G.; Chen, H. GEOMOD Modelling. IDRISI 15: The Andes Edition; Clark University: Worcester, MA, USA, 2006. [Google Scholar]
  27. Zhang, Z.M.; Xu, W.H.; Zhou, W.Q.; Zhang, L.; Xiao, Y.; Ou, X.K.; Ouyang, Z.Y. Integrating remote sensing with GIS-based multi-criteria evaluation approach for karst rocky desertification assessment in Southwest of China. IOP Conf. Ser. Earth Environ. Sci. 2014, 18, 012038. [Google Scholar] [CrossRef]
  28. Paudel, S.; Yuan, F. Assessing landscape changes and dynamics using patch analysis and GIS modeling. Int. J. Appl. Earth Obs. 2012, 16, 66–76. [Google Scholar] [CrossRef]
  29. DeFries, R.S.; Foley, J.A.; Asner, G.P. Land-use choices: Balancing human needs and ecosystem function. Front. Ecol. Environ. 2004, 2, 249–257. [Google Scholar] [CrossRef]
  30. Wischmeier, W.H.; Smith, D.D. Predicting Rainfall Erosion Losses—A Guide to Conservation Planning; Agriculture Handbooks: Washington, DC, USA, 1978. [Google Scholar]
  31. Lufafa, A.; Tenywa, M.M.; Isabirye, M.; Majaliwa, M.J.G.; Woomer, P.L. Prediction of soil erosion in a Lake Victoria basin catchment using a GIS-based Universal Soil Loss model. Agric. Syst. 2003, 76, 883–894. [Google Scholar] [CrossRef]
  32. Zhang, K.L.; Shu, A.P.; Xu, X.L.; Yang, Q.K.; Yu, B. Soil erodibility and its estimation for agricultural soils in China. J. Arid. Environ. 2008, 72, 1002–1011. [Google Scholar] [CrossRef] [Green Version]
  33. Hickey, R. Slope angle and slope length solutions for GIS. Cartography 2000, 29, 1–8. [Google Scholar] [CrossRef]
  34. Van Remortel, R.D.; Maichle, R.W.; Hickey, R.J. Computing the LS factor for the Revised Universal Soil Loss Equation through array-based slope processing of digital elevation data using a C++ executable. Comput. Geosci. UK 2004, 30, 1043–1053. [Google Scholar] [CrossRef]
  35. Sedjo, R.; Sohngen, B. Carbon Sequestration in Forests and Soils. Annu. Rev. Resour. Econ. 2012, 4, 127–144. [Google Scholar] [CrossRef]
  36. Woodwell, G.M.; Whitaker, R.H.; Refiners, W.A.; Likens, G.E.; Delwich, C.C.; Botkin, D.B. Biota and the world carbon budget. Science 1978, 199, 141–146. [Google Scholar] [CrossRef]
  37. Bond-Lamberty, B.; Wang, C.K.; Gower, S.T. A global relationship between the heterotrophic and autotrophic components of soil respiration. Glob. Chang. Biol. 2004, 10, 1756–1766. [Google Scholar] [CrossRef]
  38. Potter, C.S.; Randerson, J.T.; Field, C.B.; Matson, P.A.; Vitousek, P.M.; Mooney, H.A.; Klooster, S. Terrestrial ecosystem production: A processmodel based on global satellite and surface data. Glob. Biogeochem. Cycles 1993, 7, 811–841. [Google Scholar] [CrossRef]
  39. Monteith, J.L. Solar radiation and productivity in tropical ecosystems. J. Appl. Ecol. 1972, 9, 747–766. [Google Scholar] [CrossRef]
  40. Chen, H.; Pontius, R.G. Diagnostic tools to evaluate a spatial land change projection along a gradient of an explanatory variable. Landsc. Ecol. 2010, 25, 1319–1331. [Google Scholar] [CrossRef]
  41. Zhang, Q.F.; Lou, Z.P. The environmental changes and mitigation actions in the Three Gorges Reservoir region, China. Environ. Sci. Policy 2011, 14, 1132–1138. [Google Scholar] [CrossRef]
  42. Xiong, Q.L.; Xiao, Y.; Ouyang, Z.Y.; Pan, K.W.; Zhang, L.; He, X.J.; Zheng, H.; Sun, X.M.; Wu, X.G.; Tariq, A.; et al. Bright side? The impacts of Three Gorges Reservoir on local ecological service of soil conservation in southwestern China. Environ. Earth Sci. 2017, 76, 323. [Google Scholar] [CrossRef]
  43. Xu, X.B.; Tan, Y.; Yang, G.S.; Li, H.P.; Su, W.Z. Impacts of China’s Three Gorges Dam Project on net primary productivity in the reservoir area. Sci. Total Environ. 2011, 409, 4656–4662. [Google Scholar] [CrossRef]
  44. Shi, Z.H.; Ai, L.; Fang, N.F.; Zhu, H.D. Modeling the impacts of integrated small watershed management on soil erosion and sediment delivery: A case study in the Three Gorges Area, China. J. Hydrol. 2012, 438–439, 156–167. [Google Scholar] [CrossRef]
Figure 1. The location of Chongqing municipality in China.
Sustainability 11 00003 g001
Figure 2. Predicted LULC changes from 2010 to 2050 under each scenario.
Sustainability 11 00003 g002
Figure 3. Spatial changes of ES provision from 2010 to 2050.
Sustainability 11 00003 g003
Figure 4. Scatter plot of ES changes with the distance to Three Gorges Dam. The gray line (scenario 1), red dashed line (scenario 2), red line (scenario 3) are the linear trend. ** Significant at 1% level.
Sustainability 11 00003 g004
Table 1. Validation variables for GEOMOD accuracy assessment.
Validation VariableDefinitionValue
N(n)The agreement due to chance0.33
N(m), H(m)The agreement between the reference map and one modified comparison map.0.55
M(m)M(m) is the proportion of grid cells classified correctly, which is the most commonly used measure of agreement between maps.0.93
K(m), P(m)The agreement between the reference map and a modified comparison map0.99
P(p)Perfect agreement, perfect information of both quantity and location1.00
KnoChange-corrected overall agreement0.89
KlocationThe extent to which the two maps agree in terms of location of each category0.86
KstandardThe extent to which the two maps agree in terms of quantity of each category0.85
Table 2. Validation results for ecosystem service accuracy assessment.
Validation Typer Valuep Valuen
Soil erosion0.816 **0.00035
Net primary productivity0.717 **0.00054
Notes: ** Significant at 1% level.
Table 3. Areas and proportions of LULC type in 2000, 2010 and 2050.
LULC20102050 Scenario 12050 Scenario 22050 Scenario 3
Km2%Km2%Km2%Km2%
Forests32,886.7539.8439,956.0950.1239,957.7750.1239,957.7750.12
Shrub11,152.8413.519636.3712.0910,612.8713.3110,538.6513.22
Grassland5599.996.784995.296.275154.536.475127.966.43
Open Water1401.821.701401.821.761401.821.761401.821.76
Cropland29,833.9436.1422,050.0127.6620,911.8526.2321,012.6226.36
<25°27,545.9933.3721,338.9226.7720,162.6925.2920,164.3825.29
>25°2287.952.77711.090.89749.160.94848.241.06
Built-up1668.752.021668.752.091668.752.091668.752.09
Barren land11.290.0111.290.0111.290.0111.290.01
Notes: 25° is slope threshold.
Table 4. Ecosystem services in 2000, 2010, and 2050.
2010 Baseline2050 Scenario 12050 Scenario 22050 Scenario 3
StatusChangeStatusChangeStatusChangeStatusChange
Soil erosion (108 t)7.83 5.86−1.975.66−2.175.55−2.28
(−25.16)(−27.71)(−29.12)
Carbon sequestration (106 t C)6.80 8.651.858.781.988.771.97
(27.21) (29.11)(29.00)
Note: numbers in the brackets are percentage change (%).

