Article

Optimal Joint Production and Emissions Reduction Strategies Considering Consumers’ Environmental Preferences: A Manufacturer’s Perspective

1
School of Economics and Management, Beijing Jiaotong University, Beijing 100044, China
2
Innovative Transportation Research Institute, Texas Southern University, Houston, TX 77004, USA
3
School of Mechanical Engineering, Purdue University, West Lafayette, IN 47907-2088, USA
4
Environmental and Ecological Engineering, Purdue University, West Lafayette, IN 47907-2088, USA
*
Author to whom correspondence should be addressed.
Sustainability 2019, 11(2), 474; https://0-doi-org.brum.beds.ac.uk/10.3390/su11020474
Submission received: 11 November 2018 / Revised: 10 January 2019 / Accepted: 14 January 2019 / Published: 17 January 2019

Abstract

:
Carbon cap-and-trade mechanism is a government-mandated, market-based scheme to reduce emissions, which has a significant effect on manufacturers’ operation decisions. Based on the cap-and-trade mechanism, this paper studies the joint production and emission reduction problem of a manufacturer. The manufacturer faces emissions-sensitive demand impacted by consumers’ environmental preferences (CEP). An extended newsvendor model is used to find the optimal production quantity and emissions reduction quantity. We explore the impacts of market price of carbon credits, emission reduction investment coefficient and CEP on the optimal strategies. Numerical examples are provided to illustrate the theoretical results and orthogonal experimental design technique was applied to find robust system parameters. It is concluded that among all parameters, emissions cap has the greater impact on the expected profit, which is followed by than the market price of carbon credits. This means that the government plays a major role in economic development. The total carbon emissions are mainly affected by the carbon trading price and the product’s sale price, which indicates the carbon trading market and product market play a larger role in controlling environmental benefits. Several valuable managerial insights on helping governments and industries understand how market conditions change and make better long-term decisions are further concluded.

1. Introduction

Worldwide industrial activities account for about one third of total greenhouse gasses (GHGs) emissions. Greenhouse gasses such as carbon dioxide, nitrous oxide and methane are the leading cause of global warming and climate change [1]. With the rapid growth of industry, there is a critical need to reduce GHGs emitted by manufacturers. Among all the GHGs, carbon dioxide accounts for 65% of the total emissions [2]. Since the implementation of the Kyoto Protocol in 1997 and the Paris Climate Agreement in 2015, China, Korea and several European countries have enacted a variety of carbon policies and legislation to reduce carbon emissions [3]. For example, in 2005, Europe established the European Union Emissions Trading Scheme (EU ETS), which is the world’s most profound carbon trading mechanism. Based on carbon trading mechanisms, governments control carbon emissions by allocating free carbon quotas (called emissions cap) to enterprises [4]. If a manufacturer emits more carbon than the emissions cap, it has to buy quotas to emit extra carbon; if a manufacturer emits less carbon than the emissions cap, it can sell surplus carbon credits to gain extra revenue [5]. In China, seven carbon trading centers placed in Beijing, Shanghai, Guangdong and four other cities have implemented a carbon emissions trading mechanism [6]. By December 2017, these trading centers have completed 0.47 billion tons of carbon credits transaction in total and the turnover was more than 0.014 billion USD. It shows that the carbon trading mechanism could affect manufacturers’ profits [3,7,8].
In recent decades, people have become more concerned about environmental issues and been willing to buy low-carbon products [9,10]. The AliResearch Institution, which is a non-profit agency in China, estimated that the total number of consumers that prefer low-carbon products increased by 14 times in the past four years and reached 65 million in 2015 [11]. Thus, affected by the consumers’ environmental preferences (CEP), many manufacturers such as P&G and HP have motivations to invest in low-carbon technologies to reduce carbon emissions [12]. Then CEP may affect manufacturer’s profit and total carbon missions. As decision makers, under the cap-an-trade mechanism, all manufacturers need to re-determine their operational decisions, that is, the optimal production quantity and the emissions reduction per unit of product, to maximize their profits.
Based on the scenario mentioned above, we want to answer the following questions:
  • How does the manufacturer who sells a seasonal product with random demand determine the optimal production and carbon emissions reduction per unit of product with CEP under cap-and-trade mechanism?
  • What effects do the demand parameters, cost parameters and carbon emissions parameters exert on the optimal strategies, total carbon emissions and expected profit of the manufacturer?
  • What management insights should be given to manufacturers?
To solve the first question, the classical newsvendor framework is extended by dividing the uncertainty demand into three parts: the price-related demand, the carbon emissions reduction-related demand and the random perturbation term. To maximize a manufacturer’s profits, this model is applied to derive the optimal production quantity and emissions reduction per unit of product considering the cap-and-trade mechanism and CEP. Numerical examples are provided to develop the robustness of demand, costs and regulation parameters via the orthogonal experimental design technique and investigate the impacts of these parameters on a manufacturer’s profit and total carbon emissions.

2. Literature Review

Motivated by such practical opportunities and challenges, environment protection has been emphasized in operations management. Considering CEP and the cap-and-trade mechanism, this paper focuses on finding the optimal production quality and carbon emissions reduction for a manufacturer who meets the uncertain demand. The literatures relating to this paper are shown as below.

2.1. Studies on the Operations Decisions Considering Carbon Emissions

Under carbon emissions regulations, the economic order quantity (EOQ) model was widely used to drive the optimal order quantity [13]. He et al. [14] the EOQ model to find the optimal lot-size and minimal emissions under cap-and-trade regulation. They investigated the impacts of production and regulation on the optimal. Bonney et al. utilized the extended EOQ model to study the carbon emissions and designed an inventory system [15]. Since the demand are constantly changing in the real world and, several scholars used stochastic models to derive optimal operational decisions for manufacturers. Chen and Monahan used a stochastic model to derive the optimal policies of production planning and inventory control policies under pollution control approaches in Reference [16]. Zhang et al. developed a dynamic model to analyze the optimal production strategy for a system with stochastic demand and emission permits in Reference [17]. Zhang and Xu proposed a multi-product production plan to meet stochastic demand under cap-and-trade mechanism [18]. The newsvendor model, which can be used to solve the order quantity optimization problem with stochastic demand, was applied in many studies. Song et al. investigated the classical single-period (newsvendor) problem under carbon emissions policies and found a manufacturer’s optimal production quantity and corresponding expected profit [19]. Xu et al. analyzed a newsvendor problem with partial demand information under two kinds of carbon emission regulations, in which only the mean and variance of the demand distribution are known. In their research, two distributional robust models are formulated to determine the optimal order quantities [20]. Du et al. [21] took carbon footprint and CEP into account in the cap-and-trade system, they got the optimization production decision and found that firms could be motivated to reduce carbon emissions by CEP. Although they considered the behavioral factor of consumers who were willing to buy low-carbon products, they assumed that reverse demand function did not consider random factors. The models mentioned above assumed that the uncertain demand is solely affected by the sale price. They only derived optimal production/order quantities. However, incorporating market parameters such as demand and selling price into the model can provide an excellent vehicle for examining how operational problems interact with decision making [22]. In our study, manufacturers respond to CEP by introducing low carbon products to meet the demand. It is significant to jointly optimize the production and pricing.

2.2. Joint Pricing and Ordering Decisions in Extended Newsvendor Model

Some newsvendor models were extended to solve joint production and pricing problem. Whitin was the first to set selling price and stocking quantity simultaneously by using newsvendor model [23]. Mills, Karlin and Carr are early efforts that investigated the impacts of different demand processes on the seller’s pricing and ordering decisions [24,25]. In their newsvendor models, the demand is generally divided into two parts, one is the price-related demand and the other is the random perturbation term that may obey a certain distribution. Several other scholars such as [22,26,27,28] also made contributions to the literatures on the joint pricing and quantity newsvendor problem. Due to the increasing awareness of global warming and climate change, consumers’ willingness to buy low carbon products may also increase. The demand on low carbon products is expected to be affected by many factors. Therefore, the production quantity, the amount of carbon emissions, sale price of product and other operational variables should be considered by manufacturers.
Jiang and Chen [29] and Zhang et al. [30] derived the optimal production and carbon emissions for a newsvendor system with consideration of carbon emissions-sensitive random demand and CEP and discussed the impact of carbon emissions-sensitive demand on the manufacturer’s operation strategies, total carbon emissions and maximum expected profit. Different from their researches, we assume that manufacturers can trade carbon credits under cap-and-trade, which could also impact manufacturers’ decisions. The orthogonal experimental design (OED) is employed to make various reasonable combinations of demand parameters, cost parameters and carbon emissions parameters to capture the non-linear effects on total carbon emissions and expected profit. We compare some recent literatures related to this work in Table 1.

3. The Model and Analysis

3.1. Model Description

The manufacturer, which aims at reducing carbon emissions, produces q units of products at the unit cost c. The unit cost does not include the investment cost of carbon emissions reduction. Then the products are sold at the market price p, to meet the uncertain demand D. It is assumed that unsold products will be salvaged at a cost of cv. Since the investment in carbon emissions reduction has a non-decreasing marginal cost [31,32,33], we assume that the investment cost function is:
I = 1 2 h Δ e 2   ( h > 0 )
After investing in carbon emissions reduction technologies, the emissions per unit of product is reduced to e Δ e .
Consumers can buy substitute goods and they are willing to pay for the environmental products, that is, all consumers are homogeneous. The demand is jointly determined by the market sale price and the quantity of the product’s carbon emissions reduction, which can be defined using the following equation:
D = y ( Δ e ) + ε
where y ( Δ e ) = a p + t Δ e . a is the fixed potential market size. t > 0, it denotes the impact of emissions reduction on the demand, ε is a random factor with mean μ and variance σ. The probability density function and cumulative density function of ε is noted as f ( ) and F ( ) , respectively.
The firm gets an emission cap from the environmental authority. The cap is always the hardest challenge in the cap-and-trade system [21,34]. We assume that a certain emissions cap Cg is imposed by the environmental authority. At the carbon trading center, there is no carbon trading cost and there is no price gap between buy and sell. The market price of carbon credits is determined by the carbon market. The relationship between emissions cap and price of carbon credits is complicated.
In this model, the manufacturer has to determine the production quantity q and the emissions reduction per unit of product Δ e , to maximize its expected profit. All the notations are listed in Table 2.
Based on the demand and cost assumptions described above, the manufacturer’s expected profit can be computed by the equation below
π m = p E { min ( D , Q ) } c Q + c v E ( Q D ) + 1 2 h Δ e 2 p e [ ( e Δ e ) Q C g ] .
The expected profit includes the revenues from selling in the market, the production cost and the salvage value of the unsold products and the costs of investment in carbon emissions reduction. If the total carbon emissions are more than emissions cap, the last part in Equation (3) represents the carbon trading cost at the market, otherwise, it represents the income from selling the surplus carbon credits.
Let z = Q y ( Δ e ) , where y ( Δ e ) = a p + t Δ e . Then we can get Q = z + y ( Δ e ) , and ( Q D ) + = ( z ε ) + Equation (3) can be rewritten as follows:
π m = [ p c p e ( e Δ e ) ] [ z + y ( Δ e ) ] ( p c v ) E ( z ε ) + 1 2 h Δ e 2 + C g p e ,
where E ( z ε ) + = A z F ( u ) d u .

3.2. Optimal Solutions

In this section, we formulate the extended newsvendor model under cap-and-trade mechanism to derive the optimal solutions and analyze the impacts of the key parameters on the optimal solutions. All proofs are provided in the Appendix A.
Theorem 1.
There exists a unique optimal solution to the model. The optimal decision for the manufacturer is.
Δ e = p e ( a p e t + z ) + t ( p c ) h 2 t p e
Q = z + y ( Δ e )
where z = F 1 [ p c p e ( e Δ e ) p c v ] .
From Theorem 1, we first analyze the impacts of the key parameters, that is, h, c, e, t, pe, on the optimal emissions reduction per unit of product.
Proposition 1.
For any given z,
(i) 
The opftimal Δ e is non-increasing in h, c and e.
(ii) 
Δ e is non-decreasing in if e < h ( a p + z ) + 2 t 2 ( p c ) t h , and Δ e is non-increasing in p e if e > h ( a p + z ) + 2 t 2 ( p c ) t h .
(iii) 
Δ e is non-decreasing in t if e < 2 p e 2 ( a p + z ) + h ( p c ) h p e , and Δ e is non-increasing in t if e > 2 p e 2 ( a p + z ) + h ( p c ) h p e .
Proposition 1 shows that when the emissions reduction investment coefficient or initial carbon emission which depends on the normal market conditions [12] increases, the manufacturer should invest more to reduce carbon emissions to obtain high efficiency in emissions reduction. Furthermore, if the production cost increases, the manufacturer will pay more to produce products. Therefore, because the investment costs of carbon emissions increases, the manufacturer will gradually be reluctant to invest in reducing carbon emissions over time.
We can also conclude that when pe and t increase, the optimal emissions reduction per unit of product will not always increase. At low level of initial carbon emissions, the manufacturer has sufficient funds to reduce carbon emissions. In addition, if the market price of carbon credits is high or if consumers have strong willingness to pay more for the sustainable products, the manufacturer will have the motivation to reduce emissions. Then the emissions reduction per unit of product will increase. However, since the marginal investment cost in carbon emissions reduction will increase gradually, the optimal emissions reduction per unit of product will decrease even when both the market price of carbon credits and CEP are high. It indicates that the impact of market price of carbon credits and CEP on optimal carbon emissions reduction per unit of product is based on the normal market’s level of carbon emissions reduction.
Proposition 2.
For a given Δ e ,
(i) 
The optimal production Q is non-increasing in h.
(ii) 
The optimal production Q is non-decreasing in t.
(iii) 
The optimal production Q is non-decreasing in pe if 0 < e < 2 p e Q + 2 t ( p c ) h , and Q is non-increasing in pe if e > 2 p e Q + 2 t ( p c ) h .
Proposition 2 shows that if the carbon emissions reduction investment coefficient increases, the manufacturer should invest more to achieve the previous level of carbon emissions reductions. It means that with the increase of marginal investment costs in carbon emissions reduction, the manufacturer will not pay more for it. To follow carbon regulation and maintain the profit, the manufacturer will choose to reduce production quantity.
It can be concluded that the higher the CEP, the more sustainable products will be produced by the manufacturer. However, with the increase of marginal investment cost, it becomes more difficult to reduce emissions than before. Thus, it occurs that the more the manufacturer produces, the more the total carbon emissions emit even if the emission per unit of product decrease. To maximize profits under carbon constraints, all key parameters should be balanced by the manufacturer.
When pe increases, the optimal production quantity does not always increase. Under the premise of low initial carbon emissions, the manufacturer has a strong willingness to reduce carbon emissions when the market price of carbon credits is high. On the other hand, when the initial carbon emissions are at a high level, the optimal production quantity will decrease due to the increase of marginal investment cost.

4. Numerical Analysis

In this section, numerical analyses using the orthogonal experimental design are conducted to illustrate the theoretical results shown in previous sections. Software Minitab is used to design the orthogonal experiment.
The initial values of parameters used in this example are set as a = 100, t = 1, p = 4.64, c = 1.16, cv = 0.87, h = 10, e = 10, Cg = 500 and pe = 5.8. The demand is assumed to follow a normal distribution with the mean equals 200 and variance equals 0.1. The function of the total carbon emissions is shown as follows:
E = ( e Δ e ) Q = ( e Δ e ) [ z ( a p + t Δ e ) ] .
To test how the cap-and-trade mechanism and the demand information affect the expected profit and total carbon emissions, we use the robust parameter design technique proposed by Taguchi [35]. For a certain carbon emissions reduction technology, the initial emissions and the investment coefficient are determinate. The parameters under tested include cost parameters (p, c, cv), demand information parameters t and carbon emissions parameters (pe, Cg). The orthogonal experimental design (OED) was employed to make various reasonable combinations of process parameter levels to capture the non-linear effects on the optimal solutions. There are six parameters at five levels and 25 combinations in the Taguchi orthogonal array (L25 56).
Based on the methods proposed by Taguchi [35], we calculate the means of the expected profit and the total carbon emissions using the software Minitab with the options ”larger is better” and ”smaller is better,” respectively.. Each control parameter has five levels. The values for each level are shown in Table 3. Level 3 represents the initial values. Level 1, level 2, level 4 and level 5 represent −50%, −25%, +25% and +50% of the initial values of parameters, respectively, except for emissions reduction effectiveness parameter t, which is set as ±2.5x and ±5x of the initial values. From Appendix B, Table A1 shows the results of the experiment. The first column of Table A1 represents the number of simulation and the subsequent columns represent the process parameters. The rows represent simulations with the levels of each parameter.
From Table A1, we can see that Test No.6 and 11 has the same mean of total carbon emissions while the expected profit of test No.6 is more than that of test No.11. It shows that the expected profits of different combinations of parameter values may be different even the means of total carbon emissions are the same. It indicates that the optimal strategies of the manufacturer and the optimal combination of parameters can be obtained to maximize the expected profit at a certain level of total carbon emissions. Among all tests, Test 6 has the third largest profit and the minimum carbon emissions. Test 5 has the most profits but has more carbon emissions. It means that economic efficiency and environmental benefits are difficult to coordinate. Thus, in a given range of values for the parameters, the results of Test 6 can provide a good reference when manufacturers make decisions.
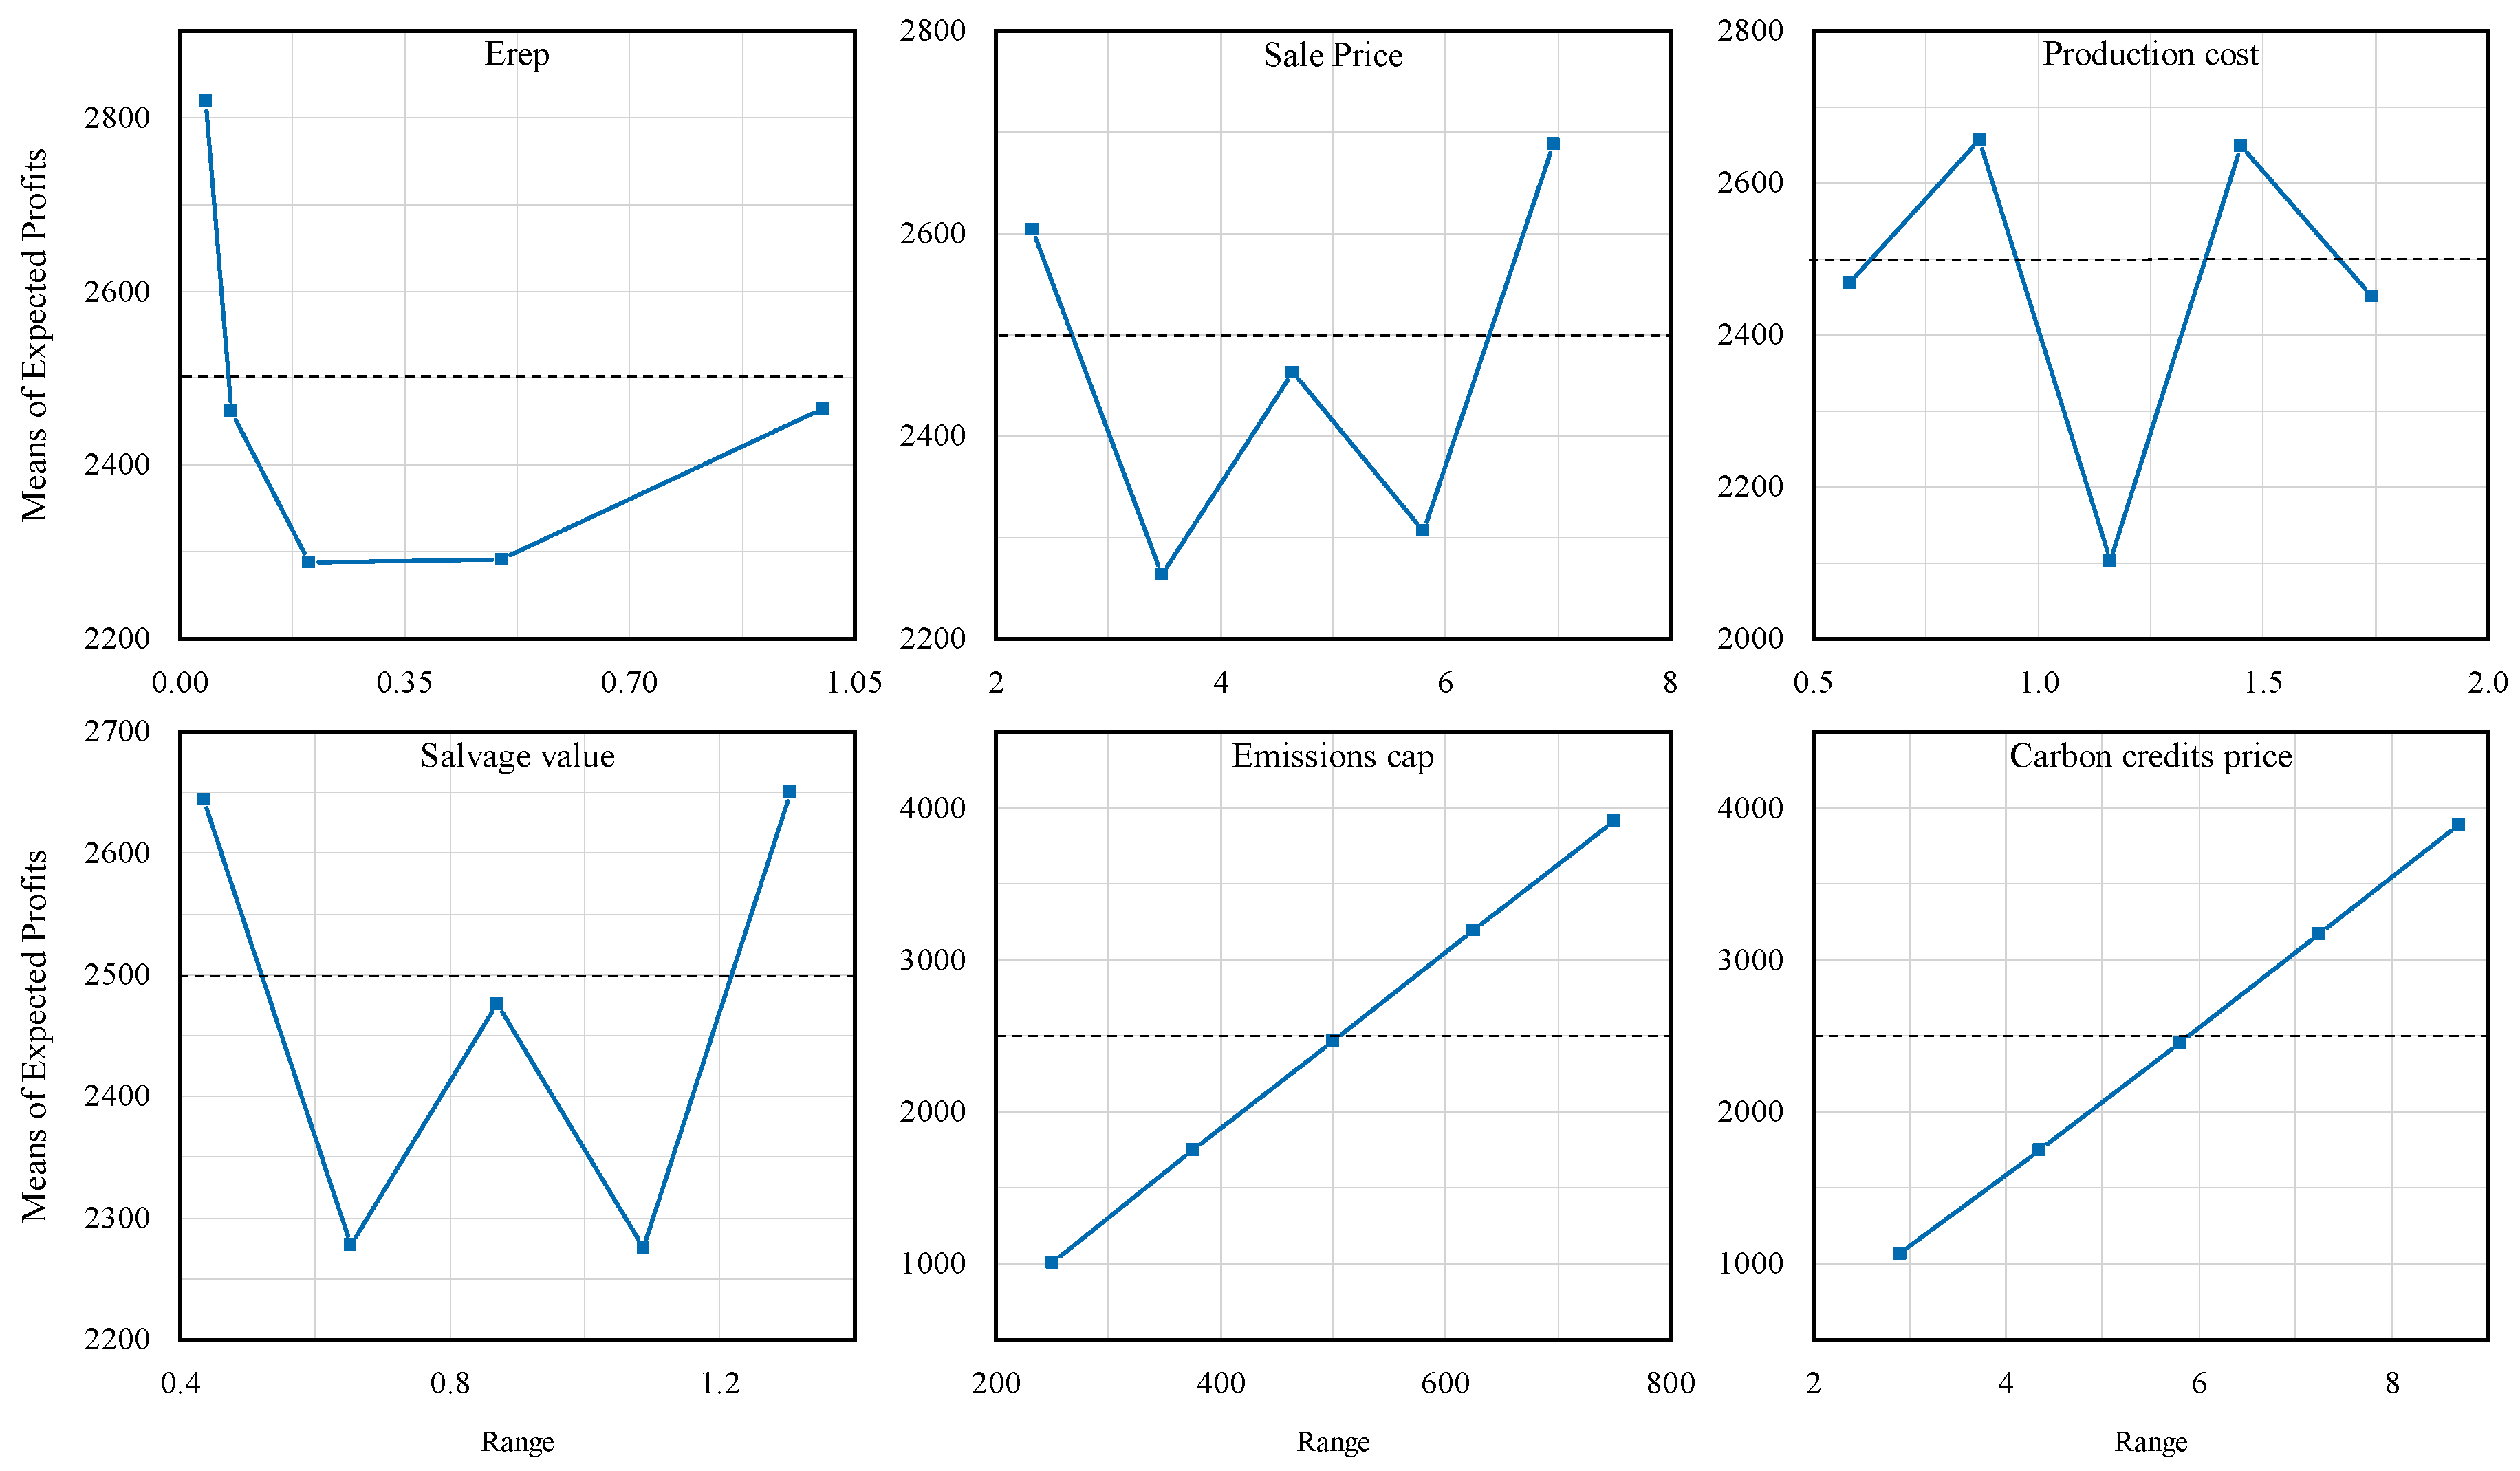
To obtain the optimal combination of parameter variations, the main effects plots for means of the expected profit and the means of total carbon emissions under cap-and-trade mechanism are shown in Figure 1. We can see that the optimal conditions for maximizing the expected profit are t at level 1, p at level 5, c at level 2, cv at level 5, Cg at level 4 and pe at level 5. Figure 1 also demonstrates that the expected profit is non-increasing in the emissions reduction effectiveness parameter. In general, when the consumers have strong willingness to pay more for sustainable products, manufacturers may produce more products to meet the low-carbon demand, which results in more emissions. Then manufacturers should invest in carbon emissions reduction or buy carbon credits from carbon trading market to follow the carbon regulations. However, it is more difficult to reduce carbon emissions because of the increasing marginal investment cost. Therefore, under strict carbon regulation, the expected profit of enterprises will decrease even if the emissions reduction effectiveness parameter increases.
The influence levels of parameters on the mean of expected profit are shown in the response Table 4, where Δ represents the difference between the maximum and minimum values in each column. This table shows that the carbon emissions parameters have larger effect on the expected profit than demand information and cost parameters. Among all parameters, emissions cap has the largest impact on the expected profit, which is followed by the parameters market price of carbon credits and production costs per unit of product parameter. The expected profit increases with the increasing of the former parameter’s value and decreases with the increasing of the latter two parameters’ values.
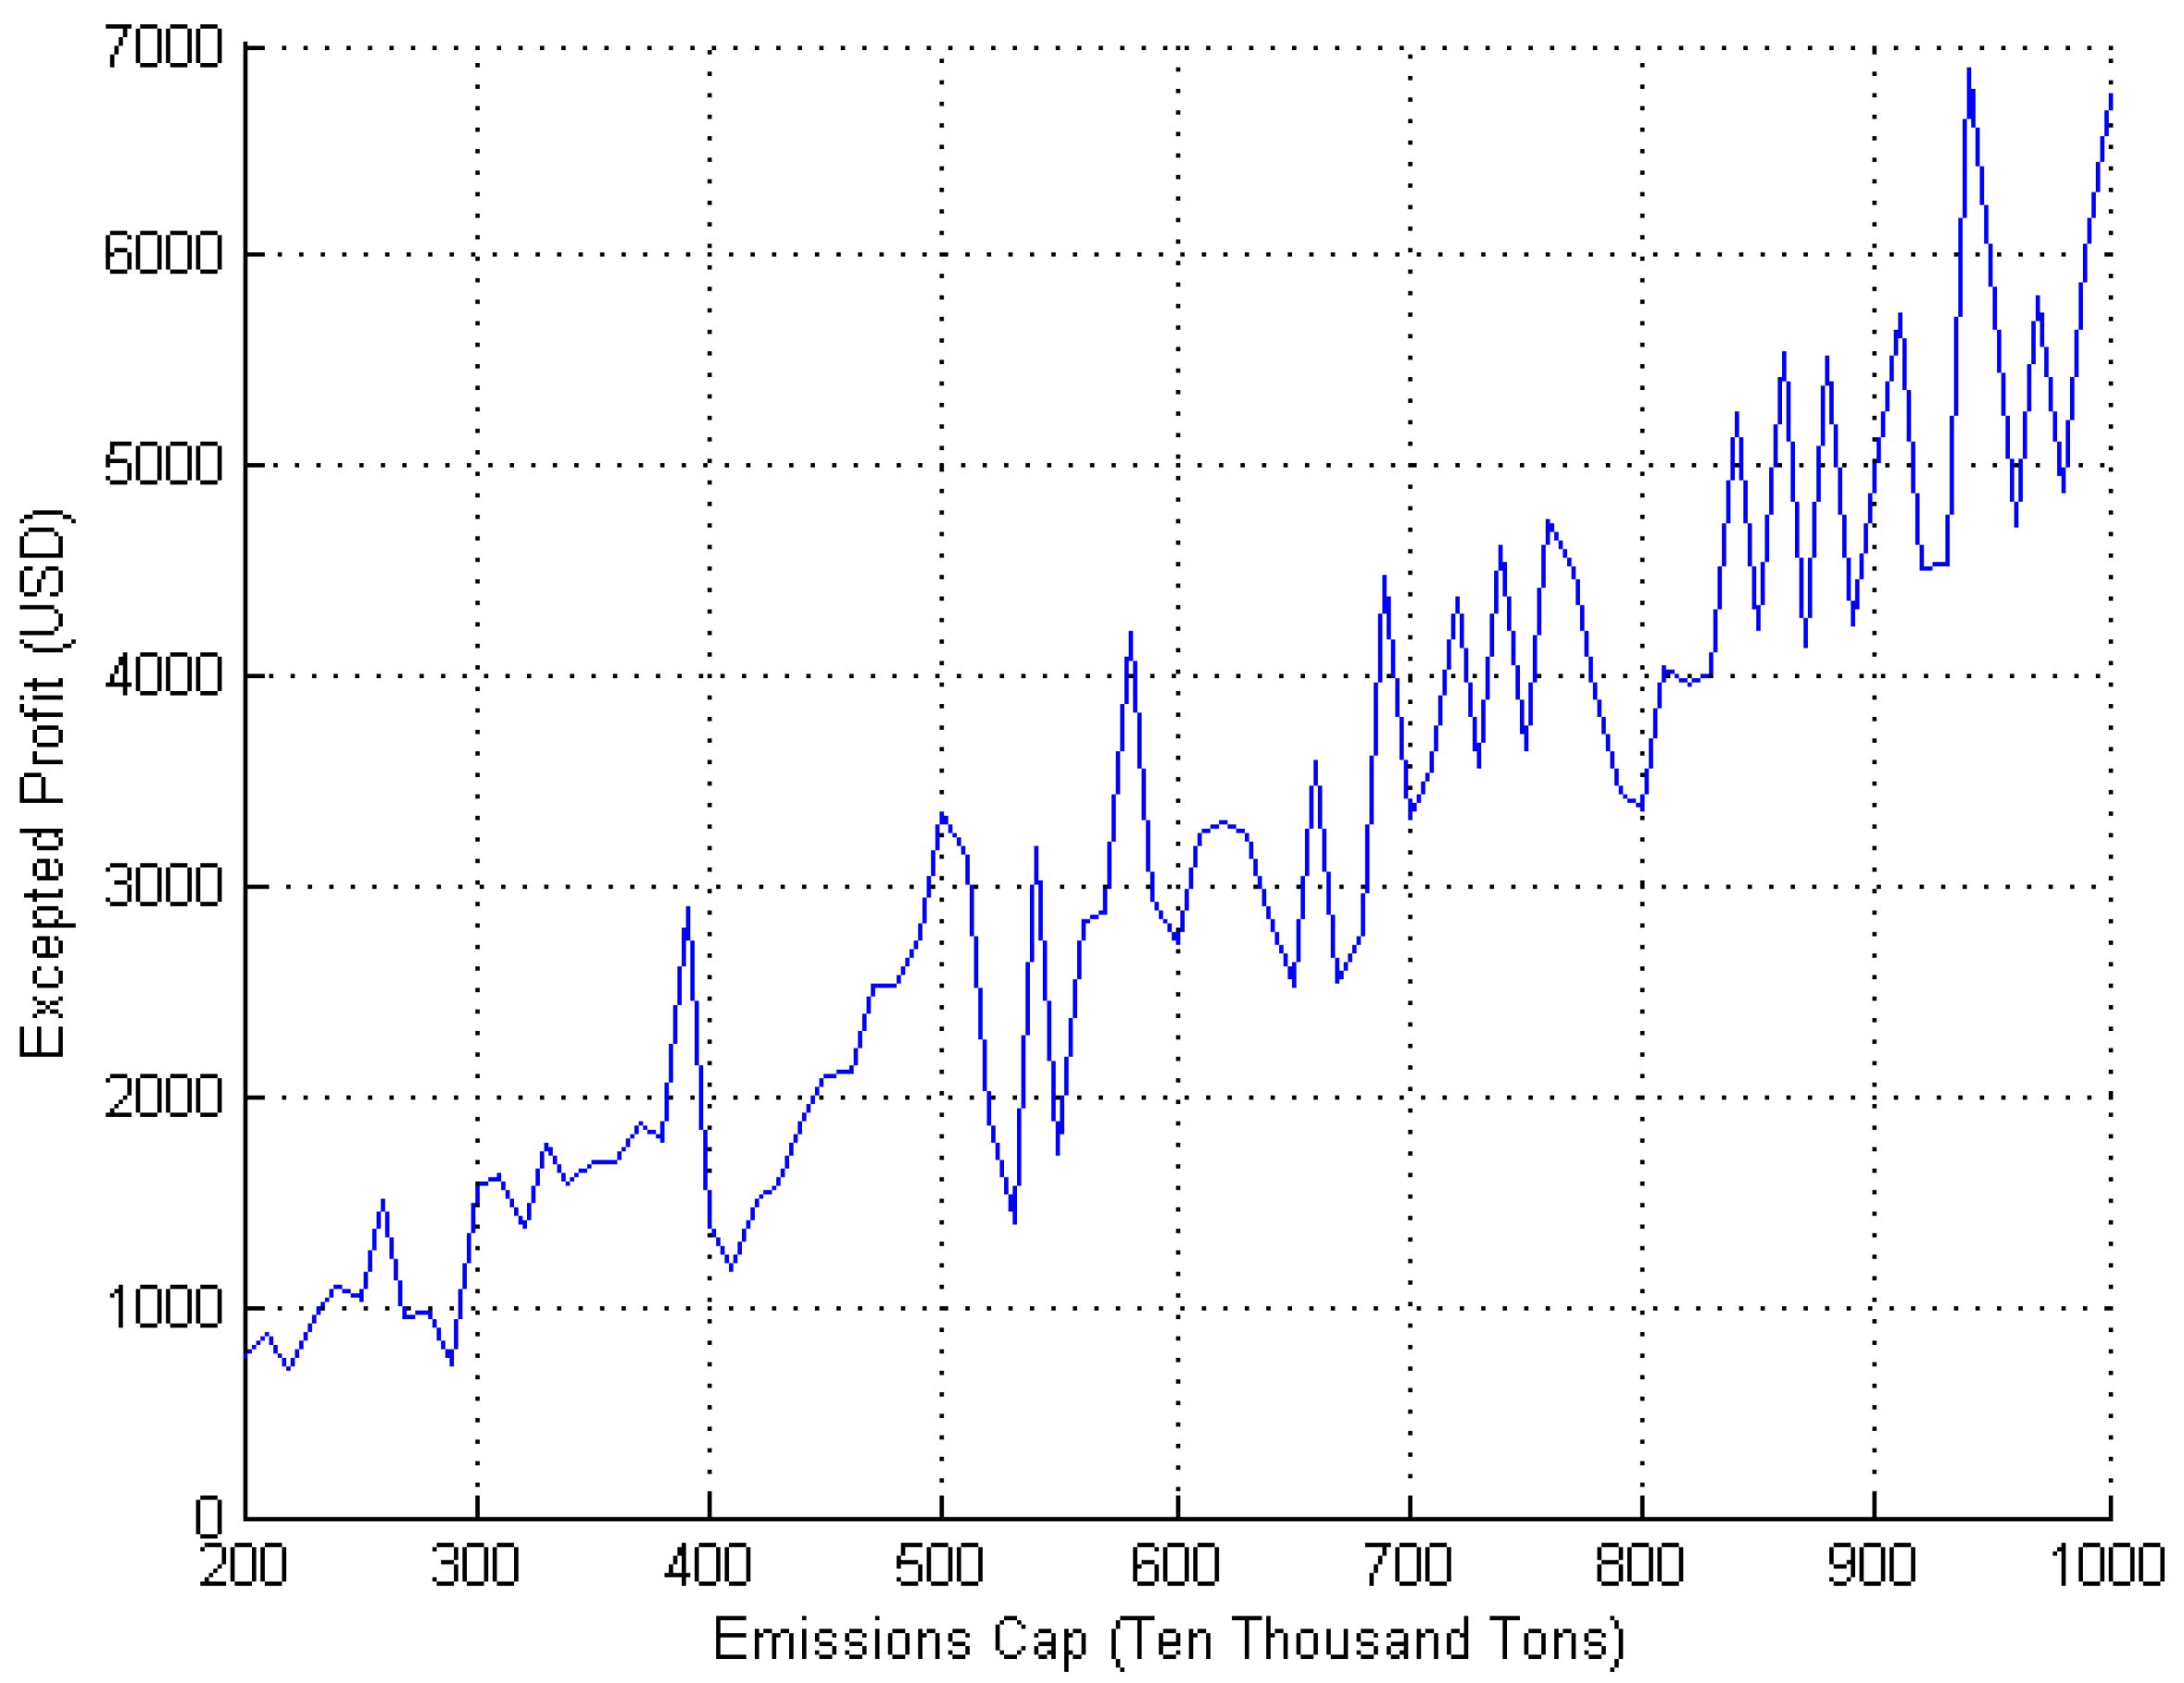
According to [36], the unit market price of carbon credits in Beijing’s Carbon Trading Center is 5.8 USD/ton. To observe the combined impacts of emissions cap and market price of carbon credits on the expected profit, we assume that each parameter pe can be modelled using a normal distribution with a mean of 5.8 and a standard deviation of 5 , that is, pe~N (5.8, 1). Cg is assumed to range from 200 to 1000. Figure 2 shows that when the market price of carbon credits fluctuates, the expected profit will increase if the emissions cap increases.
As analyzed above, carbon emissions cap, carbon trading market and CEP have the largest impact on the manufacturer’s expected profit. When the government allocate more free carbon credits or the market price of carbon credits is high, the manufacturer will have motivations to reduce carbon emissions and sell surplus carbon credits to gain extra revenue. The values of other parameters should be carefully dealt with to trade off the maximal expected profit and minimal carbon emissions.
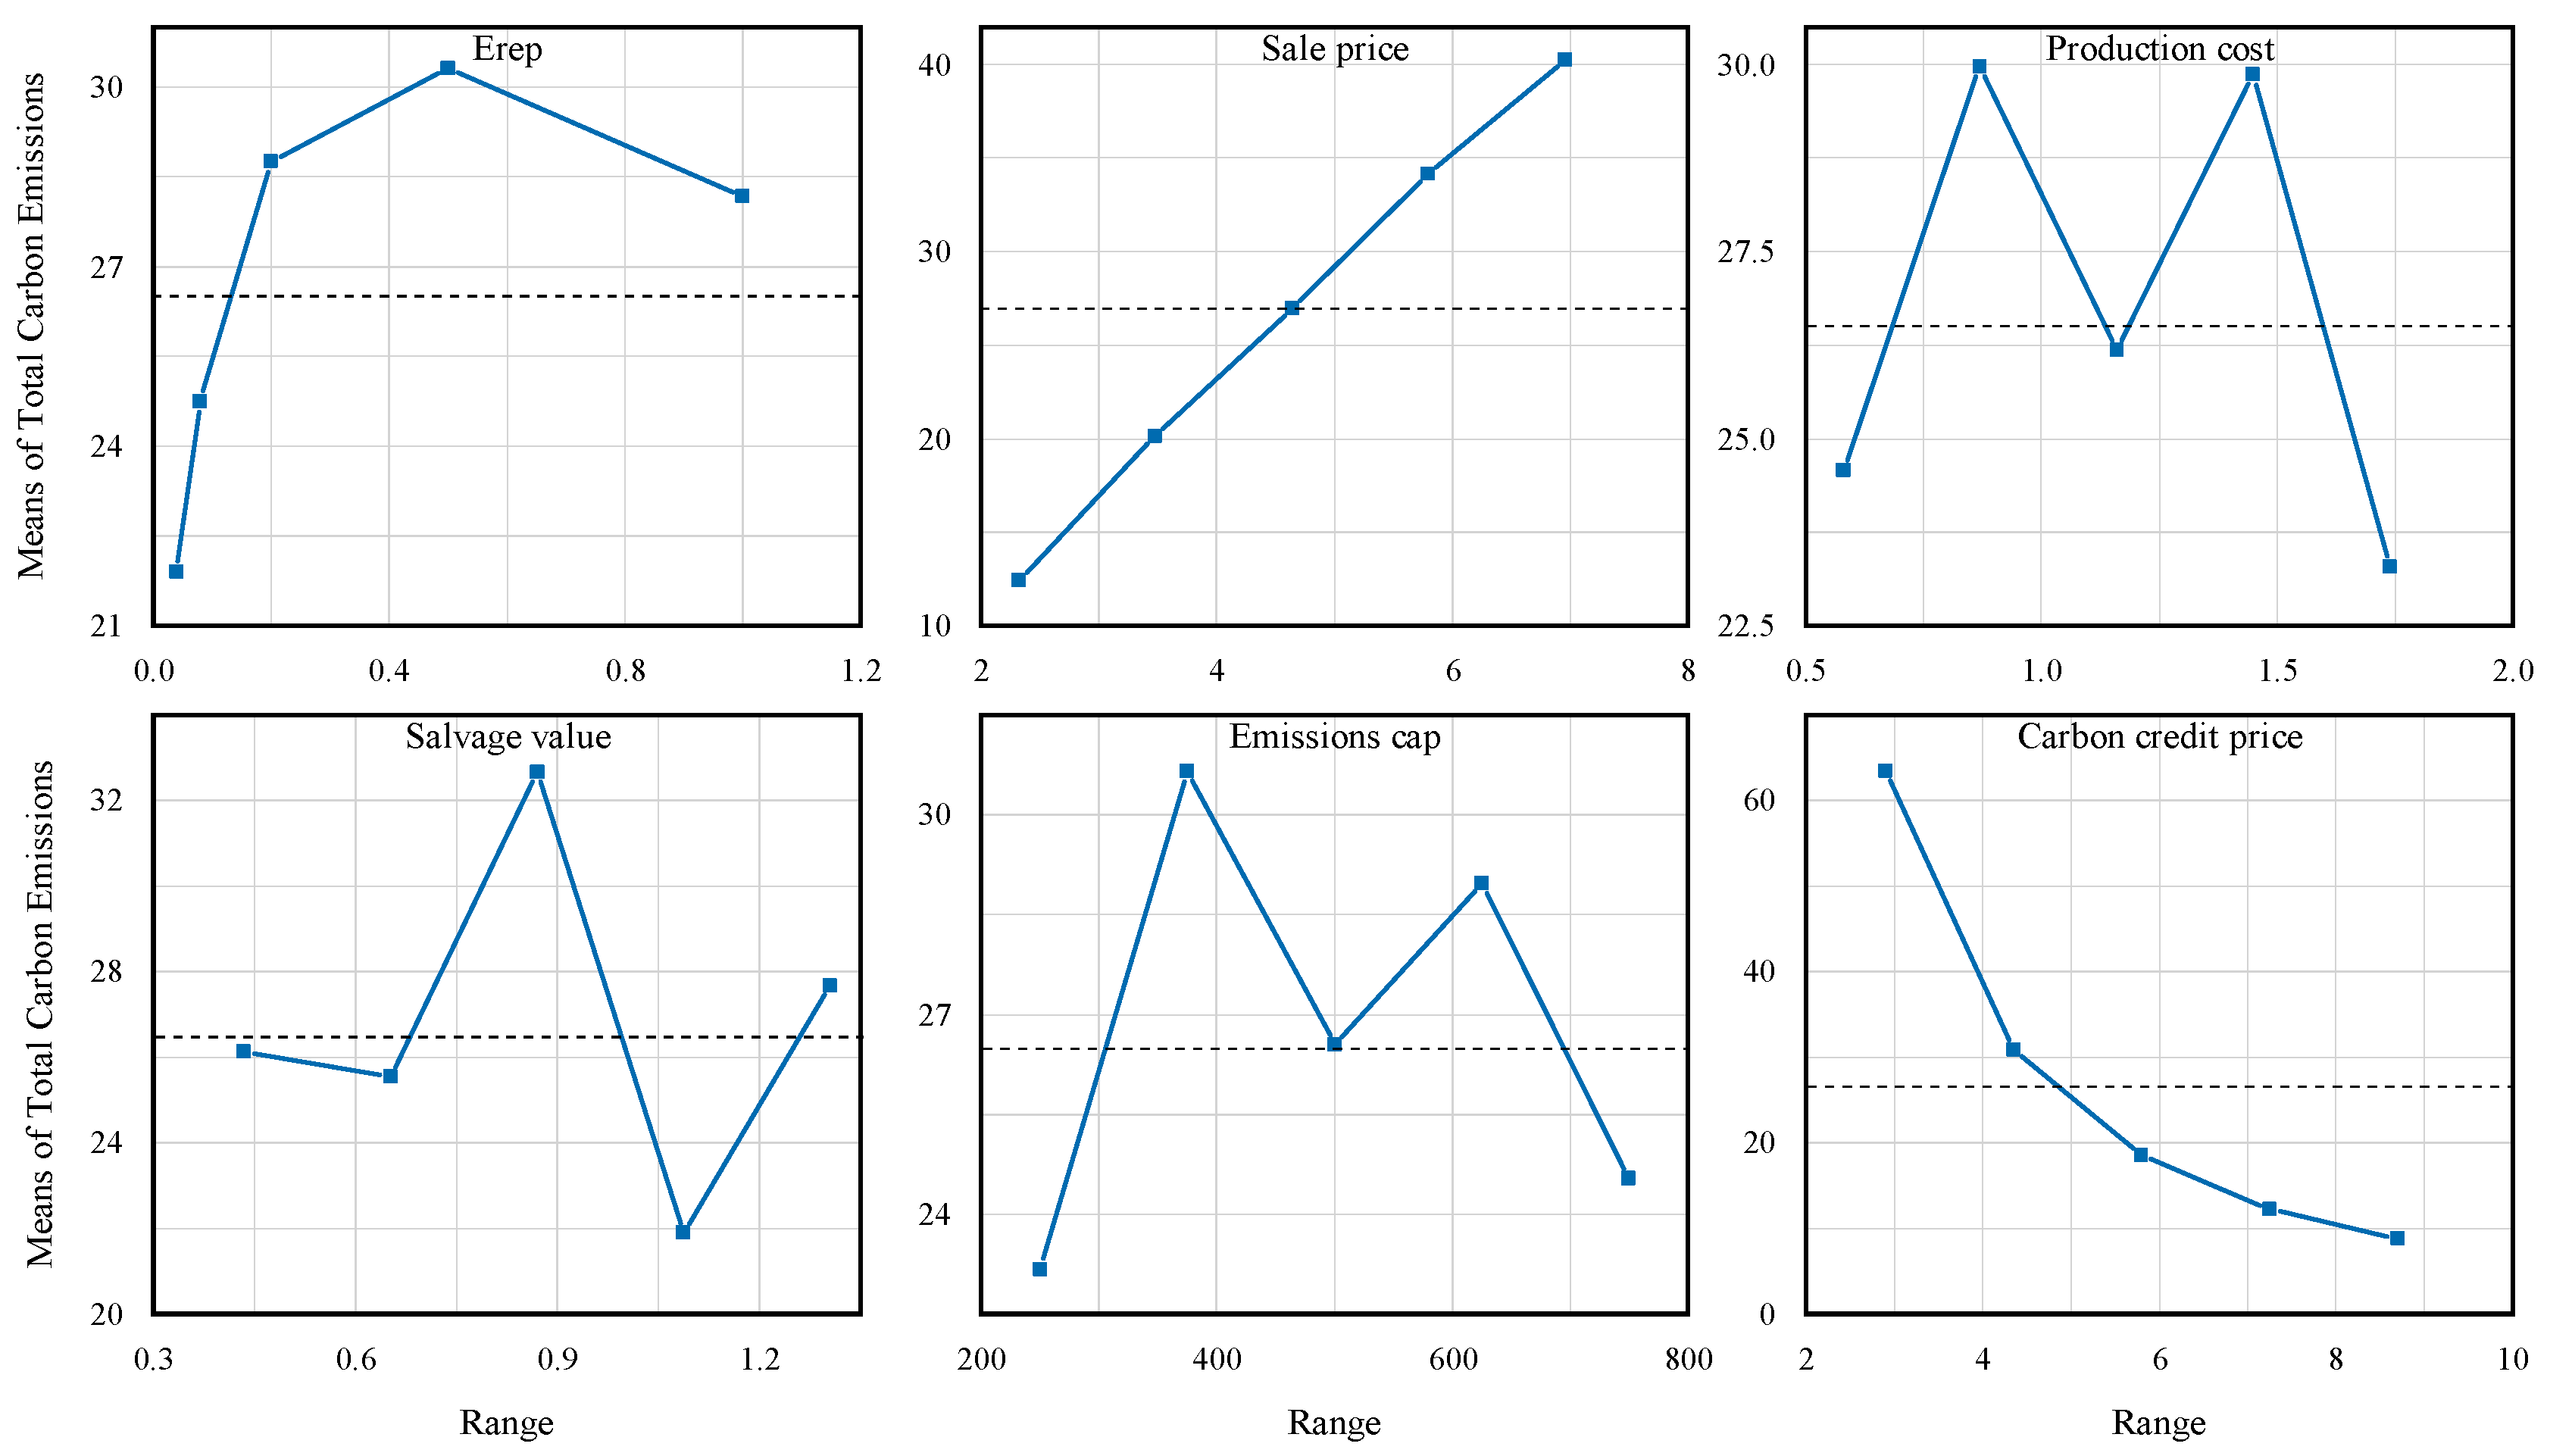
The main effects of all parameters on the mean of total carbon emissions and the optimal combinations of parameter variation can be observed in Figure 3. The optimal conditions for minimizing carbon emissions are t at level 1, p at level 1, c at level 5, cv at level 4, Cg at level 1, pe at level 5. It can be seen that the mean of total carbon emissions is non-increasing in the market price of carbon credits but is non-decreasing in the sale price per unit of product. When the emissions reduction effectiveness parameter increases, the mean of total carbon emissions also increases. Manufacturers will produce more products to meet the low-carbon demand. In this case, if manufacturers do not reduce carbon emissions, the government will take more strict carbon regulations on manufacturers with larger emissions.
The influence level of every parameter on the joint production and carbon emissions reduction newsvendor problem for means of total carbon emissions is presented in Table 5, where Δ represents the difference between the maximum and minimum values in each column. Among all parameters, the market price of carbon credits has strongest effect on the total carbon emissions. It is followed by the sale price per unit of product and the emissions reduction effectiveness parameter. From Table 5, we can see that the cost parameters have higher impact on the carbon emissions than the emissions cap.
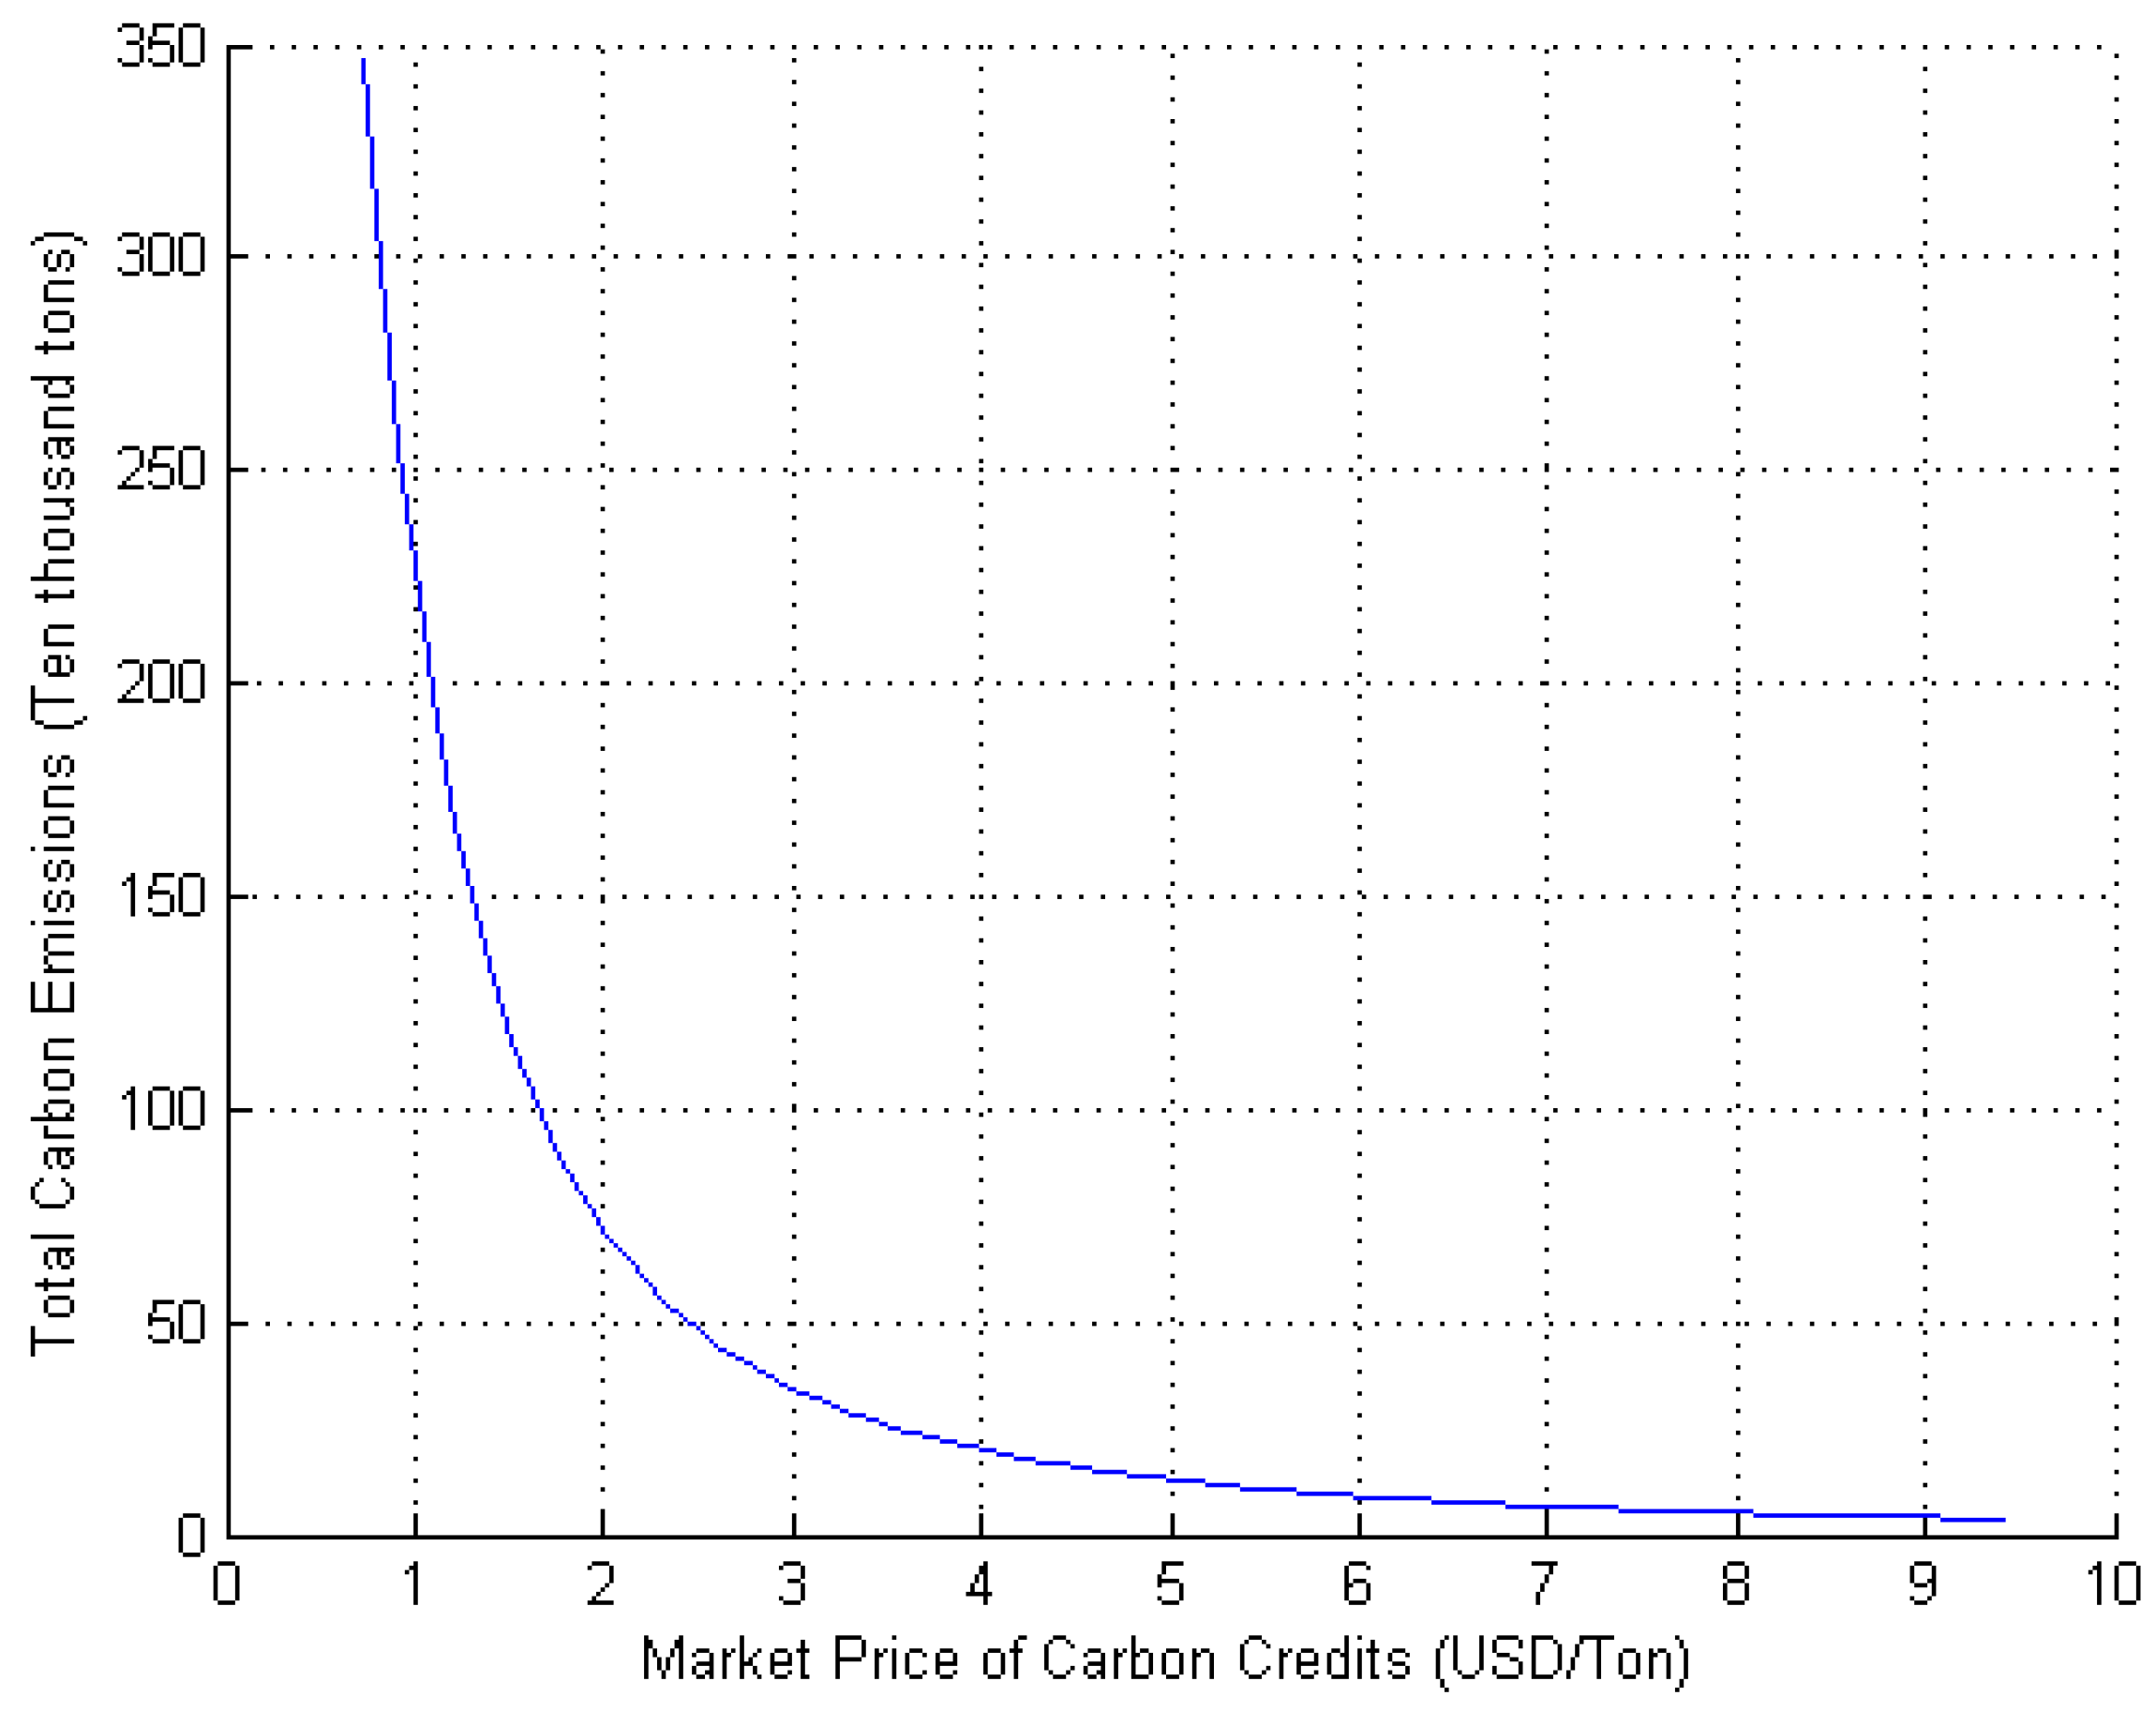
According to [36], the unit market price of carbon credits in Beijing’s Carbon Trading Center is 7.26 USD/ton. To study the relationship between market price of carbon credits and the carbon emissions in more detail, the market price of carbon credits is assumed to vary from 0.72 USD/ton to 9.42 USD/ton. Figure 4 shows that when the market price of carbon credits is less than 3 USD/ton, the carbon emissions will decrease at a high rate. When the market price of carbon credits is greater than 3 USD/ton, it is difficult for the manufacturer to reduce carbon emissions due to the technical limitations and the increase of marginal investment costs. This directly results in low efficiency of carbon emissions reduction. Therefore, the manufacturer is inspired to invest in carbon emissions reduction to sell their surplus quotas at high market price to gain extra revenue. However, the speed of emissions reduction will become slow due to the investment in carbon emissions reduction has an increasing marginal cost, even there are sufficient carbon credits available on the market. It indicates that many manufacturers will choose to sell the surplus carbon credits by reducing carbon emissions to gain more profit when the market price of carbon credits is high. In a certain range, the higher the carbon price, the less the carbon emissions.
In summary, the emissions cap has little effect on the total carbon emissions. No matter how many free carbon credits are allocated by the government, the total carbon emissions are mostly affected by carbon trading price and market sale price of product. That is to say, the carbon trading market and product market play more major role than the government in regulating manufacturers. When manufacturers make optimal strategies, they should consider more about the CEP and their funding conditions. Therefore, all key parameters should be considered to trade off the expected profit and carbon emissions and to obtain the multi-period global optimal solutions [20].
By using OED, the influence of carbon policies, consumers’ environmental preference and cost variables on manufacturers’ expected profits and total carbon emissions are examined. There are several important policy implications:
(1) When the market price of carbon credits increases, the expected profit will increase and the carbon emissions will decrease. However, the trend will be flat over time. When the carbon trading price is low, the efficiency of reducing carbon emissions is also low. It indicates that high market price of carbon credits is not always good for reducing emissions.
(2) When the CEP increases, the excepted profit will decrease and the total carbon emissions will decrease first and then increase. The manufacturer will produce more products to meet the increasing low-carbon demand. In general, carbon emissions increase as production increases. To control the carbon emissions and follow the carbon policies, manufacturers need to buy quotas or invest in carbon emissions reduction [12]. However, it will become difficult for manufacturers to reduce emissions due to the increasing marginal investment cost. This will lead to more carbon emissions over time. Thus, it is critical that manufacturers should response timely based on demand information, such as CEP. Our model could be applied to help manufacturers make optimal solutions at any time.
(3) When the carbon cap is high, the expected profits of manufacturers will increase. It indicates that under loose carbon regulation, there are sufficient carbon quotas. The manufacturers could benefit from selling the carbon credits instead of investing in carbon emissions reduction.
(4) When the market sale prices of low-carbon products increase, there will be few consumers buy the products. Due to the increasing marginal produce cost and marginal investment cost, manufacturers will not use the cleaner/low-carbon technologies and they will produce regular products, which lead to higher carbon emissions. Therefore, the pricing-setting of products is important and has great effects on total carbon emissions.

5. Conclusions and Future Perspectives

Among many carbon regulations, the cap-and-trade mechanism has incentivized the reduction of carbon emissions. Manufacturers should re-determine their operation polities. This study extended the newsvendor model to derive the optimal production quantity and carbon emissions reduction for manufacturers. Especially, the manufacturers face a market with random demand that is mainly impacted by the emissions reduction per unit of product. Numerical examples are provided to develop the robustness of system parameters via the orthogonal experimental design technique. The results show that when customers are sensitive to the emissions reduction per unit of product, more manufacturers will quickly invest in carbon emissions reduction to increase revenue. Furthermore, manufacturers are willing to invest in carbon emissions reduction when the market price of carbon credits and CEP are high. However, it will become more difficult to reduce emissions due to the increasing marginal abatement cost. On the other hand, manufacturers will not be motivated to take measures to reduce carbon emissions when the free carbon quotas allocated by the government is sufficient. Therefore, it is critical that the government sets reasonable carbon emissions cap. In summary, the carbon trading parameters, cost parameters and the demand-related parameters can impact the optimal strategies. Manufacturers should trade off all parameters to maximize their profits and minimize carbon emissions. The government should make their policies.
There are several interesting extensions to this work. In this study, we assume that (1) manufacturers sell products to consumers directly without cooperation between their upstream and downstream enterprises and (2) all low-carbon products have the same carbon emissions and have the same effects on the market. However, since the manufacturers and consumers are heterogeneous, more nuanced models can be developed to understand market behavior. In a real market, carbon credits can be saved and can be transferred for use in the next production period. Another set of models could be developed to identify how a manufacturer should choose to sell carbon credits or to invest in additional reduction technology to save carbon credits. These methods could help both governments and manufacturing industries to understand how market conditions change and make better long-term decisions.

Author Contributions

Conceptualization, W.T., J.D. and F.Z.; methodology, software and formal analysis W.T.; data curation, J.D.; writing—original draft preparation, W.T.; writing—review and editing, J.D.; supervision, F.Z. and J.W.S.; funding acquisition, D.M. All authors have read and approved the final manuscript.

Funding

This study is supported by the National Natural Science Foundation of China (No. 71473013) and the Fundamental Research funds for Beijing Jiaotong University (No. B17JB00240). Moreover, the authors gratefully acknowledge the China Scholarship Council (Grant No. 201707090066) for financial support.

Acknowledgments

All researchers are also grateful to the Editor and all reviewers who proposed the constructive comments, which helped greatly to improve our paper.

Conflicts of Interest

The authors declare no conflict of interest.

Appendix A

Proof of Theorem 1.
The solution for z and Δ e in Equations (5) and (6) are optimal if the Hessian E [ π m ( z , Δ e ) ] is negative semi definite where the Hessian is given by [ ( p c v ) f ( z ) p e p e 2 t p e h ] .
H1 = ( p c v ) f ( z ) which is always negative. If condition H2 = ( h 2 t p e ) ( p c v ) f ( z ) p e 2 > 0 is satisfied, E [ π m ( z , Δ e ) ] is a concave function of z and Δ e . Equation (4) exists the unique optimal solution. To solve the result, then:
E [ π m ] z = [ p c p e ( e Δ e ) ] ( p c v ) F ( z ) ,
E [ π m ] Δ e = p e [ z + y ( Δ e ) ] + t [ p c p e ( e Δ e ) ] h Δ e .
Let E [ π m ] z = 0 , E [ π m ] Δ e = 0 , we could gain z and Δ e . According to the relationship between z and Q, the optimal production quantity can be presented by the following equation:
Q = z + y ( Δ e )
The Theorem is proved.  □
Proof of Proposition 1.
From Theorem 1, the optimal solution Δ e is presented as follows:
Δ e = p e ( a p e t + z ) + t ( p c ) h 2 t p e .
It is clear to see that Δ e is decreasing with h, e and c. In order to observe the effect of market price of carbon credits on the optimal quantity of carbon emissions reduction, the best response function of the retailers from the first derivative for pe of Δ e is shown as follows:
Δ e p e = h ( a p + z e t ) + 2 t 2 ( p c ) ( h 2 t p e ) 2 .
If e < h ( a p + z ) + 2 t 2 ( p c ) t h , we can get Δ e p e > 0 , which indicates that Δ e is increasing in p e . If e > h ( a p + z ) + 2 t 2 ( p c ) t h , there always have Δ e p e < 0 , which indicates that Δ e is decreasing in p e .
On the other hand, the best response function of the retailers from the first derivative for t of Δ e is shown as follows:
Δ e t = 2 p e 2 ( a p + z ) + h ( p c e p e ) ( h 2 t p e ) 2
When e < 2 p e 2 ( a p + z ) + h ( p c ) h p e , we can get Δ e t > 0 , which indicates that Δ e is increasing in t. When e > 2 p e 2 ( a p + z ) + h ( p c ) h p e , we can know that Δ e t < 0 , which indicates that Δ e is decreasing in t.
The Proposition is proved.  □
Proof of Proposition 2.
Theorem 1 shows the optimal solution Δ e and z which could be presented as follows:
( h 2 t p e ) ( p c v ) F ( z ) = ( h t p e ) ( p c e p e ) + p e 2 ( a p + z )
We take the derivative of z with respect to h,
z h = p e Δ e ( h 2 t p e ) ( p c v ) f ( z ) p e 2 < 0
Because of Q h = z h < 0 , the optimal production Q is decreasing in h.
We take the derivative of z with respect to t,
z t = p e ( p c v ) F ( z ) + Δ e p e 2 ( h 2 t p e ) ( p c v ) f ( z ) p e 2 > 0
According to Equation (A3) Q t = z t > 0 . Then we take the first derivative of z and Q with respect to pe,
Q p e = z p e = t ( p c ) + 2 p e ( a p + z + t Δ e ) e h ( h 2 t p e ) ( p c v ) f ( z ) p e 2 = t ( p c ) + 2 p e Q e h ( h 2 t p e ) ( p c v ) f ( z ) p e 2
when e < 2 p e Q + t ( p c ) h , there always have Q p e > 0 . Otherwise, we can know Q p e < 0 .
The Proposition is proved.  □

Appendix B

Table A1. The expected profit and total carbon emissions under cap-and-trade mechanism.
No.tpccvCgpemPro*E*
111111128338
2122222118925
3133333245619
4144444408715
5155555608013
621234549534
7223451175347
823451265829
9245123174124
10251234320620
1131352422344
1232413538706
13335241141263
14341352287642
15352413104829
1641425338637
1742531413348
1843142528059
19442531111078
20453142234349
2151543216879
22521543317114
23532154498314
24543215172012
2555432176391

References

  1. Solomon, S.; Plattner, G.; Knutti, R.; Friedlingstein, P. Irreversible climate change due to carbon dioxide emissions. Proc. Natl. Acad. Sci. USA 2009, 106, 1704–1709. [Google Scholar] [CrossRef] [PubMed] [Green Version]
  2. Eickemeier, P.; Schlömer, S.; Farahani, E.; Kadner, S.; Brunner, S.; Baum, I.; Kriemann, B. Climate Change 2014: Mitigation of Climate Change Working Group III Contribution to the Fifth Assessment Report of the Intergovernmental Panel on Climate Change. Available online: http://www.buildup.eu/en/practices/publications/ipcc-2014-climate-change-2014-mitigation-climate-change-contribution-working (accessed on 10 January 2019).
  3. Goulder, L.H.; Schen, A.R. Carbon Taxes Versus Cap and Trade: A Critical Review. Clim. Chang. Econ. 2013, 4, 1–28. [Google Scholar] [CrossRef]
  4. Gong, X.; Zhou, S.X. Optimal Production Planning with Emissions Trading. Oper. Res. 2013, 61, 908–924. [Google Scholar] [CrossRef]
  5. Benjaafar, S.; Li, Y.; Daskin, M. Carbon footprint and the management of supply chains: Insights from simple models. Autom. Sci. Eng. IEEE Trans. 2013, 10, 99–116. [Google Scholar] [CrossRef]
  6. Qi, J.; Zou, Y.; Xu, X.; Yu, X.; Shen, L.; Tang, W.; Chen, W.; Jiao, J.; Kou, W.; Zhang, W.; et al. A Study on China’s Carbon Finance Market. GFC & CBEEX, 2016. Available online: http://www.tanjiaoyi.com/article-18465-1.html (accessed on 10 January 2019). (In Chinese).
  7. Ghadimi, P.; Wang, C.; Lim, M.K. Resources, Conservation & Recycling Sustainable supply chain modeling and analysis: Past debate, present problems and future challenges. Resour. Conserv. Recycl. 2019, 140, 72–84. [Google Scholar] [CrossRef]
  8. Wang, C.; Ghadimi, P.; Lim, M.K.; Tseng, M. A literature review of sustainable consumption and production: A comparative analysis in developed and developing economies. J. Clean. Prod. 2019, 206, 741–754. [Google Scholar] [CrossRef]
  9. Du, S.; Ma, F.; Fu, Z.; Zhu, L.; Zhang, J. Game-theoretic analysis for an emission-dependent supply chain in a ‘cap-and-trade’ system. Ann. Oper. Res. 2015, 228, 135–149. [Google Scholar] [CrossRef]
  10. Ji, J.; Zhang, Z.; Yang, L. Carbon emission reduction decisions in the retail-/dual-channel supply chain with consumers’ preference. J. Clean. Prod. 2017, 141, 852–867. [Google Scholar] [CrossRef]
  11. Wan, H.; Gu, X.; Xie, Z.; Cheng, X.; Liang, H.; Lv, Z.; Yang, J.; Pan, Y.; Chen, L.; Zhao, B. Report on Green Consumers in China. AliResearth, 2016. Available online: http://i.aliresearch.com/file/20160803/20160803103534.pdf (accessed on 10 January 2019). (In Chinese).
  12. Tong, W.; Mu, D.; Zhao, F.; Mendis, G.P.; Sutherland, J.W. Resources, Conservation & Recycling The impact of cap-and-trade mechanism and consumers’ environmental preferences on a retailer-led supply Chain. Resour. Conserv. Recycl. 2019, 142, 88–100. [Google Scholar] [CrossRef]
  13. Hua, G.; Cheng, T.C.E.; Wang, S. Managing carbon footprints in inventory management. Int. J. Prod. Econ. 2011, 132, 178–185. [Google Scholar] [CrossRef]
  14. He, P.; Zhang, W.; Xu, X.; Bian, Y. Production lot-sizing and carbon emissions under cap-and-trade and carbon tax regulations. J. Clean. Prod. 2015, 103, 241–248. [Google Scholar] [CrossRef]
  15. Bonney, M.; Jaber, M.Y. Environmentally responsible inventory models: Non-classical models for a non-classical era. Int. J. Prod. Econ. 2011, 133, 43–53. [Google Scholar] [CrossRef]
  16. Chen, C.; Monahan, G.E. Environmental safety stock: The impacts of regulatory and voluntary control policies on production planning, inventory control, and environmental performance. Eur. J. Oper. Res. 2010, 207, 1280–1292. [Google Scholar] [CrossRef]
  17. Zhang, J.; Nie, T.; Du, S. Optimal emission-dependent production policy with stochastic demand. Int. J. Soc. Syst. Sci. 2011, 3, 21–39. [Google Scholar] [CrossRef]
  18. Zhang, B.; Xu, L. Multi-item production planning with carbon cap and trade mechanism. Int. J. Prod. Econ. 2013, 144, 118–127. [Google Scholar] [CrossRef]
  19. Song, J.; Leng, M. Analysis of the Single-Period Problem under Carbon Emissions Policies. In Handbook of Newsvendor Problems; Springer: New York, NY, USA, 2012; pp. 297–313. ISBN 978-1-4614-3599-0. [Google Scholar]
  20. Xu, J.; Bai, Q.; Xu, L.; Hu, T. Effects of emission reduction and partial demand information on operational decisions of a newsvendor problem. J. Clean. Prod. 2018, 188, 825–839. [Google Scholar] [CrossRef]
  21. Du, S.; Hu, L.; Song, M. Production optimization considering environmental performance and preference in the cap-and-trade system. J. Clean. Prod. 2016, 112, 1600–1607. [Google Scholar] [CrossRef]
  22. Petruzzi, N.C.; Dada, M. Pricing and the Newsvendor Problem: A Review with Extensions. Oper. Res. 1999, 47, 183–194. [Google Scholar] [CrossRef] [Green Version]
  23. Whitin, T.M. Inventory control and price theory. Manag. Sci. 1955, 2, 61–68. [Google Scholar] [CrossRef]
  24. Mills, E.S. Uncertainty and price theory. Q. J. Econ. 1959, 4, 116–130. [Google Scholar] [CrossRef]
  25. Karlin, S.; Carr, C.R. Prices and optimal inventory policy. In Studies in Applied Probability and Management Science; Stanford University: Stanford, CA, USA, 1962; pp. 159–172. [Google Scholar]
  26. Chiu, C.H.; Choi, T.M. Optimal pricing and stocking decisions for newsvendor problem with value-at-risk consideration. IEEE Trans. Syst. Man, Cybern. Part A Syst. Hum. 2010, 40, 1116–1119. [Google Scholar] [CrossRef]
  27. Polatoglu, L.H. Optimal order quantity and pricing decisions in single-period inventory systems. Int. J. Prod. Econ. 1991, 23, 175–185. [Google Scholar] [CrossRef] [Green Version]
  28. Liu, Y.; Zhang, J.; Wang, L. Optimal joint pricing and ordering decisions in newsvendor model with two demand cases. Control Decis. 2013, 28, 1419–1422. [Google Scholar]
  29. Jiang, W.; Chen, X. Optimal strategies for manufacturer with strategic customer behavior under carbon emissions-sensitive random demand. Ind. Manag. Data Syst. 2016, 116, 759–776. [Google Scholar] [CrossRef]
  30. Zhang, B.; Qu, S.; Li, P.; Huang, R. Optimal Strategies for Manufacturers with the Reference Effect under Carbon Emissions-Sensitive Random Demand. Discret. Dyn. Nat. Soc. 2018, 2018, 2452406. [Google Scholar] [CrossRef]
  31. Liu, Z.; Anderson, T.D.; Cruz, J.M. Consumer environmental awareness and competition in two-stage supply chains. Eur. J. Oper. Res. 2012, 218, 602–613. [Google Scholar] [CrossRef]
  32. Savaskan, R.C.; Van Wassenhove, L.N. Reverse Channel Design: The Case of Competing Retailers. Manag. Sci. 2006, 52, 1–14. [Google Scholar] [CrossRef]
  33. Gurnani, H.; Erkoc, M. Supply Contracts in Manufacturer-Retailer Interactions with Manufacturer-Quality and Retailer Effort-Induced Demand. Nav. Res. Logist. 2008, 55, 200–217. [Google Scholar] [CrossRef]
  34. Jin, M.; Granda-marulanda, N.A.; Down, I. The impact of carbon policies on supply chain design and logistics of a major retailer. J. Clean. Prod. 2014, 85, 453–461. [Google Scholar] [CrossRef]
  35. Taguchi, G.; Konishi, S. Taguchi Methods Orthogonal Arrays and Linear Graphs: Tools for Quality Engineering; American Supplier Institute: Dearborn, MI, USA, 1987. [Google Scholar]
  36. CHEAA Appliance Reference. Available online: http://www.cheaa.org/channels/117_2.html (accessed on 15 April 2018).
Figure 1. Main effects plot for means of expected profit.
Sustainability 11 00474 g001
Figure 2. Effect of carbon emissions cap on the excepted profit.
Sustainability 11 00474 g002
Figure 3. Main effects plot for means of total carbon emissions.
Sustainability 11 00474 g003
Figure 4. Effect of market price of carbon credits on carbon emissions (0.72 ≤ pe ≤ 9.42).
Sustainability 11 00474 g004
Table 1. Comparisons with recent literatures.
Research PaperProduction OptimizationCarbon Emissions OptimizationCEPCap-and-Trade Mechanism
He et al. [14]YesYesNoYes
Du et al. [21]YesNoYesYes
Jiang and Chen [29], Zhang et al. [30]YesYesYesNo
This paperYesYesYesYes
Table 2. Decision variables and parameters.
Decision Variables of Manufacture
ΔeEmissions reduction per unit of product
QProduction quantity
Parameters
aPotential demand
tEmissions reduction effectiveness parameter (Erep)
pSale price per unit of product
cProduction costs per unit of product
cvSalvage value of per unit of unsold product
hEmissions reduction investment coefficient
eInitial carbon emissions per unit of product
πmManufacturer’s profit
ETotal carbon emissions
peMarket price of carbon credits
CgEmissions cap
Table 3. Values of parameters for each level.
ParameterLevel 1Level 2Level 3Level 4Level 5
tErep0.020.040.20.51
pSale price2.323.484.645.86.96
cProduction costs0.580.871.161.451.74
cvSalvage value0.4350.65250.871.08751.305
CgEmissions cap250375500625750
peCarbon credits price2.94.355.87.258.7
Table 4. The response table for means of expected profit under cap-and-trade mechanism.
LeveltpccvCgpe
ErepSale PriceProduction CostsSalvage ValueEmissions CapCarbon Credits Price
1281926042468264410091064
2246222632656227817461750
3228824632101247624662456
4229123072648227631933169
5246526882451265039113886
Δ53142455537529022822
Rank453612
Table 5. The response table for means of total carbon emissions under cap-and-trade mechanism.
LeveltpccvCgpe
ErepSale PriceProduction CostsSalvage ValueEmissions CapCarbon Credits Price
121.90812.41024.57726.12723.16563.441
224.75320.11029.96725.54630.66030.867
328.75526.97826.17932.65926.54918.498
430.29834.13329.86221.89028.96512.241
528.16740.24923.29527.65824.5428.833
Δ8.39027.8396.67210.7697.49554.608
Rank426351

