Assessing the Economic-Environmental Efficiency of Energy Consumption and Spatial Patterns in China


1
College of Geography and Environmental Science, Northwest Normal University, Lanzhou 730070, China
2
College of Earth and Environmental Sciences, Lanzhou University, Lanzhou 730000, China
3
Key Lab for Environment Computation and Sustainability of Liaoning Province, Institute of Applied Ecology, Chinese Academy of Sciences, Shenyang 110016, China
4
Institute for Advances Sustainability Studies e. V., 14467 Potsdam, Germany
*
Authors to whom correspondence should be addressed.
Sustainability 2019, 11(3), 591; https://0-doi-org.brum.beds.ac.uk/10.3390/su11030591
Submission received: 20 December 2018
/
Revised: 16 January 2019
/
Accepted: 21 January 2019
/
Published: 23 January 2019
(This article belongs to the Special Issue International Perspectives on Sustainable Energy Transition)
Abstract
:The improvement of energy consumption efficiency represents a significant task and a critical step toward sustainable energy transformations. This study uses a data envelopment analysis (DEA) and spatial autocorrelation method to conduct comprehensive measurement and assessment research on the economic-environmental efficiency of energy consumption in 31 Chinese provinces. It then carries out a synthetic study on energy consumption efficiency in the context of temporal and spatial dimensions, analyzes the characteristics and patterns related to temporal and spatial evolution, and systematically summarizes the temporal and spatial evolution processes associated with China’s economic-environmental efficiency in energy consumption. The results show that economic efficiency and environmental efficiency, both directly related to energy consumption, are positively correlated and display a parallel and synchronizing relationship. China’s energy consumption efficiency displays an upward trend in general, although differences exist between economic efficiency and environmental efficiency about the growth rate and overall development level. In other words, economic efficiency is generally higher than environmental efficiency. A positive spatial correlation occurs between economic and environmental efficiency in energy consumption across all the Chinese provinces studied. Furthermore, some cluster characteristic can be identified. Accurately, the eastern coastal area of China with a higher efficiency represents a spatial cluster of high values, whereas the midwestern inland area of China with a lower efficiency represents a spatial cluster of low values. Therefore, a descending pattern is displayed from the east to the west. As time goes by, the extent of clustering could become more prominent, accompanied by an increasing spatial cluster of high values and a decreasing spatial cluster of low values. Accordingly, China needs to improve its energy consumption efficiency further and promote sustainable energy transformations.
1. Introduction
Energy consumption is a global issue that affects the extent of climate change and environmental pollution. Moreover, it determines whether the goal of global sustainable development can be achieved successfully. One of the core aspects of sustainable energy transformations is to improve energy consumption efficiency, or ensure that the intensity of energy consumption and resource utilization is in line with the Earth’s capacity [1]. By doing so, high socioeconomic-ecological values could be achieved at a relatively low cost of energy consumption, environmental alternation, and ecological damage. Given the continuous expansion of the demand for energy, rapid growth in energy consumption and low growth in energy production, one of the top priorities for sustainable development and environmental protection is to reduce energy usage and improve energy consumption efficiency [2]. The economic efficiency of energy consumption represents the economic benefits that energy consumption can provide. Under such circumstances, research on economic-environmental efficiency in energy consumption should not only include an assessment of economic efficiency and environmental efficiency, both closely related to energy consumption issues, but also comprise an assessment of energy consumption efficiency based on economic and environmental factors [3]. China is a vast country with uneven regional development and significant differences exist across its regions regarding energy consumption efficiency [4]. Therefore, the narrowing of the gap in energy consumption efficiency across its regions will help improve the overall energy consumption efficiency at a national level and promote the full realization of sustainable development.
This study uses a data envelopment analysis (DEA) and spatial autocorrelation method to quantify the economic-environmental efficiency of energy consumption in 31 Chinese provinces. Based on a comparative analysis of their evolutionary characteristics and patterns, we further systematically analyze the temporal and spatial evolution processes associated with China’s economic-environmental efficiency in energy consumption. On the one hand, this study can help enrich and expand theories of human-land relationships and strengthen China’s research on topics related to sustainable energy transformations. On the other hand, it could help the government to scientifically formulate China’s sustainable energy transformation and development strategies and effectively coordinate the relationship between energy consumption, economic development, and environmental protection. As a result, the demands of Low-Carbon Green Growth could be met, and the goal of sustainable development could be fully achieved. Therefore, this study is both theoretically meaningful and of practical significance.
2. Literature Review
Generally speaking, energy consumption efficiency is the maximum output with certain energy input or the minimum energy input with a specified output [5]. The measurement of energy consumption efficiency can be categorized into two major types: Single-factor energy efficiency measurement and total-factor energy efficiency measurement. Single-factor energy efficiency is a partial factor productivity indicator that measures energy consumption and economic efficiency. For a specific economy, it usually refers to the ratio of the effective output to the energy input, as represented by the index of energy consumption per GDP. For example, Jimenez et al. [6] decomposed energy consumption intensity into changes in aspects such as economic structure, production levels, the extent of efficiency and fuel sources. Filippini et al. [7] believed that changes in economic structure, efficiency, technology, and the environment could all lead to changes in energy consumption intensity. Thus, energy consumption intensity was not a good indicator of energy efficiency. Proskuryakova et al. [8] concluded that, although energy consumption intensity could, to some extent, reflect energy consumption conditions, it did not represent energy efficiency effectively. Indeed, the single-factor energy efficiency method only measures a proportional relationship between energy inputs and outputs and fails to take into account all the other factors that function in the process of production, or the combined impacts of these input factors on energy efficiency. By contrast, the total-factor energy efficiency method is based on the theory of total factor productivity (TFP). It considers not only energy input factors that function in the process of production, but also the impacts of other input factors, such as technology, capital, and labor. Thus, it has some distinct advantages over the traditional single-factor energy efficiency method. To some extent, it compensates for the weaknesses of the single-factor energy efficiency method. At present, the measurement method of total factor energy efficiency is mainly based on DEA. According to the measurement scales for a specific study, it belongs to either a large-, medium-, or small-scale type.
At the national level, quite a few studies have been conducted. For example, Gökgöz et al. used the DEA method to measure energy consumption efficiency in EU countries [9]. Simsek [10] quantified energy consumption efficiency in 23 OECD countries and demonstrated that countries such as Ireland, Japan, Norway, Switzerland, the UK, and the US display the highest level of energy consumption efficiency. Borozan [11] also analyzed energy consumption efficiency in the EU region. Wrigley et al. [12] used Australia as an example to address how to improve the energy consumption efficiency of rental properties. Huang et al. [13] studied the driving force of China’s energy intensity. Guan et al. [14] measured China’s energy and environmental efficiency and analyzed the associated spatial distribution characteristics and evolution patterns. Huang [15] measured China’s energy and environmental efficiency and ascertained the characteristics of China’s spatial association networks related to energy and environmental efficiency, as well as the associated influencing factors. Also, Suzuki [16], Jebali [17], Wang [18], and other scholars also researched the measurement of energy efficiency at the national level. By contrast, at the provincial or state level, Bhat et al. [19] calculated the energy consumption efficiency and estimated energy saving potential for each Indian state. Ghiyasi [20] quantified the energy consumption efficiency for each Iranian province. Ruizfuensanta [21] conducted a comparative analysis of energy consumption efficiency within the internal regions of Spain and concluded that significant differences existed among the various regions regarding the optimization of energy consumption. Martínez et al. [22] analyzed and evaluated the energy usage and efficiency characteristics of the manufacturing sector across the different regions of Colombia. Xu et al. [23] measured the energy consumption efficiency of nine provinces along the Silk Road Economic Belt and found that this region had a high potential for energy savings. Zhang et al. [24] analyzed the energy consumption efficiency in Xinjiang and pointed out that technological progress was one of the main reasons for improvements in this area. In addition, Sağlam [25], Wu [26], Qin [27], and other scholars also researched the measurement of energy efficiency at either the provincial or state level. Finally, for relatively small-scale studies, Poggi et al. [28] explored how to improve the energy consumption efficiency of Portuguese cities at the municipal level. Mohseni et al. [29] studied the energy flow patterns and environmental impacts of the grape production systems for 58 vineyards in Arak County, Iran. Raheli et al. [30] assessed the sustainability and energy consumption efficiency of tomato production industries in the Malan region of East Azerbaijan, Iran. Goto et al. [31] evaluated the operational and environmental efficiency of regional industries in Japan based on surveys of manufacturing and non-manufacturing industries across 47 counties. Zhang et al. [32] analyzed the energy consumption efficiency among prefecture-level cities in the Jiangsu province and found that the overall energy consumption efficiency of these cities displayed a downward trend. Jiang [33] analyzed the energy consumption efficiency and associated influencing factors of 110 Chinese prefecture-level cities, and proposed “one city and one policy” as part of energy development strategies. Also, Imran [34], Sun [35], Huang [36], and other scholars have also researched the measurement of energy efficiency at the city or smaller levels.
Currently, most existing studies focus on the partial measurement of certain aspects of energy consumption efficiency, but research on the comprehensive measurement of both economic efficiency and environmental efficiency is minimal. The extant studies measure energy consumption efficiency on the temporal dimension, but the integration of spatial analysis is often lacking. In other words, systematic research on energy consumption efficiency that includes both temporal and spatial dimensions is very limited. Therefore, this study should compensate for the gap in the existing knowledge.
3. Research Method and Data
3.1. The Assessment of Economic-Environmental Efficiency in Energy Consumption
3.1.1. DEA
DEA is an assessment method used for studying the relative efficiency among organizations of the same type (decision units) with multiple inputs and outputs [5]. The basic principle is to first determine all the production possibility sets according to the original data, then compare a single decision unit with the determined optimal production frontier so that the relative efficiency of the decision unit can be calculated. Based on the research results of Ewertowska [37], Borozan [11], Fang [38], and Wang [18], this study selects the slacks-based measure-undesirable (SBM-Undesirable) model to measure the economic-environmental efficiency in energy consumption.
The establishment of the SBM-Undesirable model is based on the following principles: Let us assume that there are n decision making units, m input indicators, s1 expected outputs and s2 non-expected outputs. Therefore, for the ith decision-making unit, the corresponding input matrix X, expected output matrix Y and non-expected output matrix Z are:
All production possibility sets based on the decision-making units are:
The mathematical form of the model is:
In these formulas: is the objective function of the SBM-Undesirable model; represent the indicators of inputs, expected outputs and non-expected outputs, respectively; st represents that the objective function is subject to the set of restrictions; represent the relaxation variables of inputs, expected outputs and non-expected outputs, respectively; represent the relaxation vectors of inputs, expected outputs and non-expected outputs, respectively; and is the density vector, representing the weight of each element. If , and = 0, this indicates that the decision making unit is valid; otherwise, it is invalid. In the latter case, there is room for further improvement with regard to inputs or outputs. The calculation of Formula 3 and 4 can not only measure the impact of energy consumption on economic development based on expected output, but also effectively evaluate the impact of energy consumption on the environment under non-expected output.
3.1.2. Indicators and Data
According to the researching findings of Yang [39], Chen [40], Suzuki [16], Zhu [41], and Guan [14], we select indicators that are used more frequently and conduct research based on 31 provinces, autonomous regions, and municipalities directly under the Chinese Central Government (regions in Hong Kong, Macao, and Taiwan are not considered due to the lack of relevant statistical data) between 2000 and 2017. The specific indicators include:
Input indicators:
(1) Energy input: The total amount of energy consumption, with relevant data obtained from China’s Energy Statistics Yearbook.
(2) Capital investment: The investment in fixed assets of each province is based on the cost price in 1999, with relevant data obtained from China’s Statistical Yearbook.
(3) Labor input: The number of employees (the average number of employees at the end of the year and the number of employees at the end of the previous year), with relevant data obtained from China’s Statistical Yearbook.
(4) Technology input: The transaction amount of the technology market, with relevant data obtained from China’s Statistical Yearbook.
Output indicators:
(1) Economic output (expected output): GDP per capita, with relevant data obtained from China’s Statistical Yearbook.
(2) Environmental output (unexpected output): CO2 emissions, exhaust emissions, wastewater discharge, and solid waste emissions. CO2 emissions are estimated according to the methods developed by the Intergovernmental Panel on Climate Change (IPCC, 2006), with associated parameters determined mainly by reference to results from the relevant research [5,10,14], and environmental output data obtained from China’s Statistical Yearbook.
3.2. Spatial Autocorrelation Analysis
3.2.1. Global Spatial Autocorrelation Analysis
The global spatial autocorrelation can be applied to analyze the spatial correlation and cluster patterns regarding energy consumption efficiency in the region as a whole and is generally performed by calculating the global Moran’s I index. According to the related literature [5,42,43,44], the formula used for quantifying the global Moran’s I index is:
In which I represent the global Moran’s I index, n represents the total number of samples, represents the average value of all samples, represents the value of the ith sample, represents the value of the jth sample, and denotes the spatial weight matrix. A binary adjacency matrix is selected, where spatially adjacent = 1, and non-adjacent = 0. To further determine whether there is a spatial autocorrelation relationship, a significant test of I is required, with the formula as:
where Z is the test value of the global Moran’s I, E(I) is the expectation of I, and Var(I) is the variance of I.
3.2.2. Local Spatial Autocorrelation Analysis
The global spatial autocorrelation only describes the overall spatial distribution patterns. However, since it averages the differences among regions, it does not reflect the spatial dependence of each region. Therefore, it is necessary to conduct a local spatial autocorrelation analysis so that the changing trend of spatial differences regarding energy consumption efficiency can be reflected more comprehensively, and the local spatial distribution characteristics can be better ascertained. According to the related literature [14,42], the formula used for calculating the local Moran’s I index is:
where represents the local Moran’s I index for the ith province, n represents the total number of samples, represents the average value of all samples, represents the value of the ith sample, represents the value of the jth sample, and represents the spatial weight matrix.
In order to further determine whether there is a spatial autocorrelation relationship, a significant test of is required, with the formula as:
where is the test value of the local Moran’s I for the ith province, is the expectation of Ii, and Var(Ii) is the variance of Ii.
According to the results from the calculations, four types of spatial correlation can be defined: The types of high-high (H-H), low-high (L-H), high-low (H-L), and low-low (L-L). Among them, H-H and L-L represent a positive spatial autocorrelation, while L-H and H-L represent a negative spatial autocorrelation.
4. Results and Discussion
4.1. The Analysis of the Economic-Environmental Efficiency in Energy Consumption
4.1.1. Economic Efficiency in Energy Consumption
The economic efficiency in energy consumption between 2000 and 2017 was quantified for China’s 31 provinces (municipalities and autonomous regions included), with the results shown in Table 1.
(1) The economic efficiency of China’s energy consumption displays a rising trend. The average values increased from 0.656 in 2000 to 0.719 in 2017 (an increase of 0.063). In recent years, other scholars also conducted similar studies. For example, Zhang [45] and other scholars concluded that China’s regional energy efficiency keeps increasing. Similarly, Tang [46] found that China’s economic efficiency in energy consumption is also on the rise, and Zhao [47] suggested that China’s overall energy usage efficiency is showing an upward trend. It can be seen, therefore, that since 2000, China has paid more attention to energy consumption, and its economic efficiency in energy consumption is continuously improving.
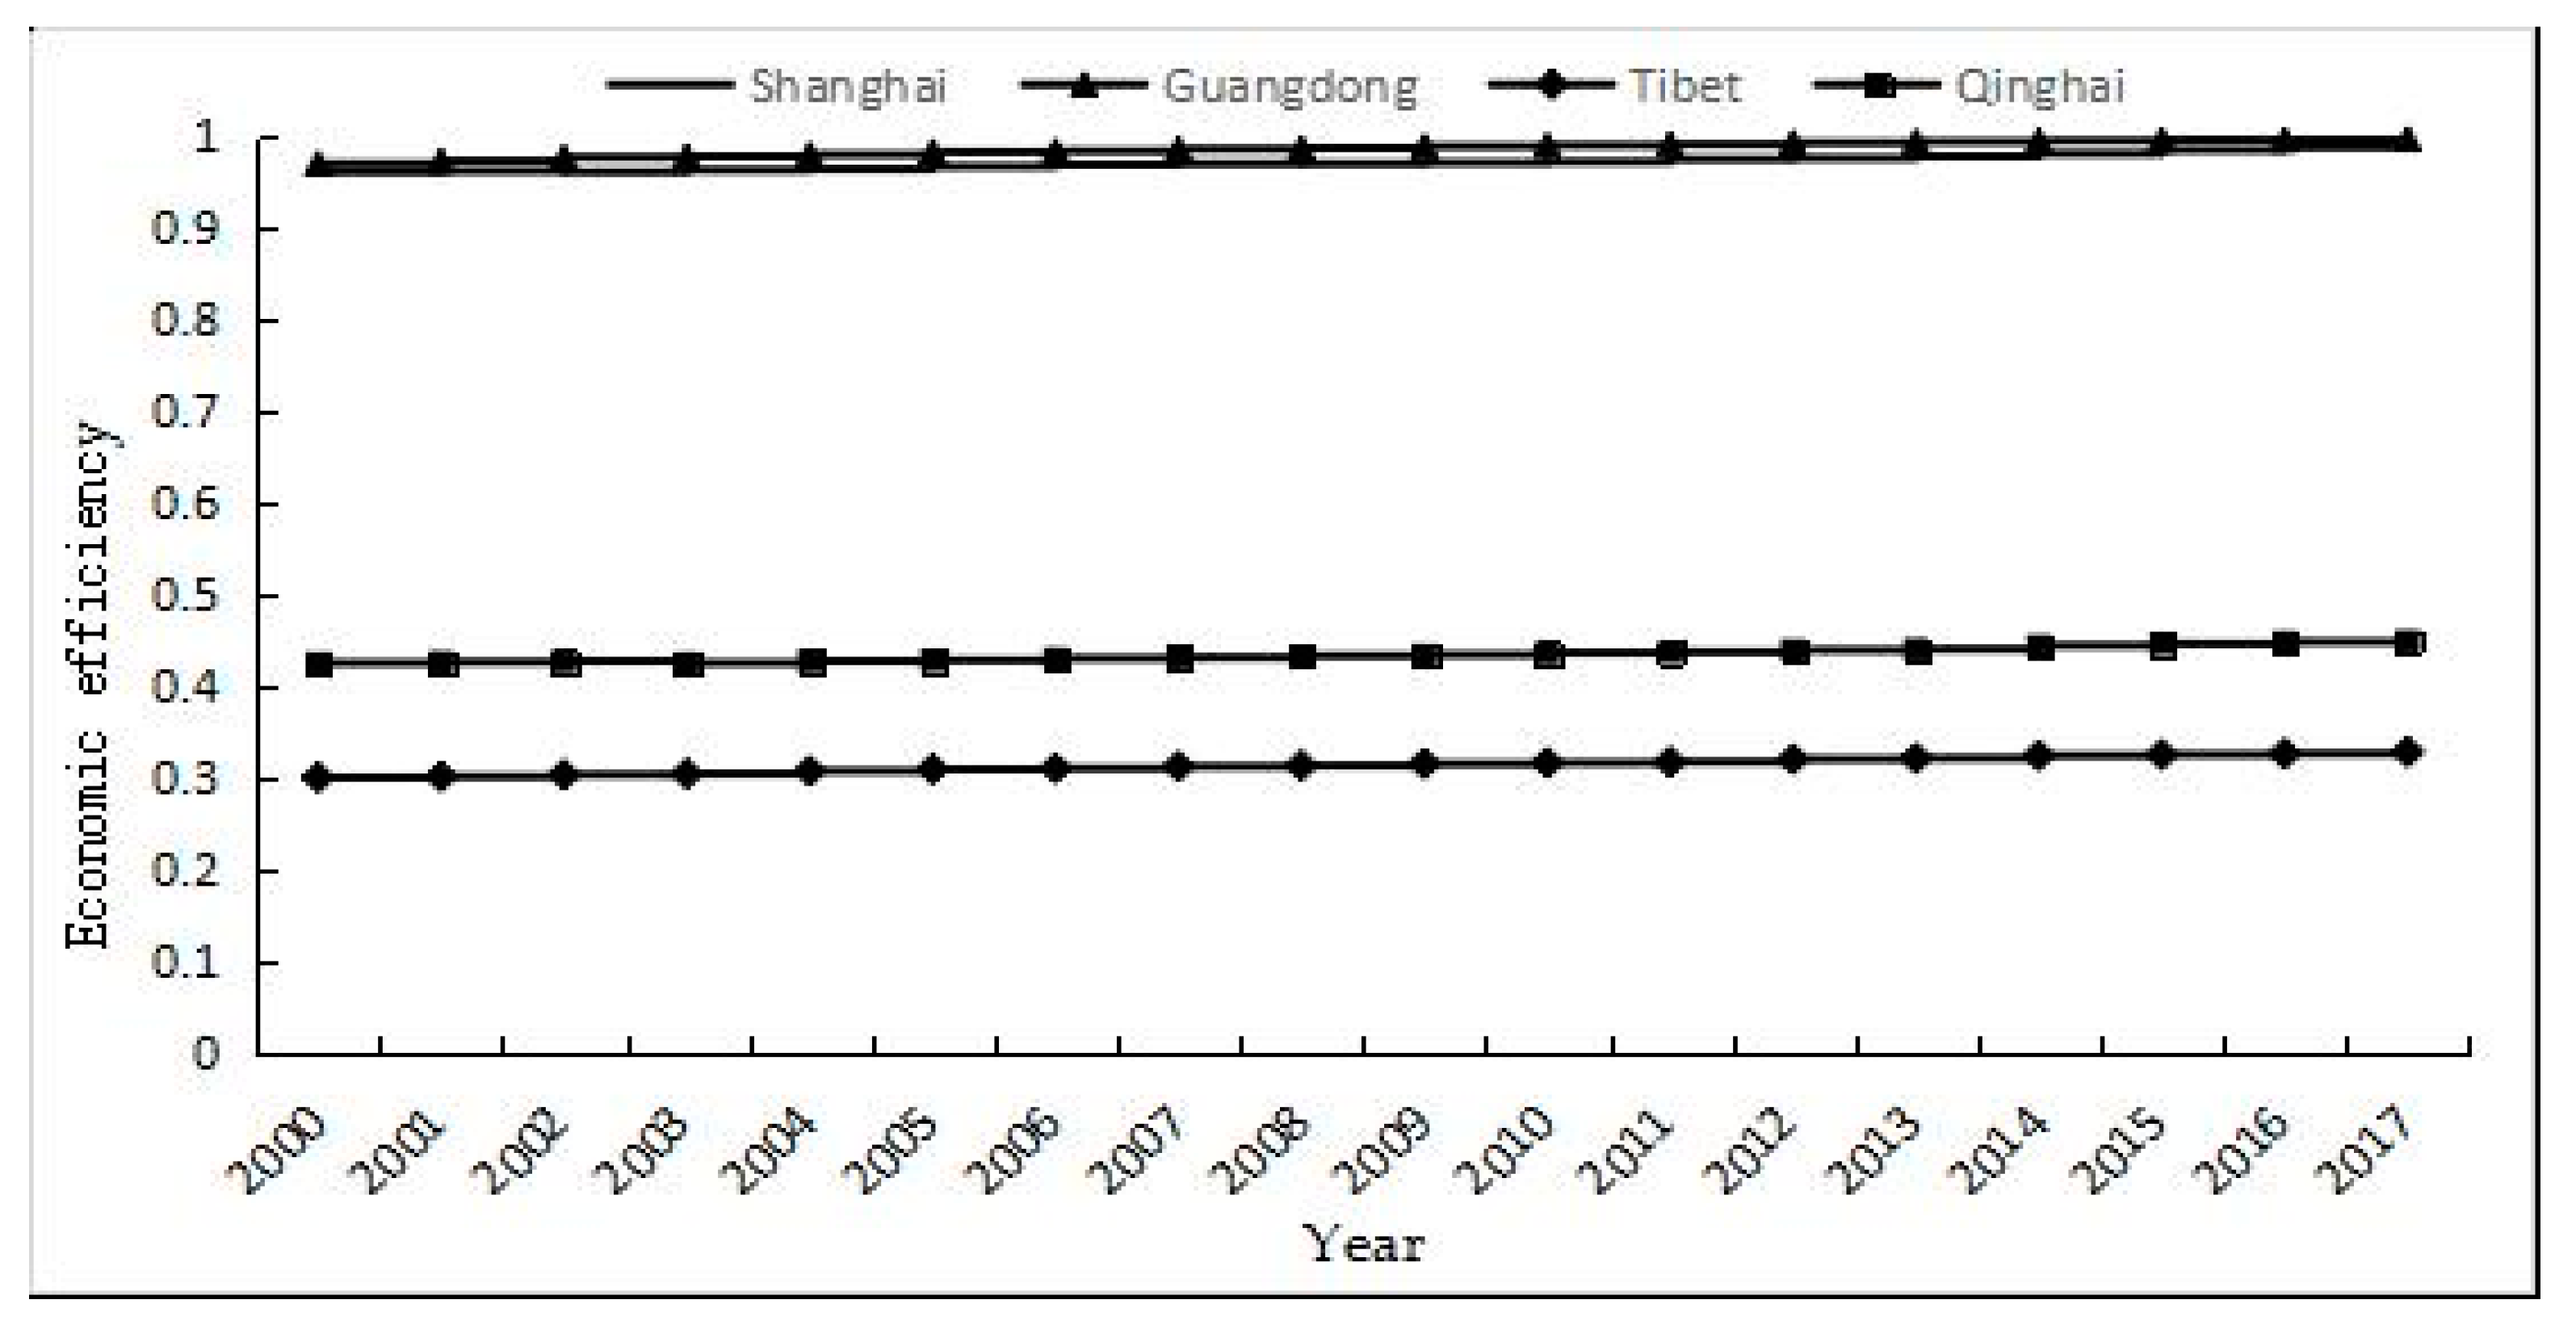
(2) There is a non-equilibrium situation regarding the economic efficiency in energy consumption across Chinese provinces. In 2000, the Guangdong province had the highest economic efficiency in energy consumption (0.971), whereas the Tibet autonomous region had the lowest economic efficiency in energy consumption (0.301), a difference of 0.67. In 2017, the Guangdong province still had the highest economic efficiency in energy consumption (0.990), and the Tibet autonomous region still had the lowest value (0.316), a difference of 0.674 (Figure 1). The gap is large, and this difference will exist for a relatively long time.
As far as the provinces are concerned, Beijing, Shanghai, and many southeast coastal provinces, such as Guangdong, generally have a high economic efficiency in energy consumption, and they represent high-level development zones. By contrast, Xinjiang, Qinghai, Tibet, and other western provinces generally have low economic efficiency in energy consumption, and they represent low-level development zones. In recent years, other scholars also conducted similar studies. For example, Yang [39] concluded that China’s eastern provinces generally have a high energy consumption efficiency, whereas western provinces generally have a low energy consumption efficiency, with a large gap existing among provinces regarding energy consumption efficiency. Sun [48] also found out that, in China, there are significant regional differences in energy consumption efficiency, and the current energy allocation is not practical. Wang [49] concluded that China’s economic efficiency in energy consumption differs regionally, and China’s eastern coastal areas are superior to other regions in this regard. Zhao [50] also found that industrial districts in eastern China are more energy efficient than other regions. It can be seen that, in China, the overall economic efficiency in energy consumption shows obvious regional differences. Geographically speaking, there is a decreasing pattern from the east toward the west, or from the southeast toward the northwest, which is mainly related to the geographical location and industrial structure. There is a good level of economic growth in the eastern region of China, as this region has a geographical advantage and full access to financial, technical and information-related support. As a result, the processes of sustainable energy transformation and development can be accelerated, and economic efficiency in energy consumption can be improved. By contrast, the opposite situation is found in the western region. A relatively greater industrial structure is found in the eastern region of China, which takes the lead in the implementation of sustainable energy transformation and development strategy, and the strengthening of the input and consumption efficiency of available energy, so that the economic efficiency in energy consumption can be ultimately improved. Again, the opposite situation is found in the western region.
4.1.2. Environmental Efficiency in Energy Consumption
The environmental efficiency in energy consumption between 2000 and 2017 was quantified for China’s 31 provinces (municipalities and autonomous regions included), with the results shown in Table 2.
(1) The environmental efficiency of China’s energy consumption displays a rising trend. The average values increase from 0.614 in 2000 to 0.668 in 2017 (an increase of 0.054). However, compared to the economic efficiency in energy consumption, its growth rate is smaller. In recent years, other scholars also conducted similar studies. For example, Chen [40] found that China’s environmental efficiency has increased, although the growth rate remains low. Huang [15] concluded that China’s environmental efficiency in energy consumption is generally fluctuating and rising, although the growth rate is limited. Yang [51] suggested that China’s environmental efficiency has generally improved. It can be seen that since 2000, China has paid a great deal of attention to environmental protection, with environmental awareness continuously enhanced and investment in environmental protection continuously accelerated. Nonetheless, while the environmental efficiency of China’s energy consumption keeps increasing, it is still lower than its economic efficiency.
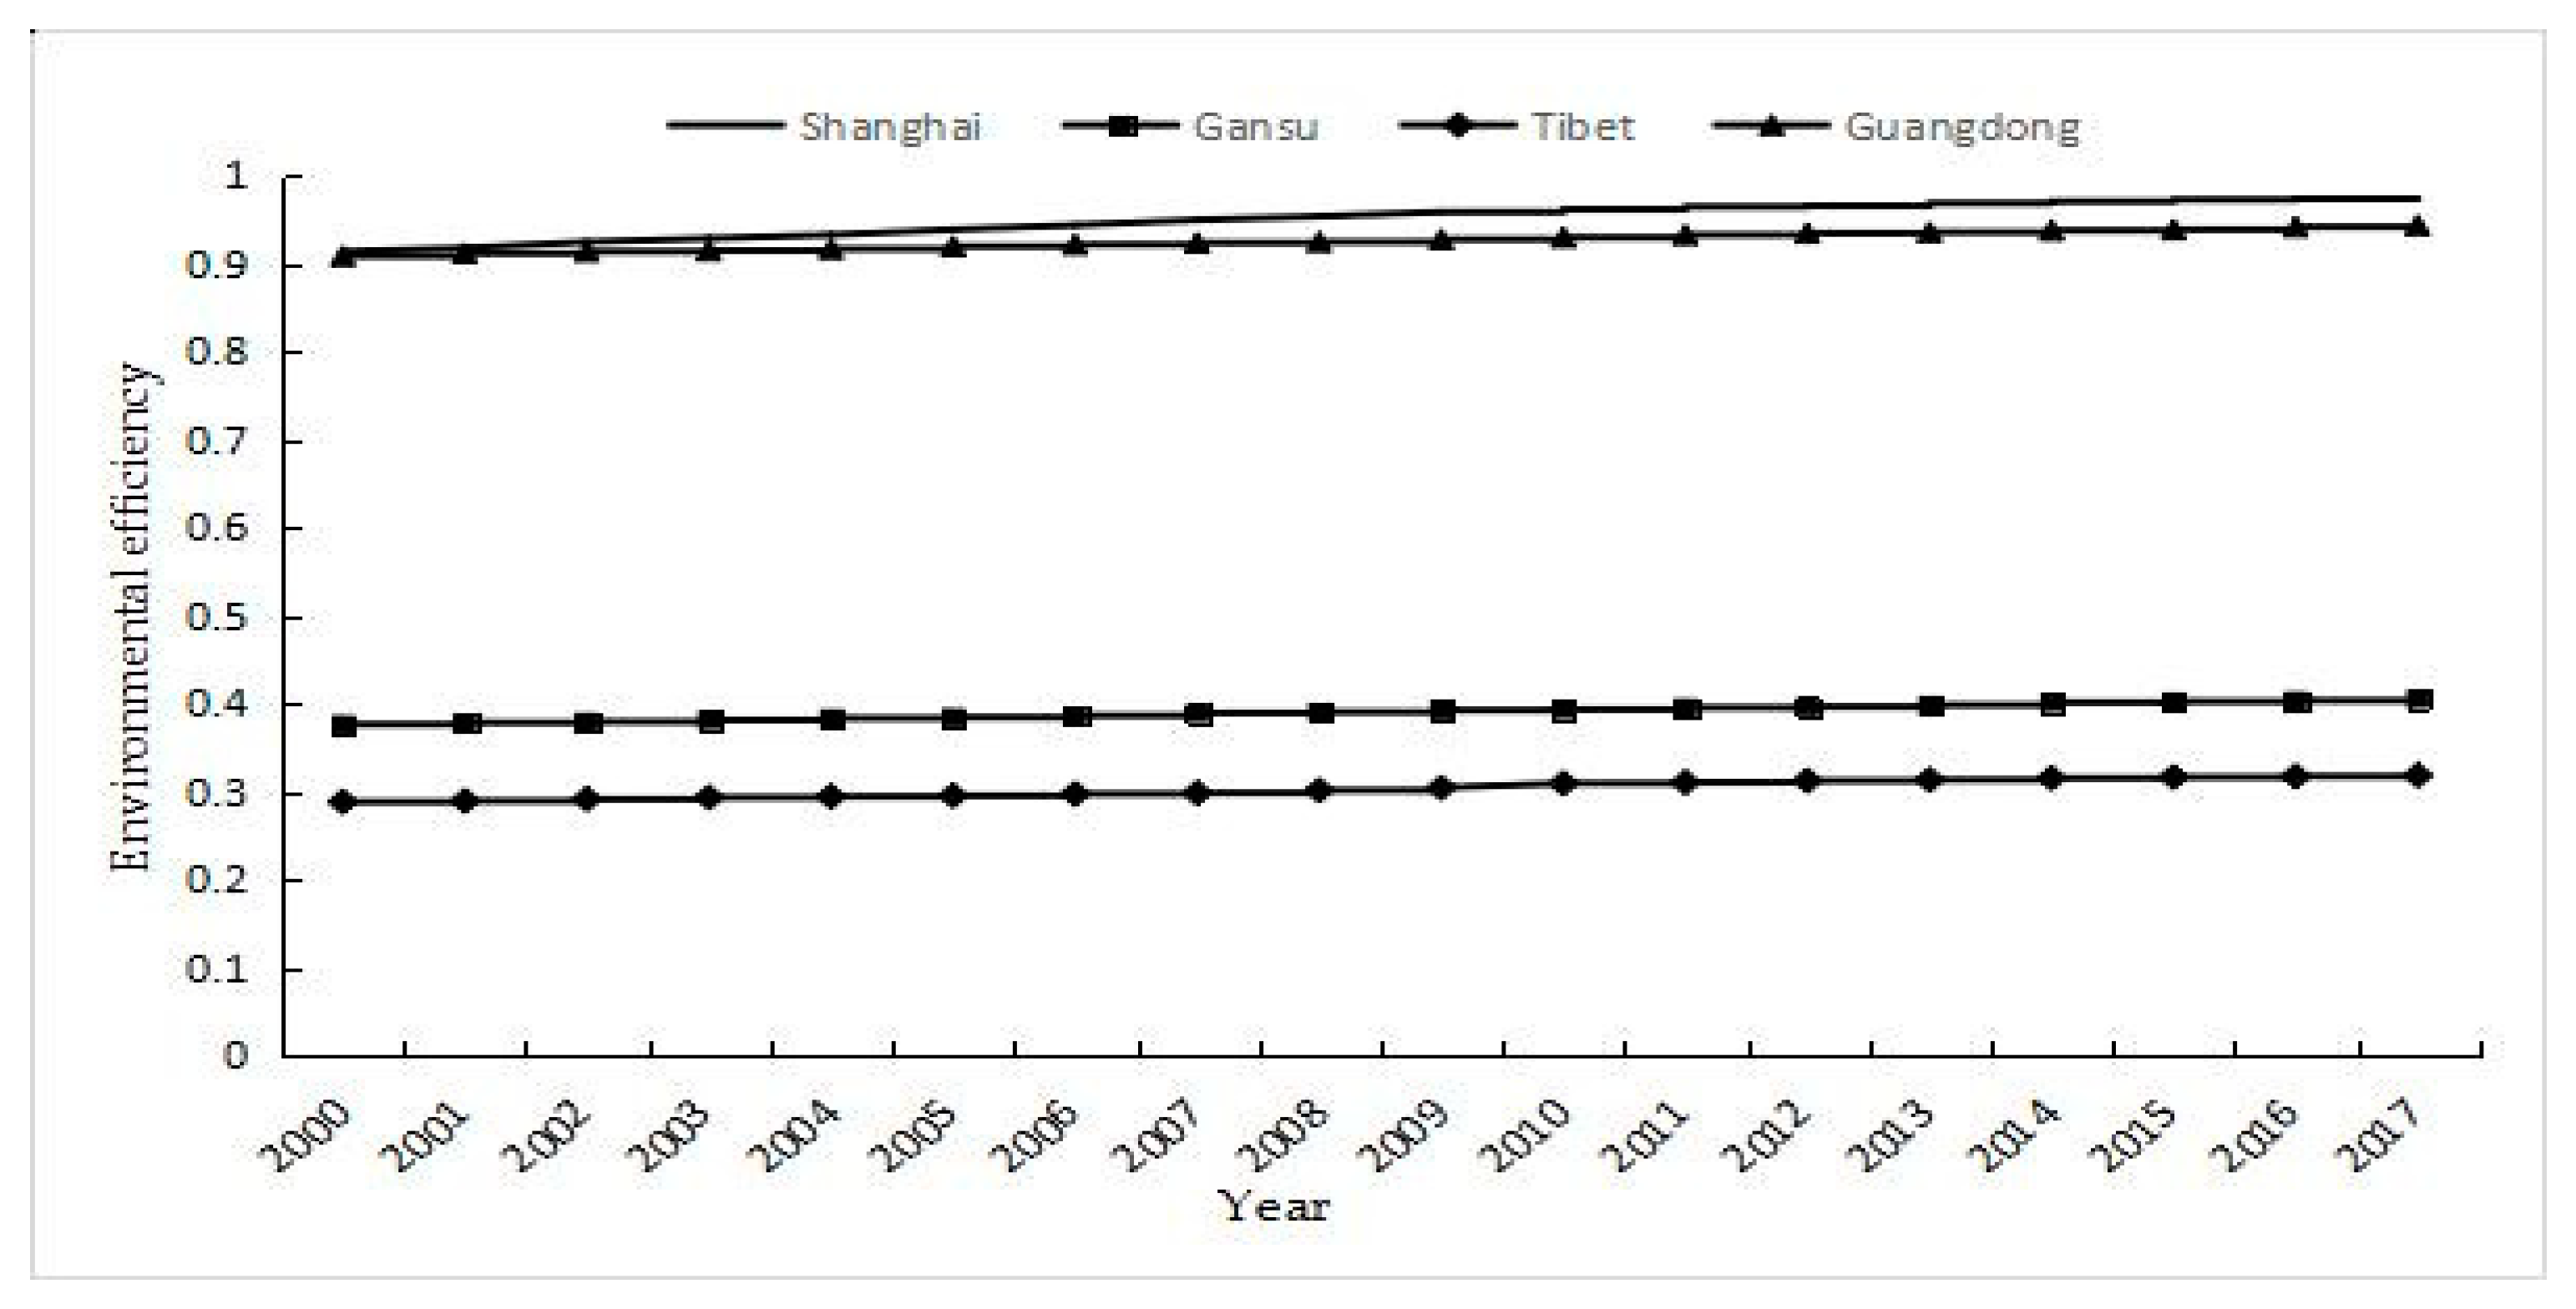
(2) There is a non-equilibrium situation regarding the environmental efficiency in energy consumption across Chinese provinces. In 2000, Shanghai had the highest environmental efficiency in energy consumption (0.913), whereas the Tibet autonomous region had the lowest environmental efficiency in energy consumption (0.288), a difference of 0.657. In 2017, Shanghai still had the highest economic efficiency in energy consumption (0.975), and the Tibet autonomous region still had the lowest value (0.318), a difference of 0.657 (Figure 2). Clearly, this gap is large and could continue to grow.
As far as the provinces are concerned, Beijing, Shanghai, and many southeast coastal provinces, such as Guangdong, generally have a high environmental efficiency in energy consumption, and they represent high-level development zones. By contrast, Qinghai, Tibet, Gansu, and other western provinces generally have a low environmental efficiency in energy consumption, and they represent low-level development zones. In recent years, other scholars also conducted similar studies. For example, Song [52] found that China’s eastern provinces generally have a high environmental efficiency. Chen [40] pointed out that significant differences exist regarding the environmental efficiency across Chinese provinces. Wang [49] concluded that as far as environmental efficiency in energy consumption is concerned, the overall development in China is unbalanced, with a decreasing trend from the east towards the west. It can be seen that, in China, the overall environmental efficiency in energy consumption shows obvious regional differences. Geographically speaking, there is a decreasing pattern from the east towards the west, or from the southeast towards the northwest, which is consistent with the spatial pattern of economic efficiency in energy consumption. Therefore, environmental efficiency is mainly affected by economic efficiency. In other words, regions with high economic efficiency in energy consumption should also have a high environmental efficiency, and vice versa.
4.2. Spatial Autocorrelation Analysis
4.2.1. Economic Efficiency in Energy Consumption
(1) Global spatial autocorrelation
The Global Moran’s I index, as shown in Table 3, was statistically significant. In general, China’s economic efficiency in energy consumption across the provinces displays a positive spatial correlation, with the characteristics of a cluster found at the provincial level. In other words, the economic efficiency in energy consumption is not distributed randomly; conversely, it shows a spatial cluster of high/low values. Provinces with higher economic efficiency in energy consumption tend to be adjacent to each other, whereas provinces with lower economic efficiency in energy consumption tend to be closer to one another. As time goes by, the degree of clustering keeps increasing, indicating that the spatial dependence of economic efficiency in energy consumption is becoming increasingly stronger.
(2) Local spatial autocorrelation
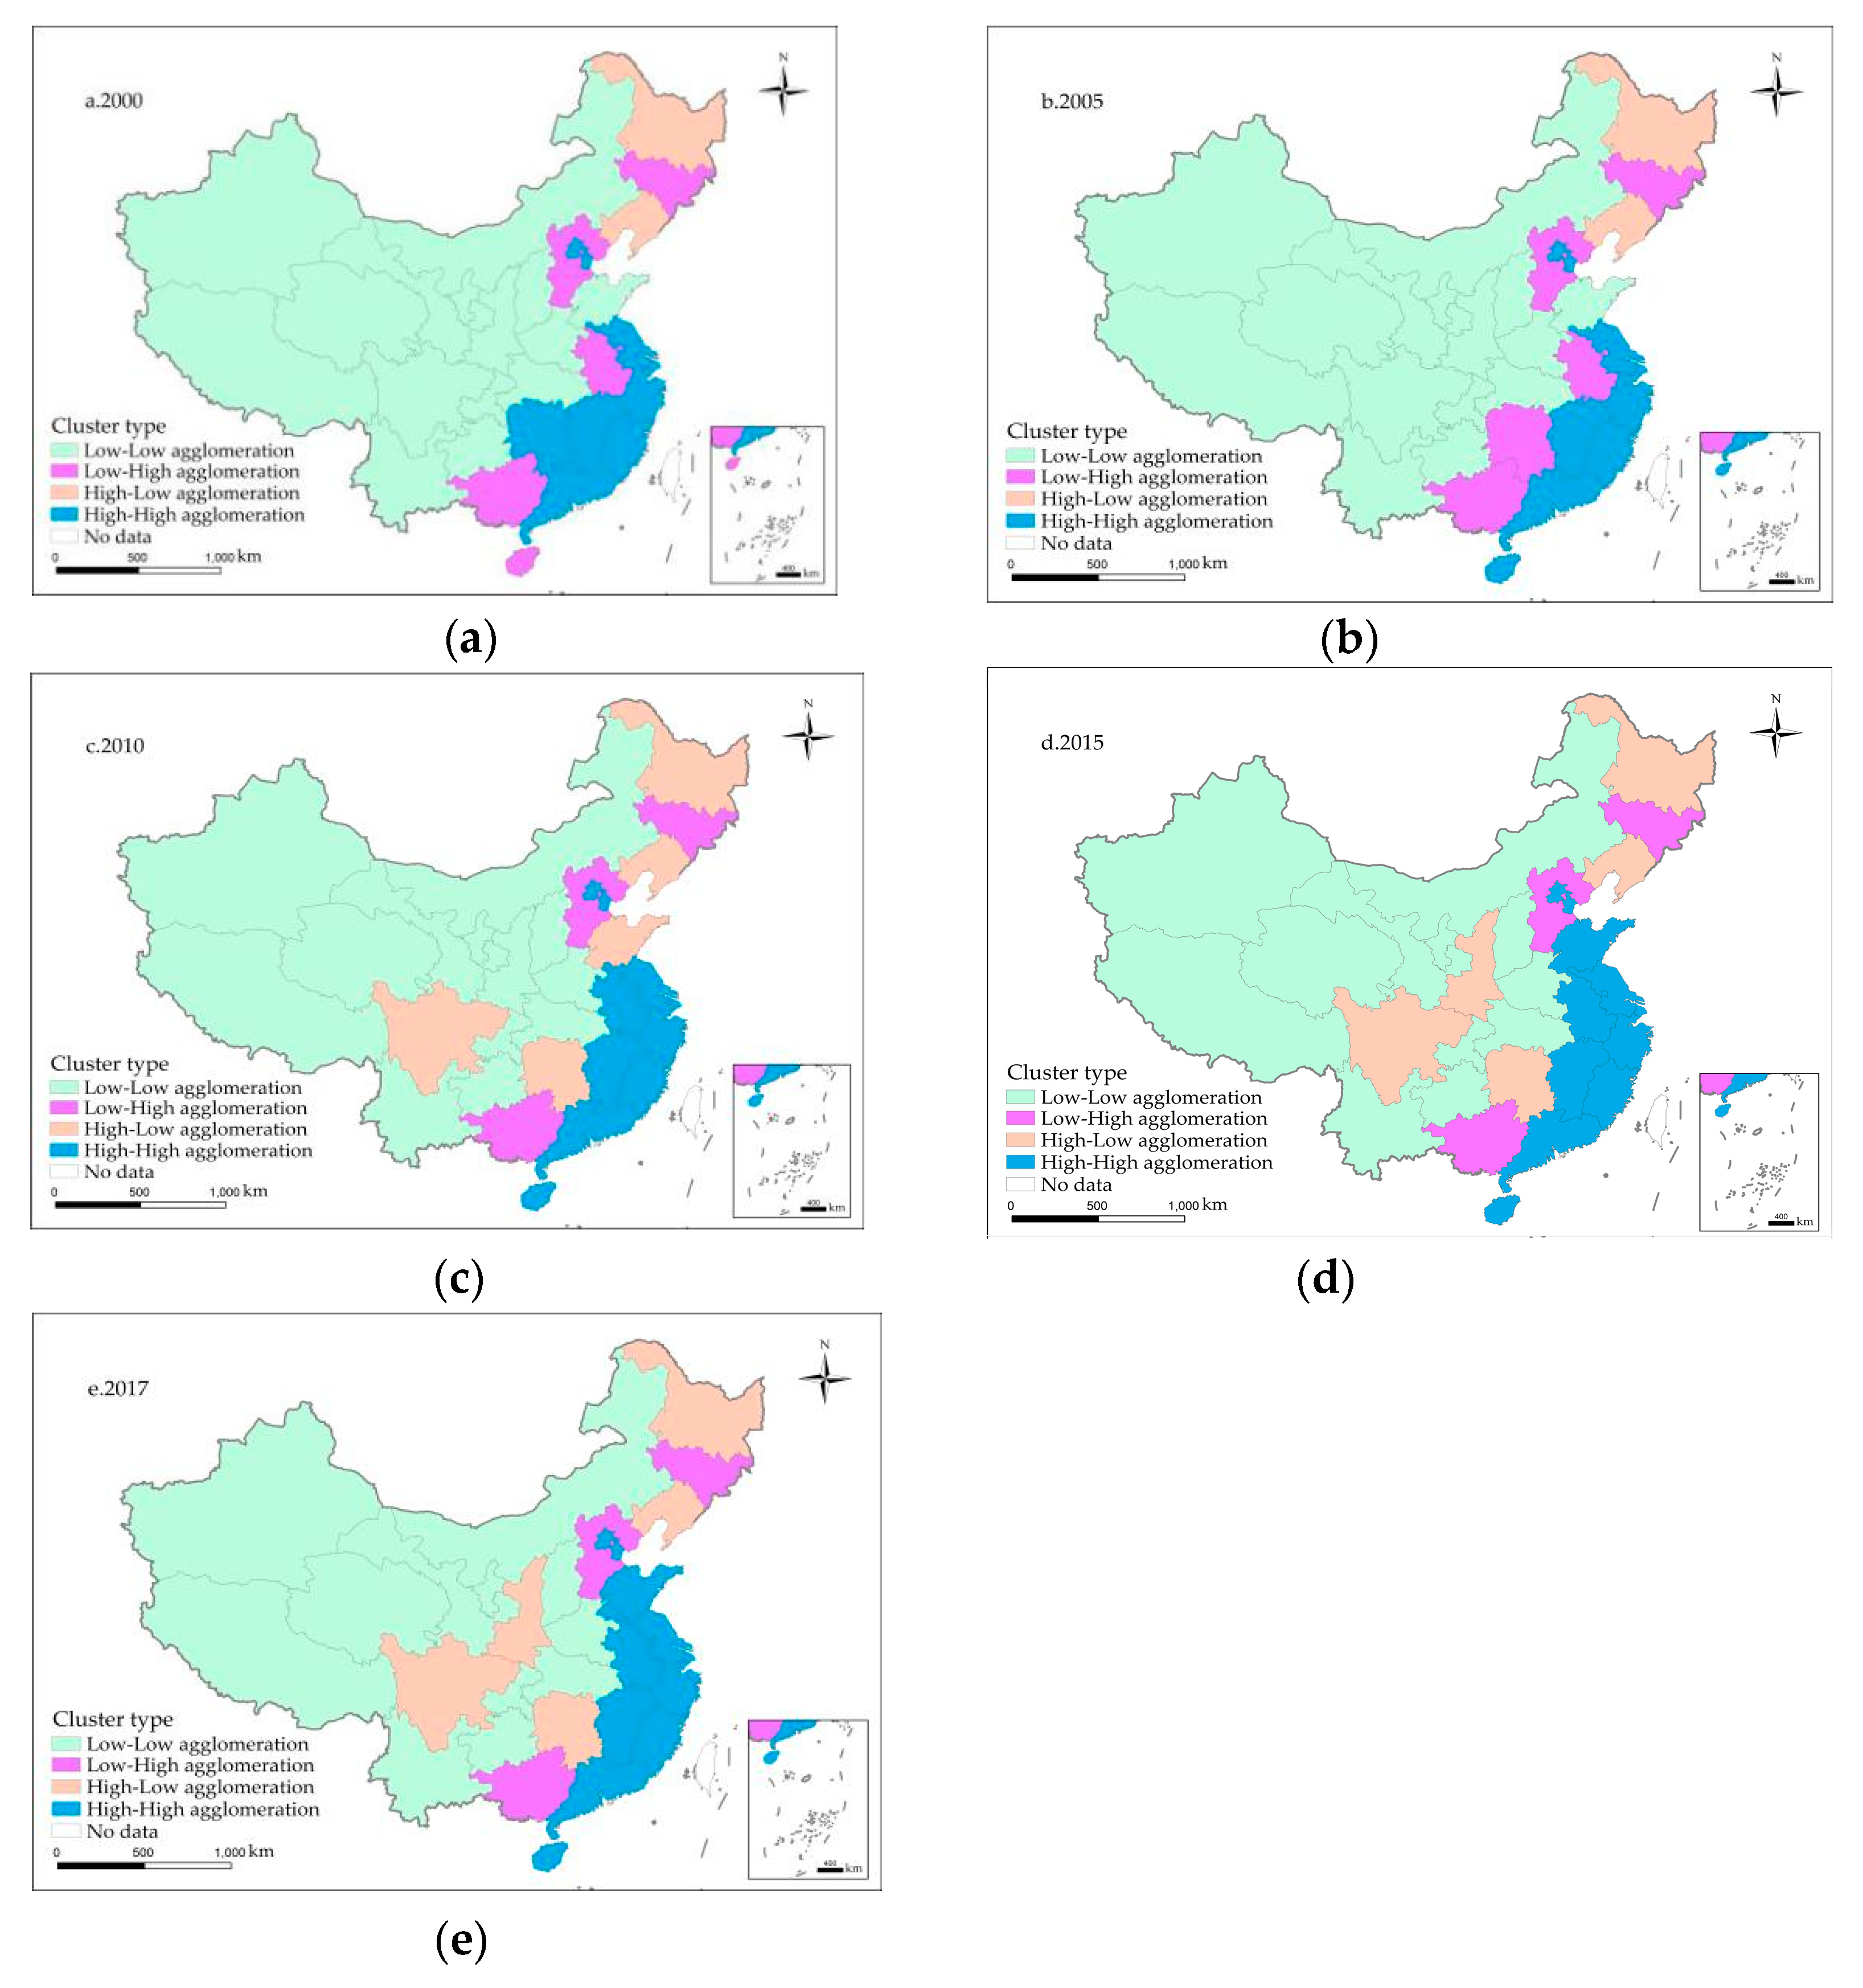
In this study, we chose 2000, 2005, 2010, 2015, and 2017 as five representative years, and conducted a local spatial autocorrelation analysis. The Local Moran’s I index was statistically significant. It can be seen from Figure 3 that the economic efficiency in energy consumption across Chinese provinces displays visible spatial cluster characteristics, accompanied by a strong spatial dependence and heterogeneity. Moreover, there are significant regional differences regarding economic efficiency in energy consumption. Shanghai, Guangdong, Zhejiang, and many other southeast coastal provinces generally maintain a high level of economic growth, representing a spatial cluster of high values. By contrast, Xinjiang, Qinghai, Tibet, and many other western provinces generally maintain a low level of economic growth, representing a spatial cluster of low values. As time goes by, the extent of clustering could become more prominent, accompanied by an increasing spatial cluster of high values and a decreasing spatial cluster of low values. For example, the number of spatial clusters of high values increased from nine in 2000 to 11 in 2017, while the number of spatial clusters of low values decreased from 15 in 2000 to 12 in 2017. In recent years, other scholars have also conducted similar studies, providing more evidence that there is a decrease in the number of spatial clusters of low values. For example, Zhang [45] found that China’s regional energy efficiency displayed a significant spatial autocorrelation and noticeable spatial effects, with a decreasing trend from coastal areas towards inland areas. Tang [46] concluded that China’s economic efficiency in energy consumption is spatially dependent with high heterogeneity. All provinces with a high efficiency belong to eastern zones with high levels of economic growth, whereas midwestern inland areas of China have intermediate or low levels of economic efficiency. It can be seen that China’s economic efficiency in energy consumption displays some visible spatial cluster characteristics. In other words, there is a gradual transition from the east towards the west, or from the southeast towards the northwest, where high-value clusters have transitioned to low-value clusters. Therefore, the location factor plays a critical role in affecting the economic efficiency in energy consumption.
4.2.2. Environmental Efficiency in Energy Consumption
(1) Global spatial autocorrelation
The Global Moran’s I index, as shown in Table 4, was statistically significant. In general, China’s environmental efficiency in energy consumption across the provinces displays a positive spatial correlation, with the characteristics of a cluster found at the provincial level. In other words, the environmental efficiency in energy consumption is not distributed randomly. Conversely, it shows a spatial cluster of high/low values. Provinces with higher environmental efficiency in energy consumption tend to be adjacent to each other, whereas provinces with lower environmental efficiency in energy consumption tend to be closer to one another.
(2) Local spatial autocorrelation
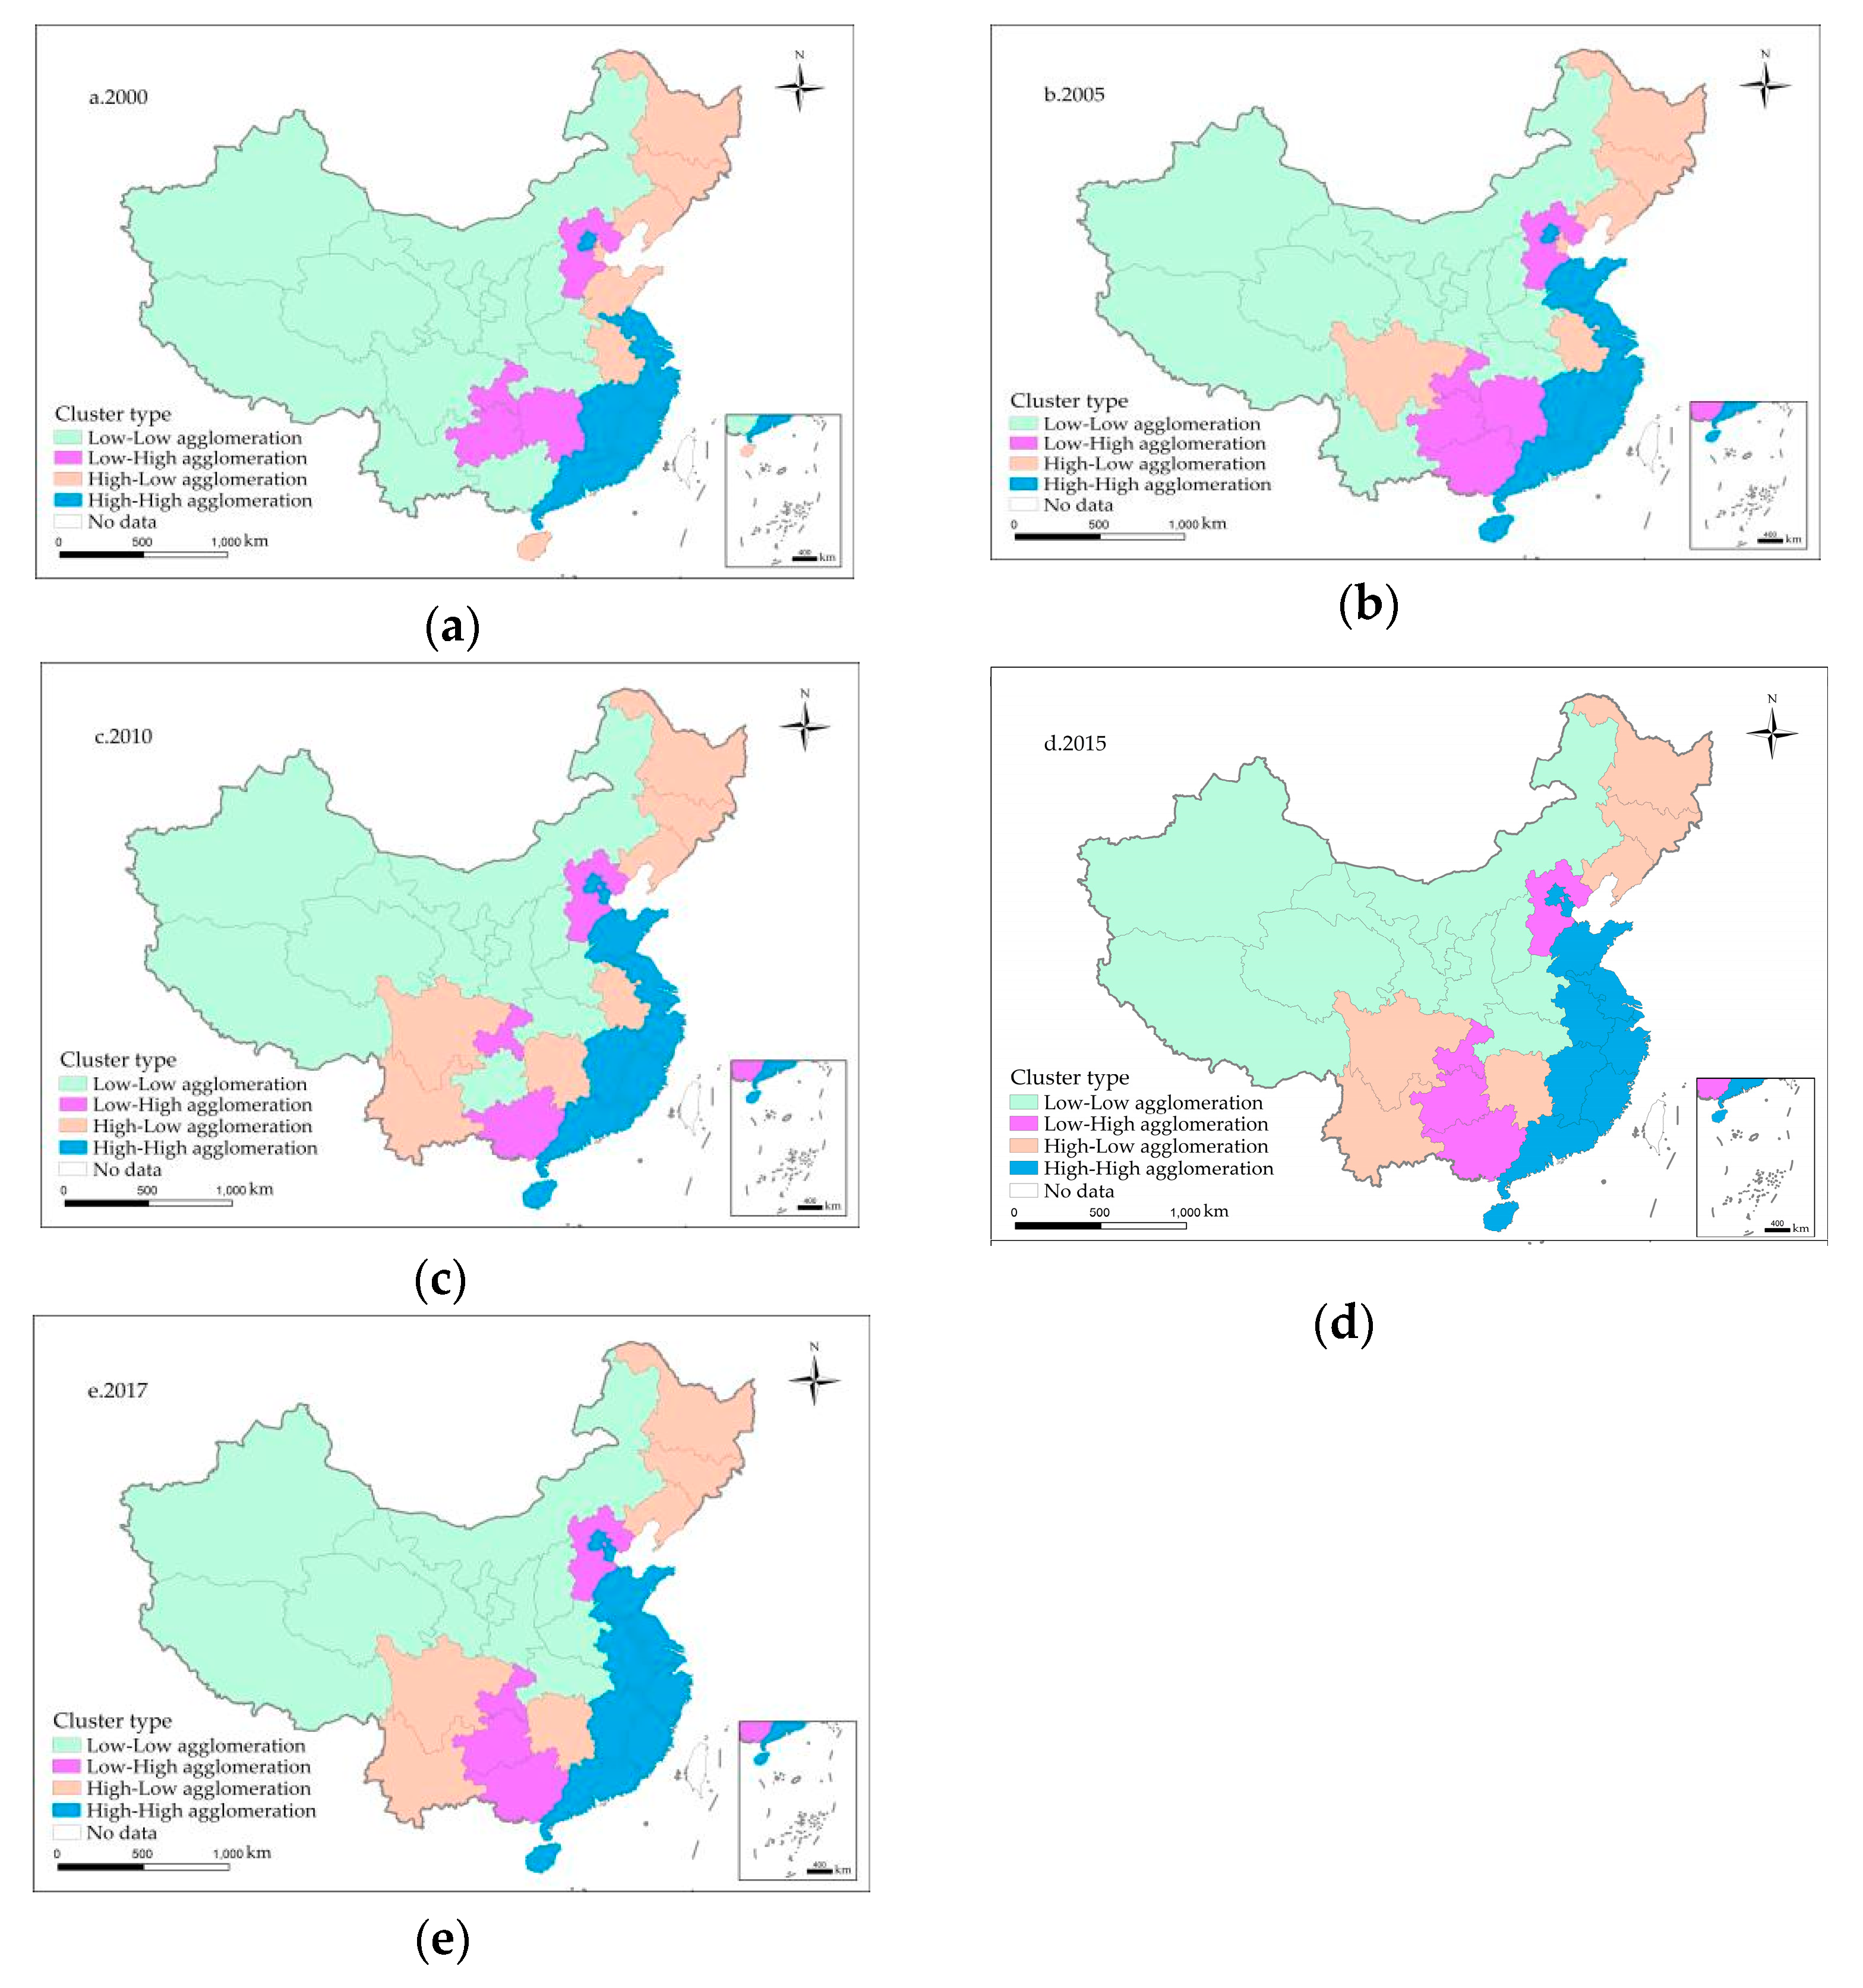
In this study, we chose 2000, 2005, 2010, 2015, and 2017 as five representative years, and conducted a local spatial autocorrelation analysis. The Local Moran’s I index was statistically significant. It can be seen from Figure 4 that China’s environmental efficiency in energy consumption across the provinces generally displays a robust spatial autocorrelation and visible spatial cluster characteristics. Shanghai, Guangdong, Fujian, and many other southeast coastal provinces generally display a high environmental efficiency in energy consumption, representing spatial clusters of high values. By contrast, Xinjiang, Qinghai, Gansu and many other western provinces generally display a low environmental efficiency in energy consumption, representing spatial clusters of low values. As time goes by, the extent of clustering could become more prominent, accompanied by an increasing spatial cluster of high values and a decreasing spatial cluster of low values. For example, the number of spatial clusters of high values increased from seven in 2000 to 11 in 2017, while the number of spatial clusters of low values decreased from 13 in 2000 to 10 in 2017. In recent years, other scholars have also conducted similar studies, providing more evidence that there is a decrease in the number of spatial clusters of low values. For example, Huang [15] found that China’s regional environmental efficiency in energy consumption displayed significant spatial differences, with a decreasing trend from the east towards the west; furthermore, there were obvious spatial non-equilibrium features. Wu [53] also concluded that China’s environmental efficiency in energy consumption displayed significant regional differences and spatial correlations, showing a gradual reduction in development patterns along the east-central-northwest-west geographic gradient. It can be seen that China’s environmental efficiency in energy consumption displays some obvious spatial cluster characteristics. In other words, there is a gradual transition from the east towards the west, or from the southeast towards the northwest, where high-value clusters have transitioned to low-value clusters. Such spatial distribution characteristics of environmental efficiency are similar to that of economic efficiency, as the location factor plays a critical role in affecting the environmental efficiency in energy consumption.
5. Conclusions
The economic-environmental efficiency in energy consumption displays a positive correlation, which is manifested as a parallel and synchronizing relationship. On the one hand, when the economic efficiency in energy consumption is high, the corresponding environmental efficiency is also high, and vice versa. On the other hand, as the economic efficiency in energy consumption increases, so does the corresponding environmental efficiency and vice versa.
At a national level, China’s economic and environmental efficiency in energy consumption is generally on the rise, but the rate of economic efficiency, environmental efficiency, and the overall development level show some discrepancies. For example, economic efficiency is higher than environmental efficiency, which is consistent with China’s actual development. At the provincial level, there are obvious regional differences regarding economic and environmental efficiency in energy consumption across the provinces, with a descending pattern from the east towards the west, or from the southeast towards the northwest.
For China’s various provinces, the economic efficiency and environmental efficiency in energy consumption display a positive spatial correlation, as well as a robust spatial dependence and heterogeneity. The economic and environmental efficiency in energy consumption is not distributed randomly; conversely, it shows a spatial cluster of high/low values. The eastern coastal area of China represents a spatial cluster of high values, whereas the midwestern inland area of China represents a spatial cluster of low values. China’s economic efficiency and environmental efficiency in energy consumption display some visible spatial cluster characteristics as far as a spatial distribution pattern is concerned, with a spatial cluster of high values transitioning to a spatial cluster of low values from the east towards the west, or from the southeast towards the northwest. As time goes by, the extent of clustering could become more prominent, accompanied by an increasing spatial cluster of high values and a decreasing spatial cluster of low values.
China needs to improve its energy consumption efficiency further and promote sustainable energy transformations. First, regional cooperation needs to be strengthened in order to enhance the diffusion capacity of the eastern coastal area of China with a higher energy consumption efficiency. Consequently, the energy consumption efficiency in surrounding areas could be guided and improved, spatial differences could be narrowed, and an overall improvement in multiple areas could be achieved simultaneously. Second, certain ‘tilt’ policies designed for the central and western regions of China with a lower energy consumption efficiency could help accelerate industrial restructuring, strengthen investments in capital and technology, and enhance environmental protection. As a result, their energy consumption efficiency could be improved effectively, and the overall level of China’s energy consumption efficiency could be enhanced dramatically. Third, China’s energy structure needs to be further optimized and adjusted, and the proportion of “green” components in energy consumption and economic growth needs to be increased, thereby improving the energy consumption efficiency and promoting the coordinated development of economic and environmental efficiency in energy consumption.
Author Contributions
C.L. and B.X. designed the study and wrote the paper. P.M. and X.Z. analyzed the data. L.J. and Z.Z. contributed to data collection and processing. All authors read and approved the manuscript.
Funding
This research was funded by [National Natural Science Foundation of China] grant number [41561110], [41261112], [41661150], [41471116], [41701142]; by [Science and Research Program in colleges and universities of Gansu Province] grant number [2018F-05]; by [Science and Technology Support Program of Gansu Province] grant number [1304FKCA067]. We appreciate the support from the German BMBF Kopernikus Project for the Energy Transition-Thematic Field No. 4 “System Integration and Networks for the Energy Supply” (ENavi), and special thanks go to the Youth Innovation Promotion Association CAS (2016181).
Acknowledgments
Thanks for the anonymous reviewers and all the editors in the process of revision.
Conflicts of Interest
The authors declare no conflict of interest.
References
- Zhao, X.Y.; Zhao, H.L.; Jiang, L.; Lu, C.Y.; Xue, B. The Influence of Farmers’ Livelihood Strategies on Household Energy Consumption in the Eastern Qinghai–Tibet Plateau, China. Sustainability 2018, 10, 1780. [Google Scholar] [CrossRef]
- Lu, C.Y.; Li, W.L.; Pang, M.; Xue, B.; Miao, H. Quantifying the Economy-Environment Interactions in Tourism: Case of Gansu Province, China. Sustainability 2018, 10, 711. [Google Scholar] [CrossRef]
- Zhang, Z.L.; Wang, K.Y.; Chen, X.P. The relationship between Ecological Efficiency Evolution and Environmental Regulation in China-based on SBM Model and Interprovincial Panel data estimation. Econ. Weky. 2015, 32, 126–131. (In Chinese) [Google Scholar]
- Sheng, C.H.; Cao, Y.; Xue, B. Residential Energy Sustainability in China and Germany: The Impact of National Energy Policy System. Sustainability 2018, 10, 4535. [Google Scholar] [CrossRef]
- Xu, S.T. Spatiotemporal Evolution and Influencing Factors of Energy Ecological Efficiency in China. Ph.D. Thesis, Liaoning Normal University, Dalian, China, 2016. (In Chinese). [Google Scholar]
- Jimenez, R.; Mercado, J. Energy Intensity: A Decomposition and Counterfactual Exercise for Latin American Countries. Energy Econ 2014, 42, 161–171. [Google Scholar] [CrossRef]
- Filippini, M.; Hunt, L.C. ‘Underlying Energy Efficiency’ in the US, CER-ETH Economics Working Paper Series. 2013; Volume 10, 2139.
- Proskuryakova, L.; Kovalev, A. Measuring energy efficiency: Is energy intensity a good evidence base? Appl. Energy 2015, 138, 450–459. [Google Scholar] [CrossRef]
- Gökgöz, F.; Güvercin, M.T. Energy security and renewable energy efficiency in EU. Renew. Sustain. Energy Rev. 2018, 96, 226–239. [Google Scholar] [CrossRef]
- Simsek, N. Energy Efficiency with Undesirable Output at the Economy-Wide level: Cross Country Comparison in OECD sample. Am. J. Energy Res. 2014, 2, 9–17. [Google Scholar] [CrossRef]
- Borozan, D. Technical and total factor energy efficiency of European regions: A two-stage approach. Energy 2018, 152, 521–532. [Google Scholar] [CrossRef]
- Wrigley, K.; Crawford, R.H. Identifying policy solutions for improving the energy efficiency of rental properties. Energy Policy 2017, 108, 369–378. [Google Scholar] [CrossRef]
- Huang, J.B.; Du, D.; Hao, Y. The driving forces of the change in China’s energy intensity: An empirical research using DEA-Malmquist and spatial panel estimations. Econ. Model. 2017, 65, 41–50. [Google Scholar] [CrossRef]
- Guan, W.; Xu, S.T. Spatial pattern and spatial effect of China’s energy ecological efficiency. J. Geogr. 2015, 70, 980–992. (In Chinese) [Google Scholar]
- Huang, J. Spatial correlation network structure of energy and environmental efficiency in China and its influencing factors. Resour. Sci. 2018, 40, 759–772. (In Chinese) [Google Scholar]
- Suzuki, S.; Nijkamp, P. An evaluation of energy-environment-economic efficiency for EU, APEC and ASEAN countries: Design of a Target-Oriented DFM model with fixed factors in Data Envelopment Analysis. Energy Policy 2016, 88, 100–112. [Google Scholar] [CrossRef]
- Jebali, E.; Hédi, E.; Khraief, N. The analysis of energy efficiency of the Mediterranean countries: A two-stage double bootstrap DEA approach. Energy 2017, 134, 991–1000. [Google Scholar] [CrossRef]
- Wang, T.; Yan, L.; Yi, M. Evaluation of energy ecological efficiency in China. Macroecon. Res. 2017, 7, 149–157. (In Chinese) [Google Scholar]
- Bhat, J.A.; Haider, S.; Kamaiah, B. Interstate energy efficiency of Indian paper industry: A slack-based non-parametric approach. Energy 2018, 161, 284–298. [Google Scholar] [CrossRef]
- Ghiyasi, M. Industrial sector environmental planning and energy efficiency of Iranian provinces. J. Clean. Prod. 2017, 142, 2328–2339. [Google Scholar] [CrossRef]
- Ruizfuensanta, M.J. The region matters: A comparative analysis of regional energy efficiency in Spain. Energy 2016, 101, 325–331. [Google Scholar] [CrossRef]
- Martínez, C.I.; William, H.; Piña, A. Regional analysis across Colombian departments: A non-parametric study of energy use. J. Clean. Prod. 2016, 115, 130–138. [Google Scholar] [CrossRef]
- Xu, H.; Bai, X.Y.; Cheng, S.Q.; Ma, G.Q. Comparative study on total factor energy efficiency of silk road economic belt. Ecol. Econ. 2018, 34, 44–49. (In Chinese) [Google Scholar]
- Zhang, N.; Fang, Z.G. Study on regional differences in total factor energy efficiency and its influencing factors in Xinjiang. Sci. Technol. Manag. Res. 2015, 9, 90–93. (In Chinese) [Google Scholar]
- Sağlam, U. A two-stage data envelopment analysis model for efficiency assessments of 39 state’s wind power in the United States. Energy Convers. Manag. 2017, 146, 52–67. [Google Scholar] [CrossRef]
- Wu, C.Q.; Dong, X. Study on total factor energy efficiency of the Yangtze river economic belt under environmental constraints. China Soft Sci. 2016, 3, 73–83. (In Chinese) [Google Scholar]
- Qin, Q.D.; Li, X.; Chen, X.D.; Li, L. Study on energy efficiency in China’s eastern coastal areas considering unexpected output. Sci. Technol. Manag. Stud. 2016, 36, 54–58. (In Chinese) [Google Scholar]
- Poggi, F.; Firmino, A.; Amado, M. Assessing energy performances: A step toward energy efficiency at the municipal level. Sustain. Cities Soc. 2017, 33, 57–69. [Google Scholar] [CrossRef]
- Mohseni, P.; Borghei, A.M.; Khanali, M. Coupled life cycle assessment and data envelopment analysis for mitigation of environmental impacts and enhancement of energy efficiency in grape production. J. Clean. Prod. 2018, 197, 937–947. [Google Scholar] [CrossRef]
- Raheli, H.; Rezaei, R.M.; Jadidi, M.R. A two-stage DEA model to evaluate sustainability and energy efficiency of tomato production. Inf. Process. Agric. 2017, 4, 342–350. [Google Scholar] [CrossRef]
- Goto, M.; Otsuka, A.; Sueyoshi, T. DEA (Data Envelopment Analysis) assessment of operational and environmental efficiencies on Japanese regional industries. Energy 2014, 66, 535–549. [Google Scholar] [CrossRef]
- Zhang, Q.; Song, H.; Wang, Y.L. Total factor energy efficiency analysis of jiangsu province based on DEA model. Land Nat. Resour. Res. 2018, 1, 59–61. (In Chinese) [Google Scholar]
- Jiang, C. Research on Energy Efficiency Measurement of Resource-Based Cities Based on Full Factor Framework. Ph.D. Thesis, China University of Geosciences, Beijing, China, 2017. (In Chinese). [Google Scholar]
- Imran, M.; Özçatalbaş, O.; Bashir, M.K. Estimation of energy efficiency and greenhouse gas emission of cotton crop in South Punjab, Pakistan. J. Saudi Soc. Agric. Sci. 2018, in press. [Google Scholar] [CrossRef]
- Sun, X.M.; Wang, G.; Dong, H.Z.; Zhang, H. Study on carbon Emission efficiency and influencing factors of Resource-Based cities based on DEA and SE-SBM Model. Res. Sci. Technol. Manag. 2016, 36, 78–84. (In Chinese) [Google Scholar]
- Huang, H.F.; Ge, L.; Wang, M.C. An Analysis of the Energy efficiency of Urban Total element in China. Urban Issues 2015, 8, 53–60. (In Chinese) [Google Scholar]
- Ewertowska, A.; Galán-Martín, A.; Guillén-Gosálbez, G.; Gavaldá, J.; Jiménez, L. Assessment of the environmental efficiency of the electricity mix of the top European economies via data envelopment analysis. J. Clean. Prod. 2016, 116, 13–22. [Google Scholar] [CrossRef]
- Fang, J.C.; Liu, L.X.; Wan, Q. Regional differences in total factor energy efficiency in China. China Mark. 2015, 34, 10–14. (In Chinese) [Google Scholar]
- Yang, T.; Chen, W.; Zhou, K.L.; Ren, M.L. Regional energy efficiency evaluation in China: A super efficiency slack-based measure model with undesirable outputs. J. Clean. Prod. 2018, 198, 859–866. [Google Scholar] [CrossRef]
- Chen, L.; Jia, G.Z. Environmental efficiency analysis of China’s regional industry: A data envelopment analysis (DEA) based approach. J. Clean. Prod. 2017, 142, 846–853. [Google Scholar] [CrossRef]
- Zhu, D.M.; Zhao, H.B. Regional difference analysis of China’s energy environmental efficiency under environmental constraints. Nanjing Soc. Sci. 2016, 4, 15–23. (In Chinese) [Google Scholar]
- Cao, Q.; Fan, M.T. Study on interprovincial energy efficiency rating in China-empirical analysis based on multi-ordered Probit model. Shanghai Econ. Res. 2016, 2, 72–81. (In Chinese) [Google Scholar]
- Huang, Y.Y.; Yan, Q.W.; Zhang, C.R. Spatial–Temporal Distribution Characteristics of PM2.5 in China in 2016. J. Geovis. Spat. Anal. 2018, 2. [Google Scholar] [CrossRef]
- Ghosh, K.G. Analysis of Rainfall Trends and its Spatial Patterns During the Last Century over the Gangetic West Bengal, Eastern India. J. Geovis. Spat. Anal. 2018, 2. [Google Scholar] [CrossRef]
- Zhang, W.; Pan, X.F.; Yan, Y.B.; Pan, X.Y. Convergence analysis of regional energy efficiency in china based on large-dimensional panel data model. J. Clean. Prod. 2017, 142, 801–808. [Google Scholar] [CrossRef]
- Tang, H.B. Study on Spatial Measurement of Regional Energy Economic Efficiency Association and Its Influencing Factors in China. Master’s Thesis, Chongqing Normal University, Chongqing, China, 2017. (In Chinese). [Google Scholar]
- Zhao, N.; Wang, X.R.; Zhu, W.J. Study on convergence of China’s inter-provincial energy efficiency. Stat. Stud. 2015, 32, 29–35. (In Chinese) [Google Scholar]
- Sun, J.S.; Li, G.; Wang, Z.H. Optimizing China’s energy consumption structure under energy and carbon constraints. Struct. Chang. Econ. Dyn. 2018, in press. [Google Scholar] [CrossRef]
- Wang, K.; Yu, S.W.; Zhang, W. China’s regional energy and environmental efficiency: A DEA window analysis based dynamic evaluation. Math. Comput. Model. 2018, 58, 1117–1127. [Google Scholar] [CrossRef]
- Zhao, X.L.; Yang, R.; Ma, Q. China’s total factor energy efficiency of provincial industrial sectors. Energy 2014, 65, 52–61. [Google Scholar]
- Yang, L.; Ouyang, H.; Fang, K.N.; Ye, L.L.; Zhang, J. Evaluation of regional environmental efficiencies in China based on super-efficiency-DEA. Ecol. Indic. 2018, 51, 13–19. [Google Scholar] [CrossRef]
- Song, M.L.; Peng, J.; Wang, J.L.; Zhao, J.J. Environmental efficiency and economic growth of China: A Ray slack-based model analysis. Eur. J. Oper. Res. 2018, 269, 51–63. [Google Scholar] [CrossRef]
- Wu, X.X. Regional differences in energy and environmental efficiency under the pressure of energy conservation and emission reduction and their influencing mechanism. Ecol. Econ. 2018, 34, 49–56. (In Chinese) [Google Scholar]
Figure 1.
Economic efficiency comparison in Guangdong, Shanghai, Qinghai, and Tibet.

Figure 2.
Efficiency comparison of energy consumption in Guangdong, Shanghai, Qinghai, and Tibet.

Figure 3.
Correlation of economic efficiency in energy consumption in China.

Figure 4.
Correlation of environmental efficiency in energy consumption in China.


Table 1.
Economic efficiency in energy consumption between 2000 and 2017 for China’s 31 provinces.
| Province | Year | ||||||||
|---|---|---|---|---|---|---|---|---|---|
| 2000 | 2001 | 2002 | 2003 | 2004 | 2005 | 2006 | 2007 | 2008 | |
| Beijing | 0.955 | 0.956 | 0.957 | 0.959 | 0.961 | 0.964 | 0.966 | 0.969 | 0.970 |
| Tianjin | 0.822 | 0.826 | 0.830 | 0.833 | 0.839 | 0.844 | 0.845 | 0.847 | 0.847 |
| Hebei | 0.559 | 0.557 | 0.560 | 0.564 | 0.589 | 0.608 | 0.614 | 0.628 | 0.624 |
| Shanxi | 0.517 | 0.526 | 0.531 | 0.539 | 0.562 | 0.571 | 0.570 | 0.581 | 0.583 |
| Inner Mongolia | 0.585 | 0.583 | 0.585 | 0.587 | 0.589 | 0.594 | 0.596 | 0.597 | 0.601 |
| Liaoning | 0.882 | 0.886 | 0.884 | 0.889 | 0.891 | 0.896 | 0.897 | 0.896 | 0.899 |
| Jilin | 0.687 | 0.670 | 0.675 | 0.677 | 0.691 | 0.721 | 0.728 | 0.731 | 0.739 |
| Heilongjiang | 0.721 | 0.726 | 0.727 | 0.735 | 0.739 | 0.742 | 0.751 | 0.759 | 0.767 |
| Shanghai | 0.962 | 0.963 | 0.962 | 0.964 | 0.965 | 0.968 | 0.970 | 0.971 | 0.971 |
| Jiangsu | 0.798 | 0.799 | 0.802 | 0.806 | 0.814 | 0.819 | 0.818 | 0.820 | 0.821 |
| Zhejiang | 0.786 | 0.788 | 0.787 | 0.789 | 0.801 | 0.801 | 0.804 | 0.811 | 0.818 |
| Anhui | 0.688 | 0.689 | 0.692 | 0.694 | 0.699 | 0.702 | 0.709 | 0.716 | 0.721 |
| Fujian | 0.793 | 0.810 | 0.823 | 0.836 | 0.850 | 0.862 | 0.871 | 0.879 | 0.881 |
| Jiangxi | 0.661 | 0.668 | 0.673 | 0.678 | 0.682 | 0.684 | 0.689 | 0.690 | 0.698 |
| Shandong | 0.643 | 0.649 | 0.651 | 0.657 | 0.658 | 0.662 | 0.667 | 0.669 | 0.670 |
| Henan | 0.639 | 0.641 | 0.649 | 0.650 | 0.653 | 0.654 | 0.655 | 0.657 | 0.657 |
| Hubei | 0.628 | 0.629 | 0.629 | 0.631 | 0.632 | 0.634 | 0.636 | 0.641 | 0.644 |
| Hunan | 0.657 | 0.657 | 0.659 | 0.660 | 0.662 | 0.664 | 0.667 | 0.668 | 0.670 |
| Guangdong | 0.971 | 0.974 | 0.978 | 0.979 | 0.981 | 0.984 | 0.985 | 0.987 | 0.988 |
| Guangxi | 0.671 | 0.672 | 0.673 | 0.675 | 0.674 | 0.676 | 0.679 | 0.680 | 0.682 |
| Hainan | 0.898 | 0.899 | 0.901 | 0.907 | 0.909 | 0.913 | 0.914 | 0.916 | 0.919 |
| Chongqing | 0.679 | 0.681 | 0.680 | 0.682 | 0.684 | 0.685 | 0.687 | 0.688 | 0.690 |
| Sichuan | 0.539 | 0.543 | 0.549 | 0.551 | 0.559 | 0.563 | 0.567 | 0.569 | 0.572 |
| Guizhou | 0.473 | 0.474 | 0.476 | 0.477 | 0.476 | 0.479 | 0.480 | 0.482 | 0.483 |
| Yunnan | 0.549 | 0.550 | 0.553 | 0.554 | 0.559 | 0.560 | 0.561 | 0.563 | 0.564 |
| Tibet | 0.301 | 0.302 | 0.304 | 0.305 | 0.308 | 0.310 | 0.311 | 0.313 | 0.314 |
| Shanxi | 0.481 | 0.482 | 0.481 | 0.483 | 0.486 | 0.488 | 0.489 | 0.493 | 0.494 |
| Gansu | 0.460 | 0.461 | 0.463 | 0.468 | 0.469 | 0.471 | 0.472 | 0.475 | 0.476 |
| Qinghai | 0.426 | 0.427 | 0.428 | 0.426 | 0.428 | 0.429 | 0.431 | 0.432 | 0.434 |
| Ningxia | 0.453 | 0.457 | 0.458 | 0.460 | 0.461 | 0.462 | 0.464 | 0.467 | 0.468 |
| Xinjiang | 0.438 | 0.439 | 0.441 | 0.442 | 0.443 | 0.444 | 0.447 | 0.449 | 0.450 |
| Average | 0.6566 | 65.1928 | 65.2260 | 65.262 | 65.299 | 0.6583 | 65.371 | 65.406 | 65.441 |
| Province | Year | ||||||||
| 2009 | 2010 | 2011 | 2012 | 2013 | 2014 | 2015 | 2016 | 2017 | |
| Beijing | 0.971 | 0.979 | 0.980 | 0.980 | 0.981 | 0.983 | 0.984 | 0.987 | 0.988 |
| Tianjin | 0.850 | 0.852 | 0.857 | 0.855 | 0.861 | 0.869 | 0.874 | 0.879 | 0.882 |
| Hebei | 0.687 | 0.752 | 0.752 | 0.761 | 0.770 | 0.786 | 0.793 | 0.801 | 0.802 |
| Shanxi | 0.594 | 0.615 | 0.624 | 0.629 | 0.647 | 0.650 | 0.662 | 0.667 | 0.674 |
| Inner Mongolia | 0.614 | 0.627 | 0.630 | 0.638 | 0.647 | 0.658 | 0.663 | 0.671 | 0.710 |
| Liaoning | 0.904 | 0.911 | 0.915 | 0.918 | 0.921 | 0.925 | 0.928 | 0.930 | 0.931 |
| Jilin | 0.747 | 0.753 | 0.759 | 0.766 | 0.770 | 0.738 | 0.824 | 0.828 | 0.830 |
| Heilongjiang | 0.775 | 0.783 | 0.791 | 0.791 | 0.796 | 0.805 | 0.810 | 0.814 | 0.816 |
| Shanghai | 0.972 | 0.973 | 0.976 | 0.977 | 0.979 | 0.982 | 0.986 | 0.989 | 0.991 |
| Jiangsu | 0.824 | 0.825 | 0.829 | 0.830 | 0.835 | 0.841 | 0.849 | 0.850 | 0.851 |
| Zhejiang | 0.826 | 0.837 | 0.841 | 0.848 | 0.856 | 0.864 | 0.872 | 0.876 | 0.878 |
| Anhui | 0.727 | 0.731 | 0.738 | 0.746 | 0.749 | 0.756 | 0.764 | 0.768 | 0.770 |
| Fujian | 0.890 | 0.896 | 0.896 | 0.899 | 0.904 | 0.909 | 0.914 | 0.917 | 0.918 |
| Jiangxi | 0.705 | 0.709 | 0.716 | 0.721 | 0.725 | 0.729 | 0.734 | 0.736 | 0.737 |
| Shandong | 0.673 | 0.678 | 0.680 | 0.684 | 0.689 | 0.711 | 0.724 | 0.725 | 0.728 |
| Henan | 0.659 | 0.663 | 0.669 | 0.671 | 0.675 | 0.681 | 0.685 | 0.688 | 0.690 |
| Hubei | 0.645 | 0.647 | 0.648 | 0.648 | 0.649 | 0.651 | 0.652 | 0.654 | 0.658 |
| Hunan | 0.672 | 0.673 | 0.675 | 0.676 | 0.679 | 0.680 | 0.682 | 0.682 | 0.684 |
| Guangdong | 0.990 | 0.991 | 0.992 | 0.994 | 0.995 | 0.996 | 0.997 | 0.997 | 0.998 |
| Guangxi | 0.683 | 0.685 | 0.688 | 0.689 | 0.691 | 0.692 | 0.695 | 0.696 | 0.698 |
| Hainan | 0.921 | 0.924 | 0.925 | 0.928 | 0.930 | 0.934 | 0.936 | 0.937 | 0.939 |
| Chongqing | 0.691 | 0.692 | 0.694 | 0.698 | 0.710 | 0.718 | 0.724 | 0.732 | 0.736 |
| Sichuan | 0.573 | 0.574 | 0.576 | 0.577 | 0.579 | 0.580 | 0.583 | 0.585 | 0.586 |
| Guizhou | 0.485 | 0.486 | 0.487 | 0.487 | 0.489 | 0.490 | 0.491 | 0.493 | 0.494 |
| Yunnan | 0.566 | 0.569 | 0.570 | 0.571 | 0.572 | 0.573 | 0.577 | 0.579 | 0.580 |
| Tibet | 0.316 | 0.317 | 0.318 | 0.321 | 0.322 | 0.325 | 0.326 | 0.327 | 0.329 |
| Shanxi | 0.495 | 0.497 | 0.498 | 0.499 | 0.501 | 0.504 | 0.505 | 0.507 | 0.508 |
| Gansu | 0.478 | 0.479 | 0.481 | 0.484 | 0.485 | 0.486 | 0.488 | 0.489 | 0.491 |
| Qinghai | 0.435 | 0.437 | 0.438 | 0.440 | 0.441 | 0.445 | 0.447 | 0.449 | 0.450 |
| Ningxia | 0.469 | 0.471 | 0.473 | 0.476 | 0.477 | 0.479 | 0.480 | 0.483 | 0.484 |
| Xinjiang | 0.452 | 0.453 | 0.455 | 0.458 | 0.459 | 0.461 | 0.464 | 0.465 | 0.467 |
| Average | 67.6467 | 0.66 | 67.721 | 0.699 | 67.795 | 67.832 | 0.663 | 67.908 | 0.668 |
Table 2.
Environmental efficiency between 2000 and 2017 for China’s 31 provinces.
| Province | Year | ||||||||
|---|---|---|---|---|---|---|---|---|---|
| 2000 | 2001 | 2002 | 2003 | 2004 | 2005 | 2006 | 2007 | 2008 | |
| Beijing | 0.821 | 0.829 | 0.837 | 0.848 | 0.857 | 0.869 | 0.867 | 0.872 | 0.880 |
| Tianjin | 0.721 | 0.732 | 0.739 | 0.743 | 0.756 | 0.763 | 0.769 | 0.776 | 0.781 |
| Hebei | 0.498 | 0.503 | 0.506 | 0.509 | 0.511 | 0.514 | 0.522 | 0.529 | 0.531 |
| Shanxi | 0.421 | 0.428 | 0.433 | 0.438 | 0.441 | 0.448 | 0.453 | 0.460 | 0.466 |
| Inner Mongolia | 0.563 | 0.570 | 0.576 | 0.581 | 0.587 | 0.594 | 0.599 | 0.563 | 0.568 |
| Liaoning | 0.671 | 0.678 | 0.682 | 0.689 | 0.697 | 0.709 | 0.715 | 0.720 | 0.727 |
| Jilin | 0.642 | 0.649 | 0.657 | 0.660 | 0.668 | 0.674 | 0.679 | 0.686 | 0.691 |
| Heilongjiang | 0.710 | 0.716 | 0.720 | 0.728 | 0.731 | 0.738 | 0.742 | 0.749 | 0.752 |
| Shanghai | 0.913 | 0.917 | 0.924 | 0.928 | 0.932 | 0.938 | 0.943 | 0.949 | 0.953 |
| Jiangsu | 0.791 | 0.794 | 0.796 | 0.799 | 0.804 | 0.808 | 0.811 | 0.813 | 0.816 |
| Zhejiang | 0.698 | 0.699 | 0.672 | 0.675 | 0.679 | 0.682 | 0.687 | 0.691 | 0.694 |
| Anhui | 0.613 | 0.618 | 0.621 | 0.624 | 0.629 | 0.634 | 0.638 | 0.640 | 0.645 |
| Fujian | 0.784 | 0.787 | 0.789 | 0.790 | 0.792 | 0.796 | 0.798 | 0.801 | 0.803 |
| Jiangxi | 0.642 | 0.647 | 0.650 | 0.654 | 0.657 | 0.661 | 0.664 | 0.669 | 0.672 |
| Shandong | 0.629 | 0.632 | 0.633 | 0.635 | 0.639 | 0.641 | 0.643 | 0.644 | 0.648 |
| Henan | 0.625 | 0.628 | 0.629 | 0.631 | 0.635 | 0.638 | 0.640 | 0.643 | 0.644 |
| Hubei | 0.619 | 0.621 | 0.622 | 0.624 | 0.626 | 0.627 | 0.629 | 0.629 | 0.631 |
| Hunan | 0.648 | 0.649 | 0.651 | 0.652 | 0.654 | 0.657 | 0.658 | 0.660 | 0.661 |
| Guangdong | 0.908 | 0.911 | 0.913 | 0.914 | 0.916 | 0.919 | 0.921 | 0.923 | 0.924 |
| Guangxi | 0.664 | 0.665 | 0.668 | 0.669 | 0.671 | 0.672 | 0.674 | 0.675 | 0.678 |
| Hainan | 0.886 | 0.889 | 0.891 | 0.892 | 0.892 | 0.894 | 0.895 | 0.897 | 0.899 |
| Chongqing | 0.583 | 0.585 | 0.586 | 0.588 | 0.591 | 0.596 | 0.597 | 0.599 | 0.602 |
| Sichuan | 0.527 | 0.529 | 0.532 | 0.533 | 0.535 | 0.536 | 0.538 | 0.541 | 0.542 |
| Guizhou | 0.432 | 0.433 | 0.435 | 0.437 | 0.440 | 0.443 | 0.445 | 0.448 | 0.449 |
| Yunnan | 0.537 | 0.539 | 0.542 | 0.546 | 0.548 | 0.549 | 0.551 | 0.552 | 0.554 |
| Tibet | 0.288 | 0.289 | 0.291 | 0.293 | 0.294 | 0.295 | 0.297 | 0.298 | 0.301 |
| Shanxi | 0.478 | 0.479 | 0.482 | 0.483 | 0.484 | 0.486 | 0.489 | 0.491 | 0.491 |
| Gansu | 0.376 | 0.378 | 0.379 | 0.381 | 0.383 | 0.384 | 0.386 | 0.389 | 0.390 |
| Qinghai | 0.424 | 0.425 | 0.427 | 0.428 | 0.429 | 0.431 | 0.433 | 0.434 | 0.437 |
| Ningxia | 0.469 | 0.470 | 0.472 | 0.473 | 0.475 | 0.477 | 0.478 | 0.481 | 0.482 |
| Xinjiang | 0.456 | 0.457 | 0.459 | 0.461 | 0.462 | 0.464 | 0.465 | 0.467 | 0.469 |
| Average | 65.116 | 65.151 | 65.1860 | 65.221 | 65.2576 | 65.293 | 65.328 | 65.362 | 65.397 |
| Province | Year | ||||||||
| 2009 | 2010 | 2011 | 2012 | 2013 | 2014 | 2015 | 2016 | 2017 | |
| Beijing | 0.886 | 0.910 | 0.918 | 0.927 | 0.931 | 0.938 | 0.943 | 0.947 | 0.949 |
| Tianjin | 0.786 | 0.792 | 0.791 | 0.794 | 0.796 | 0.802 | 0.811 | 0.816 | 0.820 |
| Hebei | 0.539 | 0.547 | 0.551 | 0.558 | 0.567 | 0.573 | 0.582 | 0.589 | 0.594 |
| Shanxi | 0.471 | 0.479 | 0.482 | 0.487 | 0.490 | 0.496 | 0.501 | 0.508 | 0.513 |
| Inner Mongolia | 0.579 | 0.586 | 0.592 | 0.598 | 0.606 | 0.611 | 0.619 | 0.624 | 0.637 |
| Liaoning | 0.734 | 0.742 | 0.749 | 0.758 | 0.763 | 0.771 | 0.778 | 0.781 | 0.788 |
| Jilin | 0.695 | 0.713 | 0.719 | 0.726 | 0.732 | 0.739 | 0.744 | 0.749 | 0.756 |
| Heilongjiang | 0.760 | 0.768 | 0.776 | 0.781 | 0.785 | 0.788 | 0.792 | 0.799 | 0.807 |
| Shanghai | 0.958 | 0.961 | 0.964 | 0.965 | 0.968 | 0.970 | 0.972 | 0.973 | 0.975 |
| Jiangsu | 0.821 | 0.827 | 0.829 | 0.831 | 0.834 | 0.835 | 0.837 | 0.838 | 0.840 |
| Zhejiang | 0.698 | 0.701 | 0.705 | 0.709 | 0.714 | 0.716 | 0.719 | 0.723 | 0.725 |
| Anhui | 0.649 | 0.652 | 0.658 | 0.663 | 0.666 | 0.671 | 0.676 | 0.681 | 0.689 |
| Fujian | 0.804 | 0.806 | 0.809 | 0.810 | 0.812 | 0.813 | 0.816 | 0.817 | 0.819 |
| Jiangxi | 0.673 | 0.674 | 0.678 | 0.680 | 0.682 | 0.685 | 0.687 | 0.689 | 0.692 |
| Shandong | 0.652 | 0.655 | 0.657 | 0.658 | 0.657 | 0.659 | 0.661 | 0.664 | 0.669 |
| Henan | 0.645 | 0.647 | 0.648 | 0.650 | 0.652 | 0.654 | 0.657 | 0.658 | 0.660 |
| Hebei | 0.633 | 0.636 | 0.638 | 0.639 | 0.642 | 0.644 | 0.648 | 0.649 | 0.651 |
| Hunan | 0.664 | 0.665 | 0.666 | 0.669 | 0.671 | 0.672 | 0.672 | 0.675 | 0.678 |
| Guangdong | 0.927 | 0.929 | 0.932 | 0.934 | 0.935 | 0.937 | 0.938 | 0.941 | 0.943 |
| Guangxi | 0.679 | 0.681 | 0.683 | 0.685 | 0.686 | 0.688 | 0.689 | 0.691 | 0.693 |
| Hainan | 0.902 | 0.908 | 0.909 | 0.911 | 0.913 | 0.917 | 0.919 | 0.921 | 0.922 |
| Chongqing | 0.605 | 0.609 | 0.612 | 0.614 | 0.618 | 0.621 | 0.625 | 0.627 | 0.629 |
| Sichuan | 0.544 | 0.545 | 0.548 | 0.551 | 0.552 | 0.554 | 0.557 | 0.559 | 0.561 |
| Guizhou | 0.451 | 0.452 | 0.454 | 0.457 | 0.458 | 0.461 | 0.463 | 0.464 | 0.466 |
| Yunnan | 0.557 | 0.559 | 0.562 | 0.563 | 0.565 | 0.566 | 0.568 | 0.570 | 0.571 |
| Tibet | 0.304 | 0.309 | 0.310 | 0.312 | 0.313 | 0.315 | 0.316 | 0.317 | 0.318 |
| Shanxi | 0.493 | 0.495 | 0.496 | 0.498 | 0.499 | 0.502 | 0.504 | 0.505 | 0.507 |
| Gansu | 0.392 | 0.393 | 0.395 | 0.396 | 0.398 | 0.401 | 0.402 | 0.403 | 0.405 |
| Qinghai | 0.439 | 0.440 | 0.441 | 0.443 | 0.445 | 0.446 | 0.447 | 0.449 | 0.451 |
| Ningxia | 0.484 | 0.485 | 0.487 | 0.488 | 0.489 | 0.491 | 0.493 | 0.494 | 0.496 |
| Xinjiang | 0.470 | 0.471 | 0.473 | 0.474 | 0.476 | 0.479 | 0.481 | 0.484 | 0.485 |
| Average | 67.598 | 67.636 | 67.672 | 67.709 | 67.745 | 67.782 | 67.818 | 67.854 | 67.891 |
Table 3.
Global Moran’s I index of economic efficiency in energy consumption between 2000 and 2017.
| Year | 2000 | 2001 | 2002 | 2003 | 2004 | 2005 | 2006 | 2007 | 2008 |
| I | 0.234 | 0.248 | 0.262 | 0.281 | 0.294 | 0.334 | 0.329 | 0.332 | 0.389 |
| Z | 1.981 | 2.071 | 2.043 | 2.004 | 1.612 | 1.803 | 1.642 | 1.797 | 2.074 |
| Year | 2009 | 2010 | 2011 | 2012 | 2013 | 2014 | 2015 | 2016 | 2017 |
| I | 0.393 | 0.399 | 0.422 | 0.392 | 0.339 | 0.347 | 0.411 | 0.424 | 0.453 |
| Z | 2.095 | 2.124 | 2.239 | 2.092 | 1.642 | 1.742 | 2.134 | 2.142 | 2.144 |
Table 4.
Global Moran’s I index of environmental efficiency in energy consumption between 2000 and 2017.
Table 4.
Global Moran’s I index of environmental efficiency in energy consumption between 2000 and 2017.
| Year | 2000 | 2001 | 2002 | 2003 | 2004 | 2005 | 2006 | 2007 | 2008 |
| I | 0.279 | 0.312 | 0.356 | 0.298 | 0.402 | 0.456 | 0.411 | 0.435 | 0.324 |
| Z | 2.085 | 2.135 | 2.056 | 1.988 | 2.901 | 3.125 | 2.856 | 2.963 | 2.657 |
| Year | 2009 | 2010 | 2011 | 2012 | 2013 | 2014 | 2015 | 2016 | 2017 |
| I | 0.419 | 0.431 | 0.368 | 0.345 | 0.439 | 0.402 | 0.325 | 0.420 | 0.311 |
| Z | 3.411 | 3.103 | 2.132 | 2.429 | 3.162 | 3.125 | 2.198 | 3.022 | 2.731 |
© 2019 by the authors. Licensee MDPI, Basel, Switzerland. This article is an open access article distributed under the terms and conditions of the Creative Commons Attribution (CC BY) license (http://creativecommons.org/licenses/by/4.0/).
Share and Cite
MDPI and ACS Style
Lu, C.; Meng, P.; Zhao, X.; Jiang, L.; Zhang, Z.; Xue, B. Assessing the Economic-Environmental Efficiency of Energy Consumption and Spatial Patterns in China. Sustainability 2019, 11, 591. https://0-doi-org.brum.beds.ac.uk/10.3390/su11030591
AMA Style
Lu C, Meng P, Zhao X, Jiang L, Zhang Z, Xue B. Assessing the Economic-Environmental Efficiency of Energy Consumption and Spatial Patterns in China. Sustainability. 2019; 11(3):591. https://0-doi-org.brum.beds.ac.uk/10.3390/su11030591
Chicago/Turabian StyleLu, Chenyu, Peng Meng, Xueyan Zhao, Lu Jiang, Zilong Zhang, and Bing Xue. 2019. "Assessing the Economic-Environmental Efficiency of Energy Consumption and Spatial Patterns in China" Sustainability 11, no. 3: 591. https://0-doi-org.brum.beds.ac.uk/10.3390/su11030591
Note that from the first issue of 2016, this journal uses article numbers instead of page numbers. See further details here.