Biochemical Hydrogen Potential Tests Using Different Inocula †


1
DESTEC—Department of Energy, Systems, Territory and Construction engineering, University of Pisa, Largo Lucio Lazzarino, 56122 Pisa, Italy
2
DIEF—Department of Industrial Engineering, University of Florence, via Santa Marta 3, 50139 Florence, Italy
*
Author to whom correspondence should be addressed.
†
Abbreviations: AD, anaerobic digestion; BHP, biochemical hydrogen potential; BMP, biochemical methane potential; DF, dark fermentation; FW, food waste; HCB, hydrogen consuming bacteria; HPB, hydrogen producing bacteria; LOD, limit of detection; OFMSW, organic fraction of municipal solid waste; SD, standard deviation; SHP, Specific hydrogen production; TKN, total kjeldahl nitrogen, TOC, Total organic Carbon; TS, total solids; TSC, tryptose sulphite cycloserine; TVS, total volatile solids; VFA, volatile fatty acid.
Sustainability 2019, 11(3), 622; https://0-doi-org.brum.beds.ac.uk/10.3390/su11030622
Submission received: 17 December 2018
/
Revised: 21 January 2019
/
Accepted: 21 January 2019
/
Published: 24 January 2019
(This article belongs to the Special Issue Advances in Biorefining of Biowaste)
Abstract
:Four inocula collected from different operating facilities were tested in their hydrogenic performances by means of two biochemical hydrogen potential test set-ups using sucrose and food waste as substrates, with the aim of evaluating the influence of inoculum media in batch fermentative assays. The selected inocula were: activated sludge collected from the aerobic unit of a municipal wastewater treatment plant, digested sludge from an anaerobic reactor treating organic waste and cattle manure, digested sludge from an anaerobic reactor treating agroindustrial residues, and digested sludge from an anaerobic reactor of a municipal wastewater treatment plant. Test results, in terms of specific hydrogen production, hydrogen conversion efficiency, and volatile solids removal efficiency, were significantly dependent on the type of inoculum. Statistical analysis showed different results, indicating that findings were due to the different inocula used in the tests. In particular, assays performed with activated sludge showed the highest performances for both substrates and both experimental set-ups.
1. Introduction
The worldwide exploitation of fossil fuels and raw materials is driving Earth towards energy emergency, environmental pressure, and climate change [1]. In recent years, society has begun to recognize the necessity of a sustainable future built on alternative sources of energy and materials. The European Union action plan for a circular economy [2] is the basis for developing a sustainable, low carbon, resource efficient, and competitive economy. In a circular economy, products at the end of their life are turned into resources for new purposes [3]. In this context, the European environmental policy is twofold: reduction of landfill disposal due to impacts and risks (e.g., odour and greenhouse gas emissions, groundwater contamination by leachate, etc.) [4,5], and valorisation of residues. In the matter of organic waste, the biorefinery concept fits well with this latter perspective. A biorefinery is a facility where biomass is converted into bioenergy, biofuels, biofertilizers, biochemicals, biopolymers, or bioproducts for further industrial or commercial applications [6]. Due to the production of energy and bioproducts (digestate), anaerobic digestion (AD) is considered one of the first examples of biorefinery [7].
With the aim of improving the anaerobic biorefinery, the scientific community has recently increased its interest in the study of biological hydrogen production by dark fermentation (DF). Hydrogen is considered to be the fuel of the future, owing to its high energy content and environmentally friendly production [8]. This technology considers separation of the traditional AD into a two-stage process, equipped with a fermentative reactor and a methanogenic reactor. While the first stage produces H2 and CO2 as gaseous products and releases volatile fatty acids (VFAs) into the liquid solution, the second one converts VFAs and the residual organic biodegradable matter into CH4 and CO2 [9]. The multiple advantages of this technology include an increase in energy efficiency due to the high calorific value per unit of weight of H2, and the enhancement of biogas yield in the second stage [10].
In continuous pilot scale applications, process parameters are set in order to establish a stable microflora of hydrogen producing bacteria (HPB) and to avoid the formation of hydrogen consuming bacteria (HCB). The pH is maintained at acidic conditions, generally in the range of 4.5–6 [10,11]. Hydraulic retention time is shortened to a few days, generally in the range of 1–3 d [10], with the aim of enabling a rapid washout of methanogenic biomass [12]. In spite of their potential and adequacy, continuous tests entail long duration, high reactor costs, and a significant amount of substrate.
In order to have a rapid, low-cost, and worthwhile response of the specific hydrogen production (SHP) of a substrate, biochemical hydrogen potential (BHP) tests are widely used in the literature [6,11,13,14,15,16,17,18,19,20,21].
BHP tests take place in batch reactors, where a certain amount of substrate is incubated with an inoculum under anaerobic fermentative conditions. Due to their simpler and shorter procedures in comparison with more complex and high priced continuous reactor experiments, batch tests are mostly preferred when time and costs are a constraint. BHP assays evaluate the specific amount of hydrogen that can be potentially produced when a certain substrate or waste is biodegraded under fermentative conditions. In particular, BHP tests play a fundamental role as preliminary experimental tests for assessing the feasibility of DF treatment of such wastes. Despite their wide use, batch fermentative tests do not follow a specific guideline like other anaerobic biodegradability tests do (e.g., biochemical methane potential tests, BMP [22]), and previous research has presented remarkable differences in their set-ups. Assays are assessed using a broad pH range (4.5–9.0 [15,21]), with the optimum found at 5.5 [11,13,14]. In this matter, the most adopted methods of controlling pH during batch trials are the use of an initial buffer solution [6,13,14,15] or the automatic addition of an alkaline solution [19,20,21]. Temperature is set at mesophilic (35–39 °C) or thermophilic conditions (50–55 °C), according to the original conditions of the seed microorganisms. Concerning the microorganism medium, unlike pilot scale reactors that can operate on process parameters to select the optimum microbial culture, batch assays depend directly on the inoculum chosen for the test. Several studies use pure hydrogen producing cultures such as Clostridium sp. to avoid the presence of HCB [23,24,25,26,27,28,29]. Nevertheless, since in full scale digesters bacteria coexist in a wide range of species, and the fermentation of substrates into biohydrogen involves a wide consortium of microorganisms [30], the use of mixed cultures belonging to operative facilities is preferred by most authors [6,11,13,14,15,16,17,18,19,20,21,31,32,33]. Moreover, using mixed-microorganism media is more functional and economically advantageous than using unique microbial populations. In this context, BHP tests reported in literature are currently being performed with different types of mixed cultures. Several works use anaerobic sludge from anaerobic digesters [6,11,13,14,15,16,17,18] while others use activated sludge [19,20,21].
In this study, biological hydrogen production was evaluated using four types of inoculum collected from different operating facilities. The main purpose of this paper is to derive indications of which type of inoculum to use for setting up future batch fermentative tests. To the authors’ knowledge, this is the first time that different seeding sludges have been compared in terms of fermentative performances. Tests were carried out using two substrates: sucrose was selected as an easy biodegradable substrate, while food waste (FW) was adopted as a more complex feed. Moreover, two different BHP set-ups were performed, with the aim of evaluating the effect of the type of inoculum under the different experimental configurations that can be found in the literature. Therefore, batch tests were carried out both with and without automatic pH control.
2. Materials and Methods
2.1. Inocula
Different types of inocula used in literature to perform BHP tests were selected. The four media consisted of:
- IN1: activated sludge collected from the aerobic unit of a municipal wastewater treatment plant;
- IN2: digested sludge collected from an anaerobic reactor treating the organic fraction of municipal solid waste (OFMSW) and cattle manure;
- IN3: digested sludge collected from an anaerobic reactor treating agroindustrial residues;
- IN4: digested sludge collected from an anaerobic reactor of a municipal wastewater treatment plant.
Inocula were heat treated at 80 °C for 30 min prior to fermentation tests, with the aim of selecting only HPB while inhibiting hydrogenotrophic methanogens [14]. The treatment was performed in 250 mL beakers placed in a static oven (UM200, Memmert GmbH, Germany). The temperature of the medium was continuously measured with a digital tip thermometer (T1, Testo S.p.A., Italy). Treatment time started when the temperature of the medium reached 80 °C. After 30 min, the inocula were removed from the oven and cooled down to ambient air temperature. Tests were carried out when the inoculum temperature reached mesophilic conditions.
2.2. Substrates
FW was used as the substrate as it has been proven to be a highly desirable feedstock for anaerobic fermentation, due to its high biodegradability, availability, and well balanced carbon and nutrient contents [11,18,34]. FW was manually sorted from OFMSW collected in a Tuscan municipality (Italy) by means of a kerbside collection system. In order to obtain a slurry with a total solid content suitable for wet fermentation, the sample was treated in a food processor, sifted with a strainer (3 mm diameter), and mixed with tap water [35].
2.3. Biochemical Hydrogen Potential (BHP) Tests
BHP tests were performed with two different methods. In particular, assays were performed with and without automatic pH control. Both tests were carried out at pH 5.5 and mesophilic conditions (37 °C). Previous studies found 5.5 to be the optimum pH for hydrogen production [11,13,14]. The temperature was set according to the main original temperature of the seed microorganisms.
2.3.1. Biochemical Hydrogen Potential (BHP) Tests without Automatic pH Control (BHP1)
Tests, hereinafter referred to as BHP1, were based upon the methodology reported by previous studies [6,13,14,15] that involves the use of an initial buffer solution to control pH during the test. Assays were carried out in triplicate using 1L stainless steel bottles [38]. The reactors were placed on a hot plate magnetic stirrer and incubated in a water bath at 37 °C for 48 h. The ratio between volatile solids of substrate and volatile solids of inoculum (food/microorganism, F/M) was 0.5 gTVS/gTVS [14]. This concentration is adopted for BHP tests using a buffer solution to control pH, and it is a compromise of the needs to use a large sample to get a high easy-to-measure gas production, and to avoid inhibition from pH drop and to ensure the buffer effect. The working volume of the reactor was roughly 0.5 L, comprising substrate, inoculum, MES (2-N-morpholino-ethanesulfonic acid, VWR, Italy) buffer solution, and HCl 2.5M to set the initial pH at 5.5. Before the start of the experiment, the reactors were flushed with nitrogen for a few minutes to guarantee anaerobic conditions.
Biogas generation was regularly appraised by measuring the pressure in the headspace of each bottle by means of a membrane pressure gauge (HD2304.0, Delta Ohm S.r.L., Italy). Pressure data were then converted to volume using the ideal gas law [35]. The hydrogen content of the gas was measured by gas chromatography (3000 Micro GC, INFICON, Switzerland) using a thermal conductivity detector. Hydrogen passed through a Molsieve column (30 μm/320 μm/ 10 m) using argon as gas carrier at a temperature of 50 °C. Carbon dioxide passed through a PLOTQ column (10 μm/320 μm/ 8 m) using helium as gas carrier at temperature of 55 °C. The SHP was finally obtained as the cumulative volume of hydrogen produced during the test, divided by the volatile content of the substrate initially added to each reactor.
A sample of material was collected before and after the test and its TVS content was analysed, with the aim of calculating the volatile solids removal efficiency (ηTVS) as follows (Equation (1)):
2.3.2. Biochemical Hydrogen Potential (BHP) Tests with Automatic pH Control (BHP2)
The test, hereinafter referred to as BHP2, was performed in triplicate using pilot scale stainless steel reactors (6 L total volume, 3 L working volume). The automatic dosage of an alkaline solution during the test has been used in several works instead of using an initial buffer solution to control pH [19,20,21]. In BHP2, 3 mL of NaOH 2M solution was automatically added by means of peristaltic pumps when a pH decrease under 5.5 was detected. This configuration enabled the pH value to be kept constantly in the range of 5.5–5.6 throughout the test. The ratio between volatile solids of substrate and volatile solids of inoculum (F/M) was 4 g TVS/g TVS (approximately 1 g/g on a wet weight basis). Previous studies found that this ratio optimized hydrogen production in batch assays with FW as a substrate and automatic pH control [39]. In the case of sucrose, the substrate amount was calculated based on the TVS ratio. Tap water was then added to obtain the ratio on a wet weight basis. HCl 2.5M solution was used to set the initial pH at 5.5. Temperature was constantly kept at mesophilic conditions (37.0 ± 0.1 °C) by a jacket where warm water heated up by a thermostat (FA90, Falc Instruments s.r.l., Italy) and was continuously recycled. Continuous mixing was ensured by mixing blades. The three reactors were equipped with pH probes (Metter Toledo, Italy) and connected to an automatic data acquisition system (LabView, National Instruments Corporation, Italy). Data were recorded every 5 min. The volume of the produced gas during the tests was measured using volumetric counters connected to the upper side of the reactors through a 3-way valve. Each counter was composed of two concentric cylinders partially filled with water; when the gas entered from the reactor to the external side of the counter, the water rose through the internal cylinder up to reach a level defined by the an electrode. An impulse was then given to the 3-way valve in order to connect the counter with a 10 L multilayer foil bag (Supel TM, Merck KGaA, Germany) that collected the gas. Once a minimum water level was reached, the valve reconnected the counters to the reactors end the gas restarted to enter into them. Each impulse was related to a gas volume of 0.07 L.
Hydrogen content of the gas was measured by gas chromatography, with the same instrumentation and settings used for BHP1.
After set-up, the reactors were flushed with N2 gas to ensure anaerobic conditions and to drive off air from the reactor headspace.
With the aim of calculating the volatile solids removal efficiency (ηTVS), a sample of material was collected before and after the test and analysed for TVS content (Equation (2)).
2.3.3. Kinetic Model
The mean cumulative hydrogen production curves were obtained over the course of the batch experiments and analysed using the modified Gompertz equation [40]. Equation (2) is used in many works to describe the kinetic of hydrogen production from batch fermentation assays [18].
where:
- H(t): specific hydrogen production at time t (NL H2/kg TVSsub);
- Hmax: total amount of hydrogen produced (NL H2/kg TVSsub);
- r: maximum hydrogen production rate (NL H2/kg TVSsub h)
- λ: length of the lag phase (h).
The time needed to attain 95% of the maximum hydrogen yield (t95), was obtained from the Gompertz equation as follows [21]:
Constants were estimated by minimizing the sum square of errors between the experimental data and model results. The estimations were carried out using the solver function of Microsoft Excel version 2016.
2.3.4. Theoretical Hydrogen Production
Theoretical maximum hydrogen production from FW and sucrose was obtained with the hypothetical assumption of Van Ginkel et al. [40] and Logan et al. [41] that sucrose, fructose, glucose, and cellulose were the sole carbohydrates and the primary product was acetate. Under this assumption calculations were performed, taking into account a theoretical yield of 4 mol of H2/mol of glucose, fructose, and cellulose, and 8 mol of H2/mol of sucrose [41]. Sucrose, fructose, glucose, and cellulose concentrations of FW are presented in Table 2. Based on the considerations above, the conversion efficiency was calculated on a mass basis using the equation of De Gioannis et al. [9], Equation (4):
2.4. Analytical Parameters
Inocula and FW were characterized in terms of TS, TVS, pH, total organic carbon (TOC), total Kjeldahl nitrogen (TKN), ammonia, alkalinity, VFA, elemental composition, bromatological analysis, and Ca, Mg, Na, and Clostridium Perfringens sp. spore concentrations.
TS, TVS, and pH were measured following standard methods [42].
Proteins, lipids, and cellulose were obtained following the European Commission Regulation 2009/152/EC of 27 January 2009 [43]. Total carbohydrates were determined by subtracting the contents of humidity, ashes, proteins, lipids, and fibres from the total amount. Lignin was obtained as reported by Martillotti et al. [44]. Sucrose, fructose, and glucose content of FW were determined according to official methods [45].
C, H, and N were measured in accordance with EN 15407 [46], while S, P, Ca, Mg, and Na were obtained following EPA 6010 D [47] and EN 13657 [48]. The oxygen content was calculated by subtracting the contents of C, H, N, S, and P from the total.
Total organic carbon (TOC) was determined as stated in EN ISO 13127 [49], while ammonia was obtained following APHA [50]. TKN, the sum of organic nitrogen and ammonia, was obtained in accordance with the European Commission Regulation 2009/152/EC of 27 January 2009 [43].
VFAs were determined as stated in US EPA [51].
The concentration of Clostridium perfringens sp. spores was investigated as bacterial indicators for the four inocula. Several works found Clostridium perfringens sp. to be the most dominant hydrogen producing culture [23,24,25,26,27], and it is widely adopted when evaluating hydrogen production from a pure culture [24,28]. Spores were measured because Clostridium sp. and other HPB are able to sporulate and survive the extreme pre-treatment conditions, unlike nonsporulating bacteria which are suppressed [31]. Clostridum perfringens spores were measured using a tryptose sulphite cycloserine (TSC) agar method [24,52,53]. 50 mg of inoculum were heated at 80 °C for 30 min and then filtered through 47 mm Whatman WCN 0.45 μm pore size membrane filters. Samples were placed onto TSC agar plates (Merck KGaA, Germany) and incubated at 44 °C ± 1 °C for 21 ± 3 h under anaerobic conditions. All black colonies were then counted as Clostridium perfringens [24,52].
2.5. Statistical Analyses
Three statistical approaches were used to compare experimental results.
In order to evaluate differences between results of the four inocula, SHP, ηTVS, and Em and Gompertz model results were analysed using one-way ANOVA [6]. Results were studied separately for each parameter and for each substrate.
Subsequently, simple linear regression was used to compare the results of the two different set-ups: BHP1 and BHP2.
Lastly, in order to identify linear relationships between the variables of concern, two Pearson matrices were obtained, one for each substrate (FW and sucrose). The analysis was performed taking into account experimental findings (SHP, ηTVS, Em), Gompertz model results (Hmax, λ, r, and t95) and Clostridium perfringens sp. spore concentrations in the four sludges (Table 1). Quadratic, exponential, and logarithmic relationships were preliminarily evaluated (data not shown), highlighting lower correlation levels.
A confidence level of 95% was selected for all statistical comparisons. All data analysis calculations were performed using XLStat2018 software packages.
3. Results and Discussion
3.1. Analytical Characterization of FW and Inocula
Analytical characterization of inocula and FW was performed with the aim of providing detailed descriptions of the media. Results expressed with averages and standard deviations are presented in Table 1.
Butyric, isobutyric valeric, and isovaleric acid contents were not shown, since they were found to be below the limit of detection (LOD = 40 mg/L). Acetic and propionic acids were also undetected for IN2, IN3, and IN4, while acetic acid was the prevalent VFA for IN1 and FW.
With regard to C:N ratio, FW showed a value of 12.4, which was slightly below other FW findings. Zhang et al. [54] reported an average value of 14.8, while Pan et al. [18] and Han and Shin [55] obtained C:N ratios of 17.1 and 14.7, respectively. Concerning sludges, their C:N ratios were found to be lower than FW, being between 3.9 (IN2) and 7.9 (IN1). This result is comparable with the range of 6–9 defined by Iacovidou et al. [56] for sewage sludge, and it is explained by the high N contents and the high ammonia concentration. Previous studies found that a proper C:N ratio enhances biohydrogen production by shifting the microorganism metabolic pathway [36]. Argun et al. [17] studied the effects of the C:N ratio on the hydrogen yield and specific H2 production rate in DF of wheat powder solution by supplementing nitrogen. The results of the study showed that the highest H2 production was obtained at a C:N ratio of 200. Lin and Lay [36] achieved a 500% and 80% increased hydrogen yield and hydrogen production rate at a C:N ratio of 47, compared with the blank, while Kayhanian [57] reported an optimum C:N ratio in the range of 27–32. Although the optimum ratio covers a wide range of values, the C:N ratios of the four inocula were found to be significantly lower than each of them. The problem that might occur with the use of these sludges is the failure of the process due to toxic ammonia inhibition [56]. Under this perspective, Ghimire et al. [8] advised against the use of swine, poultry, and dairy manure due to their low C:N ratio and high levels of ammonia (cattle slurry: 1040–1900 mg/L and chicken manure: 7000–12,800 mg/L). As reported for methane enzymes [57], the accumulation of ammonia inside the cell membrane may be toxic and inhibit HPB activities. Several studies have made an effort to find the inhibitory threshold of ammonia on hydrogen production. Sterling et al. [58] investigated hydrogen production from dairy cattle manure under different ammonia concentrations (600, 1500, and 3000 mgN/L). In the first two set-ups, an increase in hydrogen generation was observed after 24 h while in the 3000 mgN/L set-up, the fermentative process was arrested. Salerno et al. [59] studied ammonia inhibition of biohydrogen production in batch and continuous reactors with glucose as substrate. In batch tests, an ammonia threshold concentration of 7000 mgN/L was found under a pH of 5.2, while in continuous flow conditions, the suppression of biohydrogen production occurred when ammonia concentrations in the feed exceeded 800 mgN/L. As can be highlighted, even if the probability of having an inhibitory effect and ammonia concentration seems to follow a linear correlation, a unique threshold limit is still not defined. Ammonia content in the four inocula ranged between 341 mgN/L (IN1) and 2025 mgN/L (IN2), while FW highlighted a weaker concentration (191 mgN/L). All the inocula showed concentrations lower than the threshold limit for batch tests of 3000 and 7000 mgN/L, set respectively by Sterling et al. [58] and Salerno et al., [59].
Among the macromolecules, carbohydrates were the main component for FW, while inocula highlighted a predominance of proteins [60]. FW proteins and carbohydrates were found to be slightly below previous works, due to the dilution employed in the present study. Indeed, protein and carbohydrate contents in FW generally range between 3.1–4.9% w/w and 6.2–13.4% w/w respectively [12,61].
The content of Clostridium perfringens sp. spores was studied, since previous works found Clostridium perfringens sp. to be the most dominant hydrogen producing culture [23,24,25,26,27]. The concentration was observed to vary by a factor of up to 12, ranging from a maximum of 150 CFU/mg found for the activated sludge sample (IN1) to a minimum of 13 CFU/mg (IN2).
Light metals, such as magnesium, sodium, and calcium, are crucially important requirements of DF, as they assist in microbial metabolism, cell growth, and hydrogen and enzyme generation. Nonetheless, significant contents of metal ions in inocula or substrates may result in an inhibitory behaviour and hinder hydrogen generation [31]. Magnesium constitutes bacterial cell walls, and it is needed for cellular protein synthesis. Therefore, a minimum content of magnesium ions is needed for an efficient fermentative process, and it has been highlighted to improve hydrogen generation [31]. Concerning the inhibitory threshold, Srikanth and Mohan [62] defined a magnesium concentration of 600 mg/L as the limit value. Sodium is an element necessary for microbial growth [63]. Nevertheless, a significant sodium content may hinder hydrogen generation because of a variation of the metabolic route. In this case, alternative metabolites such as lactate are produced instead of hydrogen [31,64]. In particular, Cao and Zhao [65] found an inhibitory threshold level of 14,410 mg/L. Calcium is a constituent of extracellular polysaccharides, which plays a key role in the formation of biofilms and thereby improves cell granulation and settleability [66]. Lee et al. [67] reported that addition of a small amount of Ca2+ (5.4 mg/L) spurred a significant improvement in hydrogen production. Yuan et al. [68] reported enhancement of bacterial growth and mechanical strength. Chang and Lin [69] showed that Ca2+ in the range of 0–150 mg/L is non-inhibitory, as reflected by yields of 3.6 mol/mol. In conclusion, light metal concentrations of the four sludges were found to be below the inhibitory threshold.
3.2. BHP Tests
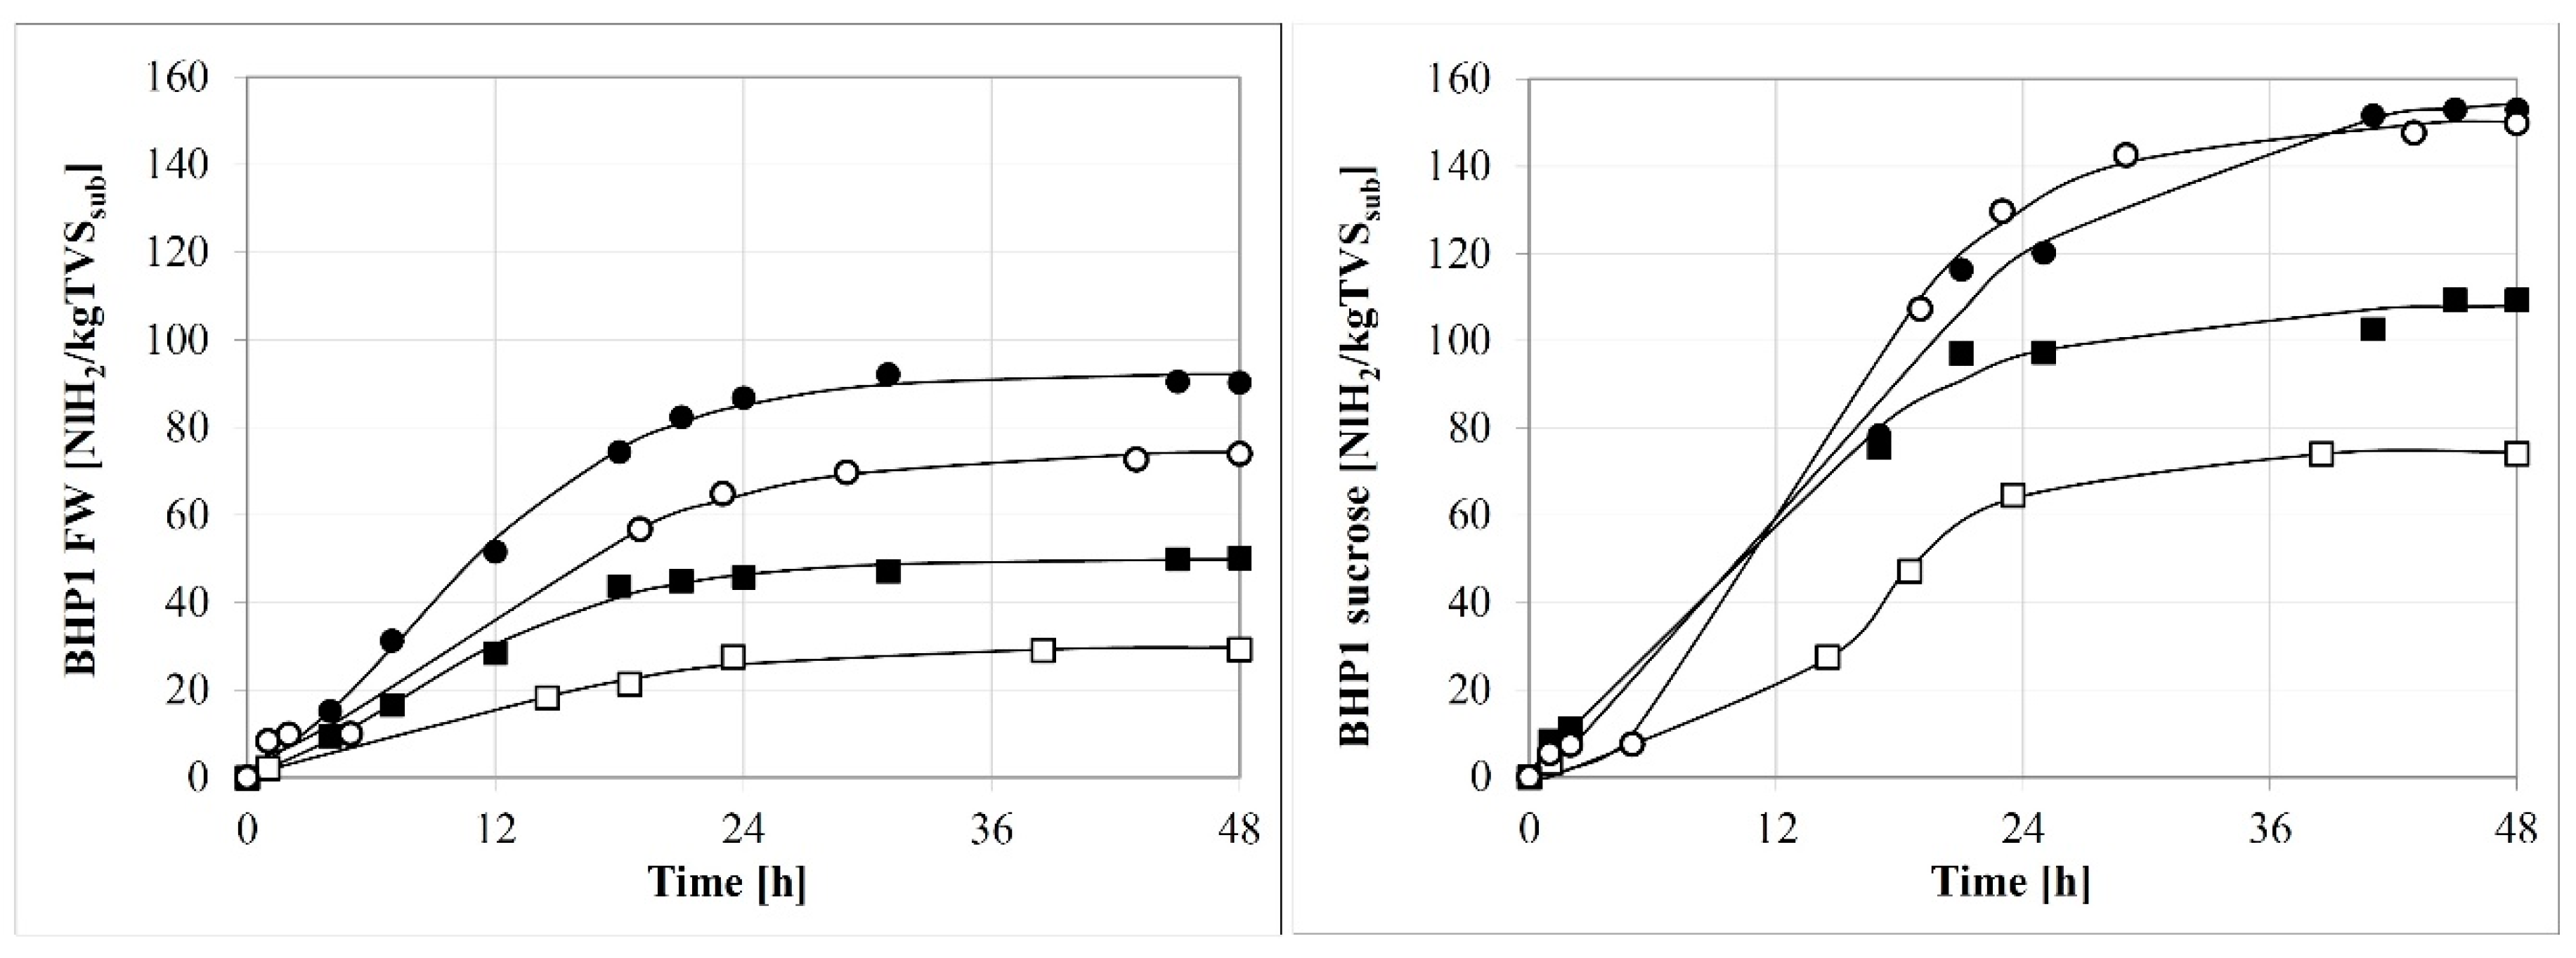
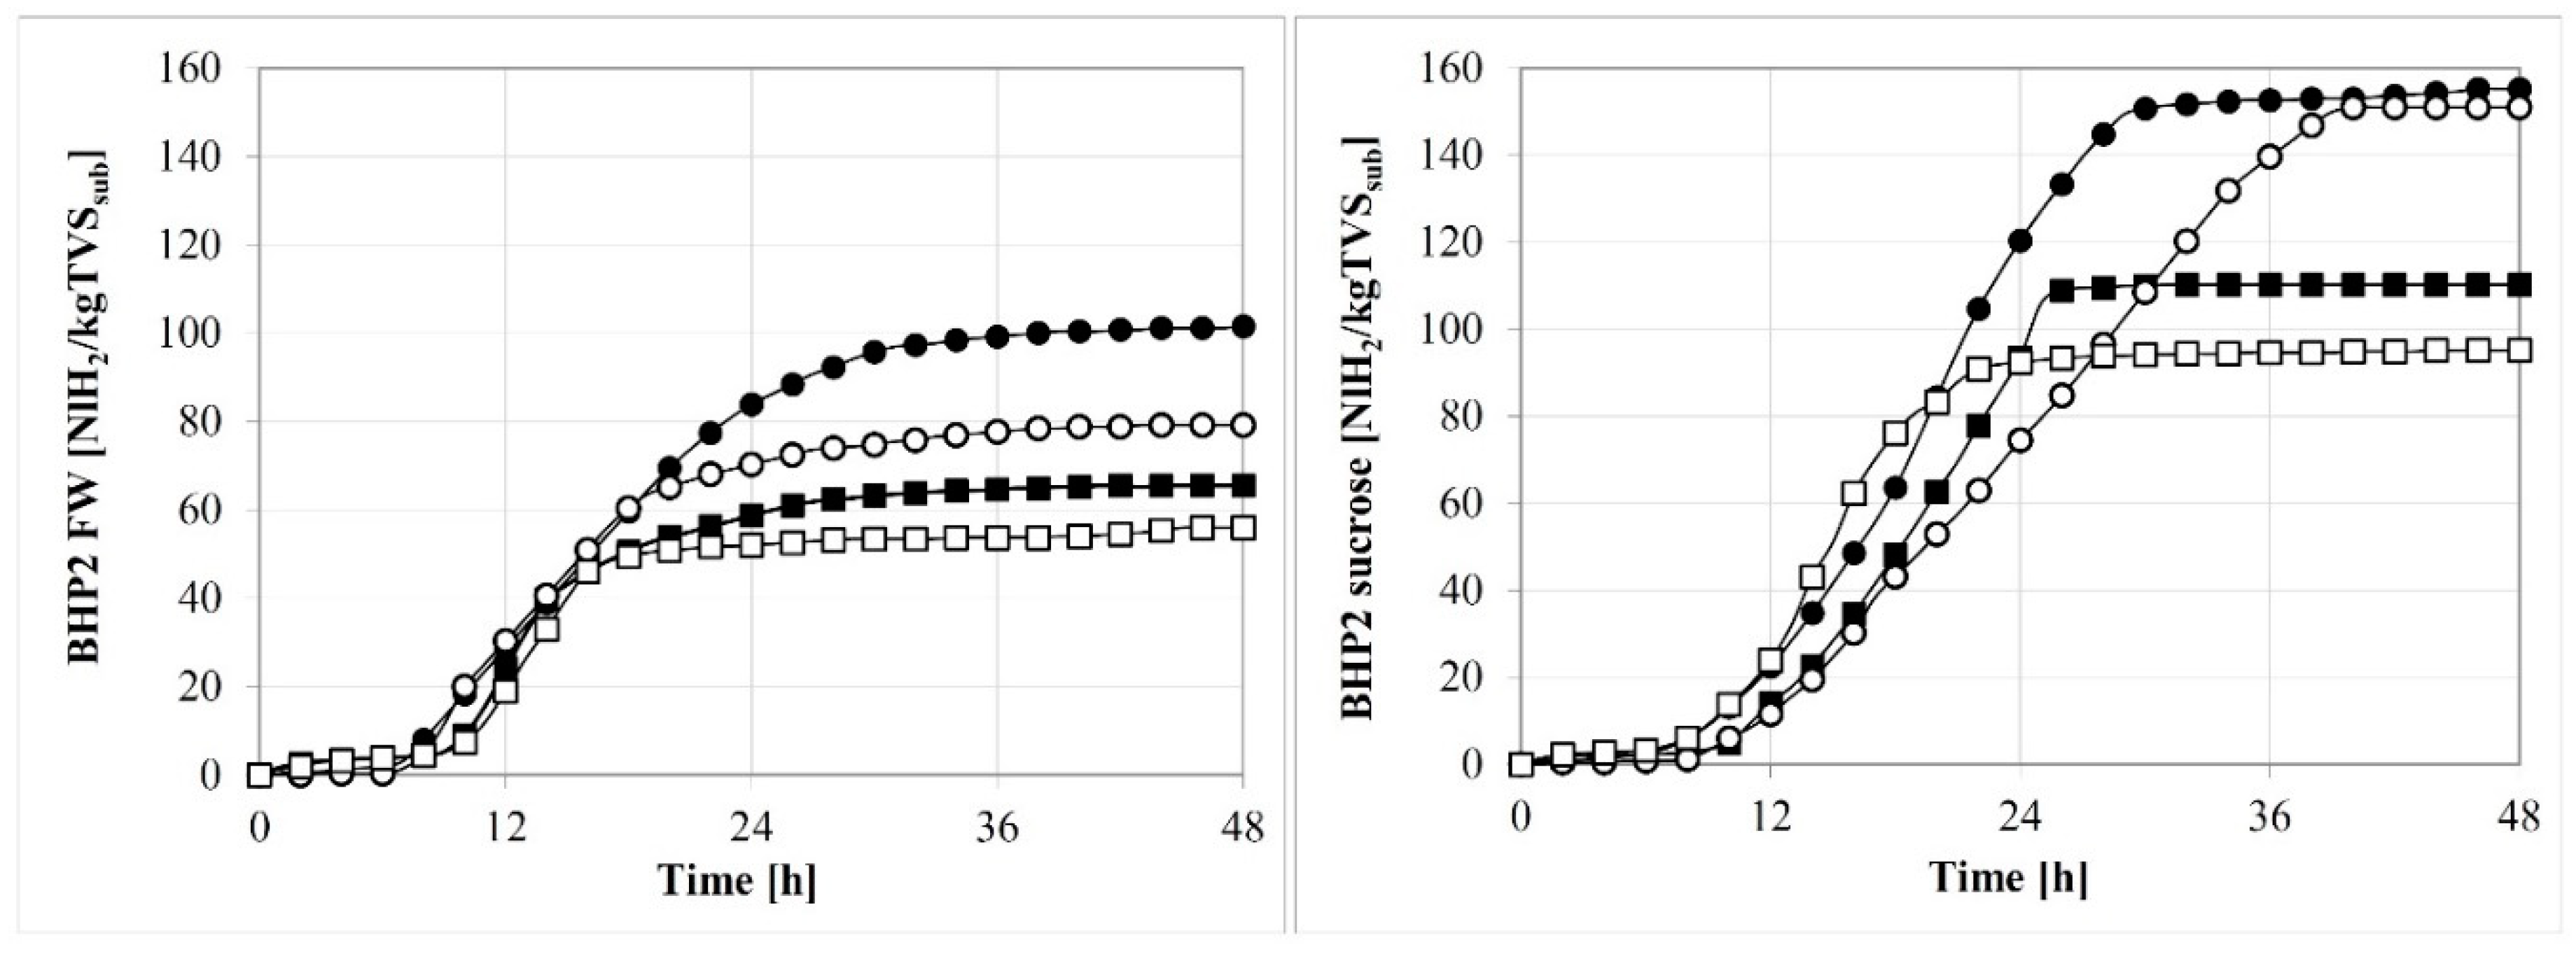
The results of specific cumulative hydrogen productions, volatile solids reduction, and conversion efficiency obtained from the four inocula (IN1, IN2, IN3, IN4), the two substrates (FW and sucrose), and the two experimental set-ups are reported in Table 2. SHP curves are expressed in terms of NL H2/kg TVSsub, and depicted in Figure 1 and Figure 2. In these figures, the experimental data are shown as single points, while solid lines represent Gompertz model curves. In order to avoid visual misunderstandings, BHP2 experimental data were represented every 2 h.
During all fermentation assays, no methane was detected. Thermal pre-treatment of inoculum was therefore efficient in the inhibition of hydrogenotrophic methanogens. SHP from FW (29.3–90.2 NL H2/kg TVSsub for BHP1 and 65.4–101.6 NL H2/kg TVSsub) were comparable to the findings of previous works. Specifically, Alibardi and Cossu [14] highlighted results in the range of 25–85 NL H2/kg TVSsub, De Gioannis et al. [20] and Pecorini et al. [70] reported final SHPs from FW of 58.6 and 55.0 NL H2/kg TVSsub respectively, while Alibardi and Cossu [6] found 78–135 NL H2/kg TVSsub for different organic waste mixtures. As for sucrose, the conversion of hydrogen production to mol H2/molsucrose ranged between 0.9–2.3 mol H2/molsucrose for BHP1 and 1.4–2.4 mol H2/molsucrose for BHP2. These data were concurrent with Dellosso Penteado et al. [37]. Hydrogen yields from sucrose were in the range of 0.7–2.0 mol H2/molsucrose using different seed sludge sources in up-flow anaerobic fixed-bed reactors.
Observing the data of the four inocula, it was evident that the hydrogenic process was dependent on the type of inoculum. Analysis of variance performed separately for each substrate and each test configuration on SHP, ηTVS, and Em results indicated the finding of statistically different results (p < 0.01). This confirms that results are due to the different inocula used in the tests. In particular, the highest SHP and efficiencies were obtained for activated sludge (IN1). SHP obtained using IN1 were almost double that of IN2 results in all test configurations, and 4.5–5.8% and 23.4–31.4% higher than IN4, the second most performing inoculum, respectively for FW and sucrose tests.
TVS removal efficiencies were found to be in the ranges of 14.3–48.3% for FW and 31.7–58.2% for sucrose. Similarly to hydrogen production results, IN1 showed the highest removal efficiencies, followed by IN4, IN3, and IN2.
In the matter of Em, results were below 30%, with the highest conversion efficiencies found for tests performed with activated sludge (IN1) as inoculum. Previous literature findings reported conversion efficiencies of 23% [41] and 58% [71] for sucrose and 19.3% for FW [55]. These findings were obtained since, in real practice, fermentation processes do not generate only acetate as products, differently from what is assumed by the theoretical calculation. Several other reduced products are formed to sustain microbial cell synthesis, including ethanol, butanol, butyrate, and lactate [9]. In practical situations, the yield is lower than 4 mol H2/mol glucose and 8 mol H2/mol sucrose, since the main end product together with acetate is butyrate [6,31].
In order to compare the results of the two experimental set-ups, simple linear regression was carried out between SHP, ηTVS, and Em data obtained for BHP1 and BHP2. Results were not statistically different (p < 0.05), and coefficients of determination R2 were always found to be above 0.90, with the exception of ηTVS calculated for FW assays. In this case, values obtained from BHP1 tests were significantly lower than BHP2, with this finding attributable to the heterogeneity of FW.
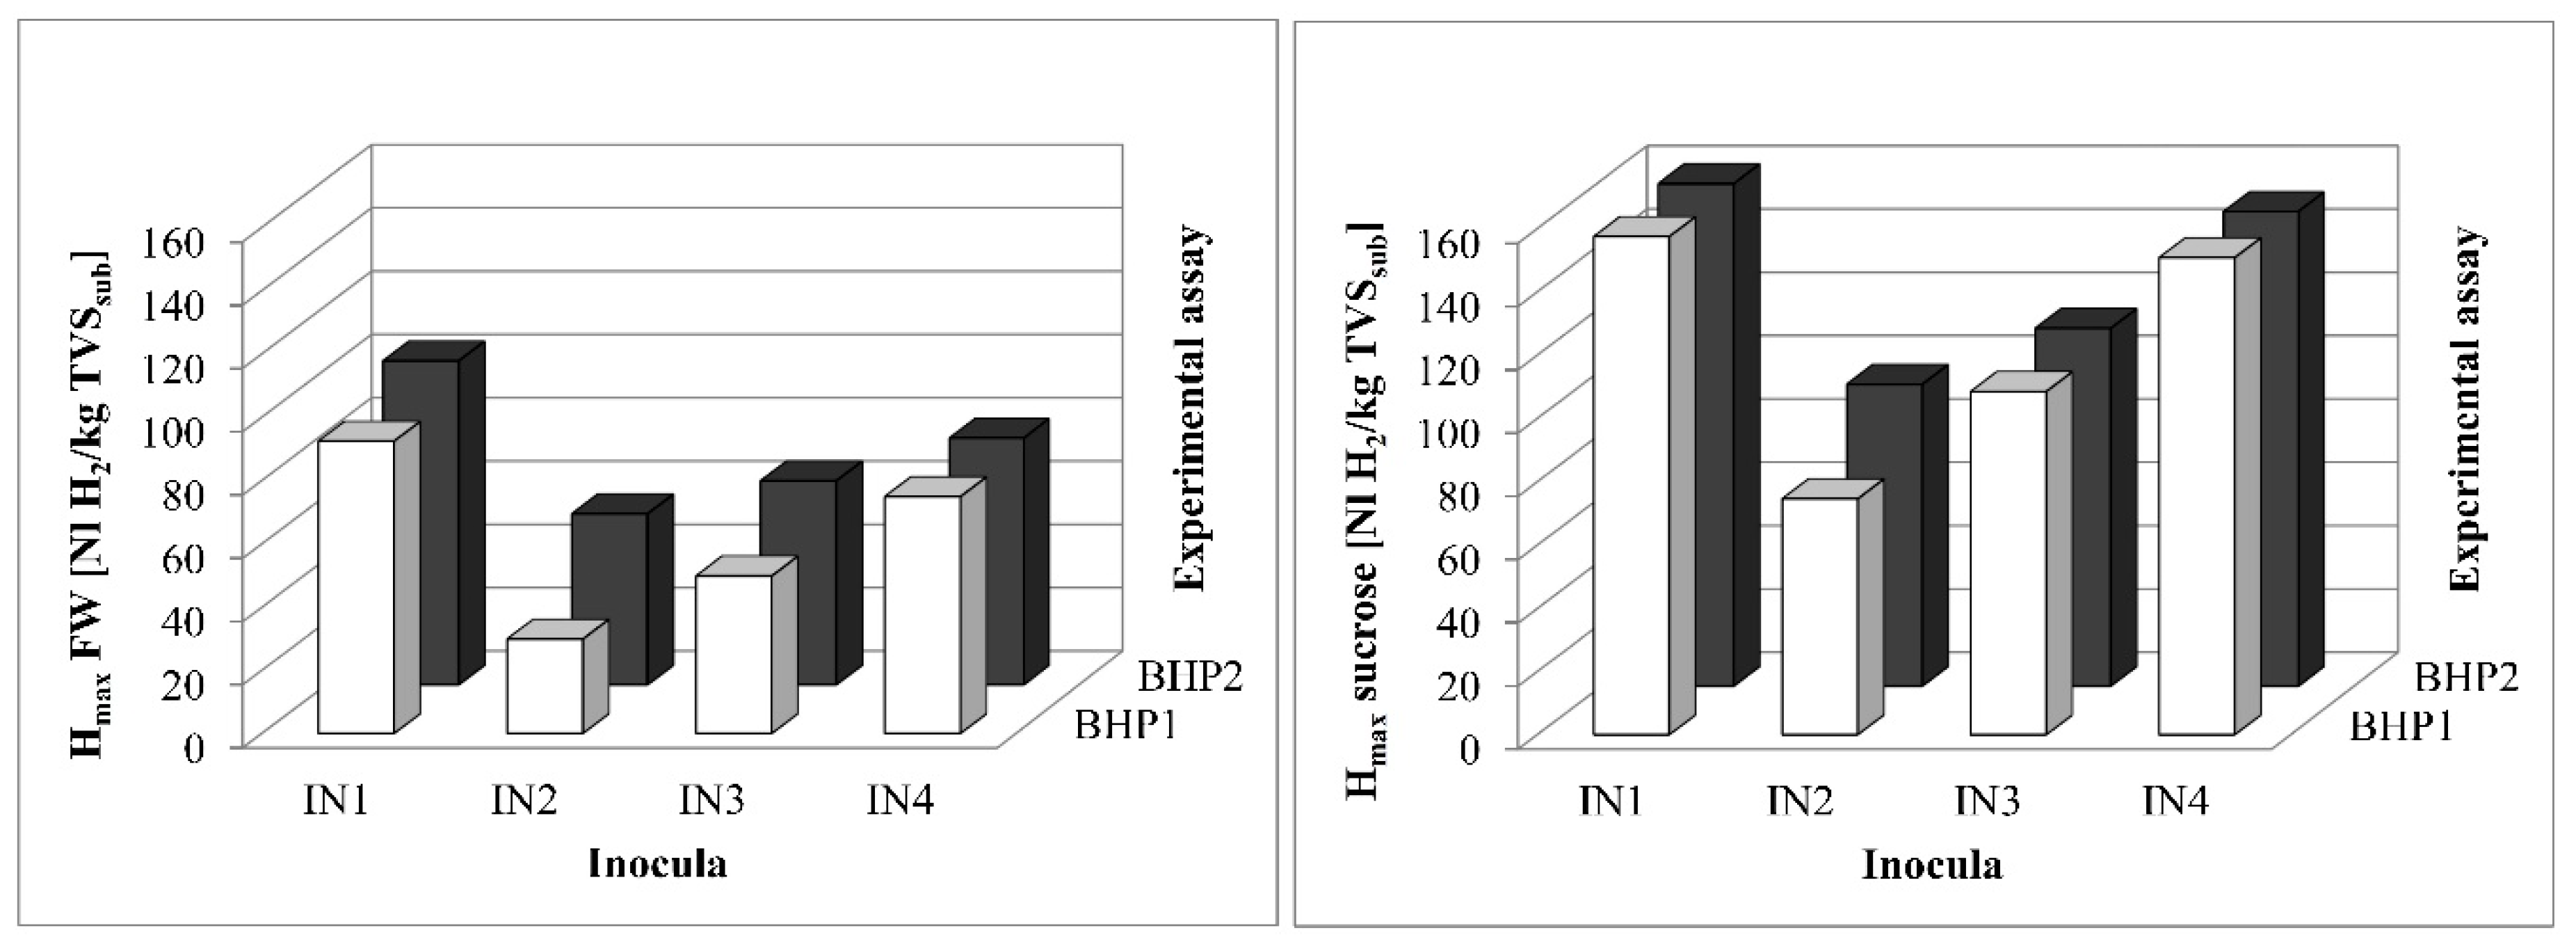
The kinetic parameters derived from fitting of the experimental data with the Gompertz equation (Equation (3)) are shown in Table 3, while Hmax results are depicted in Figure 3.
The Gompertz model fitted the experimental data well, with high coefficients of determination for all the assays (R2(G) > 0.977). In analogy with SHP results, Hmax data highlighted a good correlation between BHP1 and BHP2 findings (R2 > 0.94, p < 0.05) with assays performed with activated sludge (IN1) as inoculum, which obtained the highest hydrogen yields for both FW and sucrose. The linear correlation between BHP1 and BHP2 was not evident for the other kinetic parameters, due to differences in data acquisition methods. Indeed, while for BHP2 assays, volumetric gas production was recorded every 5 min, for BHP1 tests the time between two pressure measurements was in the range of a few hours. The maximum hydrogen production rates for FW were in the ranges of 1.4–5.2 NL H2/kg TVSsub h and 5.9–7.3 NL H2/kg TVSsub h for BHP1 and BHP2 respectively. These findings were in the range of previous literature data. Cappai et al. [21] reported maximum hydrogen production rates in the range of 2.4–16.6 NL H2/kg TVSsub h, depending on pH and inoculum pre-treatment, while De Gioannis et al. [20] found a maximum hydrogen production rate of 3.9 NL H2/kg TVSsubh. Concerning sucrose, maximum hydrogen production rates were higher than those found for FW, due to the higher biodegradability of the substrate: 5.4–8.4 NL H2/kg TVSsub h and 6.4–10.1 NL H2/kg TVSsub h for BHP1 and BHP2 respectively. In the matter of t95, the time required to attain 95% of the maximum hydrogen yield was found to be slightly higher for sucrose (28.8–39.4 h for BHP1 and 23.6–46.2 h for BHP2) than for FW (26.3–32.3 h for BHP1 and 20.0–32.9 h for BHP2). These results were concurrent with previous works (Cappai et al. [21]: t95 = 9.1–32.2 h; De Gioannis et al. [20]: t95 = 26.4 h).
In order to identify linear relationships between the variables of concern, two Pearson matrices showing the determination coefficients (R2) were carried out for FW and sucrose separately (Table 4). Given the correlation between BHP1 and BHP2 results, the data from the two experimental set-ups were treated together. In these tables, R2 values >0.6 were accepted as valuable.
What is relevant from Table 4 is a high degree of correlation between the experimental variables (SHP, ηTVS, and Em) and Clostridium perfringens sp. spore concentration, which is particularly related to the production of hydrogen (R2 > 0.9). This confirms the analogy between the experimental results obtained from two different set-ups and the relevance of the Clostridum perfringens sp. in the production of hydrogen. On the other hand, no correlation was found between the kinetic variables of the Gompertz model, especially between r, λ, and t95. This result is attributable to the differences of the two set-ups, with particular regard to their data acquisition methods. While in BHP1, biogas production in the vessels was measured periodically, in BHP2 biogas production was recorded every 5 min. As can be seen from Table 3 and Figure 1 and Figure 2, final hydrogen productions exhibited comparable results between BHP1 and BHP2, but hydrogen generation trends over time were distinct, highlighting different kinetic parameters (r, λ, t95).
4. Conclusions
With the aim of assessing the role of seeding sludge in the performance of batch fermentation assays, two different biochemical hydrogen potential tests with two substrates (food waste and sucrose) were carried out, using four types of inoculum collected from different sources.
Observing the BHP test results, it was evident that the hydrogenic process in batch assays was highly dependent on the type of inoculum. Statistical analysis highlighted statistically different results, indicating that findings are due to the different inocula used in the tests. In particular, assays performed with activated sludge (IN1) highlighted higher specific hydrogen productions (SHP), TVS removal efficiencies (ηTVS), and conversion efficiencies (Em) for both substrates and both experimental set-ups.
These results confirm the correct use of activated sludge as inoculum in BHP tests demonstrated by some previous works. More specifically, it can be concluded that activated sludge is the seeding sludge that best valorises biodegradable waste via dark fermentation in batch assays. Future works should take into consideration the use of this inoculum to perform biochemical hydrogen potential tests.
Author Contributions
Conceptualization, I.P. and F.B.; Methodology, I.P.; Software, I.P.; Validation, I.P., F.B. and R.I.; Formal Analysis, I.P.; Investigation, F.B.; Resources, I.P.; Data Curation, F.B.; Writing-Original Draft Preparation, I.P.; Writing-Review & Editing, I.P.; Visualization, I.P.; Supervision, R.I.; Project Administration, I.P.; Funding Acquisition, I.P.
Funding
This work was supported by the Bio2Energy project, a project funded by MIUR-Regione Toscana DGRT 1208/2012 and MIUR-MISE-Regione Toscana DGRT 758/2013 PAR FAS 2007-2013 in sub-programme FAR-FAS 2014 (Linea d’Azione 1.1).
Conflicts of Interest
The authors declare no conflict of interest.
References
- IPCC. Climate Change 2014: Impacts, Adaptation and Vulnerability. Part A: Global and Sectoral Aspects. Contribution of Working Group II to the Fifth Assessment report of the Intergovernmental Panel on Climate Change; Field, C.B., Barros, V.R., Dokken, D.J., Mach, K.J., Mastrandrea, M.D., Bilir, T.E., Chatterjee, M., Ebi, K.L., Estrada, Y.O., Genova, R.C., et al., Eds.; Cambridge University Press: Cambridge, UK; New York, NY, USA, 2014; 1132p. [Google Scholar]
- European Commission. Report from the Commission to the European Parliament, the Council, the European Economic and Social Committee and the Committee of the Regions, Closing the Loop—An EU Action Plan for the Circular Economy, COM (2015); European Commission: Brussels, Belgium, 2015; 614 Final; pp. 1–21. [Google Scholar]
- Webster, K. What might we say about a circular economy? Some temptations to avoid if possible. J. Gen. Evol. 2013, 69, 542–554. [Google Scholar] [CrossRef]
- Heyer, K.-U.; Hupe, K.; Stegmann, R. Methane emissions from MBT landfills. Waste Manag. 2013, 33, 1853–1860. [Google Scholar] [CrossRef] [PubMed]
- Pecorini, I.; Baldi, F.; Bacchi, D.; Carnevale, E.A.; Corti, A. Leaching behaviour of hazardous waste under different ambient conditions. Waste Manag. 2017, 63, 96–106. [Google Scholar] [CrossRef] [PubMed]
- Alibardi, L.; Cossu, R. Effects of Carbohydrate, protein and lipid content of organic waste on hydrogen production and fermentation products. Waste Manag. 2016, 47, 69–77. [Google Scholar] [CrossRef] [PubMed]
- Sawatdeenarunat, C.; Nguyen, D.; Surendra, K.C.; Shrestha, S.; Rajendran, K.; Oechsner, H.; Xie, L.; Khanal, S.K. Anaerobic biorefinery: Current status, challenges, and opportunities. Bioresour. Technol. 2016, 215, 304–313. [Google Scholar] [CrossRef] [PubMed]
- Ghimire, A.; Frunzo, L.; Pirozzi, F.; Trably, E.; Escudie, R.; Lens, P.N.L.; Esposito, G. A review on dark fermentative biohydrogen production from organic biomass: Process parameters and use of by-products. Appl. Energy 2015, 144, 73–95. [Google Scholar] [CrossRef]
- De Gioannis, G.; Muntoni, A.; Polettini, A.; Pomi, R. A review of dark fermentative hydrogen production from biodegradable municipal waste fractions. Waste Manag. 2013, 33, 1345–1361. [Google Scholar] [CrossRef] [PubMed]
- Lee, Y.-W.; Chung, J. Bioproduction of hydrogen from food waste by pilot-scale combined hydrogen/methane fermentation. Int. J. Hydrog. Energy 2010, 35, 11746–11755. [Google Scholar] [CrossRef]
- Chinellato, G.; Cavinato, C.; Bolzonella, D.; Heaven, S.; Banks, C.J. Biohydrogen production from food waste in batch and semi-continuous conditions: Evaluations of a two-phase approach with digestate recirculation for pH control. Int. J. Hydrog. Energy 2013, 38, 4351–4360. [Google Scholar] [CrossRef]
- Yeshanew, M.M.; Frunzo, L.; Pirozzi, F.; Lens, P.N.L.; Esposito, G. Production of biohythane from food waste via an integrated system of continuously stirred tank and anaerobic fixed bed reactors. Bioresour. Technol. 2016, 220, 312–322. [Google Scholar] [CrossRef] [Green Version]
- Favaro, L.; Alibardi, L.; Lavagnolo, M.C.; Casella, S.; Basaglia, M. Effects of inoculum and indigenous microflora on hydrogen production from the organic fraction of municipal solid waste. Int. J. Hydrog. Energy 2013, 38, 11774–11779. [Google Scholar] [CrossRef]
- Alibardi, L.; Cossu, R. Composition variability of the organic fraction of municipal solid waste and effects on hydrogen and methane production potentials. Waste Manag. 2015, 36, 147–155. [Google Scholar] [CrossRef] [PubMed]
- Lavagnolo, M.C.; Girotto, F.; Rafieenia, R.; Danieli, L.; Alibardi, L. Two-stage anaerobic digestion of the organic fraction of municipal solid waste—Effects of process conditions during batch tests. Renew. Energy 2018, 126, 14–20. [Google Scholar] [CrossRef]
- Giordano, A.; Cantù, C.; Spagni, A. Monitorign the biochemical hydrogen and methane potential of the two-stage dark-fermentative process. Bioresour. Technol. 2011, 102, 4474–4479. [Google Scholar] [CrossRef]
- Argun, H.; Kargi, F.; Kapdan, I.K.; Oztekin, R. Biohydrogen production by dark fermentation of wheat powder solution: Effects of C/N and C/P ratio on hydrogen yield and formation rate. Int. J. Hydrog. Energy 2008, 33, 1813–1819. [Google Scholar] [CrossRef]
- Pan, J.; Zhang, R.; El-Mashad, R.H.; Sun, H.; Ying, Y. Effect of food to microorganism ratio on biohydrogen production from food waste via anaerobic fermentation. Int. J. Hydrog. Energy 2008, 33, 6968–6975. [Google Scholar] [CrossRef]
- Akhlagi, M.; Boni, M.R.; De Gioannis, G.; Muntoni, A.; Polettini, A.; Pomi, R.; Rossi, A.; Spiga, D. A parametric response surface study of fermentative hydrogen production from cheese whey. Bioresour. Technol. 2017, 244, 473–483. [Google Scholar] [CrossRef] [PubMed]
- De Gioannis, G.; Muntoni, A.; Polettini, A.; Pomi, R.; Spiga, D. Energy recovery from one- and two-stage anaerobic digestion of food waste. Waste Manag. 2017, 68, 595–602. [Google Scholar] [CrossRef] [PubMed]
- Cappai, G.; De Gioannis, G.; Friargiu, M.; Massi, E.; Muntoni, A.; Polettini, A.; Pomi, R.; Spiga, D. An experimental study on fermentative H2 production from food waste as affected by pH. Waste Manag. 2014, 34, 1510–1519. [Google Scholar] [CrossRef] [PubMed]
- Holliger, C.; Alves, M.; Andrade, D.; Angelidaki, I.; Astals, S.; Baier, U.; Bougrier, C.; Buffiére, P.; Carballa, M.; De wilde, V.; et al. Towards a standardisation of biomethane potential tests. Water Sci. Technol. 2016, 74. [Google Scholar] [CrossRef]
- Huang, Y.; Zong, W.; Yan, X.; Wang, R.; Hemme, C.L.; Zhou, J.; Zhou, Z. Succession of the bacterial community and dynamics of hydrogen producers in a hydrogen-producing bioreactor. Appl. Environ. Microbiol. 2010, 76, 3387–3390. [Google Scholar] [CrossRef] [PubMed]
- Wang, R.; Zong, W.; Qian, C.; Wei, Y.; Yu, R.; Zhou, Z. Isolation of Clostridium perfringens strain W11 and optimization of its biohydrogen production by genetic modification. Int. J. Hydrog. Energy 2011, 36, 12159–12167. [Google Scholar] [CrossRef]
- Wong, Y.M.; Wu, T.Y.; Ling, T.C.; Show, P.L.; Lee, S.Y.; Chang, J.-S.; Ibrahim, S.; Juan, J.C. Evaluating new bio-hydrogen producers. Clostridium perfringens strain JJC, Clostridium bifermentans strains WYM and Clostridium sp. strain Ade.TY. J. Biosci. Bioeng. 2018, 5, 590–598. [Google Scholar] [CrossRef] [PubMed]
- Sivagurunathan, P.; Sen, B.; Lin, C.-Y. Batch fermentative hydrogen production by enriched mixed culture: Combination strategy and their microbial composition. J. Biosci. Bioeng. 2014, 117, 222–228. [Google Scholar] [CrossRef] [PubMed]
- Jame, R.; Zelená, V.; Lakatoš, B.; Varečka, Ľ. Carbon source utilization and hydrogen production by isolated anaerobic bacteria. Acta Chim. Slov. 2016, 9, 62–67. [Google Scholar] [CrossRef] [Green Version]
- Zhi, Z.; Wang, H. White-rot fungal pretreatment of wheat straw with Phanerochaete chrysosporium for biohydrogen production: Simultanous saccharification and fermentation. Bioprocess Biosyst. Eng. 2014, 37, 1447–1458. [Google Scholar] [CrossRef] [PubMed]
- Xiao, L.; Deng, Z.; Fung, K.Y.; Ng, K.M. Biohydrogen generation from anaerobic digestion of food waste. Int. J. Hydrog. Energy 2013, 38, 13907–13913. [Google Scholar] [CrossRef]
- Park, W.; Jang, N.J.; Hyun, S.H.; Kim, I.S. Suppression of hydrogen consuming bacteria in anaerobic hydrogen fermentation. Environ. Eng. Res. 2005, 10, 181–190. [Google Scholar] [CrossRef]
- Zumar Bundhoo, M.A.; Mohee, R. Inhibition of dark fermentative bio-hydrogen production: A review. Int. J. Hydrog. Energy 2016, 41, 6713–6733. [Google Scholar] [CrossRef]
- Wang, J.; Wan, W. Factors influencing fermentative hydrogen production: A review. Int. J. Hydrog. Energy 2009, 34, 799–811. [Google Scholar] [CrossRef]
- Chen, W.-H.; Chen, S.-Y.; Khanal, S.K.; Sung, S. Kinetic study of biological hydrogen production by anaerobic fermentation. Int. J. Hydrog. Energy 2006, 31, 2170–2178. [Google Scholar] [CrossRef]
- Micolucci, F.; Gottardo, M.; Bolzonella, D.; Pavan, P. Automatic process control for stable bio-hythane production in two-phase thermophilic anaerobic digestion of food waste. Int. J. Hydrog. Energy 2014, 39, 17563–17572. [Google Scholar] [CrossRef]
- Pecorini, I.; Baldi, F.; Carnevale, E.A.; Corti, A. Biochemical methane potential tests of different autoclaved and microwaved lignocellulosic organic fractions of municipal solid waste. Waste Manag. 2016, 56, 143–150. [Google Scholar] [CrossRef] [PubMed]
- Lin, C.Y.; Lay, C.H. Carbon/nitrogen-ratio effect on fermentative hydrogen production by mixed microflora. Int. J. Hydrog. Energy 2004, 29, 41–45. [Google Scholar] [CrossRef]
- Dellosso Penteado, E.; Zampol Lazaro, C.; Kimiko Sakamoto, I.; Zaiat, M. Influence of seed sludge and pretreatment method on hydrogen production in packed-bed anaerobic reactors. Int. J. Hydrog. Energy 2013, 38, 6137–6145. [Google Scholar] [CrossRef]
- Pecorini, I.; Olivieri, T.; Bacchi, D.; Paradisi, A.; Lombardi, L.; Corti, A.; Carnevale, E. Evaluation of gas production in a industrial anaerobic digester by means of Biochemical Methane Potential of Organic Municipal Solid Waste Components. In Proceedings of the ECOS 2012, The 25th International Conference on Efficiency, Cost, Optimization, Simulation and Environmental Impact of Energy Systems, Perugia, Italy, 26–29 June 2012. [Google Scholar]
- Pecorini, I.; Akhlaghi, M.; Baldi, F.; Albini, E.; Rossi, A.; Bacchi, D.; Polettini, A.; Lombardi, L.; Pomi, R. Influence of pH and inoculum addition on biohydrogen production from the organic fraction of municipal waste. In Proceedings of the Sardinia Symposium 2017, 16th International Waste Management and Landfill Symposium, Forte Village/Santa Margherita di Pula (CA), Italy, 2–6 October 2017. [Google Scholar]
- Van Ginkel, S.; Oh, S.-E.; Logan, B.E. Biohydrogen gas production from food waste processing and domestic wastewaters. Int. J. Hydrog. Energy 2005, 30, 1535–1542. [Google Scholar] [CrossRef]
- Logan, B.E.; Oh, S.-E.; Van Ginkel, S. Biological hydrogen production measured in batch anaerobic respirometers. Environ. Sci. Technol. 2002, 36, 2530–2535. [Google Scholar] [CrossRef] [PubMed]
- APHA. Standard Methods for the Examination of Water and Wastewater, 18th ed.; American Public Health Association: Washington, DC, USA, 2006. [Google Scholar]
- European Commission. European Commission Regulation 2009/152/EC of 27 January 2009 laying down the methods of sampling and analysis for the official control of feed. Off. J. Eur. Union 2009, 1–54. [Google Scholar]
- Martillotti, F.; Antongiovanni, M.; Rizzi, L.; Santi, E.; Bittante, G. Metodi di analisi per gli alimenti d’impiego zootecnico. Quaderni metodologici n. 8; CNR-IPRA: Rome, Italy, 1987. [Google Scholar]
- AOAC. Official Methods of Analysis of Association of Official Analytical Chemists International, 17th ed.; Association of Analytical Communities: Gaithersburg, MD, USA, 2003. [Google Scholar]
- EN 15407. EN 15407:2011 Solid Recovered Fuels—Methods for the Determination of Carbon (C), Hydrogen (H) and Nitrogen (N) Content. 2011. Available online: http://store.uni.com/catalogo/index.php/en-15407-2011.html (accessed on 24 January 2019).
- EPA 6010 D. Inductively Coupled Plasma—Optical Emission Spectrometry. 2014. Available online: https://www.epa.gov/sites/production/files/2015-07/documents/epa-6010c.pdf (accessed on 24 January 2019).
- EN 13657. EN 13657:2004 Characterization of Waste—Digestion for Subsequent Determination of Aqua Regia Soluble Portion of Elements. 2004. Available online: http://store.uni.com/catalogo/index.php/en-13657-2002.html (accessed on 24 January 2019).
- EN ISO 13137. EN ISO 13137:2002 Characterization of Waste—Determination of Total Organic Carbon (TOC) in Waste, Sludges and Sediments. 2002. Available online: http://store.uni.com/catalogo/index.php/en-13137-2001.html (accessed on 24 January 2019).
- APHA. APHA 4500 NH3 B/C—Ammonia-Selective Electrode Method. 2012. Available online: https://www.edgeanalytical.com/wp-content/uploads/Waste_SM4500-NH3.pdf (accessed on 24 January 2019).
- US EPA. Method 8315A (SW-846): Determination of Carbonyl Compounds by High Performance Liquid Chromatography (HPLC), Revision 1; US EPA: Washington, DC, USA, 1996.
- Araujo, M.; Sueiro, R.A.; Gómez, M.J.; Garrido, M.J. Enumeration of Clostridium perfringens spores in groundwater samples: Comparison of six culture media. J. Microbiol. Methods 2004, 57, 175–180. [Google Scholar] [CrossRef]
- Junqueira, V.C.; Neto, R.C.; da Silva, N.; Terra, J.H. Comparison of methods for the enumeration of Clostridium perfringens spores in water. Water Sci. Technol. 2012, 65, 227–232. [Google Scholar] [CrossRef]
- Zhang, R.; El-Mashad, H.M.; Hartman, K.; Wang, F.; Liu, G.; Choate, C.; Gamble, P. Characterization of food waste as feedstock for anaerobic digestion. Bioresour. Technol. 2007, 98, 929–935. [Google Scholar] [CrossRef] [PubMed]
- Han, S.-K.; Shin, H.-S. Biohydrogen production by anaerobic fermentation of food waste. Int. J. Hydrog. Energy 2004, 29, 569–577. [Google Scholar] [CrossRef]
- Iacovidou, E.; Ohandja, D.; Voulvoulis, N. Food waste co-digestion with sewage sludge—Realising its potential in the UK. J. Environ. Manag. 2012, 112, 267–274. [Google Scholar] [CrossRef] [PubMed]
- Kayhanian, M. Ammonia inhibition in high-solids biogasification: An overview and practical solutions. Environ. Technol. 1999, 20, 355–365. [Google Scholar] [CrossRef]
- Sterling, M.C., Jr.; Lacey, R.E.; Engler, C.R.; Ricke, S.C. Effects of ammonia nitrogen on H2 and CH4 production during anaerobic digestion of dairy cattle manure. Bioresour. Technol. 2001, 77, 9–18. [Google Scholar] [CrossRef]
- Salerno, M.B.; Park, W.; Zuo, Y.; Logan, B.E. Inhibition of biohydrogen production by ammonia. Water Res. 2006, 40, 1167–1172. [Google Scholar] [CrossRef] [PubMed]
- Wilson, C.A.; Novak, J.T. Hydrolysis of macromolecular components of primary and secondary wastewater sludge by thermal hydrolytic pretreatment. Water Res. 2008, 43, 4489–4498. [Google Scholar] [CrossRef] [PubMed]
- Chu, C.-F.; Li, Y.-Y.; Xu, K.-Q.; Ebie, Y.; Inamori, Y.; Kong, H.-N. A pH- and temperature-phased two-stage process for hydrogen and methane production from food waste. Int. J. Hydrog. Energy 2008, 33, 4739–4746. [Google Scholar] [CrossRef]
- Srikanth, S.; Venkata Mohan, S. Regulatory function of divalent cations in controlling the acidogenic biohydrogen production process. RSC Adv. 2012, 2, 6576–6589. [Google Scholar] [CrossRef]
- Hao, X.; Zhou, M.; Yu, H.; Shen, Q.; Lei, L. Effect of sodium ion concentration on hydrogen production from sucrose by anaerobic hydrogen-producing granular sludge. Chin. J. Chem. Eng. 2006, 14, 511–517. [Google Scholar] [CrossRef]
- Kim, D.-H.; Kim, S.-H.; Shin, H.-S. Sodium inhibition of fermentative hydrogen production. Int. J. Hydrog. Energy 2009, 34, 3295–3304. [Google Scholar] [CrossRef]
- Cao, X.Y.; Zhao, Y.C. The influence of sodium on biohydrogen production from food waste by anaerobic fermentation. J. Mater. Cycles Waste Manag. 2009, 11, 244–250. [Google Scholar] [CrossRef]
- Elbeshbishy, E.; Dhar, B.R.; Nakhla, G.; Lee, H.-S. A critical review on inhibition of dark fermentation. Renew. Sustain. Energy Rev. 2017, 79, 656–668. [Google Scholar] [CrossRef]
- Lee, K.S.; Wu, J.F.; Lo, Y.S.; Lo, Y.C.; Lin, P.J.; Chang, J.S. Anaerobic hydrogen production with an efficient carrier-induced granular sludge bed bioreactor. Biotechnol. Bioeng. 2004, 87, 648–657. [Google Scholar] [CrossRef] [PubMed] [Green Version]
- Yuan, Z.; Yang, H.; Zhi, X.; Shen, J. Increased performance of continuous stirred tank reactor with calcium supplementation. Int. J. Hydrog. Energy 2010, 35, 2622–2626. [Google Scholar] [CrossRef]
- Chang, F.Y.; Lin, C.Y. Calcium effect on fermentative hydrogen production in an anaerobic up-flow sludge blanket system. Water Sci. Technol. 2006, 54, 105–112. [Google Scholar] [CrossRef] [PubMed]
- Pecorini, I.; Bacchi, D.; Albini, E.; Baldi, F.; Galoppi, G.; Rossi, P.; Paoli, P.; Ferrari, L.; Carnevale, E.A.; Peruzzini, M.; et al. The Bio2Energy project: Bioenergy, biofuels and bioproducts from municipal solid waste and sludge. In Proceedings of the EUBCE 2017 Proceedings, 25th Edition European Biomass Conference & Exhibition, Stockholm, Sweden, 12–15 June 2017. [Google Scholar]
- Van Ginkel, S.; Sung, S.; Lay, J.-J. Biohydrogen production as a function of pH and substrate concentration. Environ. Sci. Technol. 2001, 35, 4726–4730. [Google Scholar] [CrossRef]
Figure 1.
Mean SHP curves obtained for the tests without automatic pH control (BHP1). Points indicate experimental results, solid lines Gompertz model trends. The four inocula are represented as follows: IN1 (●), IN2 (□), IN3 (■), IN4 (○).
Figure 1.
Mean SHP curves obtained for the tests without automatic pH control (BHP1). Points indicate experimental results, solid lines Gompertz model trends. The four inocula are represented as follows: IN1 (●), IN2 (□), IN3 (■), IN4 (○).

Figure 2.
Mean SHP curves obtained for the tests with automatic pH control (BHP2). Points indicate experimental results, solid lines Gompertz model trends. The four inocula are represented as follows: IN1 (●), IN2 (□), IN3 (■), IN4 (○).
Figure 2.
Mean SHP curves obtained for the tests with automatic pH control (BHP2). Points indicate experimental results, solid lines Gompertz model trends. The four inocula are represented as follows: IN1 (●), IN2 (□), IN3 (■), IN4 (○).

Figure 3.
Results of the design of experiments in terms of total amount of hydrogen produced, Hmax. The two experimental set-ups are represented as follows: BHP1 (□), BHP2 (■).
Figure 3.
Results of the design of experiments in terms of total amount of hydrogen produced, Hmax. The two experimental set-ups are represented as follows: BHP1 (□), BHP2 (■).


Table 1.
Food waste and inocula characterization. Values are expressed by averages and standard deviations (n = 3).
Table 1.
Food waste and inocula characterization. Values are expressed by averages and standard deviations (n = 3).
| Parameters | IN1 | IN2 | IN3 | IN4 | FW |
|---|---|---|---|---|---|
| Origin | Activated sludge | Dig. sludge OFMSW and manure | Dig. sludge Agro-industrial | Dig. sludge WWTP | OFMSW kerbside system |
| pH | 7.1 ± 0.0 | 8.2 ± 0.1 | 7.8 ± 0.1 | 6.7 ± 0.1 | 3.8 ± 0.1 |
| TS (% w/w) | 2.1 ± 0.2 | 2.9 ± 0.1 | 3.2 ± 0.4 | 2.1 ± 0.0 | 5.6 ± 0.1 |
| TVS (% w/w) | 1.5 ± 0.1 | 1.8 ± 0.1 | 1.8 ± 0.3 | 1.7 ± 0.0 | 5.1 ± 0.1 |
| TOC (%C w/w) | 1.2 ± 0.2 | 1.0 ± 0.1 | 1.2 ± 0.2 | 0.6 ± 0.1 | 1.9 ± 0.2 |
| TKN (%N w/w) | 0.2 ± 0.0 | 0.2 ± 0.0 | 0.2 ± 0.0 | 0.1 ± 0.0 | 0.2 ± 0.0 |
| Ammonia (mgN/L) | 341 ± 47 | 2025 ± 304 | 1040 ± 82 | 980 ± 79 | 191 ± 5 |
| Acetic acid (mg/L) | 830 ± 120 | <25 | <20 | <20 | 958 ± 30 |
| Propionic acid (mg/L) | 390 ± 71 | <25 | <40 | <40 | <40 |
| C (%TS) | 58.9 ± 4.3 | 34.6 ± 5.2 | 50.8 ± 3.7 | 52.1 ± 3.8 | 36.0 ± 1.9 |
| H (%TS) | 6.4 ± 0.5 | 5.7 ± 0.8 | 3.9 ± 0.3 | 5.2 ± 0.4 | 5.8 ± 0.2 |
| N (%TS) | 7.5 ± 0.9 | 8.9 ± 1.4 | 8.0 ± 0.9 | 10.5 ± 1.2 | 2.9 ± 0.3 |
| S (%TS) | 0.9 ± 0.1 | 0.7 ± 0.1 | 0.6 ± 0.1 | 1.2 ± 0.2 | 0.2 ± 0.0 |
| P (%TS) | 0.4 ± 0.1 | 0.9 ± 0.1 | 0.4 ± 0.1 | 1.7 ± 0.2 | 0.4 ± 0.1 |
| O (%TS) | 27.9 | 49.2 | 36.3 | 29.3 | 54.6 |
| C: N | 7.9 | 3.9 | 6.3 | 4.9 | 12.4 |
| Ca (mg/L) | 703 ± 85 | 840 ± 74 | 1240 ± 140 | 617 ± 56 | 1120 ± 13 |
| Mg (mg/L) | 109 ± 25 | 154 ± 14 | 220 ± 44 | 103 ± 24 | 166 ± 34 |
| Na (mg/L) | 121 ± 27 | 769 ± 66 | 710 ± 140 | 173 ± 36 | 550 ± 110 |
| Proteins (% w/w) | 0.9 ± 0.1 | 0.6 ± 0.1 | 1.2 ± 0.1 | 0.8 ± 0.1 | 1.0 ± 0.1 |
| Lipids (% w/w) | <0.3 | <0.3 | <0.3 | <0.3 | 0.3 ± 0.1 |
| Carbohydrates (% w/w) | <0.1 | <0.1 | 0.1 | 0.1 | 2.0 |
| Cellulose (% w/w) | 0.1 ± 0.0 | 0.2 ± 0.0 | 0.1 ± 0.0 | <0.1 | 1.5 ± 0.1 |
| Lignin (% w/w) | 0.3 ± 0.0 | 0.3 ± 0.1 | 0.3 ± 0.0 | <0.3 | 0.3 ± 0.1 |
| Clostridium Perfringens spore (CFU/mg) | 150 | 13 | 50 | 110 | - |
| Sucrose (% w/w) | - | - | - | - | 0.4 ± 0.2 |
| Glucose (% w/w) | - | - | - | - | 1.1 ± 0.4 |
| Fructose (%w/w) | - | - | - | - | 0.2 ± 0.1 |
Table 2.
Average experimental results of fermentative tests in terms of specific hydrogen production (SHP expressed in NL H2/kg TVSsub), volatile solids removal efficiency (ηTVS expressed in %), and conversion efficiency (Em expressed in %) obtained from the four inocula (IN1, IN2, IN3, IN4), two substrates (FW, sucrose), and two experimental set-ups (BHP1, BHP2). Results of the simple regression analysis are expressed by means of R2 and p-value (± SD, n = 3).
| BHP1 | BHP2 | BHP1 | BHP2 | BHP1 | BHP2 | ||
|---|---|---|---|---|---|---|---|
| Inoculum | Substrate | SHP | SHP | ηTVS | ηTVS | Em | Em |
| IN1 | FW | 90.2 ± 3.2 | 101.6 ± 2.5 | 24.1 ± 0.7% | 48.2 ± 1.2% | 27.0 ± 1.0% | 30.1 ± 0.7% |
| IN2 | FW | 29.3 ± 0.7 | 56.0 ± 2.5 | 14.3 ± 0.5% | 31.2 ± 1.5% | 14.9 ± 0.4% | 19.5 ± 0.9% |
| IN3 | FW | 50.2 ± 1.4 | 65.5 ± 2 | 14.8 ± 0.5% | 43.0 ± 1.7% | 7.2 ± 0.2% | 16.3 ± 0.5% |
| IN4 | FW | 74.0 ± 4.1 | 79.2 ± 2.6 | 23.5 ± 0.6% | 37.8 ± 0.8% | 20.2 ± 0.5% | 23.2 ± 0.8% |
| R2 | 0.94 | 0.27 | 0.96 | ||||
| p-value | 0.03 | >0.05 | 0.02 | ||||
| IN1 | Sucrose | 153.1 ± 2.1 | 155.3 ± 1.8 | 46.9 ± 1.0% | 58.2 ± 2.0% | 29.2 ± 0.4% | 29.6 ± 0.3% |
| IN2 | Sucrose | 74.6 ± 1.6 | 95.1 ± 2.1 | 34.6 ± 1.5% | 31.7 ± 1.4% | 20.9 ± 0.4% | 21.0 ± 0.5% |
| IN3 | Sucrose | 109.4 ± 1.0 | 110.2 ± 2.3 | 41.1 ± 1.1% | 46.3 ± 1.7% | 11.4 ± 0.1% | 17.7 ± 0.4% |
| IN4 | Sucrose | 149.9 ± 1.7 | 151.0 ± 2.5 | 44.8 ± 1.2% | 46.5 ± 1.5% | 28.6 ± 0.3% | 28.0 ± 0.5% |
| R2 | 0.97 | 0.90 | 0.94 | ||||
| p-value | 0.02 | 0.04 | 0.03 | ||||
Table 3.
Kinetic parameters obtained from the application of the Gompertz model: total amount of hydrogen produced (Hmax in NL H2/kg TVSsub), maximum hydrogen production rate (r in NL H2/kg TVSsub h), length of the lag phase (λ in h). The times needed to attain 95% of the maximum hydrogen yield (t95 in h) and the linear correlation with the experimental data (R2(G)) are also presented. Results of the simple regression analysis are expressed by means of R2 and p-value.
| BHP1 | BHP2 | BHP1 | BHP2 | BHP1 | BHP2 | BHP1 | BHP2 | BHP1 | BHP2 | ||
|---|---|---|---|---|---|---|---|---|---|---|---|
| Inoculum | Substrate | Hmax | Hmax | r | r | λ | λ | t95 | t95 | R2(G) | R2(G) |
| IN1 | FW | 92.4 | 102.4 | 5.2 | 5.9 | 1.4 | 7.4 | 27.1 | 32.9 | 0.999 | 0.999 |
| IN2 | FW | 29.9 | 54.1 | 1.4 | 7.3 | 1.3 | 9.2 | 31.6 | 20.0 | 0.997 | 0.998 |
| IN3 | FW | 49.9 | 64.5 | 2.9 | 5.7 | 1.2 | 7.8 | 26.3 | 24.3 | 0.977 | 0.997 |
| IN4 | FW | 74.9 | 78.0 | 3.5 | 6.0 | 0.9 | 7.2 | 32.3 | 26.0 | 0.997 | 0.999 |
| R2 | 0.94 | 0.53 | 0.17 | 0.23 | |||||||
| p-value | 0.03 | >0.05 | >0.05 | >0.05 | |||||||
| IN1 | Sucrose | 157.5 | 158.8 | 6.4 | 10.1 | 3.4 | 10.9 | 39.4 | 34.0 | 0.998 | 0.998 |
| IN2 | Sucrose | 74.6 | 95.4 | 5.7 | 9.7 | 9.7 | 9.3 | 28.8 | 23.6 | 0.999 | 0.999 |
| IN3 | Sucrose | 108.5 | 113.1 | 5.4 | 8.8 | 0.7 | 12.0 | 30.2 | 30.7 | 0.996 | 0.997 |
| IN4 | Sucrose | 150.8 | 150.0 | 8.5 | 6.4 | 5.0 | 11.9 | 30.9 | 46.2 | 0.999 | 0.997 |
| R2 | 0.98 | 0.66 | 0.73 | 0.04 | |||||||
| p-value | 0.01 | >0.05 | >0.05 | >0.05 | |||||||
Table 4.
Pearson correlation matrices. Determination coefficients in bold are >0.6. All data are significantly correlated (p < 0.05). Clos. means Clostridium perfringes sp. spore concentration.
Table 4.
Pearson correlation matrices. Determination coefficients in bold are >0.6. All data are significantly correlated (p < 0.05). Clos. means Clostridium perfringes sp. spore concentration.
| FW | ||||||||
| Parameters | SHP | ηTVS | Clos. | Em | Hmax | r | λ | t95 |
| SHP | 1.00 | 0.67 | 0.92 | 0.83 | 1.00 | 0.58 | 0.26 | 0.20 |
| ηTVS | 0.67 | 1.00 | 0.39 | 0.61 | 0.64 | 0.77 | 0.82 | −0.10 |
| Clos. | 0.92 | 0.39 | 1.00 | 0.76 | 0.94 | 0.25 | −0.10 | 0.46 |
| Em | 0.83 | 0.61 | 0.76 | 1.00 | 0.84 | 0.55 | 0.32 | 0.26 |
| Hmax | 1.00 | 0.64 | 0.94 | 0.84 | 1.00 | 0.55 | 0.22 | 0.24 |
| r | 0.58 | 0.77 | 0.25 | 0.55 | 0.55 | 1.00 | 0.84 | −0.58 |
| λ | 0.26 | 0.82 | −0.10 | 0.32 | 0.22 | 0.84 | 1.00 | −0.52 |
| t95 | 0.20 | −0.10 | 0.46 | 0.26 | 0.24 | −0.58 | −0.52 | 1.00 |
| Sucrose | ||||||||
| Parameters | SHP | ηTVS | Clos. | Em | Hmax | r | λ | t95 |
| SHP | 1.00 | 0.80 | 0.96 | 0.73 | 1.00 | 0.20 | −0.09 | 0.70 |
| ηTVS | 0.80 | 1.00 | 0.85 | 0.51 | 0.82 | 0.29 | 0.14 | 0.56 |
| Clos. | 0.96 | 0.85 | 1.00 | 0.76 | 0.97 | 0.13 | −0.11 | 0.69 |
| Em | 0.73 | 0.51 | 0.76 | 1.00 | 0.74 | 0.31 | 0.26 | 0.53 |
| Hmax | 1.00 | 0.82 | 0.97 | 0.74 | 1.00 | 0.22 | −0.08 | 0.69 |
| r | 0.20 | 0.29 | 0.13 | 0.31 | 0.22 | 1.00 | 0.46 | −0.34 |
| λ | −0.09 | 0.14 | −0.11 | 0.26 | −0.08 | 0.46 | 1.00 | 0.11 |
| t95 | 0.70 | 0.56 | 0.69 | 0.53 | 0.69 | −0.34 | 0.11 | 1.00 |
© 2019 by the authors. Licensee MDPI, Basel, Switzerland. This article is an open access article distributed under the terms and conditions of the Creative Commons Attribution (CC BY) license (http://creativecommons.org/licenses/by/4.0/).
Share and Cite
MDPI and ACS Style
Pecorini, I.; Baldi, F.; Iannelli, R. Biochemical Hydrogen Potential Tests Using Different Inocula. Sustainability 2019, 11, 622. https://0-doi-org.brum.beds.ac.uk/10.3390/su11030622
AMA Style
Pecorini I, Baldi F, Iannelli R. Biochemical Hydrogen Potential Tests Using Different Inocula. Sustainability. 2019; 11(3):622. https://0-doi-org.brum.beds.ac.uk/10.3390/su11030622
Chicago/Turabian StylePecorini, Isabella, Francesco Baldi, and Renato Iannelli. 2019. "Biochemical Hydrogen Potential Tests Using Different Inocula" Sustainability 11, no. 3: 622. https://0-doi-org.brum.beds.ac.uk/10.3390/su11030622
Note that from the first issue of 2016, this journal uses article numbers instead of page numbers. See further details here.