Economic Assessment of Autonomous Electric Microtransit Vehicles
by
 , , ,
, , ,
Aybike Ongel
1,* ,
,
Erik Loewer
2,
Felix Roemer
1,3,
Ganesh Sethuraman
1,3,
Fengqi Chang
1,3 and
Markus Lienkamp
3 1
TUMCREATE Ltd., Singapore 138602, Singapore
2
School of Management, Technical University of Munich, 85748 Garching, Germany
3
Institute of Automotive Technology, Technical University of Munich, 85748 Garching, Germany
*
Author to whom correspondence should be addressed.
Sustainability 2019, 11(3), 648; https://0-doi-org.brum.beds.ac.uk/10.3390/su11030648
Submission received: 10 January 2019
/
Revised: 22 January 2019
/
Accepted: 23 January 2019
/
Published: 26 January 2019
(This article belongs to the Special Issue Transport Policy)
Abstract
:There is rapidly growing interest in autonomous electric vehicles due to their potential in improving safety, accessibility, and environmental outcomes. However, their market penetration rate is dependent on costs. Use of autonomous electric vehicles for shared-use mobility may improve their cost competitiveness. So far, most of the research has focused on the cost impact of autonomy on taxis and ridesourcing services. Singapore is planning for island-wide deployment of autonomous vehicles for both scheduled and on-demand services as part of their transit system in the year 2030. TUMCREATE developed an autonomous electric vehicle concept, a microtransit vehicle with 30-passenger capacity, which can complement the existing bus transit system. This study aims to determine the cost of autonomous electric microtransit vehicles and compare them to those of buses. A total cost of ownership (TCO) approach was used to compare the lifecycle costs. It was shown that although the acquisition costs of autonomous electric vehicles are higher than those of their conventional counterparts, they can reduce the TCO per passenger-km up to 75% and 60% compared to their conventional counterparts and buses, respectively.
1. Introduction
Current road-based public transportation systems around the world are dominated by fuel-powered non-automated vehicles. However, the technological advancement of alternative power sources and automated driving systems pose challenges to the current system. In particular, the possibility of improved safety [1,2,3] and accessibility [4] offered by autonomous vehicles (AVs) as well as improved air quality and noise levels through electrification of the power system are expected to enable a shift in current mobility trends, including public, private, and freight transportation. Recent studies have shown that the deployment of AVs in urban areas may reduce the number of private cars by approximately 80% [5]. However, this is only possible by using AVs for shared-use mobility [6]. Therefore, AV manufacturers have been leaning into van and minibus size vehicles with a passenger capacity between 10 and 30, and an electric powertrain. The AV sizes varying between a passenger car and a bus allows them serve as either fixed or on-demand microtransit services complementing the high capacity transit systems or as autonomous ridesourcing services [7,8,9,10].
There have been numerous autonomous shuttle [11,12,13] and bus tests [14] conducted around the world and more are planned for the coming years [15,16]. Although AVs are expected to be an accepted technology by the year 2030 [4], their penetration rate is dependent on costs. Driver compensation has been one of the major components of the transit operation costs. Because AVs do not require a driver, switching from piloted vehicles to AVs may lower operational costs [4]. The smoother driving provided by AVs may also reduce the operating costs compared to piloted vehicle by lowering energy consumption [2,3,17]. However, currently, autonomous driving technology constitutes the major cost component of the vehicle, making AVs more expensive compared to regular vehicles. The typical costs for autonomous driving hardware including LIDAR (Light Detection And Ranging) sensors, cameras, a processing unit, and V2X equipment ranges around S$35,000–40,000 [18,19,20,21]. The Transport Systems Catapult study [22] estimates the autonomy package costs as S$7454 for the year 2025. This study also estimates a learning rate of 90–95% for autonomy packages based on the observed economies of scale, which would bring costs down to a range between S$3467 and S$6067 by the year 2035. The KPMG study [23] also estimates costs to go below S$4704 after 2030. Bansal and Kockelman [24] estimates a cost of S$25,360 for the Level 4 autonomy package assuming an annual price reduction rate of 5%. Litman [4] estimates navigation and security services costs, which are part of the autonomy package, as S$275–825 per year.
AVs are generally equipped with an electric battery, which also increases the acquisition cost of the vehicle. However, as in the case of AVs, operating costs may be reduced compared to conventional vehicles due to lower maintenance and energy costs required for electric powertrain [25,26,27,28,29,30]. It is also expected that battery prices go down with time and hence electric vehicles become cost effective compared to conventional vehicles in the long term [31,32].
Wadud [33] conducted a total cost of ownership (TCO) analysis to assess the cost effectiveness of autonomous private vehicles and commercial vehicles including taxis and trucks. It was shown that full automation may result in substantial reductions in TCO for commercial vehicles, approximately 30% for taxis, and 15% to 23% for trucks. However, there is no clear benefit of full automation for private vehicles. The reduction in TCO was mainly attributed to the savings from driver costs. The smaller vehicles benefit more from autonomous driving, since driver costs constitute larger share of their TCO. Hence, the early adaption of autonomy by taxis may bring significant reductions in costs. Further reductions in costs can be obtained by ride-sharing. The shared autonomous rides cost averaged S$0.16–0.65 per passenger-km [17,34,35,36] and non-shared autonomous rides averaged S$0.35–0.70 per passenger-km [17,34,36], whereas the piloted rides averaged S$0.63–0.80 per passenger-km [17]. The bus cost of S$0.72–1.25 per passenger-km was shown to go down to S$0.31–0.55 with the implementation of automation [17,34,36]. The previous research mainly focused on fuel-powered AVs, whereas further reductions in costs could be obtained by the implementation of battery electric vehicles.
Singapore is a city with over 5.6 million inhabitants and has the third-highest population density in the world today [37,38]. Due to the limited land space and growing number of vehicles, and hence increasing traffic congestion, Singapore’s Land Transport Authority (LTA) is working to increase the attractiveness of public transport to reduce the reliance on private vehicles for transportation [39]. Singapore is aiming to use AVs for fixed route-scheduled transit services as well as on-demand services. The island-wide deployment of AVs and the retrofitting/design of towns for the AVs are planned to be completed by 2030. TUMCREATE develops a new vehicle concept for the year 2030 that could operate as scheduled or on-demand microtransit vehicles in accordance with Singapore’s long-term transportation plans. The new concept is an autonomous, SAE Level 4/5, battery-electric vehicle with a capacity of 30 passengers. The autonomous microtransit vehicles are planned to operate on intermittent bus lanes in vehicle platoons with the number of vehicles in the platoon depending on the demand on each route [40]. However, before the full deployment of autonomous microtransit vehicles, an economic assessment should be conducted to identify the impact of the advance vehicle technology costs on the transit services.
This study aims to (i) assess the effects of incorporation of novel vehicle technologies, including full autonomy and electric powertrain, on the vehicle acquisition costs over time, (ii) determine and compare the lifecycle cost of autonomous electric microtransit vehicles with that of the conventional buses operating in Singapore. TCO approach was used to assess the cost effectiveness of the new microtransit vehicle concept. Because the new AVs are envisioned to operate starting from 2030, the TCO includes costs incurred beginning from the year 2030 until the end-of-life of the vehicle. However, the effects of new vehicle technologies on the vehicle acquisition costs were determined both for the years of 2017 and 2030 to evaluate the time effects on costs. The literature review indicated that there is considerable uncertainty in estimating how future technologies will develop and affect land passenger transport. Therefore, a sensitivity analysis has been conducted to demonstrate which cost contributors are most significant to the evaluation results.
It should be noted that this study evaluates costs incurred by the individual vehicle for the public transportation operators and compares the TCO of a bus with that of an autonomous electric microtransit vehicle. The required infrastructure is built by the government and leased to the operators. Therefore, the effects of autonomous electric vehicles on fleet size and hence traffic congestion or infrastructure requirements, e.g., charging infrastructure, bus depot requirements, were not evaluated. The bus ridership and hence the occupancy rates were assumed to stay the same for the new microtransit vehicles as modeling these effects were beyond the scope of this paper.
2. Materials and Methods
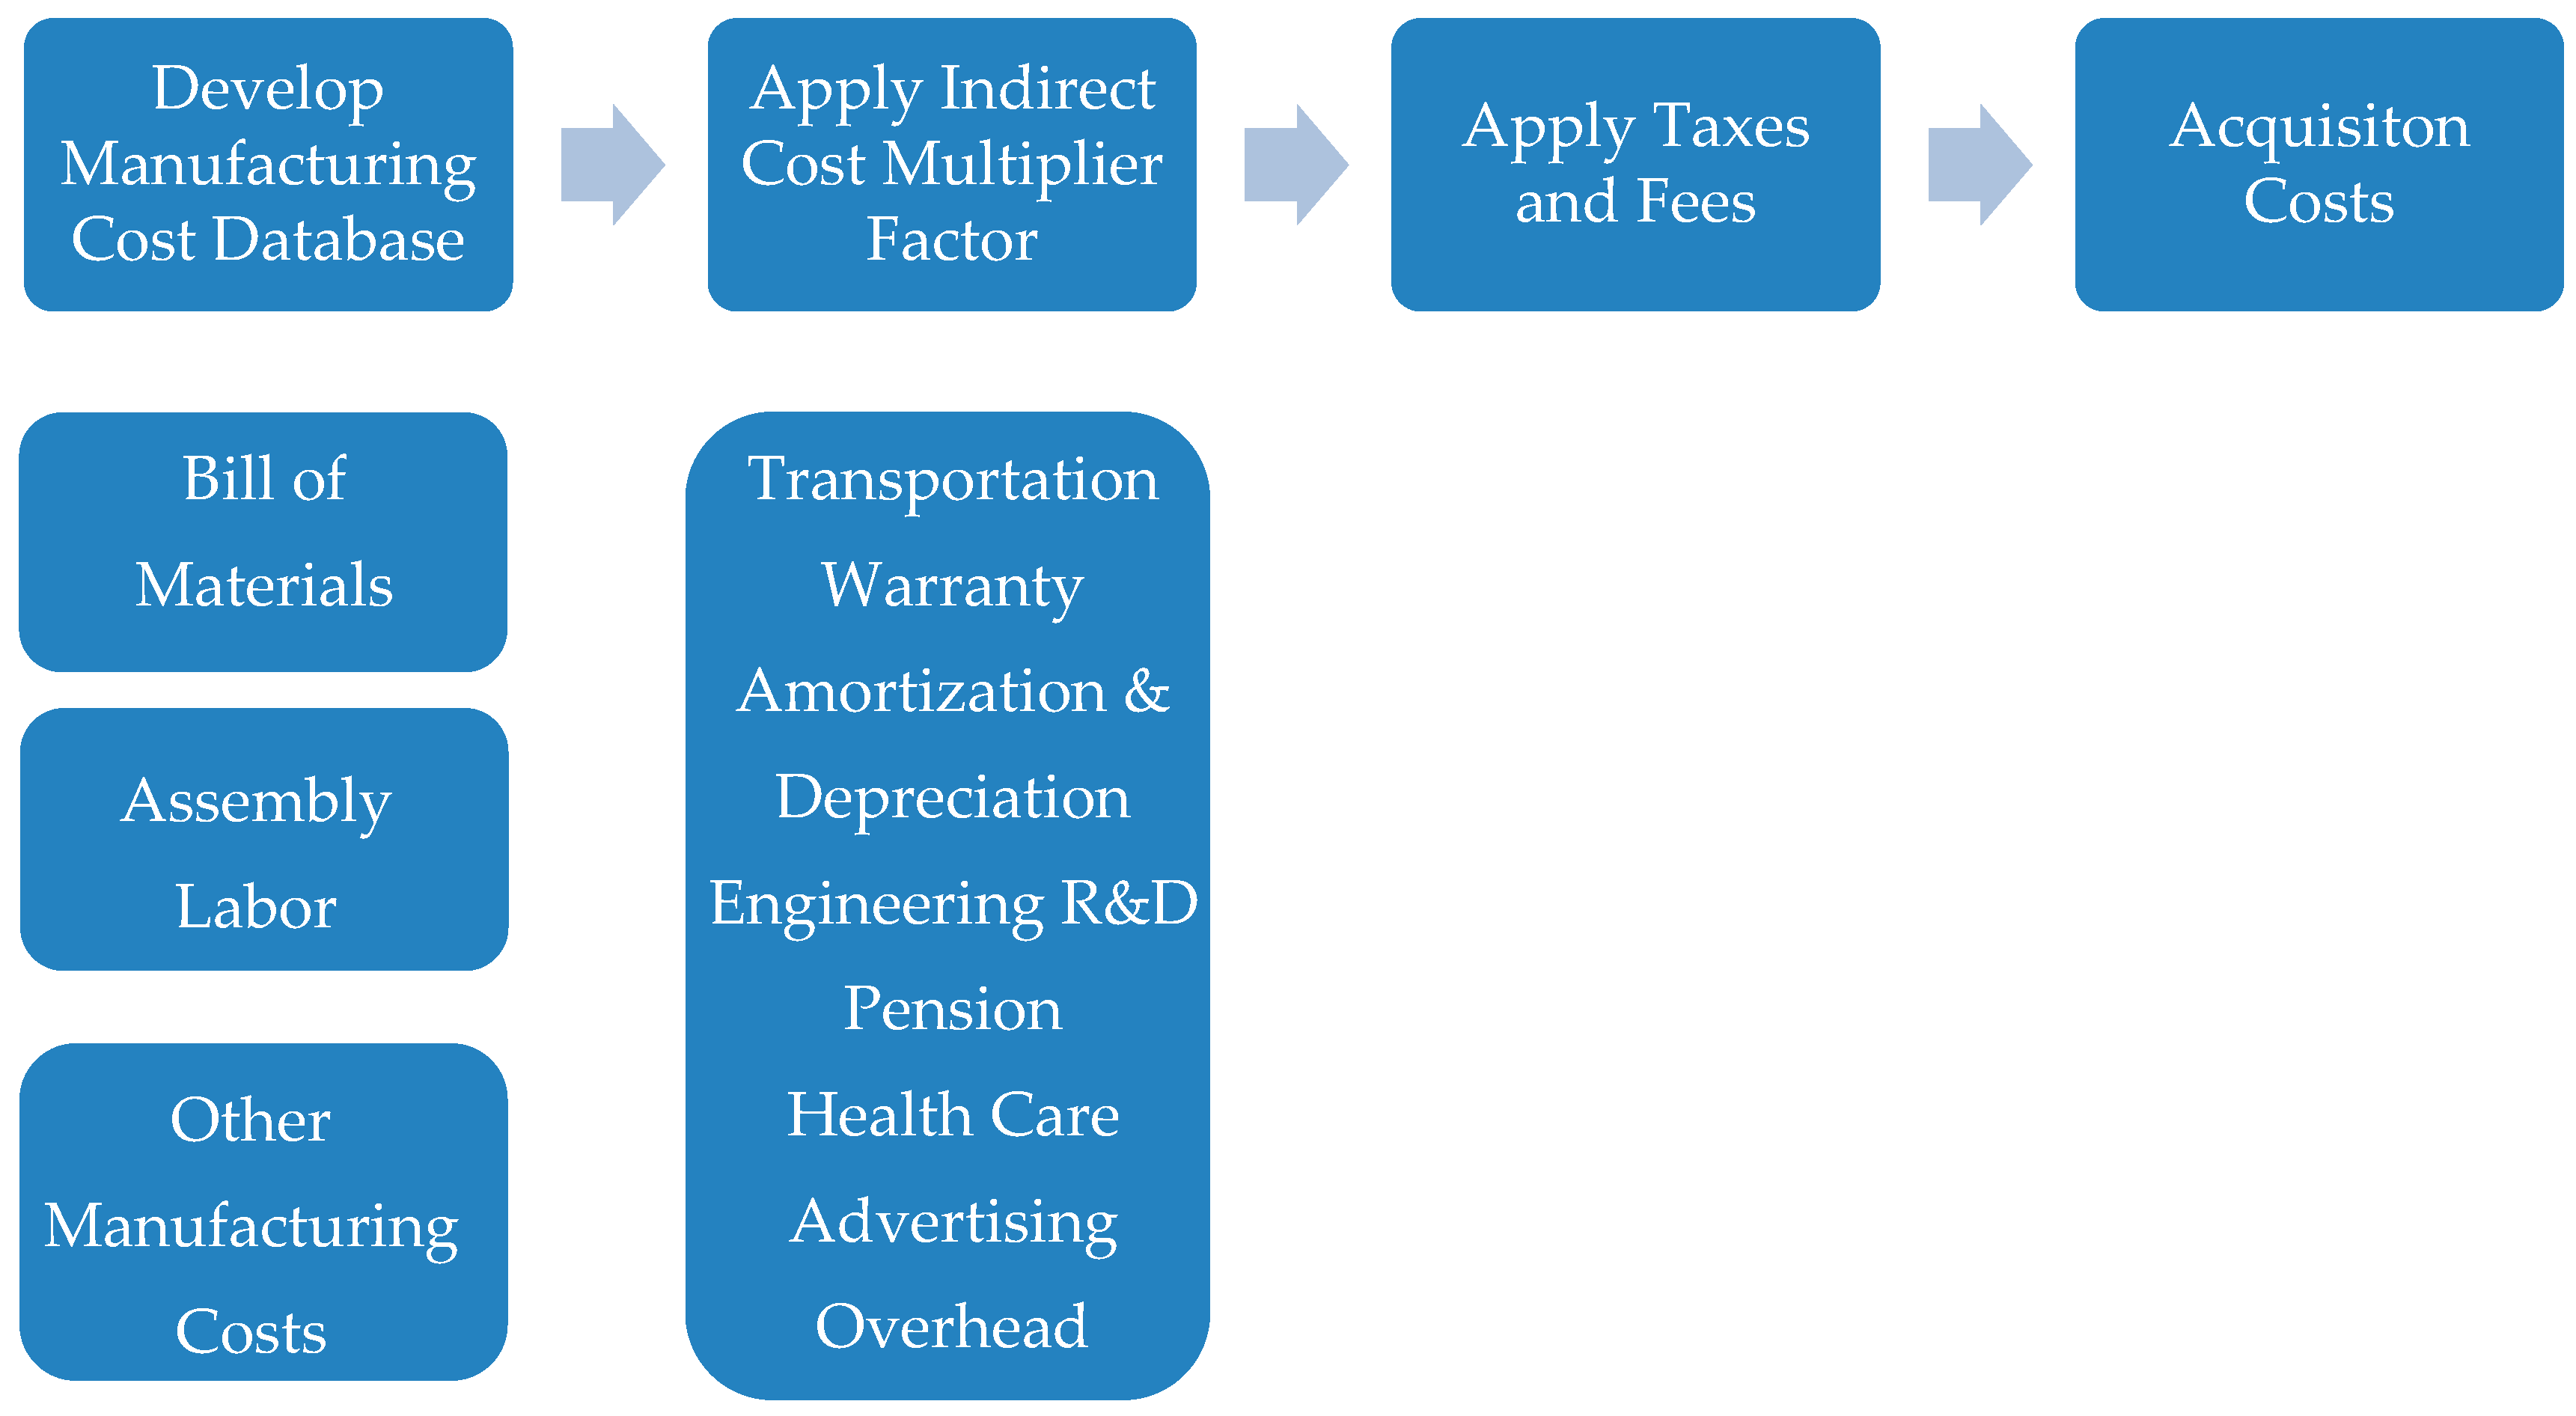
In this study, TCO analysis included three major cost components: acquisition costs, operating costs, and end-of-life costs. Acquisition costs consisted of manufacturing costs including bill of materials (BOM), labor costs, and other manufacturing costs such as electricity costs; fixed costs consisted of transportation/warranty, amortization and depreciation, engineering R&D, pension and health care, advertising, and overhead; and sales costs consisted of price discount and dealer mark-up [41]. Operating costs included road tax, electronic road pricing (ERP), energy costs, maintenance costs, insurance costs, cleaning costs, and personnel costs. End-of-life cost included costs incurred at the end of the vehicle’s operational life.
The impact of novel vehicle technologies on costs were assessed comparing the acquisition costs of three microtransit vehicle concepts, including internal combustion engine vehicle, electric vehicle, and autonomous electric vehicle. Then the TCO of the microtransit vehicles was calculated and compared to those of single- and double-deck buses currently operating in Singapore. The description of the evaluated vehicle concepts is given below:
- Internal Combustion Engine Vehicle (ICEV): 30-passenger maximum capacity internal combustion engine (ICE) powered non-automated microtransit vehicle with a length of 6 m.
- Electric Vehicle (EV): 30-passenger maximum capacity battery-electric non-automated microtransit vehicle with a length of 6 m. Currently, it requires a battery capacity of 120 kWh which was determined based on the schedule of the current buses. However, the lifetime of the battery pack may extend from 500 full cycles to 2000 full cycles by the year 2030 resulting in a smaller battery size for the same driving requirements [42]. Hence, a battery capacity of 80 kWh is estimated for the EVs for the year 2030 [43].
- Autonomous Electric Vehicle (AEV): 30-passenger maximum capacity fully autonomous (Level 4/5) electric microtransit vehicle with a length of 6 m. It has the same electric powertrain specifications as the EVs. The autonomous driving components include four LIDAR units, 2 cameras, additional units such as IMU (inertial measurement unit), ultrasonic sensors, multi-connectivity over Wi-Fi, 4G, and GPS, and an autonomous driving computer. Additionally, indoor and outdoor screens which allow for improved human-machine interaction (HMI) are included in the vehicle.
- Single-deck bus: 12 m ICE bus with a maximum passenger capacity of 90.
- Double-deck bus: 12 m ICE bus with a maximum passenger capacity of 130.
A lifecycle of 17 years was used in the TCO analysis for buses as well as for the microtransit vehicles, because LTA vehicle registration expires after 17 years and buses cease operation after the registration expiry. Because the autonomous microtransit system is expected to launch in 2030, the TCO was calculated for the period between 2030 and 2047. However, the acquisition costs of the ICEV, EV, and AEV were calculated for the year 2017 as well as 2030 to assess the impacts of new vehicle technologies over time. For the years where there are no forecasts for material, labor, energy costs, or taxes/fees exist, it was assumed that the cost fluctuation would follow the Consumer Price Index (CPI) [44]. Because there is no CPI prediction after the year 2020 an inflation rate of 1.9%, inflation rate just under 2%, as suggested by Monetary Authority of Singapore, was used to estimate the CPI [45].
2.1. Acquisition Costs
The acquisition costs for the single- and double-deck buses operating in Singapore were obtained from the LTA tender documents [46,47]. The acquisition cost determination scheme for the microtransit vehicles are given in Figure 1. First, a manufacturing cost database was developed including BOM, assembly labor, and other manufacturing costs. Then the acquisition costs were obtained scaling it by the indirect cost multiplier and adding the taxes and fees for the public transportation vehicles in Singapore.
The manufacturing cost database included the component costs, assembly costs and electricity costs both for the years 2017 and 2030 due to the possible changes in the raw material prices as well as technology and workforce costs in the future. A teardown costing method was applied to estimate the BOM. The 12 m single-deck buses were identified for teardown and a high-level BOM was created. The new and the base technologies for the electric and autonomous microtransit vehicles were identified. For each part/assembly of the vehicle, costs were estimated from raw material to finished products. A worksheet was developed for all parts with all cost elements. The new BOM was created for each of the ICE, EV, and AEV.
Table 1 provides the summary of the variables and assumptions used in estimations of the acquisition costs of the microtransit vehicle concepts for the year 2030. The price forecasts for the raw materials, including metals, plastics, lubricants, and chemicals were used to obtain the 2030 BOM for the vehicle body and chassis [48]. For the EV and AEV, vehicle technology prices for the year 2030 have also been estimated. The prices for 60 Ah battery cells for the year 2017 and 2030 were estimated as S$146/kWh and S$122/kWh, respectively [32]. The autonomous driving hardware costs included the sensors, cameras, and the processing unit prices [18,19,20,21]. The cost of a HMI system, an interactive screen for passenger to vehicle communication inside the vehicle and an outside screen for the pedestrian to vehicle communication, was included as part of the autonomous driving technology costs [49]. No autonomous driving software costs were included in the cost database assuming that the software would be free for the connected vehicles that are part of the data sharing platform. A learning curve with a learning rate of 90% was used for estimating the relationship between cumulative uptake and manufacturing cost reduction rates based on the economies of scale suggested by TSC (Transport Systems Catapult) market [22]. However, there may be further reductions in the autonomous driving technology costs as the LIDAR costs are projected to go down by 90–95% by the year 2025 even independent of the economies of scale [50].
In this study, it was assumed that annual production of the microtransit vehicles will be around 3000 vehicles per year similar to those of buses [51,52] and the vehicles are assembled in eastern Europe. Hence, the assembly costs were calculated based on the eastern European labor rates [53,54] and assembly time [32,53,55,56], while electricity costs were determined based on the vehicle assembly electricity consumption [57] and the electricity prices in eastern Europe for the years 2017 and 2030 [58,59].
An indirect cost multiplier (ICM) was applied to the total manufacturing costs to account for OEM (original equipment manufacturer) specific indirect costs, including R&D, corporate overhead, marketing, retail margin, warranty, and depreciation. The ICM value for the upper mid-range and premium cars given in Fries et al. [32] was used excluding the German tax rates.
The current fees and taxes/duties levied in the vehicle acquisition in Singapore are excise duty, good and services tax (GST), registration fee (RF), additional registration fee (ARF), certificate of entitlement (COE), and carbon emissions-based vehicle scheme [60]. They are either fixed values or calculated as a percentage of the open market value (OMV) of the vehicle, a price determined by the Singapore Customs based on the purchase price, which includes freight, insurance, and all other charges incidental to the sale and delivery of the vehicle to Singapore. The excise duty, a duty levied on goods imported into Singapore, is exempted for public buses in Singapore. The GST is a consumption tax levied on imported goods as well as almost all supply of goods and service which is better known in other countries as the Value-Added Tax (VAT). The GST levied on vehicles in Singapore is 7% of their OMV. The RF is specified as S$140 per bus in 2017. The ARF is 5% of the OMV. The COE is exempted for public buses. The carbon emissions-based vehicle scheme supports low emission vehicles by reimbursing ARF expenses. However, the carbon emissions-based vehicle scheme is currently only applicable to private cars.
2.2. Operating Costs
The operating costs assessed included the road tax, energy costs, maintenance costs, cleaning costs, and personnel costs. The operating costs were calculated for the period between 2030 and 2047. The net present value (NPV) approach given in Equation (1) was used to discount future cash flows, the operating costs. A discount rate of 3% was used in the analysis.
where NPV is the net present value of life cycle costs of minibus/bus, i is the year the cash flow is occurring in, CF is the cash flows (costs) of minibus/bus, n is the life cycle length of minibus/bus, r is the discount rate.
The operational characteristics of the current bus system as well as the microtransit system are given in Table 2. Average distance travelled per bus is 162 km with an average operating speed of 8.76 km/h. Buses cannot be used 10% of the year due to preventive and unscheduled maintenance [61]. The average distance travelled by the minibuses is 213 km with a journey speed of 21.67 km/h (excluding charging time but including dwell time) [62,63]. The journey speed of the microtransit system was based on the Bus Rapid Transit (BRT) driving cycle as the vehicles will be operating on intermittent lanes [64,65]. The details of the operational planning of the new autonomous electric microtransit system are discussed in detail elsewhere [43,63]. Because the down time of EVs due to maintenance is shown to be 50% of those of ICE vehicles [66], it was assumed that the electric minibuses are used 95% of the year. For comparison purposes, the ICEV is assumed to have identical daily operation schedules as the AEV and EV, but require identical maintenance time to conventional buses. Current buses operate with an average occupancy of 17% [61]. The same rate of occupancy was estimated for the microtransit vehicles.
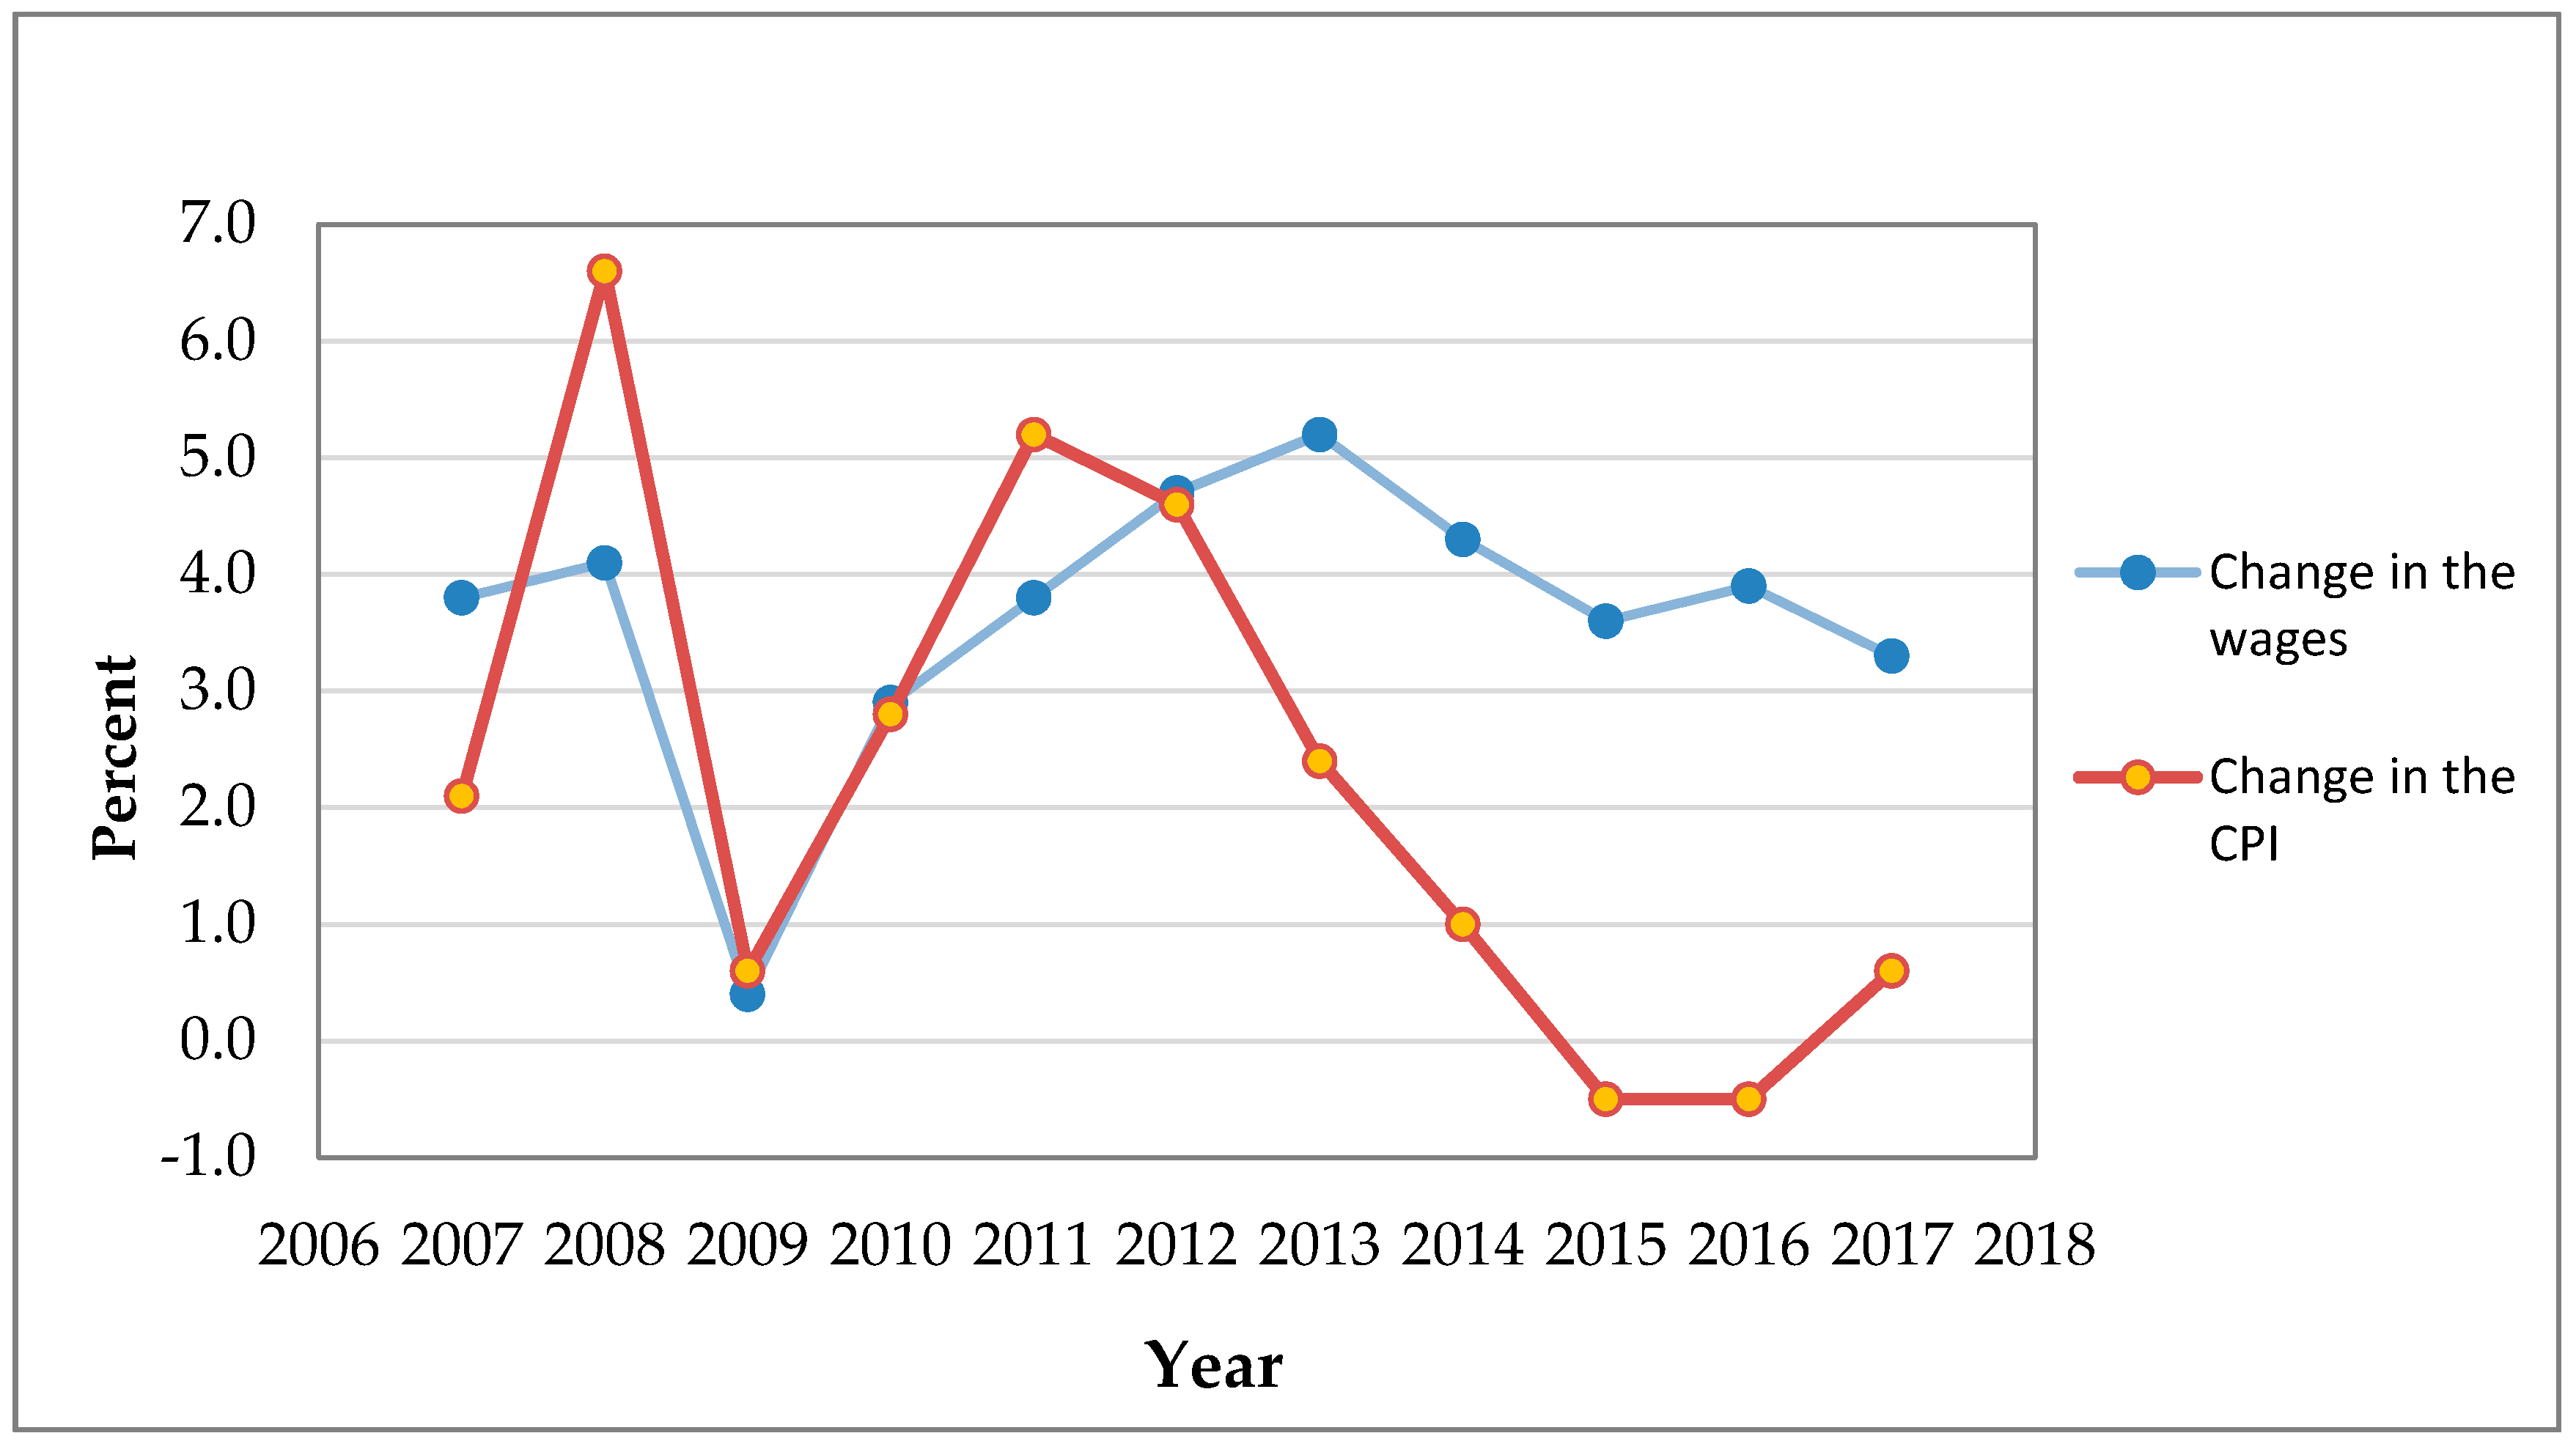
The summary of the variables and assumptions used in estimating the vehicle operating costs and the end-of-life costs are given in Table 3. There are no forecasts for wage growth, raw material/energy/technology prices, and fees/taxes pertaining to the years after 2030. Therefore, this study assumed that the cost fluctuation related to materials, labor, energy, and fees/taxes would be steady and follow the CPI. Figure 2 shows the change in the wages in the transportation sector and the change in CPI from the previous year for the period between 2007 and 2017 [67]. It can be seen that the wages grew slower than or in line with the CPI until 2012, while after 2012 the wage growth was faster than the CPI. In the future, the fluctuation in wages may mainly be affected by the adoption of new automation technologies as well as pace of automation adoption. Automation has the potential to bring a major productivity boost; however, it may also lead to an overall drop in the labor demand as machines replace some workers. Therefore, automation may lead to a shift in the requirements of skills and capabilities in a way where employment and wage growth concentrate in jobs requiring high-skilled labor while leaving low-skilled workers unemployed or at jobs which pay little [68,69]. For occupations with declining labor demand, e.g., drivers, assembly workers, etc. wages are expected to fall or stagnate [56]. On the other hand, adopting AVs may result in lower transportation costs and hence reduce the production or service costs for a company. This may in-turn result in lower price levels for goods and services. Mobility becoming more affordable, companies may expand their services and may require new staff to handle the new volume. The displaced labor may be re-trained for the new jobs created using the savings from the productivity gains from the AVs and absorb the displaced workers. The slower roll out of automation may give the workers enough time to adjust [68,69]. Therefore, it is likely that automation puts downward pressure on wages of the cleaners and drivers, if not displace them.
2.2.1. Road Tax
Road tax is a 6-monthly tax applicable for all transit buses registered in Singapore. The tax amount for each vehicle was estimated based on the engine type and maximum laden vehicle weight [60].
2.2.2. Energy Costs
The annual electricity costs for the EV and AEV were calculated as function of the daily hours of operation, electricity consumption of the vehicle, efficiency of the charging station, and electricity prices. A premium of 10% is added to the EV electricity consumption on top of that of the AEV to account for less efficient driving of humans compared to automated driving [17]. Hence, the hourly electricity consumption for the AEV is 13.4 kWh while it is 14.7 kWh for the EV [62,63]. The 2030 commercial electricity price was estimated applying the forecasted average change in the natural gas price in Europe, Japan, and the US [48] to the 2017 value of the commercial electricity price [70] as mainly natural gas is used to generate electricity in Singapore. The charging station efficiency was estimated as 95% [71].
The fuel costs were calculated as a function of the daily distances travelled, diesel prices, and diesel consumption per vehicle. The fuel consumption of single-deck buses and double-deck buses are 0.51 L/km and 0.65 L/km, respectively [61]. The ICEV fuel consumption was estimated as 0.16 L/km based on the Toyota Coaster, which has a comparable weight and passenger capacity to ICEV shuttle [72]. The bus depot diesel price in 2030 was estimated applying the forecasted change in the crude oil prices [48] to the 2017 diesel price [73]. The average daily operating time of the vehicles was estimated based on Table 1.
2.2.3. Maintenance Costs
Maintenance costs for buses and the ICEV consist mainly of the service costs and overhaul costs for transmission and engine; while for EVs, they are mainly the battery replacement and service costs. LTA specifies a mid-life refurbishment on the 7th to 9th year of the bus registration that encompasses the engine overhaul as well as the refurbishment of the interior fittings [61]. In this study, overhaul costs were calculated based on the U.S. DOT Volpe bus lifecycle cost model [74]. However, the service costs were adjusted to account for differences in labor costs in Singapore [75,76]. The service costs for EVs were estimated as half of those of the ICE vehicles [64]. The autonomous driving components, including the LIDAR, cameras, processing unit, and HMI hardware, as well as the interior fittings and seats were assumed to go under mid-life refurbishment and therefore included in the mid-life maintenance costs.
2.2.4. Insurance Costs
It is illegal to drive any vehicle in Singapore without valid vehicle insurance. The minimum requirement is to cover at least third-party liability for death and bodily injury arising from the use of the vehicle. The insurance costs of 12 m single-deck buses were estimated from the transit operations annual reports [77]. The insurance costs for the 12 m double-deck bus as well as the microtransit vehicles were obtained by scaling the 12 m single-deck insurance costs by the acquisition costs. For the AEV, the insurance costs were estimated as 50% of that of the EV [36].
2.2.5. Cleaning Costs
The average service line time for cleaning is generally around 15 minutes per bus and buses are usually cleaned once a day [78]. The Ministry of Manpower (MOM) of Singapore recommends a minimum monthly salary of S$1,200 for cleaners starting from 2019 [79]. It was assumed that the vehicles are cleaned only the days when they are operating. The service line time of 15 minutes was used for 12 m buses and then scaled by the vehicle floor size for the double-deck buses and microtransit vehicles.
2.2.6. Personnel Costs
According to the LTA, 1.8 bus captains are required on average to operate each bus. A bus captain salary of S$3500 (in 2017) was used in the analysis [61]. Because the AEV is an autonomous vehicle, there are no costs incurred by the bus captains.
2.3. End-of-life (EOL) Costs
Public transportation buses are scrapped at the end of their 17 years lifetime [61]. In the EOL cost calculations, it was assumed that the revenue of selling vehicle scrap material would be equal to the costs of scrapping. Therefore, no EOL value was assigned to ICE vehicles. However, for the EV and AEV, the batteries are replaced when the remaining maximum battery capacity reaches 70–80% of its original value [63]. Therefore, remaining battery value was added as a negative cost to the operational costs for the years when the battery is replaced. It was assumed that the price for the second-life batteries with 70–80% of its original capacity would be 50% of the new battery [80].
3. Results
3.1. Acquisition Costs
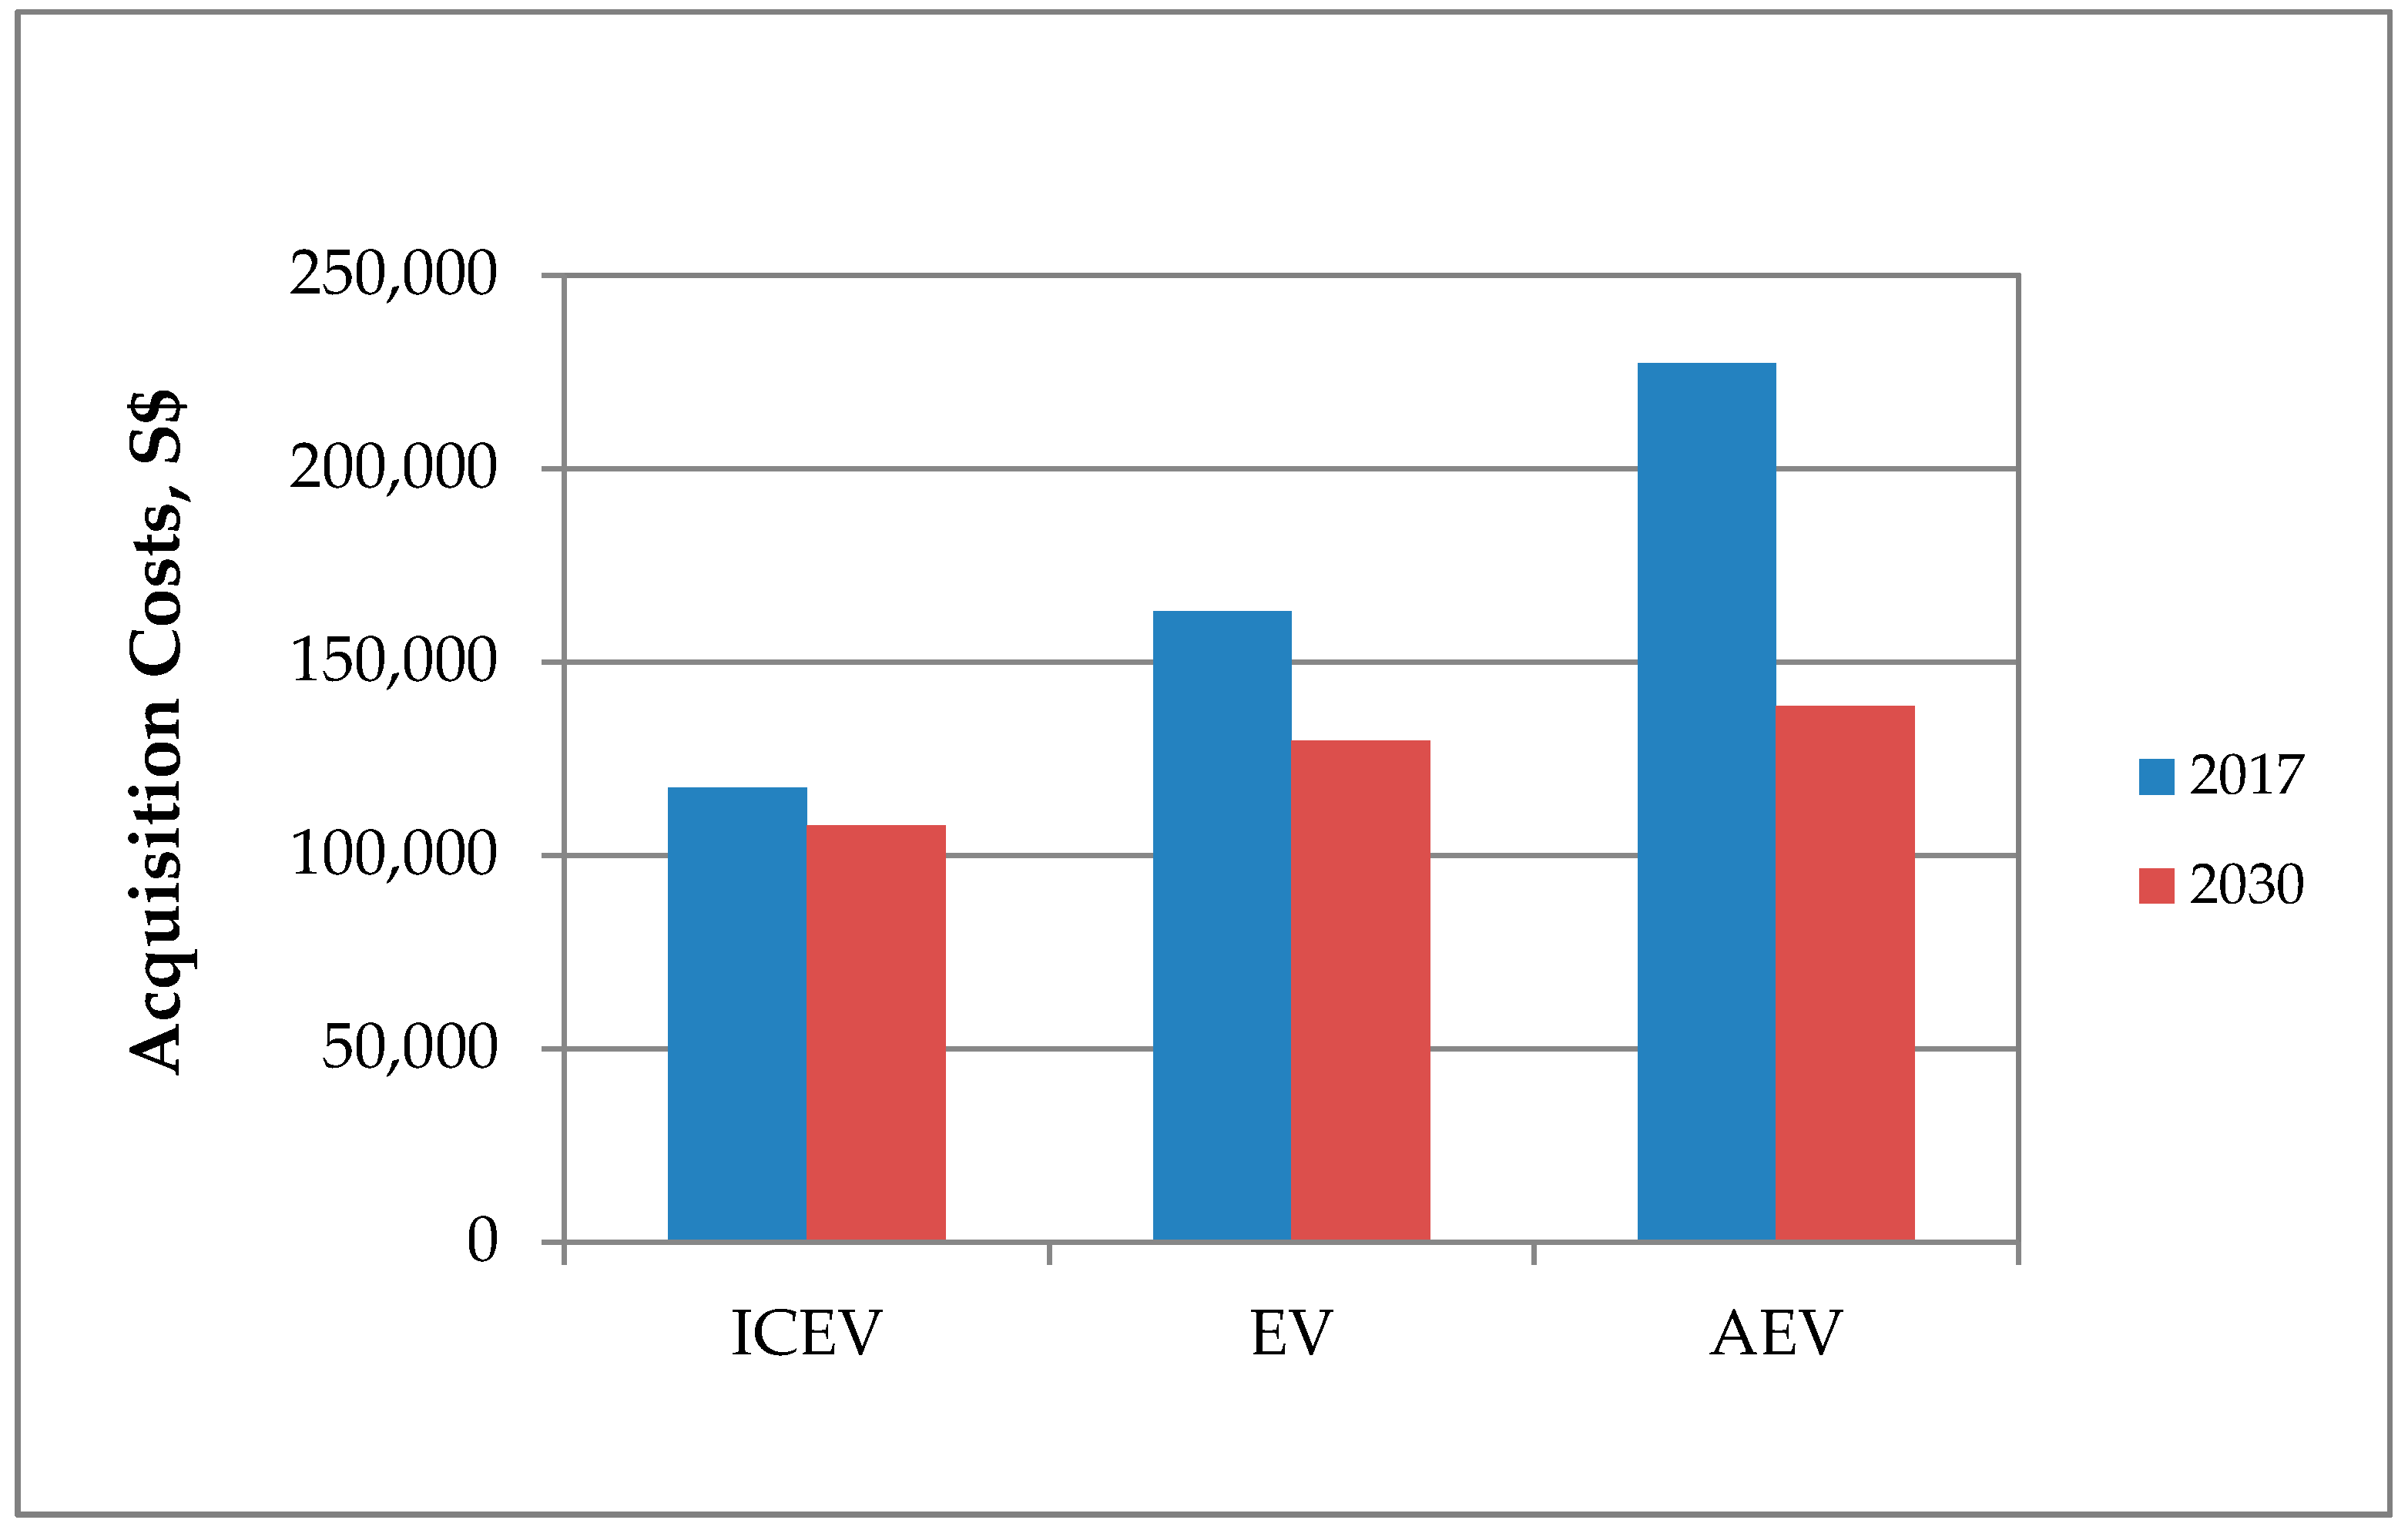
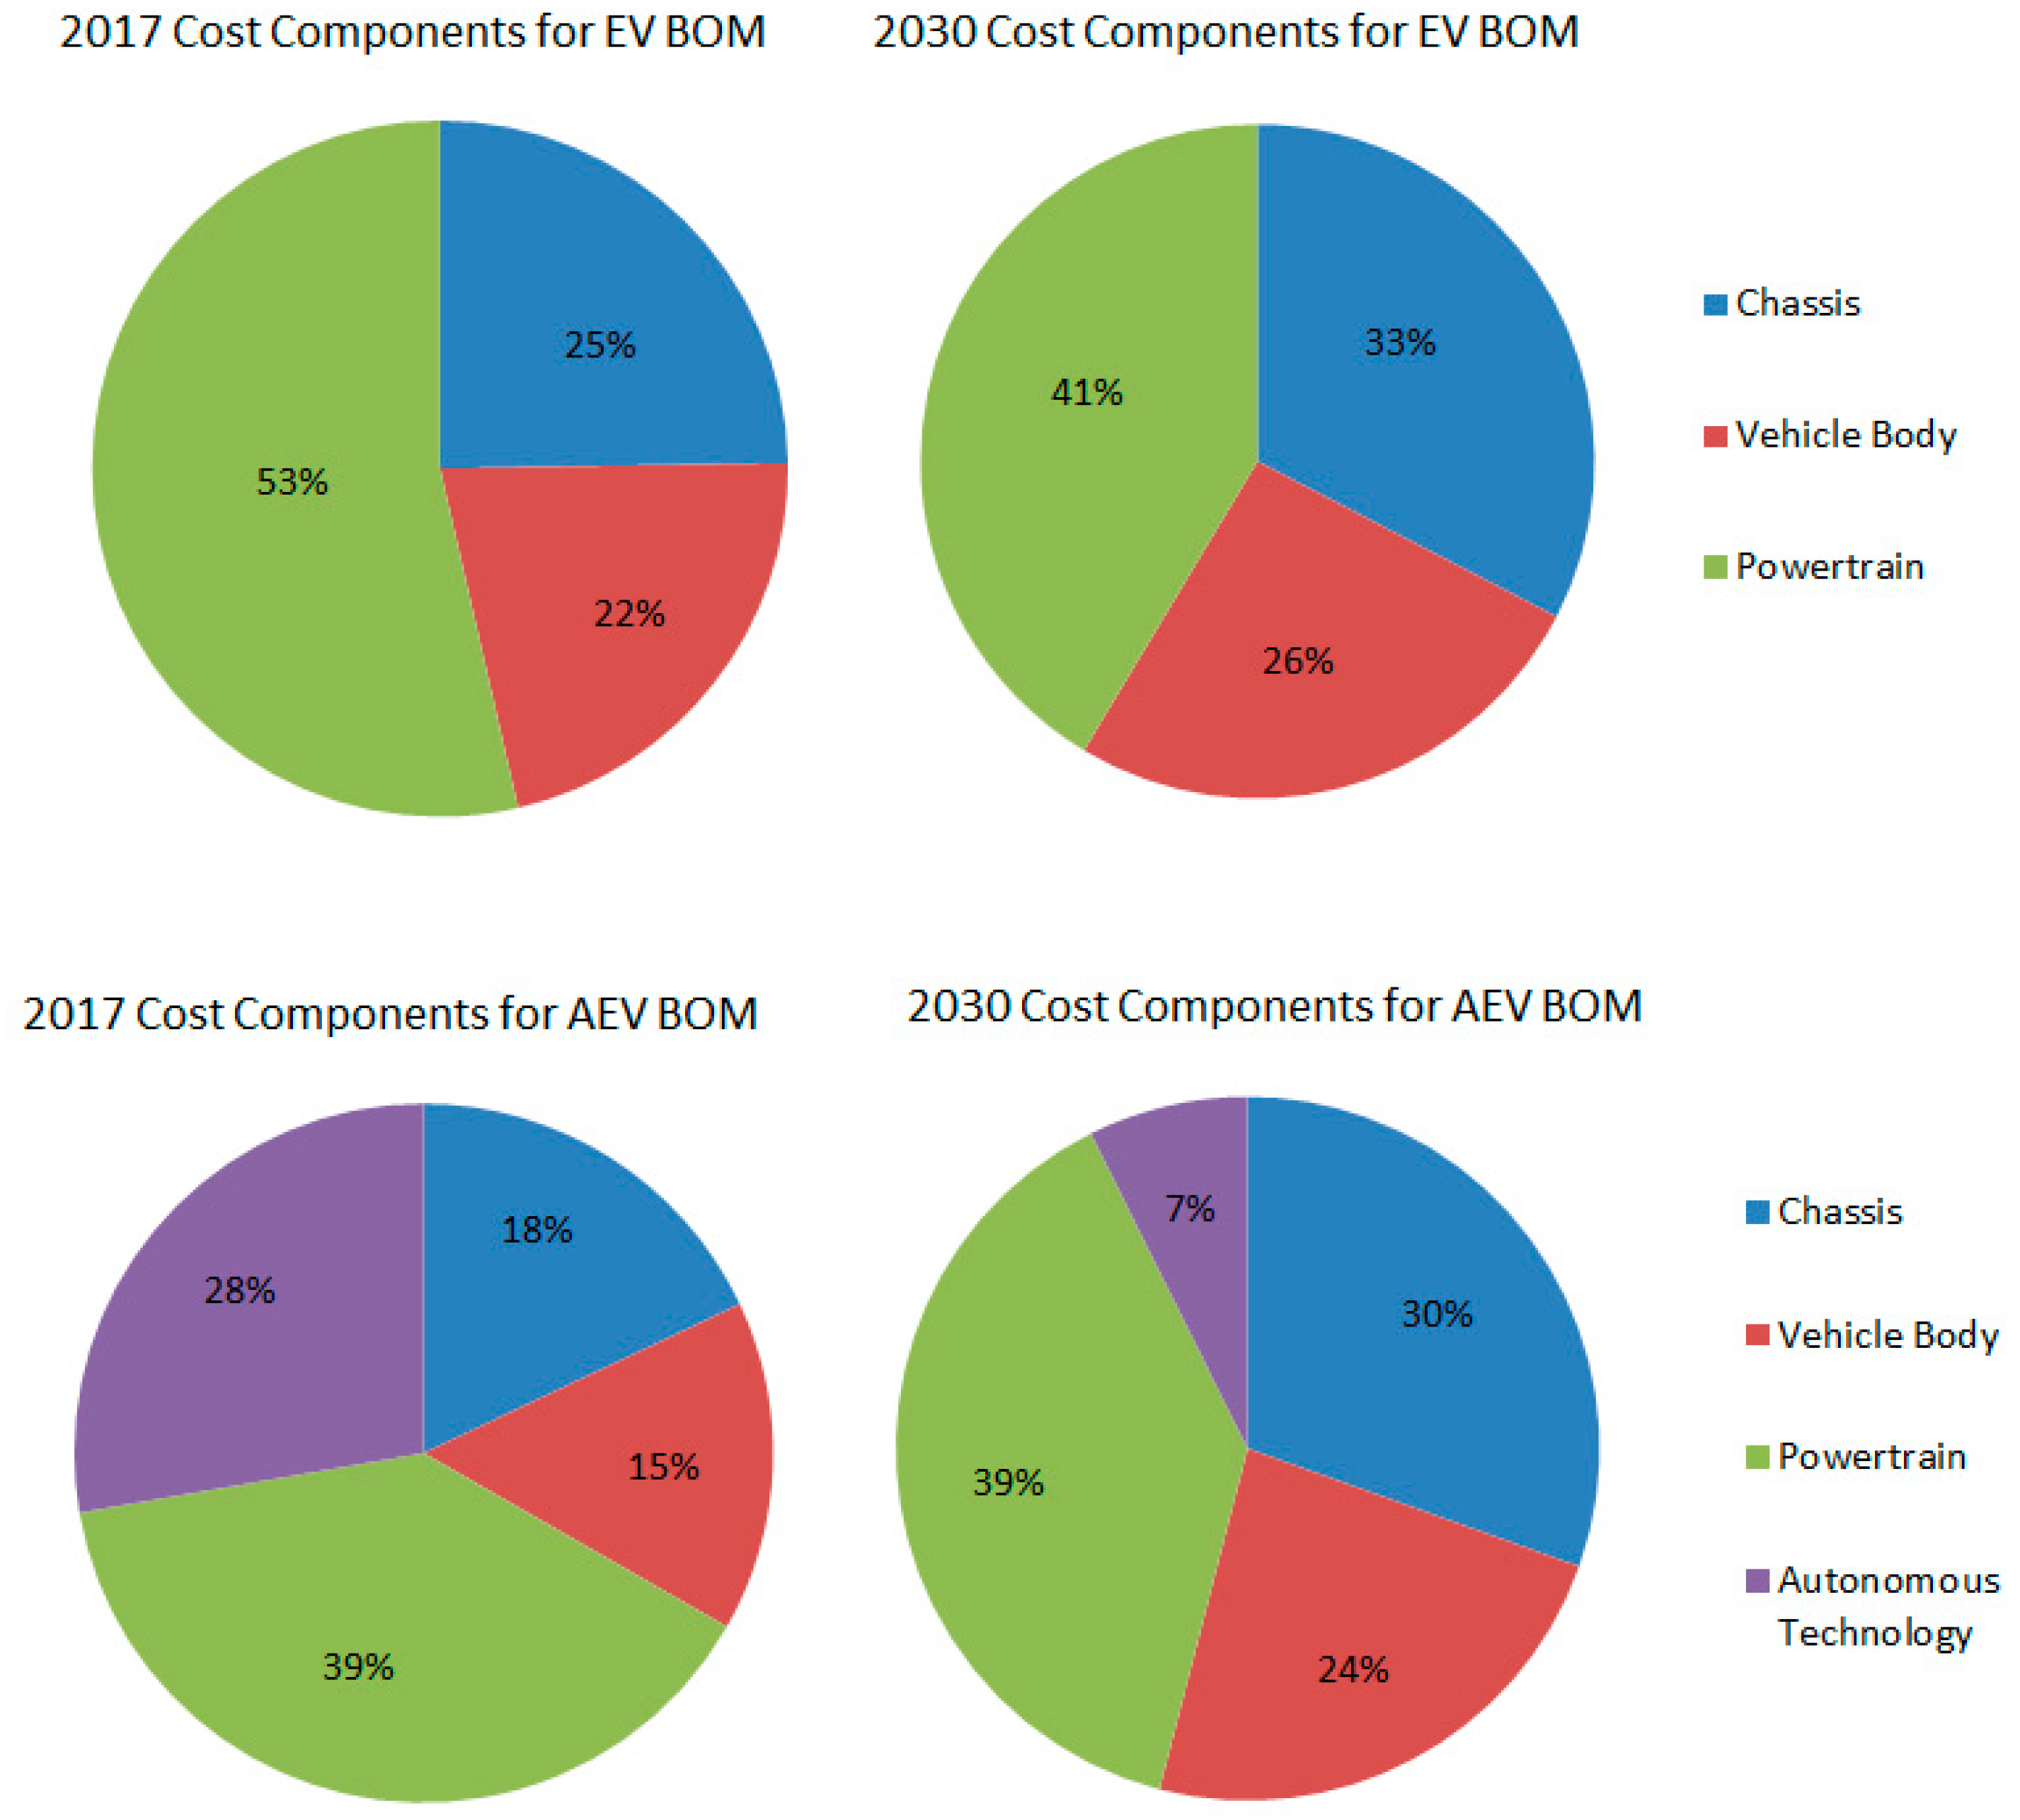
Figure 3 shows the acquisition costs for the years 2017 and 2030 for the ICEV, EV, and AEV. The EV costs are 40% more than the ICEV in 2017 while the AEV costs approximately 93% more than the ICEV. However, there is a reduction in the acquisition costs of the ICEV, EV, and AEV by 8%, 21%, and 39%, respectively, by the year 2030. The reduction in the ICEV can be mainly attributed to the changes in the raw material and workforce costs. The further price drop in the EV can be attributed to the reduction in battery size for the given driving requirements, while for the AEV, it can be attributed to the reductions in autonomous driving technology prices. Figure 4 shows the breakdown of the costs in the BOM for the EV and AEV. The EV cost components consist of the powertrain (battery and motor), chassis, and vehicle body, while the AEV cost components consist of the powertrain (battery and motor), chassis, vehicle body, and autonomous driving technology. The powertrain makes up the 53% of the EV BOM in 2017, while this ratio goes down to 41% in the year 2030. For the AEV, the share of autonomous driving technology in the BOM falls from 28% to 7% by the year 2030. The share of the powertrain cost stays the same within the reduced BOM. Although the vehicle technology costs are substantially reduced by the year 2030, the AEV still costs approximately 22% more than the conventional one.
3.2. TCO Analysis
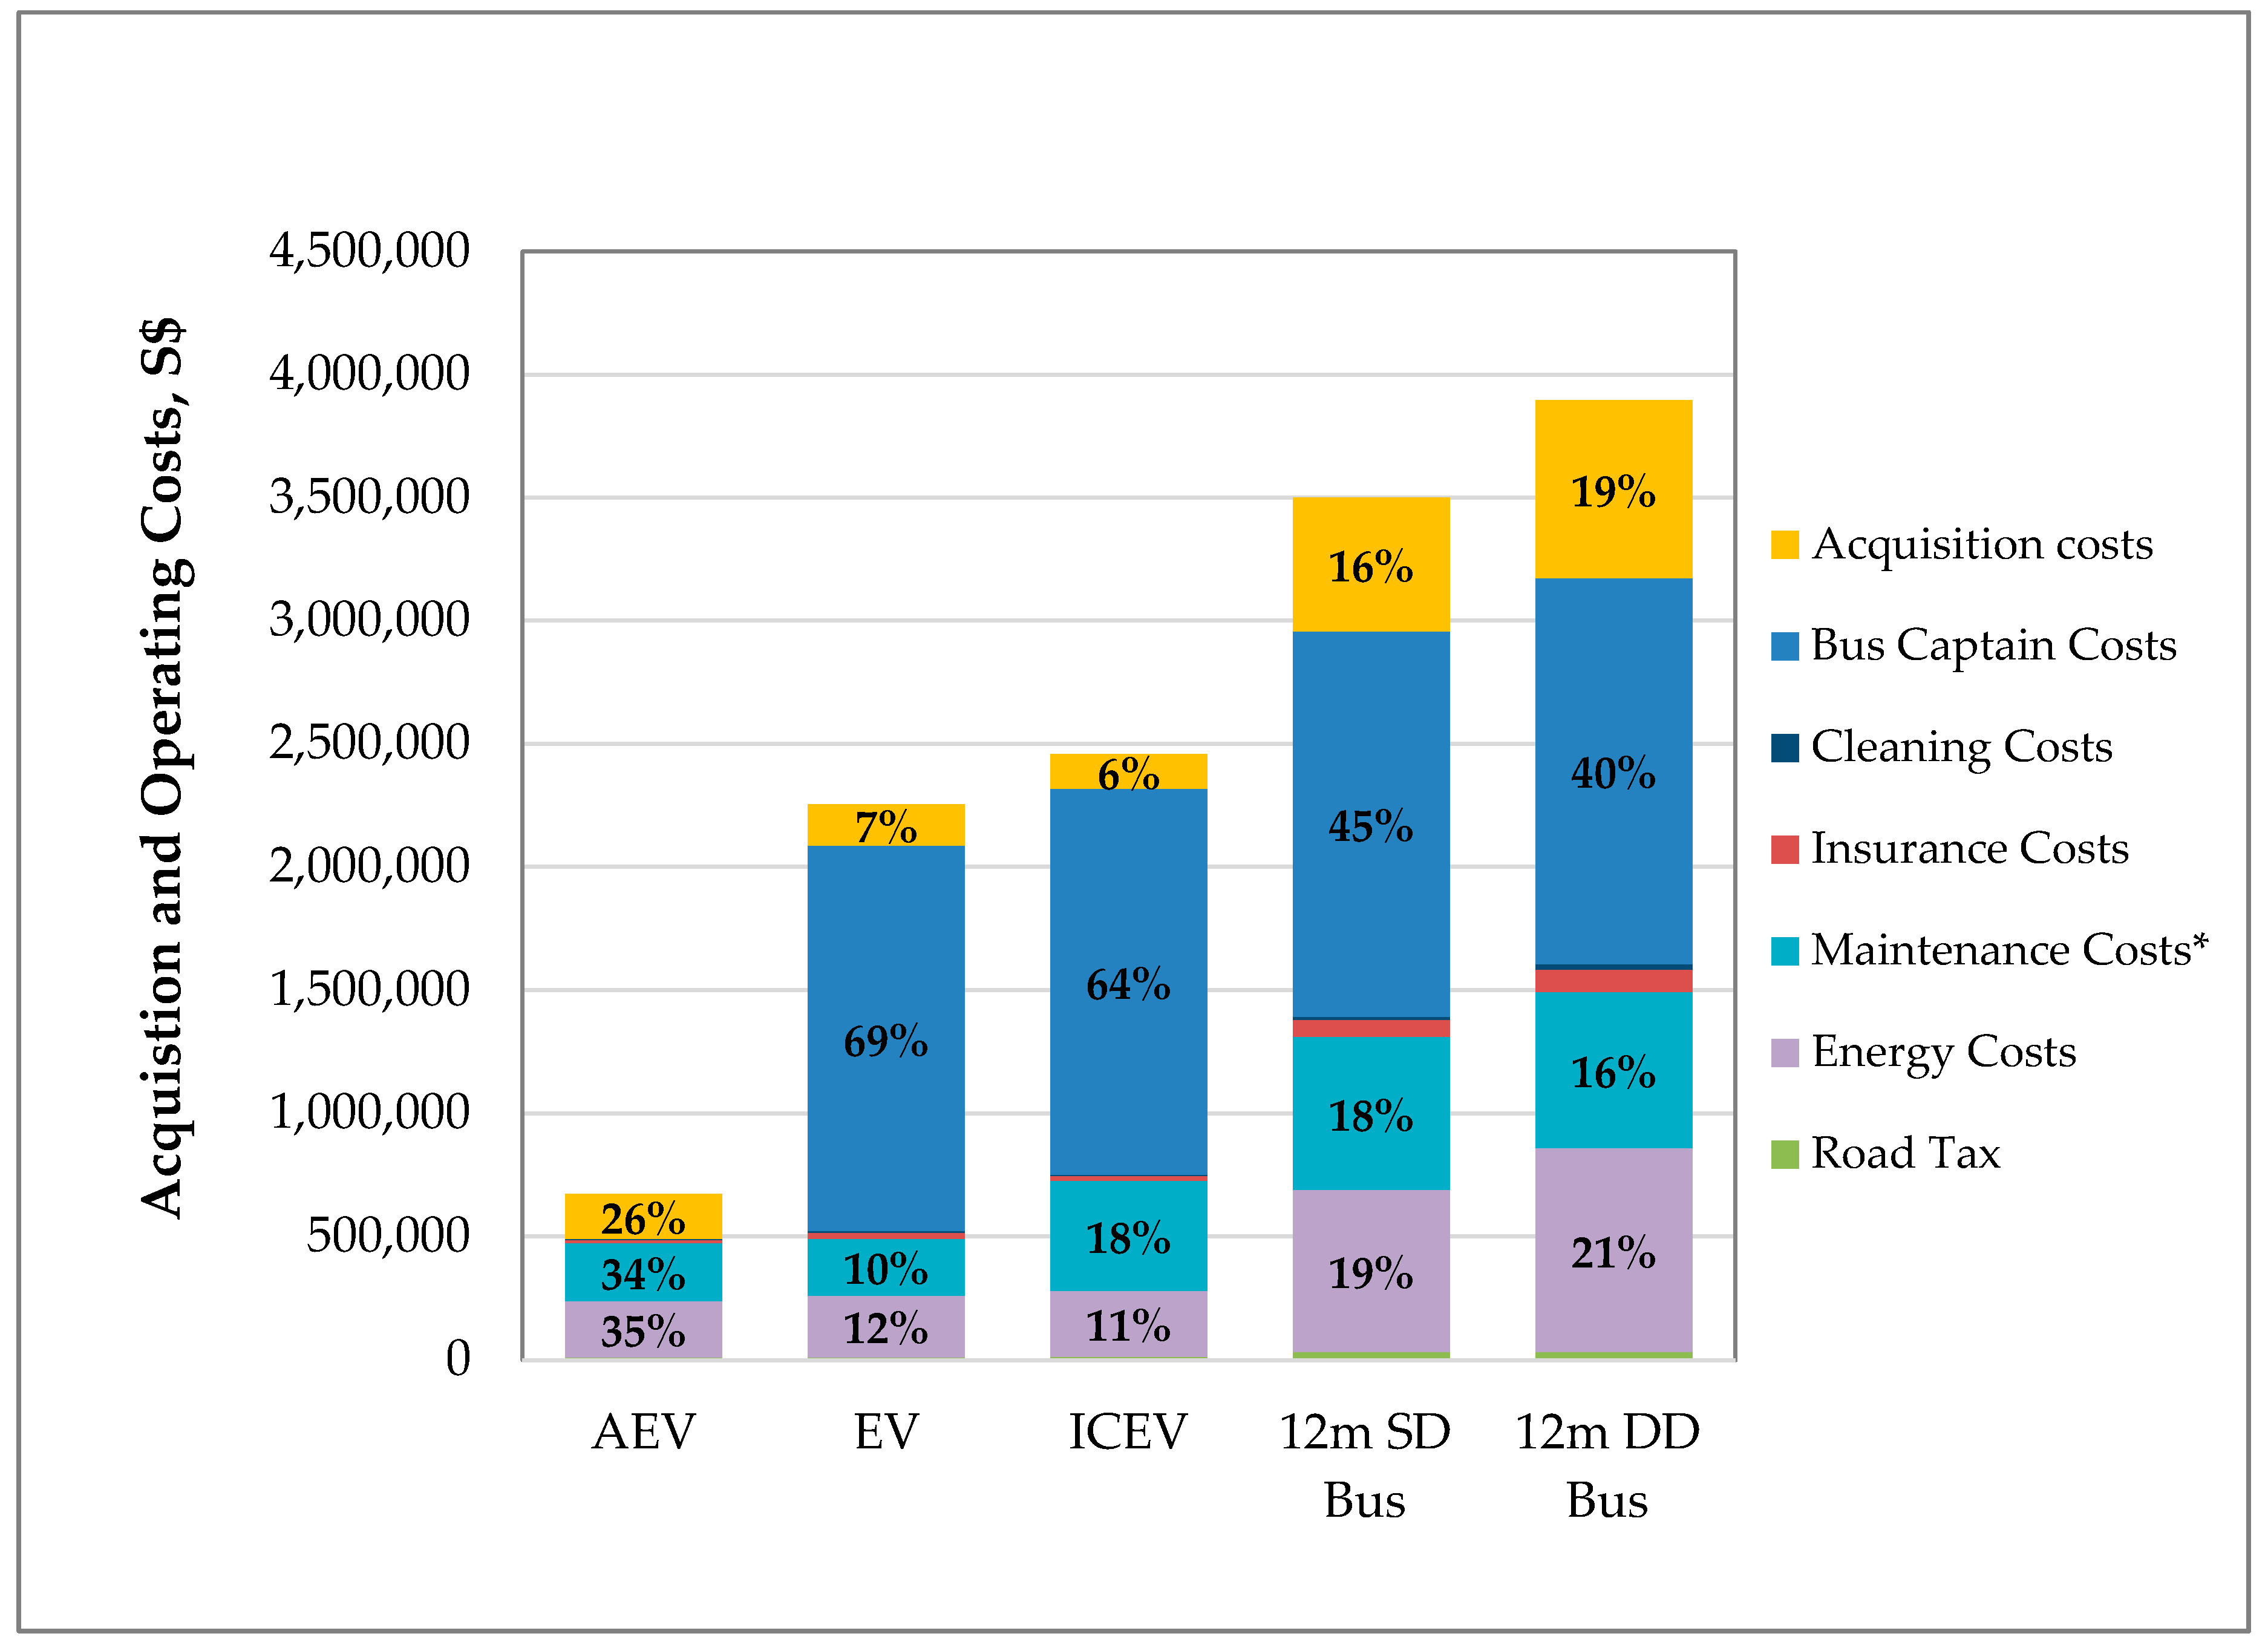
Figure 5 shows the share of the acquisition costs and operating costs, including road tax, energy costs, maintenance costs, insurance costs, cleaning costs, and bus captain costs, in the TCO for the 12 m single-deck (SD) buses, 12 m double-deck (DD) buses, and the ICEV, EV, and AEV discounted to the year 2030. The analysis period of TCO is between 2030 and 2047. All the operating costs shown are discounted to their 2030 values. The EOL cost for the EV and AEV were included as a negative cost in the maintenance costs. The percentages are shown only for the costs with contribution to TCO more than five percent. It can be seen that there is a substantial reduction in the TCO with the implementation of autonomous driving technologies. The TCO is reduced by 72% and 70% as compared to that of the ICEV and EV, respectively. This reduction can be attributed to the elimination of the bus captain. It can also be seen from the figure that operating costs of buses as well ICEV and EV are mainly determined by the bus captain costs. Because microtransit vehicles have lower acquisition costs, the bus captain costs make even higher share of the TCO. The cost determinants of the AEV are somehow evenly distributed between maintenance and energy costs. The acquisition costs also have a substantial effect on the TCO.
The figure also shows that further reductions in the TCO can be obtained by the implementation of the electric powertrain. The maintenance costs of the EV and AEV are approximately 50% of those of the ICEV. The energy costs of the EV and ICEV are approximately the same since ICEV is used less due to higher downtime for maintenance. The energy cost of the AEV is approximately 10% lower than that of the EV due to more balanced driving of AVs.
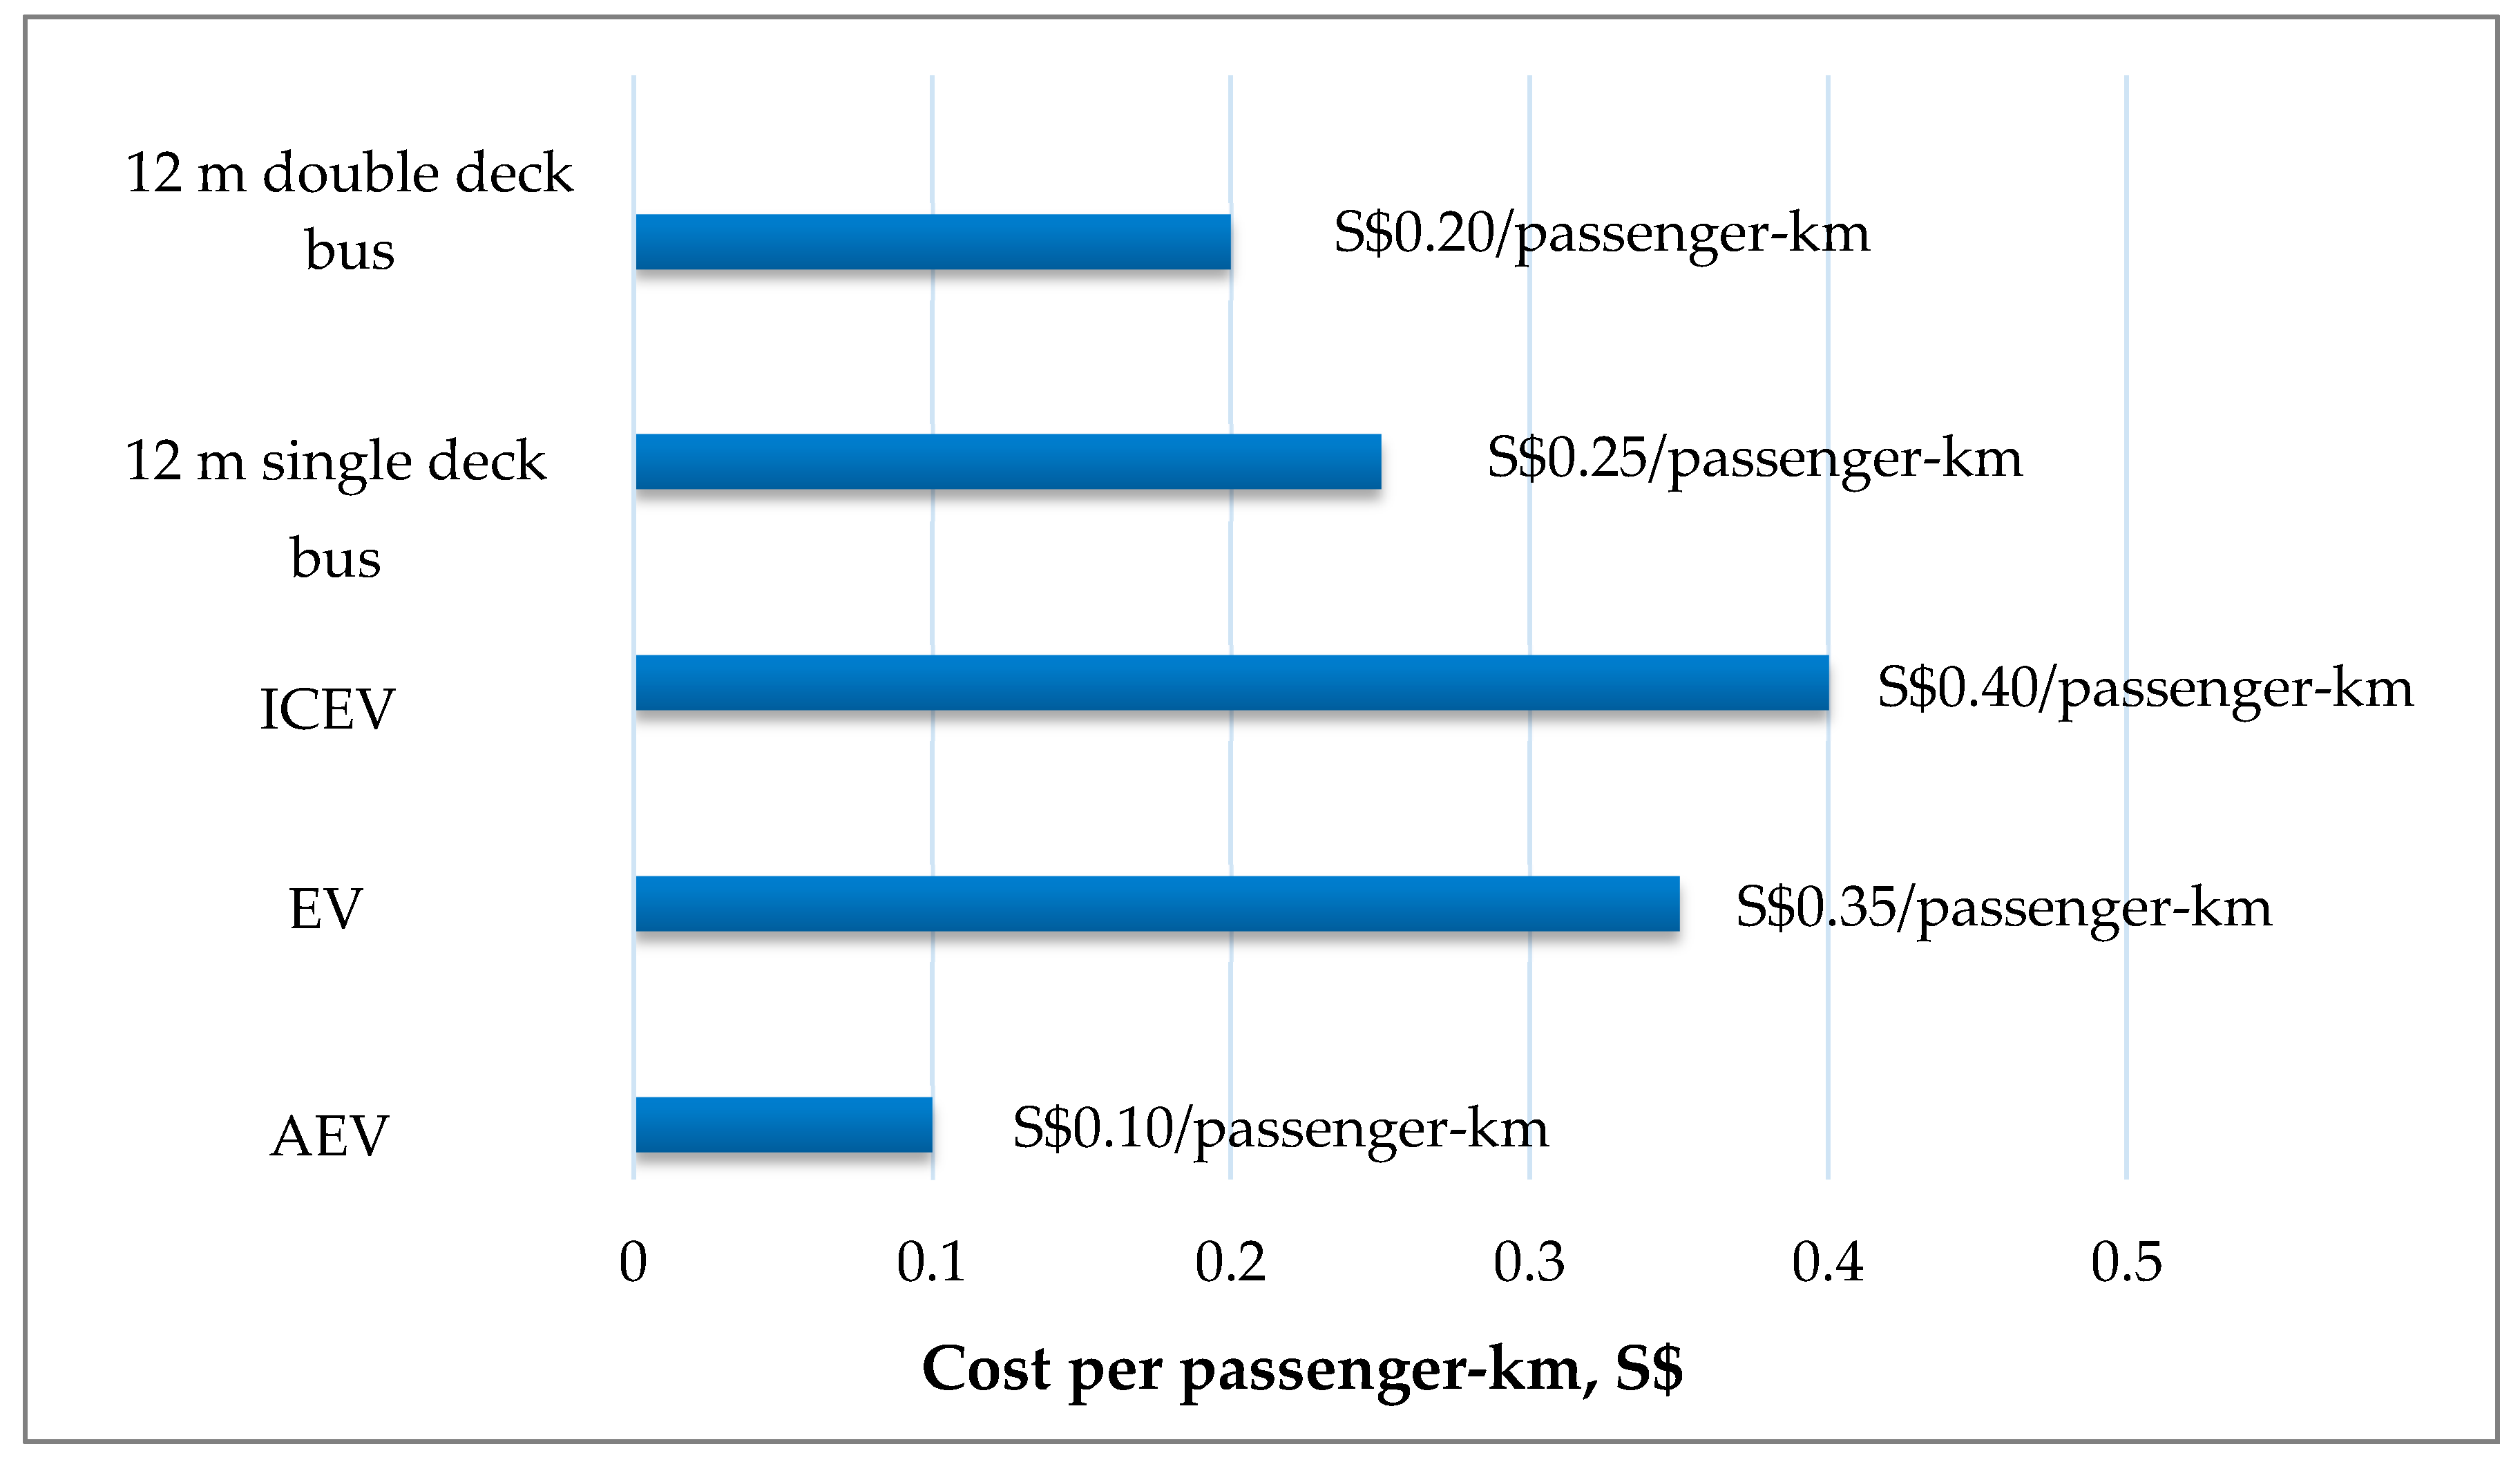
Figure 6 shows the TCO per passenger-km discounted to the year 2030 for the 12 m SD buses, 12 m DD buses, and the ICEV, EV, and AEV. It can be seen that with the introduction of autonomous microtransit vehicles, the cost per passenger-km can be reduced by more than by 50% compared to that of the current bus system. This reduction is even more substantial, up to 75%, when compared to the per passenger-km costs of the EV and ICEV. However, EV and ICEV have no cost benefits when compared to the current buses. The analysis assumed that the occupancy rate and average trip distance per passenger of the microtransit vehicles would be the same as the current buses.
3.3. Sensitivity Analysis
In this paper, the TCO was conducted for the period between 2030 and 2047 and therefore based on a set of assumptions with some degree of uncertainty. To evaluate the robustness of the results to the changes in the cost variables, a sensitivity analysis was conducted. The costs components of acquisition costs, bus captain costs, energy costs, and maintenance costs were included in the sensitivity analysis since they constitute the largest share of the TCO. Additionally, the effect of discount rate on the TCO was assessed. The changes in the four costs components and discount rates were assessed only uni-dimensionally. Table 4 shows the changes in the cost per passenger-km values with the increase of the four cost components by 10%, 20%, and 30%, and the discount rate from 3% to 7%. The sensitivity analysis results show that the TCO per passenger-km is highly dependent on the discount rates. When the discount rate is increased from 3% to 7%, the TCO per passenger-km may go down by 20–26%, 20% for the AEV and 26% for the ICEV. The results also confirm the findings given in Figure 5. The bus captain salaries are the major cost component affecting the TCO per passenger-km. An increase of 30% in the bus captain salaries would increase the TCO per passenger-km by 21% for the EV, 19% for the ICEV, and up to 13% for buses.
The AEV is more elastic to changes in the cost components, whereas it is the least affected by the changes in the discount rates compared to other vehicles. While the most important cost components are the energy costs and maintenance costs for the AEV, acquisition costs also have a substantial effect on costs. Therefore, any price reduction in the vehicle technology, including autonomous driving technology and electric powertrain, may lead to significant reductions in the acquisition and maintenance costs, and hence the TCO per passenger-km. Further reductions in the TCO per passenger-km can be obtained if the discount rate increases in the future.
4. Discussion
The new AVs are envisioned to start operating in 2030, therefore the TCO assessment includes costs incurred beginning from the year 2030 until the EOL of the vehicle, 2047. The TCO estimations are based on a set of assumptions with some degree of uncertainty.
The microtransit vehicles will operate on the same schedule as buses and the current demand will be handled by adjusting the number of vehicles in the platoon. Therefore, it was assumed that the occupancy rate and average trip distance per passenger for the microtransit vehicles will stay the same as it is for the current buses operating in Singapore. However, with the improved accessibility and convenience provided by AVs, the transit ridership or passenger distances travelled may increase and even further reductions in cost per passenger-km can be obtained by AEVs, i.e., doubling of vehicle occupancy rate may result in 50% reduction in the TCO per passenger-km. It was also assumed that the insurance premiums for the new microtransit vehicles would be 50% of that of the vehicles with human drivers due to the expected decline in accidents [36]. However, premiums may not decline immediately after the deployment of AVs, since the AVs should prove to be safer over the human operated vehicles for the insurance premiums to adjust accordingly.
There are no forecasts for wage growth, raw material/energy/technology prices, and fees/taxes for public transportation vehicles pertaining to the years after 2030. Therefore, this study assumed that the cost fluctuation related to these variables would be steady and follow the CPI. However, there have been sharp fluctuations in oil prices and wages compared to CPI in different time periods [67,81]. In the future, as automation technologies spread, the employment opportunities and the wage growth may concentrate in jobs requiring high-skilled labor, leaving mid- to low-skilled workers unemployed or facing pressure on their wages. Although after 2012, the wage growth outpaced the CPI in Singapore, in the future, it is likely that there is a slowdown in the wage growth in a way that wages grow by or even slower than the CPI.
5. Summary and Research Prospects
This study identified the effects of autonomy and electric powertrain on the acquisition costs of the 30-passenger capacity ICEV, EV, and AEV both for the years 2017 and 2030. Furthermore, the cost structure as well as the TCO per passenger-km for microtransit vehicles were determined and compared to that of buses. A sensitivity assessment was also conducted on the impacts of acquisition, maintenance costs, bus captain, and energy costs as well as the discount rates on the TCO per passenger-km. It should be noted that this study evaluated costs directly associated with the vehicle for the public transportation operators. Bus interchanges and bus depots are owned by the government and leased to the operators. Therefore, any required changes in the infrastructure, such as bus depots, charging infrastructure; or the new microtransit vehicles’ effect on traffic congestion have not been taken into account.
The acquisition cost comparison of ICEV, EV, and AEV showed that though the premium paid for the autonomy and electric battery would significantly go down in the year 2030, still an additional premium of S$22,000 and S$31,000 for the EV and AEV, respectively, should be paid in 2030 (constant dollars). Therefore, full autonomy would cost around S$9000 in 2030, close to the estimates of Wadud [33]. The electric powertrain still costing a substantial premium in 2030 may result in later adoption of battery technology compared to autonomy adoption.
Although the acquisition cost of the AEV is higher than its conventional counterparts, the TCO of the AEV is substantially lower than its counterparts or buses. By using AEVs as part of the transit system, the TCO can be reduced by 70% compared to other microtransit vehicles and 80% compared to buses. However, there is no benefit of using ICE or electric microtransit vehicles, as their TCO per passenger-km is significantly higher than that of the single- and double-deck buses. In terms of the cost per-passenger-km, the AEV may lower costs by 50–60% compared to buses. The reduction in costs can be mainly attributed to the elimination of the bus captain driver compensation, which generally constitutes 40–70% of the TCO. Because no captain compensation is included in the costs, the TCO of the AEV is more elastic to changes in the cost components. This means that any improvements in vehicle technology that lead to reduction in the vehicle acquisition costs or maintenance costs would result in even more savings.
This research may help transportation operators in decision making process related to EV, AV, and microtransit deployment. However, adopting autonomous and electric public transportation requires a massive investment which mainly concerns the transportation agencies. Therefore, further research should be conducted with respect to system dynamics assessment of autonomous electric public transportation systems. This would include the impacts of the new system on travel behavior, congestion levels, and emissions as well as costs related to fleet requirements and infrastructure changes, e.g., charging infrastructure, IT infrastructure.
Author Contributions
The authors confirm contribution to the paper as follows: conceptualization and data analysis, E.L.; investigation and validation, F.R., G.S., F.C.; writing—original draft preparation, supervision, and project administration, A.O.; writing—review and editing, M.L.
Funding
This work was financially supported by the Singapore National Research Foundation under its Campus for Research Excellence and Technological Enterprise (CREATE) program.
Conflicts of Interest
The authors declare no conflict of interest.
References
- Arbib, J.; Seba, T. Rethinking Transportation 2020–2030: The Disruption of Transportation and the Collapse of the Internal-Combustion Vehicle and Oil Industries, RethinkX 2017. Available online: http://bit.ly/2pL0cZV (accessed on 12 July 2018).
- Li, T.; Kockelman, K.M. Valuing the Safety Benefits of Connected and Automated Vehicle Technologies. In Proceedings of the 95th Annual Meeting of the Transportation Research Board, Washington, DC, USA, 10–14 January 2016; Available online: https://trid.trb.org/view/1392528 (accessed on 15 July 2018).
- Fagnant, D.J.; Kockelman, K. Preparing a nation for autonomous vehicles: Opportunities, barriers and policy recommendations. Transp. Res. Part A Policy Pract. 2015, 7, 167–181. [Google Scholar] [CrossRef]
- Litman, T. Autonomous vehicle implementation predictions. Implications for Transport Planning. 2018. Available online: www.vtpi.org (accessed on 11 July 2018).
- Urban Mobility System Upgrade. How Shared Self-Driving Cars Could Change City Traffic; International Transport Forum Policy Papers, No. 6; OECD Publishing: Paris, France, 2015; Available online: https://0-doi-org.brum.beds.ac.uk/10.1787/5jlwvzdk29g5-en (accessed on 30 October 2017).
- UITP. Policy Brief. Autonomous Vehicles: A Potential Game Changer for Urban Mobility. 2016. Available online: http://www.uitp.org/sites/default/files/cck-focus-papers-files/PolicyBrief_Autonomous_Vehicles_LQ_20160116.pdf (accessed on 20 June 2018).
- Easymile. 2017. Available online: http://easymile.com (accessed on 19 November 2017).
- Local Motors, Meet Olli. 2017. Available online: https://localmotors.com/meet-olli (accessed on 20 November 2017).
- Navya, Navya Shuttle. 2017. Available online: http://navya.tech/en/ (accessed on 20 November 2017).
- Tuvie, AGV Bus: Autonomous Bus Concept by Vincent Chan. 2017. Available online: http://www.tuvie.com/agv-bus-autonomous-bus-concept-by-vincent-chan (accessed on 20 November 2017).
- New Atlas, EasyMile’s Driverless Bus Rolls-Out in Singapore and California. 2017. Available online: https://newatlas.com/easymile-ez10-driverlessbus/39891/ (accessed on 20 November 2017).
- The Verge, Las Vegas Is Expanding Its Self-Driving Shuttle Experiment. 2017. Available online: https://www.theverge.com/2017/11/6/16614388/las-vegas-self-driving-shuttle-navya-keolis-aaa (accessed on 15 November 2017).
- Gulf News: Transport. Driverless Vehicle on Trial in Downtown Dubai. 2016. Available online: http://gulfnews.com/news/uae/transport/driverless-vehicle-on-trial-in-downtown-dubai-1.1888590 (accessed on 10 July 2018).
- Daimler, A.G. The Mercedes-Benz Future Bus: The Future of Mobility, (n.d.). Available online: https://www.daimler.com/innovation/autonomous-driving/future-bus.html (accessed on 15 November 2017).
- Tagesspiegel. Bahn Will Mit Mini-Bus ‘Olli’ uber Konkurrenz Machen. 2016. Available online: http://www.tagesspiegel.de/wirtschaft/autonomes-fahren-bahn-will-mit-mini-bus-olli-uber-konkurrenzmachen/14991328.html (accessed on 15 November 2017).
- The Washington Post. How to Get a Free Ride in a Self-Driving Shuttle This Summer. 2016. Available online: https://www.washingtonpost.com/news/innovations/wp/2016/06/16/how-to-get-a-free-ride-in-a-selfdriving-shuttle-this-summer/ (accessed on 15 November 2017).
- Stephens, T.; Gonder, J.; Chen, Z.L.; Liu, C.; Gohlke, D. Estimated Bounds and Important Factors for Fuel Use and Consumer Costs of Connected and Automated Vehicles; Technical Report; National Renewable Energy Laboratory, U.S. Department of Energy: Golden, CO, USA, 2016.
- Williams, M. Nvidia Talks Up Its $10,000 Autonomous Driving Computer, the Drive PX. 2017. Available online: https://www.pcworld.com/article/2898452/nvidia-unveils-10000-autonomous-driving-computer.html (accessed on 12 February 2018).
- Higgins, S. Velodyne Cuts VLP-16 Lidar Price to $4k. 2018. Available online: https://www.spar3d.com/news/lidar/velodyne-cuts-vlp-16-lidar-price-4k/ (accessed on 12 February 2018).
- Mosquet, X.; Dauner, T.; Lang, N.; Rüßmann, M.; Mei-Pochtler, A.; Agrawal, R.; Schmieg, F. Revolution in the Driver ’s Seat: The Road to Autonomous Vehicles. 2015. Available online: https://www.bcg.com/publications/2015/automotive-consumer-insight-revolution-drivers-seat-road-autonomous-vehicles.aspx (accessed on 10 February 2018).
- IHS Markit, Apple iPhone X (A1865) Preliminary Cost Summary. 2017. Available online: https://mms.businesswire.com/media/20171108005058/en/622977/5/iPhoneX_cost_summary.jpg (accessed on 10 February 2018).
- Transport Systems Catapult. Market Forecast for Connected and Autonomous Vehicles. 2017. Available online: https://assets.publishing.service.gov.uk/government/uploads/system/uploads/attachment_data/file/642813/15780_TSC_Market_Forecast_for_CAV_Report_FINAL.pdf (accessed on 10 July 2018).
- KPMG. Connected and Autonomous Vehicle—The UK Economic Opportunity. 2015. Available online: https://www.smmt.co.uk/wp-content/uploads/sites/2/CRT036586F-Connected-and-Autonomous-Vehicles-%E2%80%93-The-UK-Economic-Opportu...1.pdf (accessed on 10 July 2018).
- Bansal, P.; Kockelman, K.M. Forecasting Americans’ long-term adoption of connected and autonomous vehicle technologies. Transp. Res. Part A Policy Pract. 2017, 95, 49–63. [Google Scholar] [CrossRef]
- Teoh, L.E.; Khoo, H.L.; Goh, S.Y.; Chong, L.M. Scenario-based electric bus operation: A case study of Putrajaya, Malaysia. Int. J. Transp. Sci. Technol. 2018, 7, 10–25. [Google Scholar] [CrossRef]
- Laizāns, A.; Graurs, I.; Rubenis, A.; Utehin, G. Economic viability of electric public busses: Regional perspective. Procedia Eng. 2016, 134, 316–321. [Google Scholar] [CrossRef]
- Nurhadi, L.; Borén, S.; Ny, H. A sensitivity analysis of total cost of ownership for electric public bus transport systems in Swedish medium sized cities. Transp. Res. Procedia 2014, 3, 818–827. [Google Scholar] [CrossRef]
- Tong, F.; Hendrickson, C.; Biehler, A.; Jaramillo, P.; Seki, S. Life cycle ownership cost and environmental externality of alternative fuel options for transit buses. Transp. Res. Part D Transport Environ. 2017, 57, 287–302. [Google Scholar] [CrossRef]
- Lajunen, A. Energy consumption and cost-benefit analysis of hybrid and electric city buses. Transp. Res. Part C Emerg. Technol. 2014, 38, 1–15. [Google Scholar] [CrossRef]
- Aber, J. Electric Bus Analysis for New York City Transit; Columbia University: New York, NY, USA, 2016; Available online: http://www.columbia.edu/~ja3041/Electric%20Bus%20Analysis%20for%20NYC%20Transit%20by%20J%20Aber%20Columbia%20University%20-%20May%202016.pdf (accessed on 10 May 2017).
- Quarles, N.; Kockelman, K.M. Costs and Benefits of Electrifying and Automating U.S. Bus Fleets. In Proceedings of the 97th Annual Meeting of the Transportation Research Board, Washington, DC, USA, 7–11 January 2018; Available online: https://trid.trb.org/view/1494351 (accessed on 12 July 2018).
- Fries, M.; Kerler, M.; Rohr, S.; Sinning, M.; Schickram, S.; Lienkamp, M. An Overview of Costs for Vehicle Components, Fuels, Greenhouse Gas Emissions and Total Cost of Ownership—Update 2017. 2017. Available online: https://www.researchgate.net/publication/260339436_An_Overview_of_Costs_for_Vehicle_Components_Fuels_and_Greenhouse_Gas_Emissions (accessed on 20 December 2017).
- Wadud, Z. Fully automated vehicles: A cost of ownership analysis to inform early adoption. Transp. Res. Part A Policy Pract. 2017, 101, 163–176. [Google Scholar] [CrossRef] [Green Version]
- BCG Group Will Autonomous Vehicles Derail Trains? BCG Perspectives. 2016. Available online: https://www.bcg.com/publications/2016/transportation-travel-tourism-automotive-will-autonomous-vehicles-derail-trains.aspx (accessed on 10 April 2018).
- Friedrich, M.; Hartl, M. MEGAFON—Modellergebnisse Geteilter Autonomer Fahrzeugflotten des Oeffentlichen Nahverkehrs. Universitaet Stuttgart, Institut für Strassen- und Verkehrswesen, 2016. Available online: https://www.ptvgroup.com/de/mobilitynext/public/media/PDF/MEGAFON_Abschlussbericht.pdf (accessed on 5 April 2018).
- Bosch, P.M.; Becker, F.; Becker, H.; Axhausen, K.W. Cost-based analysis of autonomous mobility services. Transport Policy 2018, 64, 76–91. [Google Scholar] [CrossRef]
- Department of Statistics Singapore. Singapore in Figures 2017. Available online: https://www.singstat.gov.sg/-/media/files/publications/reference/sif2017.pdf (accessed on 10 January 2018).
- World Bank, Population Density. 2017. Available online: https://data.worldbank.org/indicator/EN.POP.DNST?year_high_desc=true (accessed on 20 December 2017).
- Land Transport Authority Singapore. Land Transport Master Plan 2013. 2013. Available online: https://www.lta.gov.sg/content/dam/ltaweb/corp/PublicationsResearch/files/ReportNewsletter/LTMP2013Report.pdf (accessed on 10 January 2018).
- Rau, A.; Tiana, L.; Jaina, M.; Xiea, M.; Zhou, T.L.Y. Dynamic autonomous road transit (DART) for use-case capacity more than bus. Transp. Res. Procedia 2018, in press. [Google Scholar]
- Borroni-Bird, C. Automotive Fuel Cell Requirements. In Proceedings of the 1996 Automotive Technology Development Customers’ Coordination Meeting, Detroit, MI, USA, 30 October 1996; U.S. Department of Energy, Office of Transportation Technologies: Washington, DC, USA, 1996. [Google Scholar]
- Jiang, Y.; Yu, S.; Wang, B.; Li, Y.; Sun, W.; Lu, Y.; Yan, B.; Song, S. Dou. Prussian Blue© composite as an ultrahigh-rate and long-life Sodium-Ion battery cathode. Adv. Funct. Mater. 2016, 26, 5315–5321. [Google Scholar] [CrossRef]
- Teichert, O.; Chang, F.; Ongel, A.; Lienkamp, M. Joint optimization of vehicle battery pack capacity & charging infrastructure for electrified public transport bus systems. IEEE Trans. Transport Electrif. 2018. under review. [Google Scholar]
- Singapore Consumer Price Index (CPI). Available online: https://tradingeconomics.com/singapore/consumer-price-index-cpi (accessed on 15 January 2018).
- Monetary Authority of Singapore (MAS). Monetary Policy and Economics. Available online: http://www.mas.gov.sg/Monetary-Policy-and-Economics/Monetary-Policy/Monetary-Policy-Framework/FAQs/Section-1.aspx (accessed on 20 June 2018).
- Double Deck Bus. Available online: https://www.lta.gov.sg/apps/news/page.aspx?c=2&id=a62a6b2e-cadf-4c06-bf45-b2a40c5a802b. July 2018 (accessed on 10 July 2018).
- Land Transport Authority (LTA). Available online: https://landtransportguru.net/volvo-diesel-hybrid-buses-procured-by-lta/ (accessed on 11 November 2017).
- World Bank Group. Commodity Markets Outlook. October 2017. Available online: http://www.worldbank.org/commodities (accessed on 20 July 2018).
- Samsung. Available online: http://www.samsung.com/de/business/business-products/large-format-display/professional-display/LH43PMHPBGC/EN (accessed on 15 November 2017).
- Velodyne; San Francisco, CA, USA. Personal Communication, 2018.
- Daimler, A.G. Erfolgreichster Stadtbus aller Zeiten. 30.000 Citaro in zwölf Jahren. 2011. Available online: https://www.mercedes-benz.de/content/germany/mpc/mpc_germany_website/de/home_mpc/bus/home/buses_world/awards/2011/30000_citaro.html (accessed on 20 October 2017).
- Daimler, A.G. Jubiläum für den erfolgreichsten Stadtbus aller Zeiten: 50 000 Mercedes-Benz Citaro. 2017. Available online: https://www.mercedes-benz.de/content/germany/mpc/mpc_germany_website/de/home_mpc/bus/home/buses_world/update/news_2017/50000_mercedes-benz_citaro.html (accessed on 15 October 2017).
- Torenli, A. Assembly Line Design and Optimization. Master’s Thesis, Chalmers University of Technology, Göteborg, Sweden, 2009. [Google Scholar]
- PWC. Global Wage Projections to 2030. 2013. Available online: https://www.pwc.co.uk/assets/pdf/global-wage-projections-sept2013.pdf (accessed on 10 April 2018).
- Daimler. Mercedes-Benz Sprinter Minibuses. Available online: http://media.daimler.com/marsMediaSite/en/instance/ko/Mercedes-Benz-Sprinter-minibuses-new-look-new-technology-new-models-emission-standard-Euro-VI.xhtml?oid=9904787 (accessed on 10 January 2018).
- Manyika, J.; Chui, M.; Miremadi, M.; Bughin, J.; George, K.; Willmott, P.; Dewhurst, M. A Future That Works: Automation, Employment, and Productivity; McKinsey Global Institute: San Francisco, CA, USA, 2017. [Google Scholar]
- Ecoinvent Centre. Transport Services. Data v2.0. Ecoinvent Report No.14. Villigen and Uster. 2017. Available online: https://db.ecoinvent.org/reports/14_transport.pdf (accessed on 15 May 2018).
- Electricity Prices, Second Semester of 2015–2017. Available online: http://ec.europa.eu/eurostat/statistics-explained/images/7/7d/Electricity_prices%2C_Second_semester_of_2015-2017_%28EUR_per_kWh%29.png (accessed on 23 April 2018).
- European Commission. EU Energy Trends to 2030. 2010. Available online: https://ec.europa.eu/energy/sites/ener/files/documents/trends_to_2030_update_2009.pdf (accessed on 5 April 2018).
- Land Transport Authority (LTA). Tax Structure for Buses. Available online: https://www.lta.gov.sg/content/ltaweb/en/roads-and-motoring/owning-a-vehicle/costs-of-owning-a-vehicle/tax-structure-for-buses.html (accessed on 15 October 2017).
- Land Transport Authority (LTA); Singapore. Personal Communication, 2017.
- Chang, F.; Khoo, R.; Ongel, A.; Lienkamp, M. Rapid Energy Consumption Assessment of Vehicle Concepts for Public Transport Systems without Detailed Deployment Data. In Proceedings of the International Conference on Innovative Smart Grid Technologies 2018 (ISGT Asia 2018), Singapore, 22–25 May 2018; pp. 1–4. [Google Scholar]
- Teichert, O. Battery and Charging Infrastructure Sizing of Electric Buses. Master’s Thesis, Technical University of Munich, Munich, Germany, 2017. [Google Scholar]
- Lai, J.; Yu, L.; Song, G.; Guo, P.; Chen, X. Development of city-specific driving cycles for transit buses based on VSP distributions: Case of Beijing. J. Transp. Eng. 2013, 139, 749–757. [Google Scholar] [CrossRef]
- Tzirakis, E.; Pitsas, K.; Zannikos, F.; Stournas, S. Vehicle emissions and driving cycles: Comparison of the Athens Driving Cycle (ADC) with ECE-15 and European Driving Cycle (EDC). Glob. NEST J. 2006, 8, 282–290. [Google Scholar]
- Mitropoulos, L.K.; Prevedouros, P.D.; Kopelias, P. Total cost of ownership and externalities of conventional, hybrid, and electric vehicle. Transp. Res. Procedia 2017, 24, 267–274. [Google Scholar] [CrossRef]
- Ministry of Manpower. Singapore Yearbook of Manpower Statistics. Available online: https://stats.mom.gov.sg/Pages/Singapore-Yearbook-Of-Manpower-Statistics-2018-Income-Earnings-and-Wages.aspx (accessed on 12 January 2019).
- Bain & Co. Labor 2030: The Collision of Demographics, Automation and Inequality. 2018. Available online: https://www.bain.com/contentassets/fa89826544934e429f7b6441d6a5c542/bain_report_labor_2030.pdf (accessed on 18 December 2018).
- Vermeulen, B.; Kesselhut, J.; Pyka, A.; Saviotti, P. The Impact of Automation on Employment: Just the Usual Structural Change? Sustainability 2018, 10, 1661. [Google Scholar] [CrossRef]
- SP Group. Electricity Tariff 2014–2018. Available online: https://www.spgroup.com.sg/wcm/connect/spgrp/e0b9800a-c39b-4f41-8664-2bbe8e2ca826/%5BInfo%5D+Historical+Electricity+Tariff.xlsx?MOD=AJPERES (accessed on 10 April 2018).
- Chen, L. Design of duty-varied voltage pulse charger for improving Li-Ion battery-charging response. IEEE Trans. Ind. Electron. 2009, 56, 480–487. [Google Scholar] [CrossRef]
- SBT Global Car Exporter. Toyota Coaster Bus Review—Price, Specs and Fuel Consumption in MPG. 2018. Available online: https://www.sbtjapan.com//kp-toyota-coaster-bus-review (accessed on 10 January 2018).
- Kochhan, R.P. Techno-Economic Evaluation of Battery-Electric Taxis. Ph.D. Thesis, Institute of Sustainable Corporate Management, Ulm University, Ulm, Germany, 2017. [Google Scholar]
- USDOT Volpe Center. Bus Lifecycle Cost Model. Available online: https://www.volpe.dot.gov/sites/volpe.dot.gov/files/.../bus_lifecycle_cost_model.xlsm (accessed on 14 April 2018).
- Average Maintenance Technician Salary- Singapore. Available online: https://www.payscale.com/research/SG/Job=Maintenance_Technician/Salary (accessed on 1 July 2018).
- Average Maintenance Technician Salary- United States. Available online: https://www.payscale.com/research/US/Job=Maintenance_Technician/Hourly_Rate (accessed on 1 July 2018).
- SBS Transit. Annual Report 2016. Singapore. Available online: https://www.sbstransit.com.sg/generalinfo/financial.aspx?year=2016 (accessed on 10 October 2017).
- Schiavone, J. Transit Bus Service Line and Cleaning Functions—A Synthesis of Transit Practice; Transportation Research Board National Research Council, Transit Cooperative Research Program: Washington, DC, USA, 1995; Available online: http://onlinepubs.trb.org/onlinepubs/tcrp/tsyn12.pdf (accessed on 12 October 2017).
- Ministry of Manpower. Progressive Wage Model for the Cleaning Sector. 2017. Available online: http://www.mom.gov.sg/employment-practices/progressive-wage-model/cleaning-sector (accessed on 24 February 2018).
- Schaufenster Elektromobilitat. Studie: Second-Life-Konzepte für Lithium-Ionen-Batterien aus Elektrofahrzeugen—Analyse von Nachnutzungsanwendungen, ökonomischen und ökologischen Potenzialen—Ergebnispapier der Begleit- und Wirkungsforschung. VDE Verband der Elektrotechnik Elektronik Informationstechnik e. V.—Begleit- und Wirkungsforschung Schaufenster Elektromobilität, 2016. Available online: https://www.ffe.de/download/article/620/StudieSecondLifeKonzepte.pdf (accessed on 10 May 2018).
- Monetary Authority of Singapore. Economics Explorer Series Inflation. 2018. Available online: http://www.mas.gov.sg/~/media/MAS/Monetary%20Policy%20and%20Economics/Education%20and%20Research/Education/Explorer/Economics%20Explorer%202%20Inflation.pdf (accessed on 18 December 2018).
Figure 1.
Acquisition cost calculation scheme for ICE, EV, and AEV minibuses.

Figure 2.
Change in the wages and CPI for 2007–2017.

Figure 3.
Acquisition costs for the microtransit vehicles (in constant dollars based on 2017).

Figure 4.
Cost breakdown of the BOM for the EV and AEV.

Figure 5.
Comparison of the TCO structure for buses and microtransit vehicles. *EOL value is included as a negative maintenance cost for EV and AEV vehicle concepts.
Figure 5.
Comparison of the TCO structure for buses and microtransit vehicles. *EOL value is included as a negative maintenance cost for EV and AEV vehicle concepts.

Figure 6.
Comparison of the cost per passenger-km for buses and microtransit vehicles.


Table 1.
Derivation of the 2030 Vehicle Acquisition Costs.
| Cost Variables | Description |
|---|---|
| Bill of Materials | |
| Vehicle body and chassis components | 2030 prices of the raw materials including metals, plastics, lubricants, and chemicals were estimated based on the World Bank Commodities Price Forecast [48]. |
| Powertrain | 2030 battery pack prices were estimated based on the study by Fries et al. [32]. For rest of the powertrain/drivetrain components, 2017 prices were raised using CPI. |
| Autonomous driving technology | A learning curve with a learning rate of 90% was used to estimate the relationship between cumulative uptake and manufacturing cost reduction rates by 2030 [22]. |
| HMI system | A learning curve with a learning rate of 90% was used for estimating the relationship between cumulative uptake and manufacturing cost reduction rates by the year 2030 [22]. |
| Assembly Labor | It was assumed that vehicles are produced in low volume in continuous assembly lines with little automation in eastern Europe. 2017 wages [53] increased based on the change in the labor wages in eastern Europe [54]. A compound growth rate of 0.3% in productivity was used to calculate the assembly labor hours in 2030 [56]. |
| Energy Costs (assembly) | Energy costs were calculated as a function of electricity consumption [57] and 2030 electricity price forecasts in Europe [59]. |
| Taxes and fees [60] | |
| Excise Duty | Exempt. |
| Good and Services Tax | Calculated as 7% of the 2030 OMV of each vehicle. |
| Registration Fee | 2017 value of S$ 140 was raised using CPI. |
| Additional Registration Fee | Calculated as 5% of the 2030 OMV of each vehicle. |
| Certificate of Entitlement | Exempt. |
| Carbon Emissions-based Vehicle Scheme | Exempt. |
Table 2.
Operational characteristics of buses and minibuses.
| Parameters | 12 m Buses | ICEV | EV | AEV |
|---|---|---|---|---|
| Average days of operation per year | 329 | 329 | 347 | 347 |
| Average distance travelled /day, km | 162 | 213 | 213 | 213 |
| Journey speed, km/h | 8.76 | 21.67 | 21.67 | 21.67 |
| Annual use, days | 329 | 329 | 347 | 347 |
| Occupancy, passengers | 15 for single-deck bus 22 for double-deck bus | 5 | 5 | 5 |
Table 3.
Derivation of the Vehicle Operating and EOL Costs.
| Cost Variables | Operating and End-of-Life Cost Estimations |
|---|---|
| Operating Costs | |
| Road tax | The 2017 road taxes for microtransit vehicles and buses were estimated as S$524 for the AEV and EV which fall under the category “Green, 3.5–7 tons”, S$658 for the ICE which falls under the category “Diesel, 3.5–7 tons”, and S$1530 for buses which fall under the category “Diesel, 20–26 tons” [60]. 2017 road taxes specified for buses increased by the CPI to estimate the taxes for the years 2030 and beyond. |
| Energy costs | The 2030 commercial electricity price was estimated applying the forecasted average change in the natural gas price in Europe, Japan, and the US [48] to the 2017 value of the commercial electricity price [68] in Singapore. The bus depot diesel price in 2030 was estimated applying the forecasted change in the crude oil prices [48] to the 2017 diesel price [73]. It was assumed that AVs would consume 10% less energy due to smoother driving compared to human driven vehicles [17]. The 2030 energy prices increased by the CPI to estimate the prices beyond the year 2030. |
| Maintenance costs | The autonomous driving components, including the LIDAR, cameras, processing unit, and HMI hardware, as well as the interior fittings and seats were assumed to go under mid-life refurbishment. The service costs for EVs were estimated as half of those of the ICE vehicles [64]. The estimated 2030 autonomous driving and furniture hardware costs increased by the CPI to estimate the costs beyond the year 2030. |
| Insurance costs | It was assumed the insurance costs would be correlated with the acquisition costs and AVs’ insurance costs would be half of those with human drivers due to the expected increased safety with autonomous driving [36]. 2017 insurance costs increased by the CPI to estimate the future costs. |
| Cleaning costs | It was assumed that the vehicles are cleaned only the days when they are operating, and the cleaning time required is proportional to the vehicle floor size. Singapore applies Progressive Wage Model for the low-wage earners including the cleaning sector [79]. However, there is no monthly minimum salary defined by MOM of Singapore after the year of 2019. Therefore, the wages for the years beyond 2019 were adjusted using the CPI. |
| Personnel costs | 2017 bus captain salaries increased by the CPI for the years 2030 and beyond. |
| End-of-life costs | It was assumed that the revenue of selling vehicle scrap material from vehicle components would be equal to the costs of scrapping. However, for the EVs, remaining battery value was added as a negative cost to the operational costs for the years when the battery is replaced. It was assumed that the price for the second-life batteries with 70–80% of its original capacity would be 50% of the new battery [80]. The estimated 2030 battery costs increased by the CPI for the years beyond 2030. |
Table 4.
Sensitivity analysis for cost per passenger-km.
| Vehicle Type | Acquisition Cost | Bus Captain Costs | Energy Costs | Maintenance Costs | Discount Rate | ||||||||
|---|---|---|---|---|---|---|---|---|---|---|---|---|---|
| 10% | 20% | 30% | 10% | 20% | 30% | 10% | 20% | 30% | 10% | 20% | 30% | From 3% to 7% | |
| AEV | 3% | 5% | 8% | - | - | - | 4% | 7% | 11% | 3% | 7% | 10% | 20% |
| EV | 1% | 1% | 2% | 7% | 14% | 21% | 1% | 2% | 4% | 1% | 2% | 3% | 25% |
| ICEV | 1% | 1% | 2% | 6% | 13% | 19% | 1% | 2% | 3% | 2% | 4% | 5% | 26% |
| 12 m SD | 2% | 3% | 5% | 4% | 9% | 13% | 2% | 4% | 6% | 1% | 3% | 4% | 23% |
| 12 m DD | 2% | 4% | 6% | 4% | 8% | 12% | 2% | 4% | 6% | 2% | 3% | 5% | 22% |
© 2019 by the authors. Licensee MDPI, Basel, Switzerland. This article is an open access article distributed under the terms and conditions of the Creative Commons Attribution (CC BY) license (http://creativecommons.org/licenses/by/4.0/).
Share and Cite
MDPI and ACS Style
Ongel, A.; Loewer, E.; Roemer, F.; Sethuraman, G.; Chang, F.; Lienkamp, M. Economic Assessment of Autonomous Electric Microtransit Vehicles. Sustainability 2019, 11, 648. https://0-doi-org.brum.beds.ac.uk/10.3390/su11030648
AMA Style
Ongel A, Loewer E, Roemer F, Sethuraman G, Chang F, Lienkamp M. Economic Assessment of Autonomous Electric Microtransit Vehicles. Sustainability. 2019; 11(3):648. https://0-doi-org.brum.beds.ac.uk/10.3390/su11030648
Chicago/Turabian StyleOngel, Aybike, Erik Loewer, Felix Roemer, Ganesh Sethuraman, Fengqi Chang, and Markus Lienkamp. 2019. "Economic Assessment of Autonomous Electric Microtransit Vehicles" Sustainability 11, no. 3: 648. https://0-doi-org.brum.beds.ac.uk/10.3390/su11030648
Note that from the first issue of 2016, this journal uses article numbers instead of page numbers. See further details here.