Land-Use/Land-Cover Change from Socio-Economic Drivers and Their Impact on Biodiversity in Nan Province, Thailand


Abstract
:1. Introduction
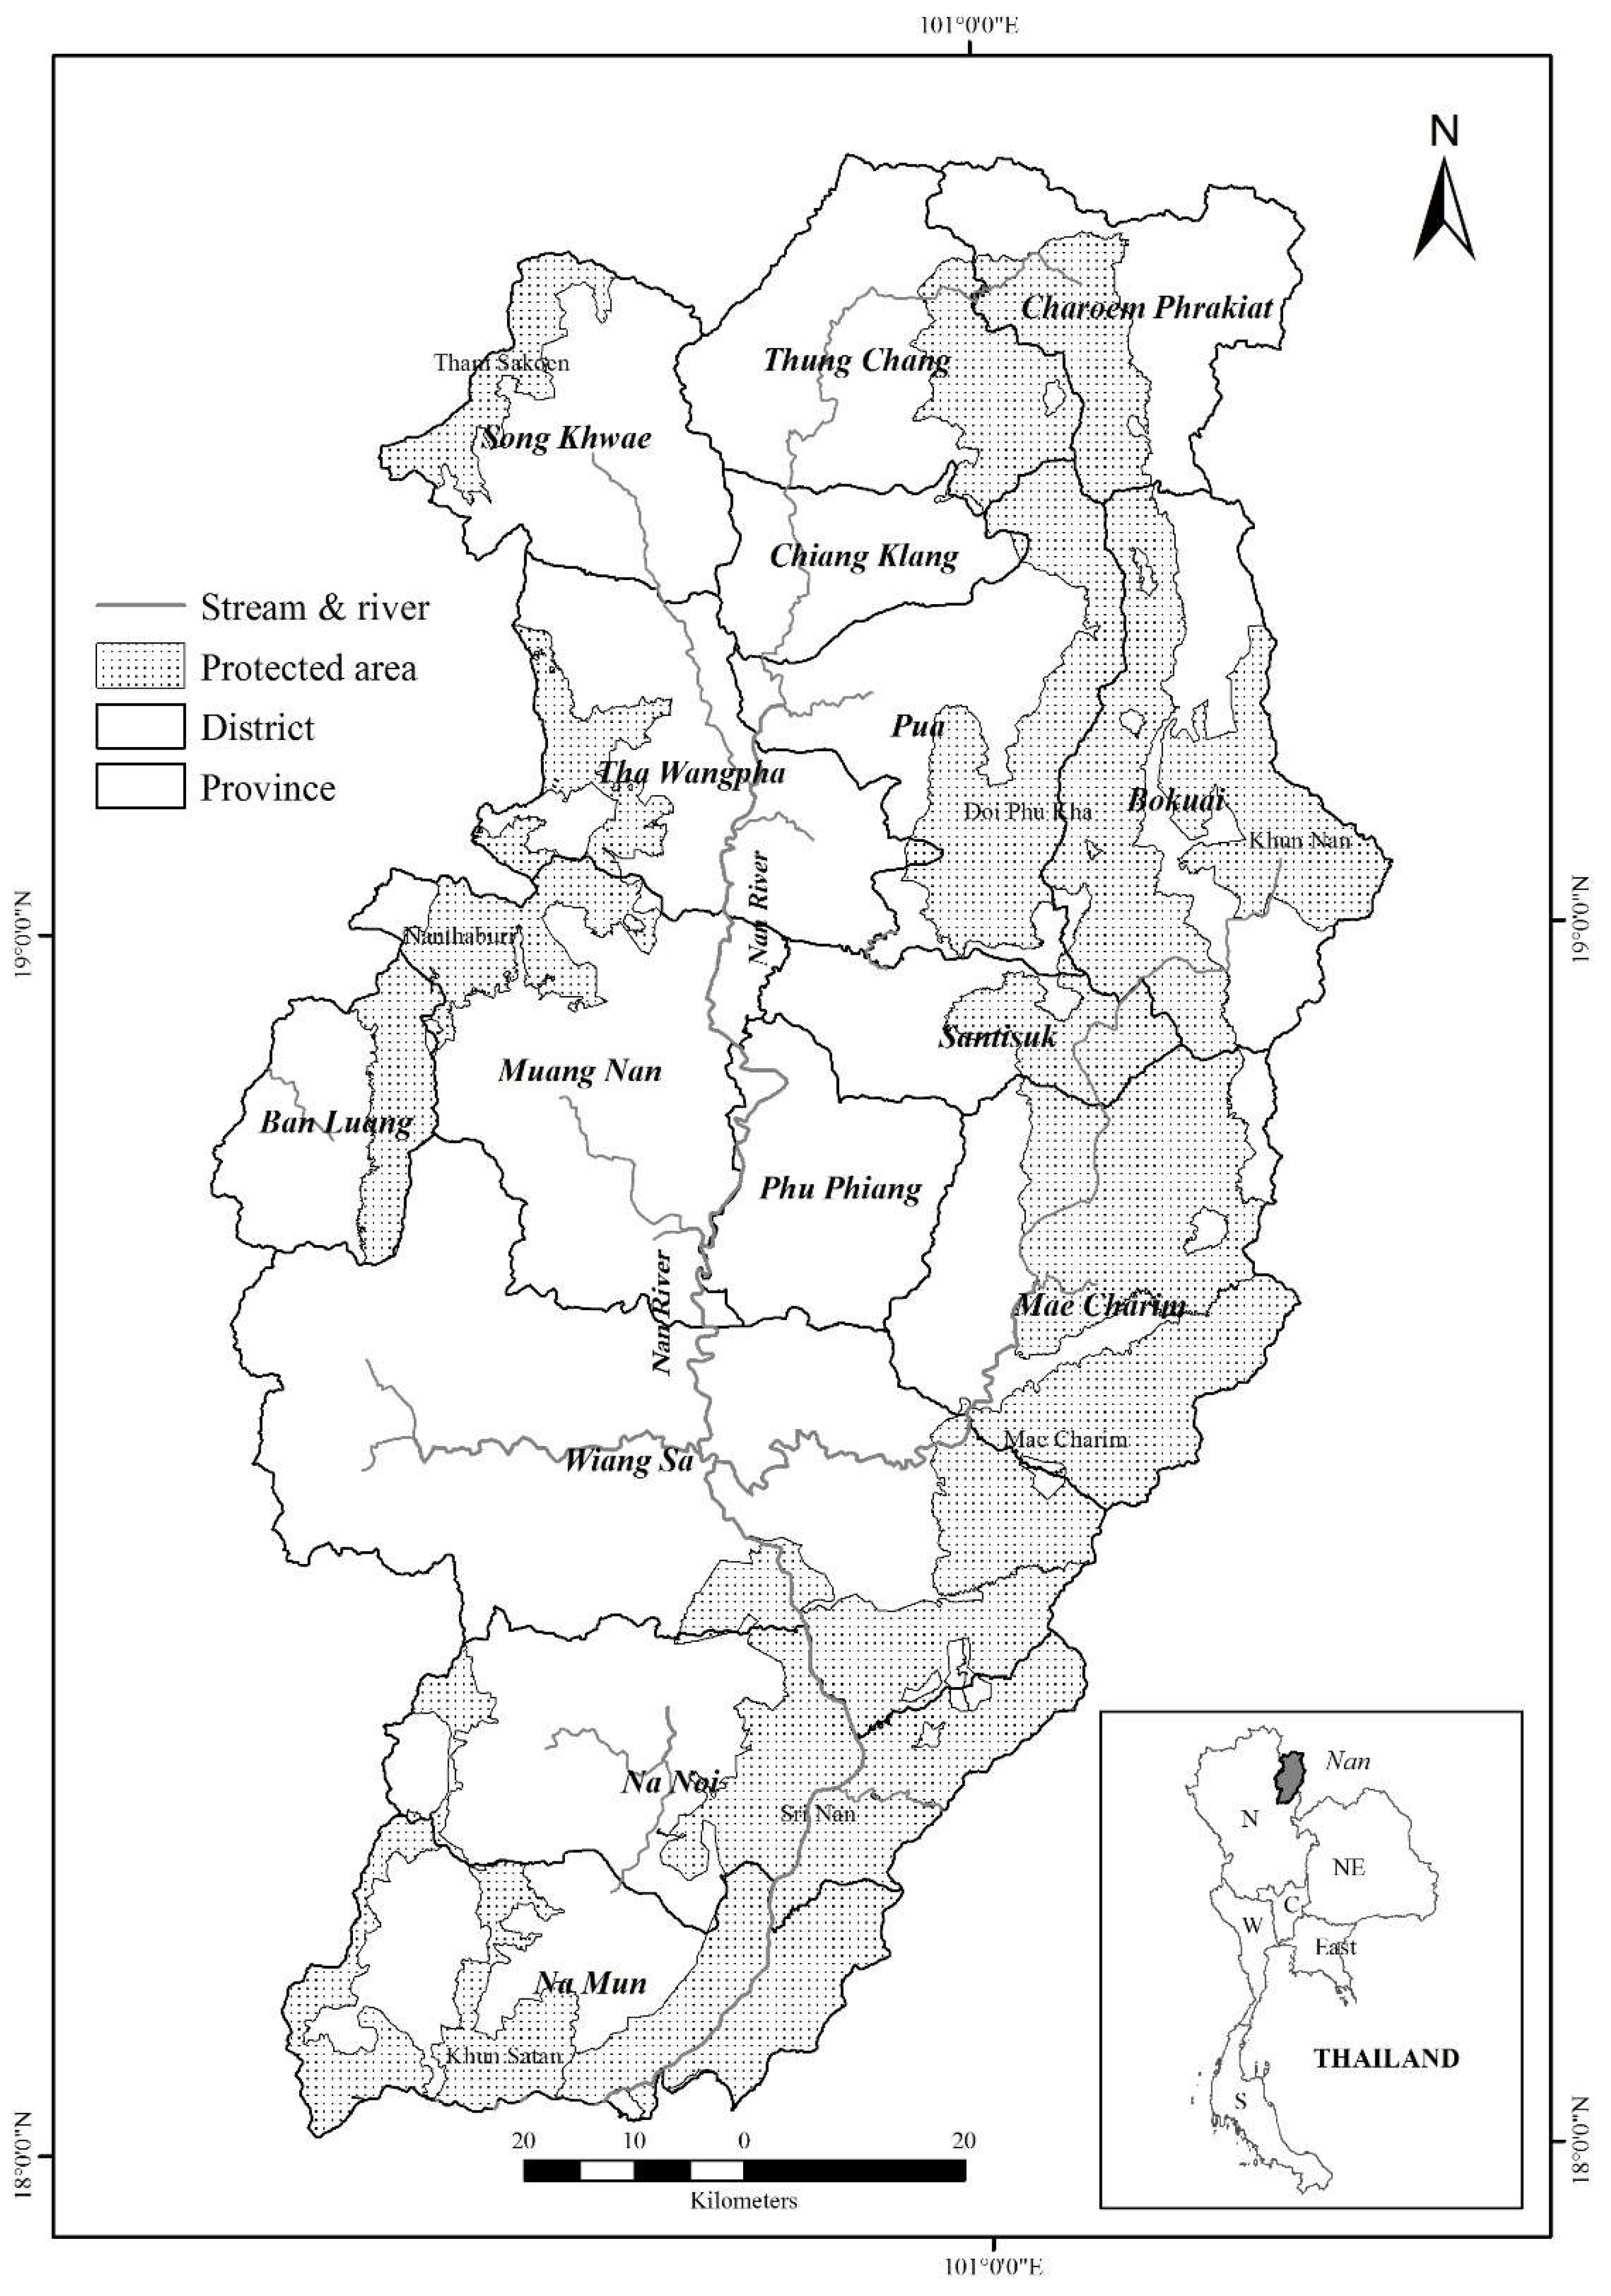
2. Study Area
3. Method
3.1. Defining Future Land-Use Scenarios
- F0: Forest area at baseline
- : Forest area in year n
- i: Index of crop
- : Agricultural area of crop i at baseline
- r: annual economic growth ratio
3.2. Modeling Land-Use Changes and Assessing Landscape Characteristics
3.3. Calculation of Mean Species Abundance
3.3.1. MSA Impact from Land Use
- ndvii: input ndvi value
- ndvimin: minimum value of derived ndvi values (−0.44)
- ndvimax: maximum value of derived ndvi values (0.83)
3.3.2. MSA Impact from Fragmentation
3.3.3. MSA Impact from Infrastructure
3.4. Assessing Biodiversity Hotspots
4. Results
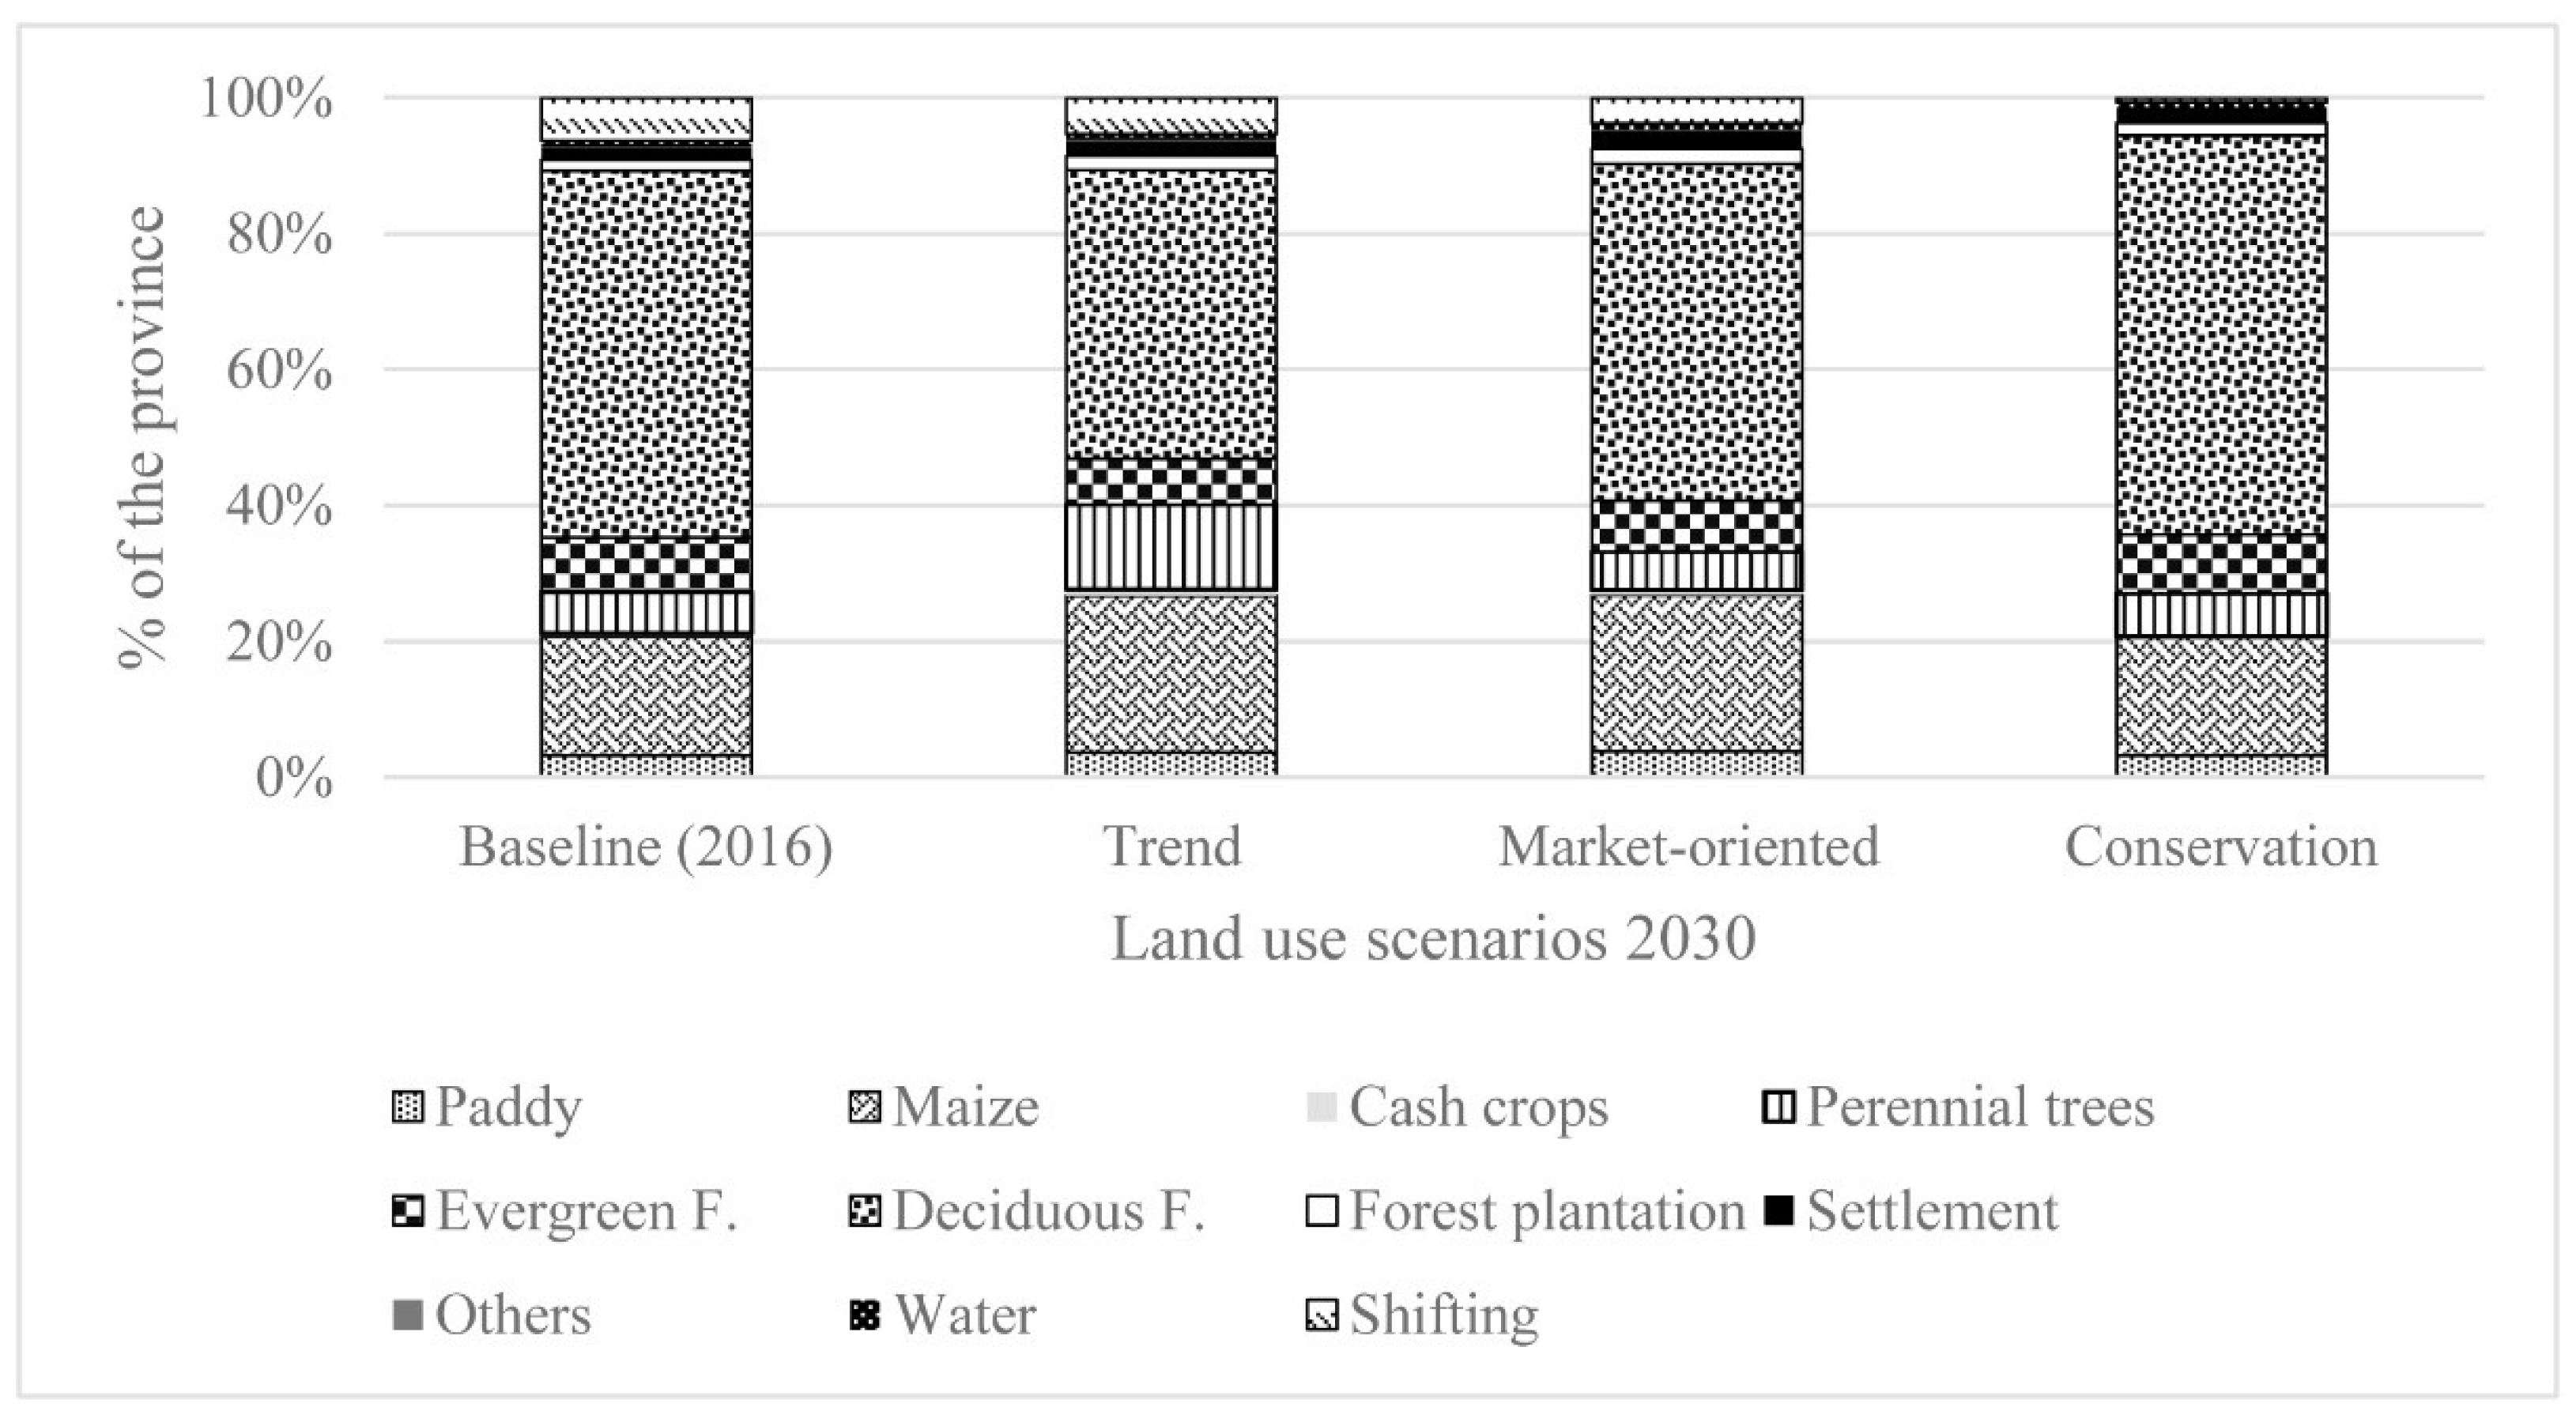
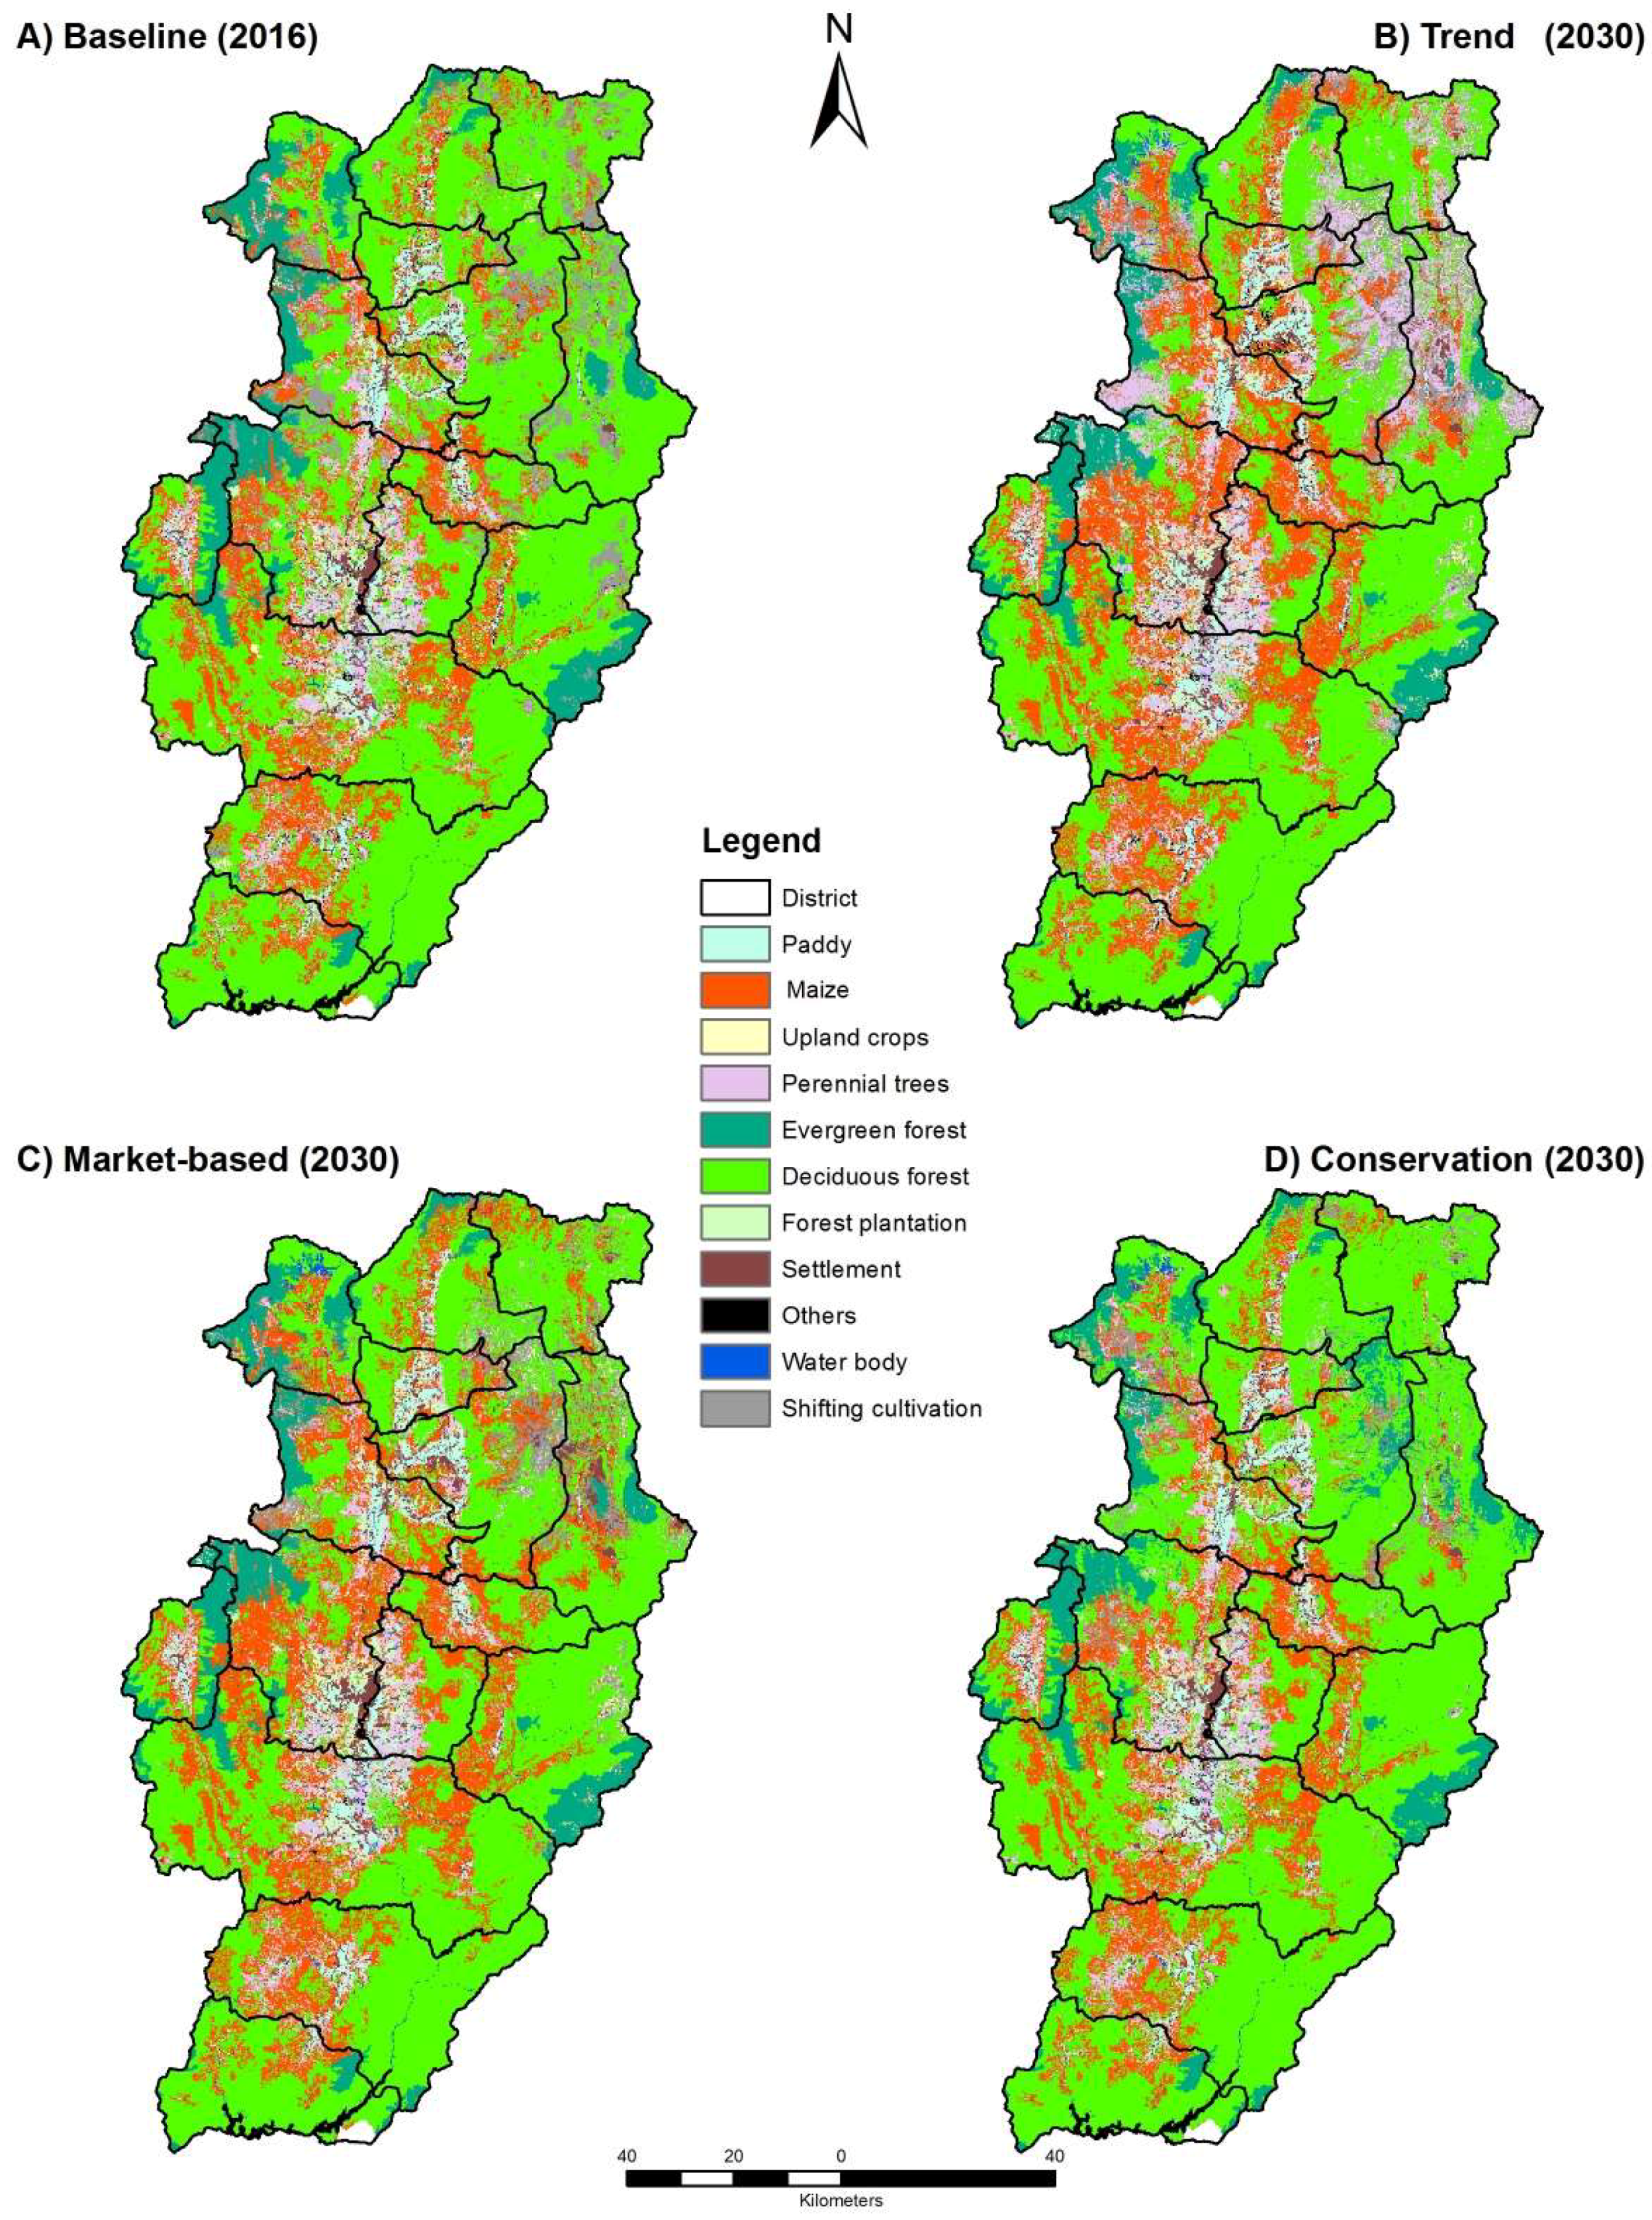
4.1. Predicted Land-Use and Landscape Changes
4.2. Altered Landscape Pattern
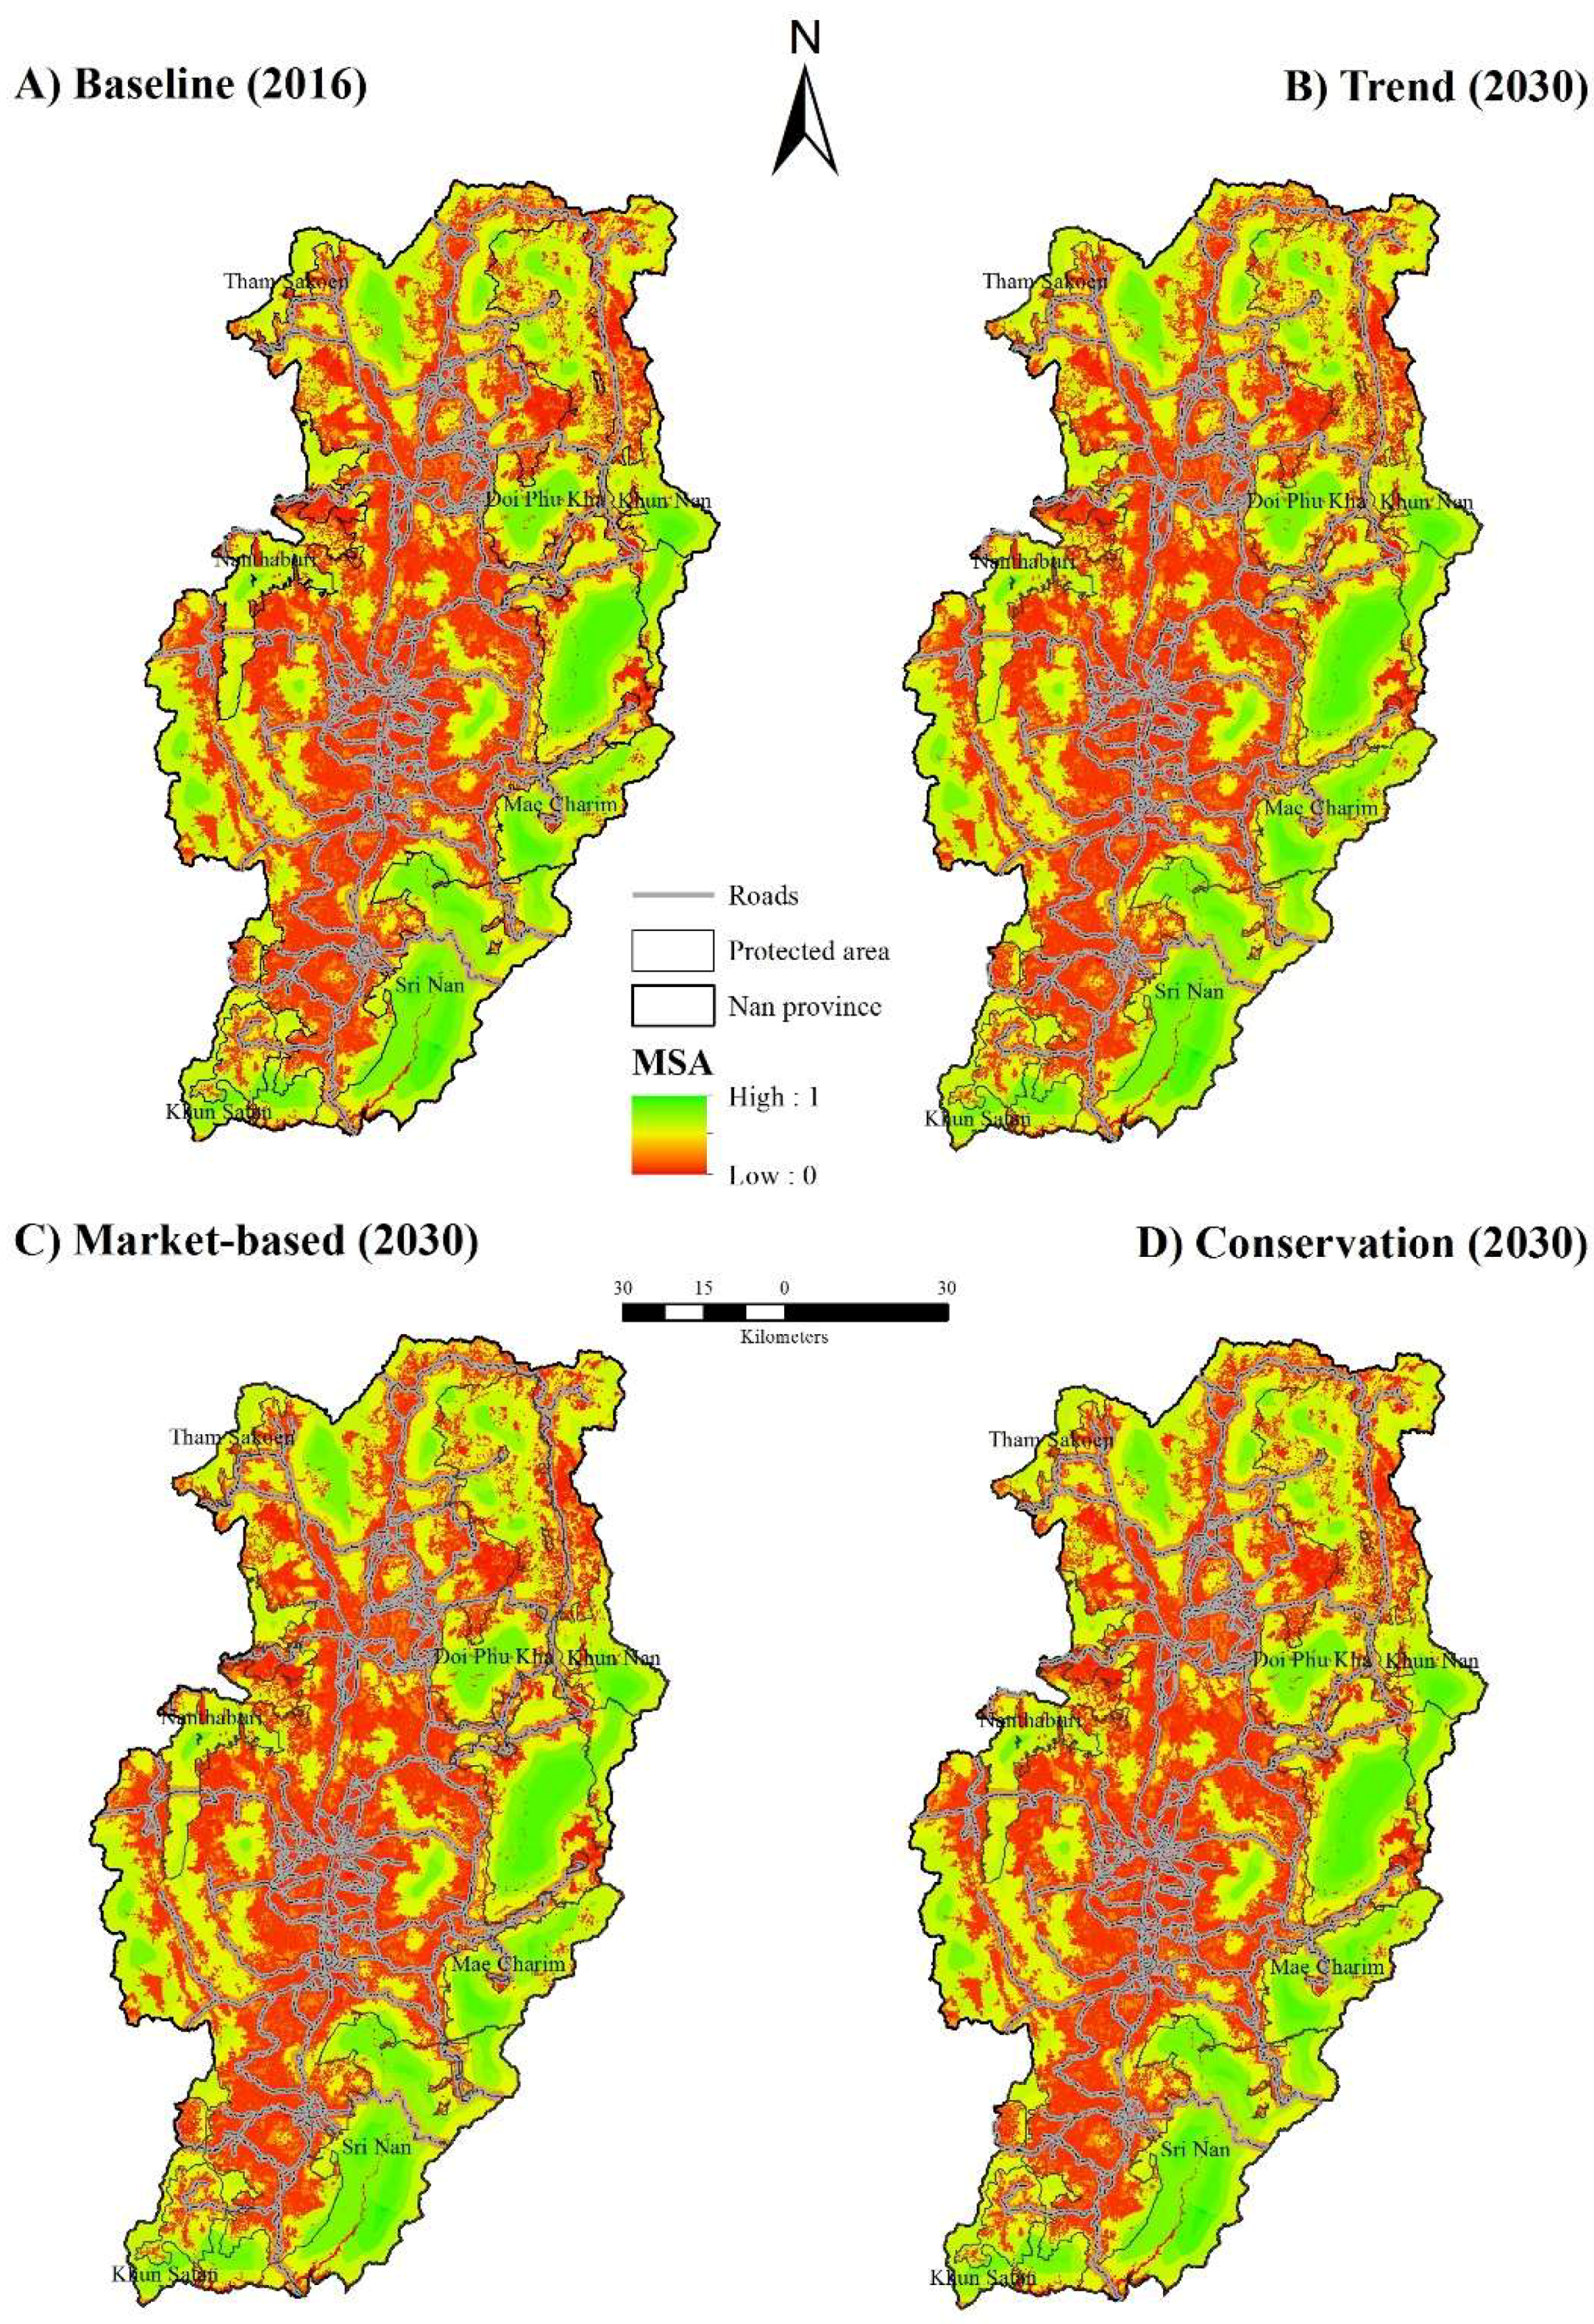
4.3. MSA Values
4.4. Contribution of Protected Areas
4.5. Biodiversity Hotspots
5. Discussion
5.1. Dissimilarity of Land-Use Drivers at National and Provincial Levels
5.2. Biodiversity Conservation Implication
5.3. Additional Research Needs
6. Conclusions
Supplementary Materials
Author Contributions
Funding
Acknowledgments
Conflicts of Interest
References
- Rice Exports by Country. Available online: http://www.worldstopexports.com/ rice-exports-country/ (accessed on 10 September 2018).
- FAO. The State of Food Insecurity in the World 2005; United Nations Food and Agriculture Organization (FAO): Rome, Italy, 2010. [Google Scholar]
- Porter, A. (Ed.) Agricultural Developments and Policy Implications; Nova Science Publishers Inc.: New York, NY, USA, 2018. [Google Scholar]
- Office of National Economic and Social Development (NESDB). The Tenth National Economic and Social Development Plan (2007–2011); Prime Minister Office: Bangkok, Thailand, 2007. [Google Scholar]
- Office of Agricultural Economics [OAE]. Agricultural Statistics of Thailand 1981; Ministry of Agriculture and Co-operatives: Bangkok, Thailand, 1981. (In Thai) [Google Scholar]
- Bank of Thailand. Macro-economic Index. Ministry of Finance, Bangkok. Available online: http://www2.bot.or.th/statistics/ReportPage.aspx?reportID=409 (accessed on 15 August 2018).
- National Statistical Office. Population and Society. Prime Minister Office, Bangkok, 2017. Available online: http://web.nso.go.th/en/ stat_theme_socpop.htm (accessed on 15 August 2018). (In Thai).
- Office of National Economic and Social Development (NESDB). The Twelfth National Economic and Social Development Plan (2017–2021); Prime Minister Office: Bangkok, Thailand, 2017. [Google Scholar]
- Santiphop, T.; Shrestha, R.P.; Hazarika, M.K. An analysis of factors affecting agricultural land use patterns and livelihood strategies of farm households in Kanchanaburi Province, Thailand. J. Land Use Sci. 2012, 7, 331–348. [Google Scholar] [CrossRef]
- Yasmi, Y.; Durst, P.; Haq, R.U.; Broadhead, J. Forest Change in the Greater Mekong Subregion (GMS): An Overview of Negative and Positive Drivers; Food and Agriculture Organization of the United Nations (FAO), Regional Office for Asia and the Pacific: Bangkok, Thailand, 2017. [Google Scholar]
- Royal Forest Department [RFD]. Forestry Statistics Year 2016; Ministry of Natural Resources and Environment: Bangkok, Thailand, 2016. (In Thai) [Google Scholar]
- Trisurat, Y. Applying gap analysis and a comparison index to assess protected areas in Thailand. Environ. Manag. 2007, 39, 235–245. [Google Scholar] [CrossRef] [PubMed]
- Trisurat, Y.; Duemgkae, P. Consequences of land use change on bird distribution at Sakaerat Environmental Research Station. J. Ecol. Field Biol. 2011, 34, 203–214. [Google Scholar] [CrossRef] [Green Version]
- Sodhi, N.S.; Posa, M.R.C.; Lee, T.M.; Bickford, D.; Koh, L.P.; Brook, B. The state and conservation of Southeast Asian biodiversity. Biodivers. Conserv. 2010, 19, 317–328. [Google Scholar] [CrossRef]
- Tantipisanuh, N.; Gale, G.A. Representation of threatened vertebrates by a protected area system in Southeast Asia: The important of non-forest habitats. Raffles Bull. Zool. 2013, 61, 359–395. [Google Scholar]
- Ngoprasert, D.; Lynam, A.J.; Sukmasuang, R.; Chutipong, W.; Tantipisanuh, N.; Steinmetz, R.; Gale, G.A.; Jenks, L.; Grassman, L.I.; Kitamura, S.; et al. Distribution of clouded leopards, leopards, and tigers across Thailand: Effects of prey, habitat and intraspecific competition. Biotropica 2012, 44, 810–817. [Google Scholar] [CrossRef]
- McShea, W.J.; Koy, K.; Clements, T.; Johnson, A.; Vongkhamheng, C.; Aung, M. Finding a needle in the haystack: Regional analysis of suitable Eld’s deer (Cervus eldii) forest in Southeast Asia. Biol. Conserv. 2005, 125, 101–110. [Google Scholar] [CrossRef]
- Trisurat, Y.; Bhumpakphan, N.; Reed, D.H.; Kanchanasaka, B. Using species distribution modeling to set management priorities for mammals in northern Thailand. J. Nat. Conserv. 2012, 20, 264–273. [Google Scholar] [CrossRef]
- Consiglio, T.; Schatz, G.E.; McPherson, G.; Lowry, P.P., 2nd; Rabenantoandro, J.; Rogers, Z.S.; Rabevohitra, R.; Rabehevitra., D. Deforestation and plant diversity of Madagascar’s littoral forests. Conserv. Biol. 2006, 20, 1799–1803. [Google Scholar] [CrossRef]
- Benítez-López, A.; Alkemade, R.; Schipper, A.M.; Ingram, D.J.; Verweij, P.A.; Eikelboom, J.A.J.; Huijbregts, M.A.J. The impact of hunting on tropical mammal and bird populations. Science 2017, 356, 180–183. [Google Scholar] [CrossRef] [Green Version]
- Clements, G.R.; Lynam, A.J.; Gaveau, D.; Yap, W.L.; Lhota, S.; Goosem, M.; Laueance, S.; laurance, W.F. Where and How Are Roads Endangering Mammals in Southeast Asia’s Forests? PLoS ONE 2014, 9, e115376. [Google Scholar] [CrossRef] [PubMed]
- Arunyawat, S.; Shrestha, R.P. Assessing Land Use Change and Its Impact on Ecosystem Services in Northern Thailand. Sustainability 2016, 8, 768. [Google Scholar] [CrossRef]
- Trisurat, Y.; Eiwpanich, P.; Kalliola, R. Integrating land use and climate change scenarios and models into assessment of forested watershed services in Southern Thailand. Environ. Res. 2016, 147, 611–620. [Google Scholar] [CrossRef] [PubMed]
- Zeller, U.; Starik, N.; Göttert, T. Biodiversity, land use and ecosystem services—An organismic and comparative approach to different geographical regions. Glob. Ecol. Conserv 2017, 10, 114–125. [Google Scholar] [CrossRef]
- UNEP-WCMC and IUCN. Protected Planet Report 2016; UNEP-WCMC and IUCN: Cambridge, UK; Gland, Switzerland, 2016. [Google Scholar]
- Wilson, E.O. (Ed.) Half-Earth: Our Planet’s Fight for Life; Liveright Publishing Corporation: New York, NY, USA, 2016. [Google Scholar]
- Pimm, S.L.; Jenkins, C.N.; Li, B.V. How to protect half of earth to ensure it protects sufficient biodiversity. Sci. Adv. 2018, 4, eaat2616. [Google Scholar] [CrossRef] [PubMed]
- Wienhues, A. Situating the half-earth proposal in distributive justice: Conditios for just conservation. Biol. Conserv. 2018, 228, 44–51. [Google Scholar] [CrossRef]
- Ferrier, S.; Ninan, K.N.; Leadley, P.; Alkemade, R.; Acosta, L.A.; Akçakaya, H.R.; Brotons, L.; Cheung, W.; Christensen, V.; Harhash, K.A.; et al. (Eds.) IPBES: Summary for Policymakers of the Methodological Assessment of Scenarios and Models of Biodiversity and Ecosystem Services of the Intergovernmental Science-Policy Platform on Biodiversity and Ecosystem Services; Secretariat of the Intergovernmental Science-Policy Platform on Biodiversity and Ecosystem Services: Bonn, Germany, 2016; 32p. [Google Scholar]
- Pontius, R.; Boersma, J.C.; Castella, K.; Clarke, T.; de Nijs, C.; Dietzel, Z.; Duan, E.; Fotsing, N.; Goldstein, K.; Kok, E.; et al. Comparing the input, output, and validation maps for several models of land change. Ann. Reg. Sci. 2008, 42, 11–37. [Google Scholar] [CrossRef]
- Lambin, E.F.; Geist, H.J.; Lepers, E. Dynamics of land-use and land-cover change in tropical regions. Ann. Rev. Environ. Resour. 2003, 28, 205–241. [Google Scholar] [CrossRef]
- Graham, C.H.; Hijmans, R.J. A comparison of methods for mapping species ranges and species richness. Glob. Ecol. Biogeogr. 2006, 15, 578–587. [Google Scholar] [CrossRef]
- Baicha, W. Land use dynamics and land cover structure change in Thailand (as exemplified by mountainous Nan Province). Geogr. Natl. Res. 2012, 37, 87–92. [Google Scholar] [CrossRef]
- Office of Agricultural Economics [OAE]. Agricultural statistics of Thailand 2016; Ministry of Agriculture and Co-operatives: Bangkok, Thailand, 2016. (In Thai) [Google Scholar]
- Wiroonratch, B. Evaluation process of rubber replanting aid in eastern and northwestern Thailand. J. Sci. Technol. Humanit. 2013, 11, 65–75. [Google Scholar]
- Nan Provincial Office. Nan Development Plan 2018–2021; Nan Provincial Office: Nan, Thailand, 2016. [Google Scholar]
- Office of National Economic and Social Development Board (NESDB). Report on Situation of Poverty and Income Disparity in Thailand in 2015; Prime Minister Office: Bangkok, Thailand, 2015. [Google Scholar]
- Office of Agricultural Economics (OAE). Agricultural Statistics of Thailand 2005; Ministry of Agriculture and Co-operatives: Bangkok, Thailand, 2005. [Google Scholar]
- Office of Agricultural Economics (OAE). Agricultural Statistics of Thailand 2007; Ministry of Agriculture and Co-operatives: Bangkok, Thailand, 2007. [Google Scholar]
- Land Development Department. Land Use Map 1977; Ministry of Agriculture and Co-operatives: Bangkok, Thailand, 1977. [Google Scholar]
- Stephen, R.; Carpenter, E.; Bennett, M.; Peterson, G.D. Scenarios for ecosystem services: An overview. Ecol. Soc. 2006, 11, 29. [Google Scholar]
- Gagniuc, P.A. Markov Chains: From Theory to Implementation and Experimentation. John Wiley & Sons: Hoboken, NJ, USA.
- Land Development Department. Land Use Map 2009; Ministry of Agriculture and Co-operatives: Bangkok, Thailand, 2009. [Google Scholar]
- Land Development Department. Land Use Map 2016; Ministry of Agriculture and Co-operatives: Bangkok, Thailand, 2016. [Google Scholar]
- Verburg, P.H.; Veldkamp, A. Projecting land use transitions at forest fringes in the Philippines at two spatial scales. Landsc. Ecol. 2004, 19, 77–98. [Google Scholar] [CrossRef]
- Ongsomwang, S.; Boonchoo, K. Integration of geospatial models for the allocation of deforestation hotspots and forest protection units. Suranaree J. Sci. Technol. 2016, 23, 283–307. [Google Scholar]
- Trisurat, Y.; Alkemade, R.; Verburg, P. Projecting land use change and its consequences for biodiversity in Northern Thailand. Environ. Manag. 2010, 45, 626–639. [Google Scholar] [CrossRef] [PubMed]
- Verburg, P.H.; Overmars, K. Combining top-down and bottom-up dynamics in land use modeling: Exploring the future of abandoned farmlands in Europe with the Dyna-CLUE model. Landsc. Ecol. 2009, 24, 1167–1181. [Google Scholar] [CrossRef]
- Oberhauser, U. Secondary forest regeneration beneath pine (Pinus kesiya) plantations in the northern Thai highlands: A chronosequence study. For. Ecol. Manag. 1997, 99, 171–183. [Google Scholar] [CrossRef]
- McGarigal, K.; Cushman, S.A.; Ene, E. FRAGSTATS v4: Spatial Pattern Analysis Program for Categorical and Continuous Maps; Computer Software Program, University of Massachusetts: Amherst, MA, USA, 2012. [Google Scholar]
- Sharp, R.; Tallis, H.T.; Ricketts, T.; Guerry, A.D.; Wood, S.A.; Chaplin-Kramer, R.; Nelson, E.; Ennaanay, D.; Wolny, S.; Olwero, N.; et al. InVEST 3.5.0. User’s Guide; The Natural Capital Project; Stanford University, University of Minnesota, The Nature Conservancy and World Wildlife Fund: Stanford, CA, USA, 2018. [Google Scholar]
- Alkemade, R.; van Oorschot, M.; Nellemann, C.; Miles, L.; Bakkenes, M.; ten Brink, B. GLOBIO3: A framework to investigate options for reducing global terrestrial biodiversity loss. Ecosystems 2009, 12, 349–359. [Google Scholar] [CrossRef]
- Wildlife Research Division (Status of large mammals in Thailand). Bangkok: Wildlife Conservation Office; Department of National Parks, Wildlife and Plant Conservation: Bangkok, Thailand, 2010. [Google Scholar]
- Chaplin-Kramera, R.; Sharpa, R.P.; Mandlea, L.; Simb, S.; Johnsonc, J.; Butnarb, I.; Canalsb, L.M.; Eichelbergera, B.A.; Ramlerd, I.; Muellerb, C.; et al. Spatial patterns of agricultural expansion determine impacts on biodiversity and carbon storage. PNAS 2016, 112, 7402–7407. [Google Scholar] [CrossRef] [PubMed]
- Jackson, D.A.; Somers, K.M.; Harvey, H.H. Similarity coefficients: Measures of co-occurrence and association or simply measures of occurrence? Am. Nat. 1989, 133, 436–453. [Google Scholar] [CrossRef]
- Jung, M.; Henkel, K.; Herold, M.; Churkina, G. Exploiting synergies of global land cover products for carbon cycle modeling. Remote Sens. Environ. 2006, 101, 534–553. [Google Scholar] [CrossRef]
- Ramankutty, N.; Foley, J.A. Estimating Historical Changes in Global Land Cover: Croplands from 1700 to 1992. Glob. Biogeochem. Cycles 1999, 13, 997–1027. [Google Scholar] [CrossRef]
- Flynn, E.S. Using NDVI as a Pasture Management Tool. Master’s Thesis, University of Kentucky, Lexington, KY, USA, 2006. Available online: https://uknowledge.uky.edu/gradschool_theses/412 (accessed on 23 August 2018).
- Thoma, D.P.; Bailey, D.W.; Long, D.S.; Mielsen, G.A.; Henry, M.P.; Breneman, M.C.; Montagne, C. Short-term monitoring of rangeland forage conditions with AVHRR imagery. J. Range Manag. 2002, 55, 383–389. [Google Scholar] [CrossRef]
- Land Development Department. Soil Erosion in Thailand; Ministry of Agriculture and Co-operatives: Bangkok, Thailand, 2000. [Google Scholar]
- Rosenzweig, M.L. Species Diversity in Space and Time; Cambridge University Press: Cambridge, UK, 1995. [Google Scholar]
- Hurd, J.D.; Civco, D.L. Development of a forest fragmentation index to quantify the rate of forest change. In Proceedings of the ASPRS-ACSM Annual Conference and FIG XXII Congress, Washington, DC, USA, 19–26 April 2002; Available online: https://searchworks.stanford.edu/view/4789343 (accessed on 5 September 2018).
- Myers, N. Threatened biotas: Hotspots in tropical forests. Environmentalist 1988, 8, 187–208. [Google Scholar] [CrossRef] [PubMed]
- Mittermeier, R.A.; Myers, N.; Mittermeier, C.G.; da Fonseca, G.A.; Kent, J. Biodiversity hotspots for conservation priorities. Nature 2000, 403, 853–858. [Google Scholar]
- Mittermeier, R.A.; Robles, G.; Hoffmann, M.; Pilgrim, J. Hotspots: Earth’s Biologically Richest and Most Endangered Terrestrial Ecoregions; CEMEX: Mexico City, Mexico, 2004. [Google Scholar]
- Rescigno, V.; Maletta, S. (Eds.) Biodiversity Hotspots; Nova Science Publishers Inc.: New York, NY, USA, 2009. [Google Scholar]
- Hosmer, D.W.; Lemeshow, S. Applied Logistic Regression, 2nd ed.; John Wiley & Sons, Inc.: New York, NY, USA, 2000. [Google Scholar]
- Tangtham, N. Watershed classification: The macro land-use planning for the sustainable development of water resources. In Proceedings of the International Seminar Workshop on Advances in Water Resources Management and Wastewater Treatment Technologies, Nakhon Ratchasima Province, Thailand, 22–25 July 1996. on the occasion of 6th Anniversary Suranaree University of Technology, Nakhon Ratchasima Province, Thailand. [Google Scholar]
- Highland Population Development Center. Statistics of Highland Population in Nan Province. Available online: http://pr.prd.go.th/nan/main.php?filename=intro (accessed on 12 August 2018).
- Lerdsupawitnapha, B. Strengthening Integrated Agriculture to Reduce Risk from Maize Plantation in Steep Slope Areas in Nan and Phayao Province; Thailand Research Fund: Bangkok, Thailand, 2010. [Google Scholar]
- Pongkijvorasin, S.; Talerngsri-Teerasuwannajak, K. Win-win solutions for reforestation and maize farming: A case study of Nan, Thailand. In Sustainable Economic Development: Resources, Environment and Institutions; Balisacan, A., Chakravorty, U., Ravago, M., Eds.; Academic Press: Cambridge, MA, USA, 2014. [Google Scholar]
- Steinmetz, R.; Srirattanaporn, S.; Mor-Tip, J.; Seuaturien, N. Can community outreach alleviate poaching pressure and recover wildlife in South-East Asian protected areas? J. Appl. Ecol. 2014. Available online: https://0-doi-org.brum.beds.ac.uk/10.1111/1365-2664.12239 (accessed on 25 August 2018). [CrossRef]
- Mirjam, A.F.; Ros-Tonen, K.; Wiersum, F. The importance of non-timber forest products for forest-based rural livelihoods: An evolving research agenda. In Proceedings of the International Conference on Rural Livelihoods, Forests and Biodiversity, Bonn, Germany, 19–23 May 2003; Available online: https://www.cifor.org/publications/corporate/cd-roms/bonn-proc/pdfs/papers/T2_FINAL_Ros-Tonen.pdf (accessed on 2 September 2018).


| LU/LC | 1977 | 2009 | 2016 | Change 2009-2016 | |||||
|---|---|---|---|---|---|---|---|---|---|
| (ha) | % | (ha) | % | (ha) | % | ha | % | Annual Rate | |
| Paddy 1 | 52,540 | 4.32 | 37,604 | 3.1 | 38,860 | 3.2 | 1256 | 3.34 | 0.47 |
| Maize | 5590 | 0.46 | 136,708 | 11.2 | 212,720 | 17.5 | 76,012 | 55.60 | 6.52 |
| Cash crops 2 | 2310 | 0.19 | 2116 | 0.2 | 5352 | 0.4 | 3236 | 152.93 | 14.18 |
| Perennial trees 3 | 4014 | 0.34 | 35,256 | 2.9 | 75,008 | 6.2 | 39,752 | 112.75 | 11.39 |
| Evergreen forest | 108,037 | 8.91 | 105,892 | 8.7 | 97,436 | 8.0 | −8,456 | −7.985 | −1.18 |
| Deciduous forest | 1,020,080 | 83.87 | 744,316 | 61.2 | 656,072 | 53.9 | −88,244 | −11.86 | −1.79 |
| Forest plantation 4 | 240 | 0.02 | 25,164 | 2.1 | 19,388 | 1.6 | −5,776 | −22.95 | −3.66 |
| Settlement | 11,310 | 0.93 | 20,520 | 1.7 | 21,896 | 1.8 | 1376 | 6.71 | 0.93 |
| Others 5 | n/a | - | 6876 | 0.6 | 3876 | 0.3 | −3000 | −43.63 | −7.86 |
| Water 6 | 4140 | 0.34 | 7440 | 0.6 | 8316 | 0.7 | 876 | 11.77 | 1.60 |
| Shifting cultivation 7 | 7420 | 0.61 | 94,368 | 7.8 | 77,336 | 6.4 | −17,032 | −18.05 | −2.80 |
| Total | 1,216,260 | 100.00 | 1,216,260 | 100.0 | 1,216,260 | 100.0 | 0 | ||
| Variables | Paddy | Maize | Cash Crops | Perennial Trees | Evergreen Forest | Deciduous Forest | Forest Plantation | Settlement | Misc. | Water | Shifting |
|---|---|---|---|---|---|---|---|---|---|---|---|
| Clay soil | ns | 2.084 | ns | 1.169 | ns | 1.554 | ns | −0.506 | ns | ns | ns |
| Clay loam soil | −0.985 | 2.729 | ns | 0.379 | ns | 2.144 | ns | −1.026 | ns | ns | ns |
| Loam soil | ns | 2.293 | ns | ns | ns | 1.181 | ns | ns | ns | ns | ns |
| Slope complex | −1.218 | 2.939 | ns | ns | ns | 2.656 | ns | −1.700 | ns | ns | 3.881 |
| Sandy clay loam soil | ns | 1.953 | ns | 0.740 | ns | 1.323 | ns | ns | ns | ns | ns |
| Sandy loam soil | ns | ns | 2.483 | ns | ns | ns | ns | ns | ns | ns | |
| Silt loam soil | ns | 1.030 | ns | 1.353 | ns | ns | ns | ns | ns | ns | ns |
| Silt clay soil | 1.262 | 0.810 | ns | ns | ns | 0.63 | ns | 0.743 | ns | ns | ns |
| Silty clay loam soil | 0.992 | ns | ns | ns | ns | ns | ns | ns | ns | ns | ns |
| Altitude (m) | −0.019 | −0.003 | ns | −0.004 | 0.004 | 0.004 | ns | −0.005 | −0.008 | −0.017 | ns |
| Distance to road (m) | −1.3 × 10⁻⁴ | −6.6 × 10⁻⁵ | −7.2 × 10⁻⁵ | −9.0 × 10⁻⁵ | 7.5 × 10⁻⁵ | 5.3 × 10⁻⁴ | −1.5 × 10⁻⁴ | −1.5 × 10⁻⁴ | −1.5 × 10⁻⁴ | 5.6 × 10⁻⁵ | −1.2 × 10⁻⁴ |
| Distance to stream (m) | ns | ns | −7.9 × 10⁻⁵ | ns | 2.7 × 10⁻⁵ | −1.8 × 10⁻⁵ | −7.1 × 10⁻⁵ | 5.8 × 10⁻⁴ | −5.7 × 10⁻⁵ | 7.4 × 10⁻⁵ | |
| Slope (%) | −0.351 | −0.067 | 0.079 | −0.088 | 0.027 | 0.069 | −0.125 | −0.216 | −0.197 | −0.169 | −0.008 |
| Mean temp. (°C) | −0.295 | −0.020 | −0.029 | −0.025 | 0.037 | 0.005 | 0.061 | −0.075 | −0.111 | −0.203 | 0.027 |
| Annual rainfall (mm) | −006 | −0.004 | −0.005 | ns | 0.006 | −0.002 | ns | ns | ns | ns | 0.007 |
| Agr. pop. density (hh/km2) | −0.013 | 0.006 | −0.037 | 0.034 | 0.037 | −0.030 | 0.053 | ns | −0.016 | −0.049 | 0.038 |
| Pop. density (ind./km2) | ns | −0.001 | ns | −0.001 | −0.016 | −2.2 × 10⁻⁵ | ns | 0.001 | 0.001 | ns | −0.008 |
| Constant | 90.645 | 8.91 | 14.861 | 11.237 | −19.789 | −2.157 | −14.509 | 22.864 | 32.763 | 58.191 | −3.534 |
| AUC | 0.942 | 0.717 | 0.693 | 0.834 | 0.788 | 0.723 | 0.879 | 0.898 | 0.876 | 0.897 | 0.759 |
| Patch Indices/MSA Values | 2009 | Baseline (2016) | Trend | Market-Based | Conservation |
|---|---|---|---|---|---|
| % forest area | 70.00 | 61.95 | 47.36 | 57.15 | 67.02 |
| No. of patches | 853 | 2075 | 2319 | 1911 | 2127 |
| Mean patch size (ha) | 966 | 363 | 259 | 364 | 385 |
| Largest patch index (%) | 67 | 55 | 32 | 44 | 60 |
| Total core area (1000 x ha) | 279 | 235 | 158 | 204 | 261 |
| Mean core area (ha) | 327 | 113 | 68 | 107 | 123 |
| Mean proximity index (m) | 480 | 475 | 497 | 489 | 467 |
| Overall MSA | 0.41 | 0.36 | 0.29 | 0.35 | 0.40 |
| Remaining MSA caused by land use (MSALU) | 0.77 | 0.69 | 0.59 | 0.66 | 0.74 |
| Remaining MSA caused by infrastructure (MSAI) | 0.75 | 0.84 | 0.85 | 0.84 | 0.84 |
| Remaining MSA caused by fragmentation (MSAF) | 0.60 | 0.54 | 0.48 | 0.53 | 0.58 |
| LU/LC | 2009 | 2016 | Trend | Market-based | Conservation | |||||
|---|---|---|---|---|---|---|---|---|---|---|
| Area (%) | Mean Elev (m) | Area (%) | Mean Elev (m) | Area (%) | Mean Elev (m) | Area (%) | Mean Elev (m) | Area (%) | Mean Elev (m) | |
| Paddy | 0.1 | 445 | 0.1 | 456 | 0.2 | 476 | 0.2 | 457 | 0.1 | 472 |
| Maize | 12.2 | 932 | 13.5 | 834 | 17.7 | 657 | 18.7 | 735 | 12.3 | 915 |
| Cash crops | 0.8 | 632 | 0.4 | 734 | 1.2 | 1185 | 0.9 | 832 | 0.2 | 1446 |
| Perennial trees | 0.0 | 253 | 1.9 | 620 | 9.9 | 943 | 1.9 | 626 | 2.1 | 654 |
| Evergreen forest | 11.2 | 1029 | 10.7 | 1026 | 9.3 | 1063 | 10.3 | 1149 | 11.5 | 1019 |
| Deciduous forest | 71.2 | 442 | 64.5 | 1041 | 53.4 | 972 | 61.2 | 992 | 69.4 | 1032 |
| Forest plantation | 0.2 | 589 | 0.3 | 541 | 0.4 | 555 | 0.3 | 502 | 0.3 | 704 |
| Settlement | 0.2 | 477 | 0.2 | 606 | 0.6 | 793 | 1.0 | 706 | 0.4 | 836 |
| Others | 0.1 | 390 | 0.0 | 400 | 0.0 | 302 | 0.0 | 299 | 0.0 | 322 |
| Water | 0.2 | 843 | 0.2 | 400 | 0.3 | 409 | 0.3 | 386 | 0.3 | 407 |
| Shifting cultivation | 3.8 | 350 | 8.0 | 956 | 6.9 | 1088 | 5.2 | 982 | 3.4 | 1,111 |
| Total | 100.00 | 100.0 | 100.0 | 100.0 | 100.0 | |||||
| 2009 | 2016 | Trend | Market-based | Conservation | ||||||
|---|---|---|---|---|---|---|---|---|---|---|
| MSA | % cont. | MSA | % cont. | MSA | % cont. | MSA | % cont. | MSA | % cont. | |
| Protected areas | 3 | 5 | 7 | 7 | 7 | |||||
| Area (km2) | 3155 | 26 | 3750 | 31 | 4430 | 37 | 4430 | 36 | 4430 | 36 |
| % forest cover | 85 | 31 | 89 | 42 | 77 | 64 | 87 | 53 | 91 | 40 |
| Overall MSA | 0.61 | 38 | 0.57 | 56 | 0.49 | 58 | 0.57 | 58 | 0.60 | 52 |
| MSALU | 0.93 | 31 | 0.89 | 45 | 0.81 | 48 | 0.89 | 47 | 0.93 | 39 |
| MSAI | 0.77 | 33 | 0.72 | 46 | 0.64 | 46 | 0.72 | 47 | 0.75 | 45 |
| MSAF | 0.82 | 28 | 0.83 | 23 | 0.84 | 23 | 0.83 | 40 | 0.83 | 43 |
© 2019 by the authors. Licensee MDPI, Basel, Switzerland. This article is an open access article distributed under the terms and conditions of the Creative Commons Attribution (CC BY) license (http://creativecommons.org/licenses/by/4.0/).
Share and Cite
Trisurat, Y.; Shirakawa, H.; Johnston, J.M. Land-Use/Land-Cover Change from Socio-Economic Drivers and Their Impact on Biodiversity in Nan Province, Thailand. Sustainability 2019, 11, 649. https://0-doi-org.brum.beds.ac.uk/10.3390/su11030649
Trisurat Y, Shirakawa H, Johnston JM. Land-Use/Land-Cover Change from Socio-Economic Drivers and Their Impact on Biodiversity in Nan Province, Thailand. Sustainability. 2019; 11(3):649. https://0-doi-org.brum.beds.ac.uk/10.3390/su11030649
Chicago/Turabian StyleTrisurat, Yongyut, Hiroaki Shirakawa, and John M. Johnston. 2019. "Land-Use/Land-Cover Change from Socio-Economic Drivers and Their Impact on Biodiversity in Nan Province, Thailand" Sustainability 11, no. 3: 649. https://0-doi-org.brum.beds.ac.uk/10.3390/su11030649