Article

Impact of Climate on Food Security in Mainland China: A New Perspective Based on Characteristics of Major Agricultural Natural Disasters and Grain Loss

1
National Hulunber Grassland Ecosystem Observation and Research Station, Institute of Agricultural Resources and Regional Planning, Chinese Academy of Agricultural Sciences, Beijing 100081, China
2
College of Resources and Environment, Northeast Agricultural University, Harbin 150030, China
3
State Key Laboratory of Remote Sensing Science, Institute of remote sensing and Digital Earth Research, Chines Academy of Science and Beijing Normal University, Beijing 100086, China
4
School of Humanities and Law, Northeastern University, Shenyang 110169, China
5
School of Software, Beihang University, Beijing 100086, China
*
Authors to whom correspondence should be addressed.
Sustainability 2019, 11(3), 869; https://0-doi-org.brum.beds.ac.uk/10.3390/su11030869
Submission received: 29 November 2018 / Revised: 26 January 2019 / Accepted: 30 January 2019 / Published: 7 February 2019
(This article belongs to the Special Issue Sustainable Wildlife Ecology and Conservation)

Abstract

:
Under the background of global warming, China has experienced frequent natural disasters that have seriously affected grain production in recent decades. Based on historical documents from 1978–2014, we explored the spatio-temporal variation of five major kinds of natural disasters and grain losses in China using statistical techniques: the Mann-Kendall (MK) test, social network analysis (SNA), and geographic information system (GIS) tools. The disaster intensity index (Q) clearly showed the variation of natural disasters; all of China experienced a significant increasing trend at an annual scale, reaching its peak (27.77%) in 2000. The step change points in floods, droughts, hail, and low-temperature events began to occur in 1983, 1988, 1988, 1992, respectively, while no obvious trend was detected for typhoon activity from 2001 to 2014. Drought and flood were the most serious types of disaster over the last four decades, accounting for more than 50% of total grain losses. Eight major provinces were identified with severe grain losses: Heilongjiang, Shandong, Henan, Hebei, Anhui, Sichuan, Jiangsu, Hunan, and Hubei. Five studied natural disaster types were identified throughout the seven physical geographical regions. Spatial distribution for the different disaster types showed significant geographical distribution characteristics. Natural disasters gradually became more diverse from north to south. Droughts, hail, and low-temperature disasters were randomly distributed throughout China; flood and typhoon disasters exhibited significant spatial auto-correlation and clustering patterns. Finally, in accordance with the intensity of natural disaster, the annual grain losses at the provincial scale initially increased (ranging from 0.14 million to 3.26 million tonnes in 1978–2000), and then decreased after 2000 (ranging from 3.26 million to 1.58 million tonnes in 2000–2014). The center of gravity of grain losses gradually moved northward. These results emphasize that developing different strategies for disaster prevention and mitigation programs in the major grain producing areas (e.g., Heilongjiang, Shandong, and Henan) are critical and important to China’s food security.

Graphical Abstract

1. Introduction

Natural disasters and food security are increasingly receiving attention from scientists, public, and countries around the world. Lesk et al. (2016) [1] stated that several extreme weather disasters have partially or completely damaged regional crop production. The effects of these disasters have seriously restricted the sustainable development of economies and societies and may have threatened human existence. Klomp et al. (2018) [2] argue that one of the main threats to sustainable economic development in the next decade is the re-occurrence of natural disasters. Therefore, the international community has paid considerable attention to natural disaster prevention. For example, http//www.mdpi.com/authors/references in 1987, the United Nations established the International Decade for Natural Disaster Reduction (IDNDR) with the aim of minimizing disaster losses, raising international awareness, and promoting disaster prevention and mitigation measures in various regions (http://www.un.org/documents/ecosoc/res/1994/eres1994-31.htm). Meanwhile, many scholars have performed research on the occurrence, development, and influence of natural disasters. For example, recently, natural disasters have become more frequent, extensive and threatening worldwide (Coffman et al., 2012) [3]. Goldenberg et al. (2001) [4] found that compared with the generally low activity of the previous 24 years (1971 to 1994), the years 1995–2000 have seen a doubling of overall activity for the Atlantic basin, a 2.5-fold increase in major hurricanes, and a fivefold increase in hurricanes affecting the Caribbean. Craft et al. (2017) [5] provided a baseline estimate of revenue losses from Kentucky’s beef and hay production due to droughts during the late twentieth and early twenty-first centuries. Kantamaneni et al. (2018) [6] assessed the physical and economic vulnerability of eleven UK sites of varying physical and economic characteristics. Economic activities are frequently affected by natural disasters, and increasingly more studies have focused on the impact of natural disasters on regional economies (Belasen et al., 2014; Mu et al., 2016) [7,8]. Held et al. (2005) [9] identified a continuation of the drying trend in the Sahel, which can have far-ranging implications for the economy and ecology of the region. There has also been an increased likelihood of extreme floods in the Mekong River during the last half of the 20th century (Delgado et al., 2010) [10]. Furthermore, agriculture is highly sensitive to natural disasters such as droughts, floods, low_temperature events, and typhoon activity (Philpott et al., 2008; Tubiello et al., 2008; Miraglia et al., 2009) [11,12,13]. Many studies have been conducted in the field of natural disaster and grain production evaluation. For example, regional increases in climate extremes have adverse effects on food production, freshwater availability, and quality, and the risks of infectious diseases (Kim et al., 2013; Mottaleb et al., 2013) [14,15]. Marvin et al. (2013) [16] identified the various food safety issues that are likely to be affected by changes in climate, particularly in Europe. Chau et al. (2013) [17] measured the potential impact of extreme flood events on agricultural land in the Quang Nam province of Vietnam. Therefore, agricultural production under current technological conditions is closely linked to natural disasters (Ray et al., 2015; Keating et al., 1998; Lansigan et al., 2000) [18,19,20].
China is one of the countries most affected by natural disasters worldwide due to its vast territory, complex geographical environment, large fluctuations in climate, poor ecological stability, and high frequency and intensity of disasters (Cheng et al., 2014; Simelton, 2011; Zhang et al., 2014a; Hong et al., 2015; Guo et al., 2016) [21,22,23,24,25]. China’s social and economic development are seriously affected by natural disasters. According to statistics, from January to August 2016, 137 million people were affected by various natural disasters in China and the direct economic losses totaled 298.3 billion Chinese Yuan. However, to mitigate the impact of natural disasters, many scholars have performed in-depth studies of natural disasters. Research on natural disasters in China has mainly focused on floods and droughts, but comprehensive studies of various disasters are rare (Lu et al., 2012; Chen et al., 2013; Li et al., 2012; Nie et al., 2012; He et al., 2013) [26,27,28,29,30]. Several studies have been conducted on drought and flood monitoring, drought and flood risk assessment, and the effects of droughts and floods on agriculture in China (Li et al., 1996, 2003; Ju et al., 1997; Shi et al., 2007; Meng et al., 2016) [31,32,33,34,35]. Sun et al. (2016) [36] provide a valuable approach to the rapid diagnosis of weak links in the construction of flood disaster resilience infrastructure. Meanwhile, the frequent occurrences of natural disasters have had far-reaching impacts on the sustainable development of China’s agricultural, economic, and grain security (Huang et al., 2004; Liu et al., 2005; Kellenberg et al., 2008; Waddington et al., 2010; Liu et al., 2012) [37,38,39,40,41]. Therefore, it is imperative to understand and define spatio-temporal effects on grain production. However, existing studies have focused on the spatial and temporal analysis of a certain disaster type (e.g., droughts and floods), or on qualitative analysis of various disasters and their effects on rice and wheat production (Zhang, 2004; Huang et al., 2004; Gu et al., 2016; Li et al., 2010; Liao et al., 2013) [42,43,44,45]. Few studies have explicitly explored the spatio-temporal patterns of multiple natural disasters and the quantitative relationship of their effects on grain production. Guan et al. (2015) [46] found that there are five main disaster types in China: floods, droughts, hail, low-temperature events, and typhoon activity. Guo et al. (2016) [25] reported that droughts and floods are two kinds of major climate disasters in China that contribute to more than 70% to the reduction of crop production. Based on historical documents and records, Liu et al. (2012) [25] analyzed the characteristics of frequency and distribution of major disasters (floods, droughts, hail, low-temperature events, and typhoon activity) that took place in the history of China. Simelton (2011) [22] used agricultural production (rice, wheat, maize, tubers, soybeans, and other grains) and natural disaster data (floods, and droughts) for 31 provinces in China for the period 1995–2008 to examine the self-sufficiency of China’s domestic harvests. Further, we asked, how have natural disasters and grain losses in recent years been distributed in spatio-temporal dimensions? What is the most vulnerable area to natural disasters and what is the most widespread and severe disaster type in different regions of China? The main objectives of this study were as follows: (1) to explore the long-term trends of multiple disaster types in mainland China; (2) to examine the spatial trends and hot spots in the spatial distribution of natural disasters; and (3) to assess the impact of natural disasters on grain production and the quantitative relationships between them. Some adaptive strategies to natural disaster prevention to reduce grain losses and risk are also presented.

2. Materials and Methods

2.1. Study Area

China is located in the eastern part of Asia and lies on the west coast of the Pacific Ocean (3°31′00″ N–53°33′00″ N, 73°29′59.79″ E–135°2′30″ E). It has 34 provincial administrative regions, with a population of 1.3 billion. Generally, according to the method of combining geographical and administrative regions, Mainland China can be divided into seven geographical regions, namely Northeast, Northwest, South China, Central China, Northwest, Southwest, and North China (Figure 1). Meanwhile, China is a great agricultural country (the main food crops: (1) cereal crops: rice, wheat, corn, etc.; (2) bean crops: soybeans, broad beans, peas, etc.; (3) dioscorea: sweet potato, potato, cassava, etc.). The climate conditions of the study area have three major characteristics: a significant monsoon climate, simultaneous rain and heat, and a complex and diverse climate. Du et al. (2015) [47] pointed out that it is critical for China to maintain stable grain production, as the population of China accounts for more than 20% of the world’s population. In this regard, food security is facing tremendous challenges with climate change.
Due to the lack of available data, it should be noted that Hong Kong, Macao, and Taiwan were excluded from the analysis, and only 31 provinces/municipalities made up the study area (Mainland China in Figure 1). Du et al. (2015) [47] pointed out that the provinces of Liaoning, Hebei, Shandong, Jilin, Inner Mongolia, Jiangxi, Hunan, Sichuan, Henan, Hubei, Jiangsu, Anhui, and Heilongjiang are the major grain producing areas, the grain yield of which accounts for more than 75% of China’s total grain yield.

2.2. Data

To represent and achieve the different research purposes, there are three categories of datasets used in the study, including natural disaster dataset, crop dataset, and map dataset. This paper evaluated the spatio-temporal characteristics of the five disasters (Guan et al., 2015) [46] and their impacts on grain production. A description of the database used in this paper was given in Table 1.
The disaster data was obtained from the natural disaster database at the website of the Ministry of Agriculture of China (MAC, http://zzys.agri.gov.cn/zaiqing.aspx). The floods, droughts, hail, and low-temperature disaster database for the period 1978–2014, including the crop-covered area, crop-affected area, and crop failure area, was provided by MAC (see Table 1 for the definition of these three terms). The typhoon disaster database for the period 2000–2014 was also provided by MAC. The rough datasets were used to investigate the spatio-temporal characteristics of natural disasters during 1978–2014. The potential analyses results were displayed on the Origin 2016 (OriginLab, Northampton, MA) and social network analysis (SNA) platforms (such as UCINET 6.0 and Netdraw 6.0 (Borgatti et al., University of Kentucky, Kentucky)).
To represent the effects of natural disasters on grain production in this study, grain data were mainly derived from the crop database of MAC (http://zzys.agri.gov.cn/nongqing.aspx). The database of agricultural crops for the period 1978–2014, including the items: grain acreage, crop acreage, grain yield, and grain output, was provided by MAC. All the data were constructed as a GIS database to assess the risk of natural disasters on grain production.
The natural disaster data were supplemented from the Chinese Statistical Yearbook from 1978 to 2015 and from the database of China’s social and economic development (http://tongji.cnki.net/kns55/index.aspx). Map data used in this study were obtained from the vector map of China of the national basic geographic information system database at a scale of 1–4 million (http://www.sbsm.gov.cn/article/zszygx/chzs/jcch/jcdlxxxt/).

2.3. Methods

With the above datasets, the following methods were used to analyze the spatio-temporal distribution characteristics of natural disasters, and the effects of natural disasters on grain production from 1978 to 2014, as well as to provide a scientific reference for agricultural disaster prevention and mitigation in China.

2.3.1. The Intensity Index of Natural Disasters

Many techniques have been developed in previous studies to detect the temporal characteristics of disasters, and disasters trends have been analyzed using collected time series (Du et al., 2015; Shi et al., 2014) [47,48]. Yang et al. (2016) [49] defined the rice flood index (RFI) by considering the intensity and frequency of rice floods with the purpose of effectively assessing spatio-temporal flood risk for rice in Southwest China. He et al. (2013) [30] used the drought hazard index (DHI) to assess the agricultural drought risk and spatial characteristic of agricultural drought risk in China. However, to the authors’ knowledge, no generally accepted standard methodology exists for the assessment of natural disasters risk (Liao et al., 2013; Du et al., 2015) [45,47]. Du et al. (2015) [47] discussed spatio-temporal pattern changes of main natural disasters by the annual disaster coverage area dataset in China. To avoid the excessive influence of only disaster coverage areas, a multi-area weighting method (MAWM) was used to construct a disaster intensity index (Q) in this study. According to the MAWM model, data on hectares of all crops covered by, affected by, and destroyed by flood disaster must be collected. On the condition that the temperature and the precipitation are equal to long-term average values, crop-affected area refers to the sown area where crop yields are decreased by more than 30% due to natural disasters. Additionally, crop failure area refers to the sown area where crop yields are decreased by more than 70% due to natural disasters (Shi et al., 2014) [48]. Based on the above definitions, the crop-affected area (C) and crop failure area (J) were assigned weights of 0.3 and 0.7. The disaster intensity index (Q) can be expressed as follows:
Q = C 0.3 + J 0.7 S 100 %
where C is the value of the crop-affected area, J is the value of the crop failure area, S is the value of crop area covered by disasters, and Q is the value of the disaster intensity index (the crop covering area). Values of Q represent the magnitude of the natural disaster intensity, which explains the intensity of natural disasters that occur in a per unit area. Q index (a dimensionless index) in this manuscript can effectively alleviate the errors caused by different agricultural planting areas. The larger the Q value is, the more severe the disaster is.

2.3.2. The Mann–Kendall Test

The Mann–Kendall (MK) analysis, as proposed separately by Mann (1945) and Kendall (1975), has been widely applied for trend detecting in hydro-climatic time series (Wang et al., 2017) [50]. The MK test is a rank-based procedure, which does not require any assumption about distribution. Therefore, it is frequently used for detecting trends in different natural disasters, e.g., droughts, floods, and hail (Wu et al., 2008) [51]. In this study, we used MK analysis to detect the existence of any step change points for major natural disasters in 1978–2014.
When the MK test is employed to detect the disaster changing the trend, the normally MK test can be calculated as follows:
S = i = 1 n 1 j = i + 1 n sgn ( x j x i )
θ = x i y j
sgn ( θ ) = { + 1 θ > 0 0 0 1 θ < 0
where x i and x j are the disaster area in time i and j, n is the number of samples (Ye et al., 2013; Du et al., 2015) [47,52]. If S will be positive or negative, there is an increasing or declining trend. The significance of the trend Z M K is calculated as follows:
Z M K = { S 1 V a r ( S ) S > 0 0 S = 0 S + 1 V a r ( S ) S < 0
When the MK test is used to step change points in the disaster area data xi = (x1, x2, x3, …, xn), the sequential MK test can be defined via the following formula:
S K = i = 1 k n i ( 2 k n )
Mean and variance of the normally distributed statistic Sk are estimated as follows:
E ( s k ) = k ( k + 1 ) / 4
V a r ( s k ) = k ( k 1 ) ( 2 k + 5 ) / 72
The normalized variable statistic UFk is expressed as follows:
U F k = ( s k E ( s k ) ) / V a r ( s k ) ( k = 2 , 3 , n )
{ U B k = U F K K = n + 1 k ( k = 1 , 2 , n )
where UFk is the forward sequence, and the backward sequence UBk is calculated using the same equation but with a reversed series of disaster area (Ye et al., 2013) [52]. The significance level was chosen at 0.01 in the MK test. When an intersection point of UFk and UBk is located within the confidence interval, this trend indicates the beginning of a step change point at a significance level of 0.01 (Ye et al., 2013) [52].

2.3.3. Spatial Distribution Characteristics of Natural Disasters

(1). Social Network Analysis (SNA)

Dynamic social networks, a key concept in modern social science research, are beginning to play a major role in understanding the ways in which provinces respond to natural disasters (Varda et al., 2009) [53]. The methodological approach commonly used to explore social network theory is social network analysis (SNA). SNA is the study of the structural relationships among interacting network members—natural disasters and provinces—and of how those relationships produce varying effects (Varda et al., 2009) [53]. Christina et al. (2009) [54].discussed a case study from the Peak District National and helped us identify which individuals and categories of stakeholder played more central roles in the network and which were more peripheral.
To better understand the differences in intensities of disasters in different provinces, two network analyses were chosen for this purpose: density and centralization (Christina et al., 2009) [54]. Network density analysis provides a mathematical approach to measure the number, the paths, and the strength of those connections of natural disasters and provinces (Varda et al., 2009) [53]. Density is the proportion of possible ties in a network that are actually present, and a network’s density is commonly used to measure the extent to which all actors in a network are tied to one another (Christina et al., 2009; Varda et al., 2009) [53,54]. Centrality would help us locate which natural disaster types generated more ties in the network. These decisions can be achieved with the aid of UCINET 6.0 and Netdraw 6.0 softwares (Borgatti et al., University of Kentucky, Kentucky).

(2). Spatial Trend Analysis of Natural Disasters

It is important to analyze the spatial trends of natural disasters in studies of natural disasters (Gu et al., 2016) [43]. Trend analysis is a method of providing a 3D perspective of data in ArcGIS 10.2 geostatistical analysis. This can show the trends of natural disasters. The height of the pole in the z-dimension represents disaster coverage areas of the province, and the z-value is projected as a scatter plot in the x-z plane and the y-z plane. According to the scatter plot in the projection plane, a second-order polynomial fitting was adopted. The spatial trend surface reveals the change in the disaster area and is suitable for large-scale research.

(3). Spatial Patterns of Natural Disasters

The spatial distributions of natural disasters are uneven, so, it is important to quantify the spatial changes in disasters. Previous studies have shown that exploratory spatial data analysis (ESDA) may improve our understanding of spatio-temporal dynamics (Du et al., 2015; Gu et al., 2016) [43,47]. ESDA can be used for describing the distribution pattern of matter or phenomenon and visualizing research of relative difference between distribution mode and space of regional attribute values. ESDA includes the Global Moran’s I index and the Local Moran’s I index (LISA). Moran’s I and Getis-Ord Gi* are employed to evaluate the spatial patterns of disasters (Wang et al., 2010) [50].
The Global Moran’s I index is based on ArcGIS 10.2. First, the correlation characteristics of the spatial distributions of different disasters in the provinces are analyzed. An optimized Getis-Ord Gi* function module is then introduced to analyze the distributions of the cold and hot spots in different provinces (Du et al., 2015) [47]. The Global Moran’s I index can be expressed as
I = i = 1 n j = 1 n w i j ( x i x ¯ ) ( x j x ¯ ) s 2 i = 1 n j = 1 n w i j
s 2 = 1 n i = 1 n ( x x ¯ ) 2
x ¯ = 1 n i = 1 n x i
where X ¯ represents the mean value of xi with a sample number of n, xi, and xj are the observations for area i and j, S2 is the variance of xi, and Wij is a distance weight between area xi and xj. The weight Wij can be determined using a distance band as follows: samples within a distance band are given the same weight, whereas those outside the distance band are given a weight of 0. The values of the Global Moran’s I range from −1 to 1. For instance, where 1 represents a perfect positive spatial auto-correlation (high values or low values cluster together) and −1 indicates a perfect negative spatial auto-correlation (a checkerboard pattern). A value of 0 indicates perfect spatial randomness of environmental variables (Zhang et al., 2008) [55].
The local spatial correlation index Getis-Ord Gi* explored the distributions of the cold and hot spots of disaster-affected areas of different natural disasters. Additionally, the characteristics and patterns of spatial polarization were investigated and can be expressed as
G i * ( d ) = j = 1 n w i j ( d ) x j / j = 1 n x j
Z ( G i * ) = ( G i * E ( G i * ) ) V a r ( G i * )
where wij represents the spatial weight matrix between area i and j; Z ( G i * ) is the normalized value of Gi* (d), E ( G i * ) and V a r ( G i * ) are, respectively, the mathematical expectation and coefficient of variation. Gi*. Z (Gi*) is the representation space where a positive value tends toward concentrated areas of hot spots and a negative value tends toward concentrated areas of cold spots (Du et al., 2015) [47].

2.3.4. The Evaluation Model of Grain Losses

At the end of the 20th century, based on the grain yield dataset, Chinese scholars constructed a statistical model for estimating the amount of grain loss (Zhang et al., 2004; He et al., 2013; Meng et al., 2016) [30,35,41]. However, a number of studies in China have explicitly explored the amount of grain loss using the specific density method (SDM) in recent years (He et al., 2013; Meng et al., 2016) [30,35]. Li et al. (2010) [44] reported that the spatio-temporal variation of the agro-drought impact food security by the SDM model in China. Gu et al. (2016) [43] investigated grain losses from flood/drought hazards by the SDM model over China in 1961–2010. Therefore, this section used the SDM model to estimate the amount of grain loss. The SDM model can be expressed as follows:
s c = i = 1 n s c i = i = 1 n ( R i × A i 1 × y i × P 1 + R i × A i 2 × y i × P 2 + R i × A i 3 × y i × P 3 )
where Sc is the amount of grain loss; n is the number of provinces/municipalities; Sci is the grain disaster loss in province i; Ri is the ratio of the grain crop area to the crop-sown area; Ai1, Ai2, and Ai3 are the values of crop areas affected by mild, moderate and severe disasters, respectively (mild: grain losses due to natural disasters between 10 and 30%; moderate disaster: grain losses of 30–70%; severe disaster: grain losses greater than 70%); yi is grain yield per ha in the same year. The values of P1, P2, and P3 are 20, 50, and 85%, respectively, using the median method and according to the existing definitions of the crop-affected area and crop failure area (Li et al., 2010) [44]. The ratio of grain losses to total grain output in the same year was defined as the rate of grain losses.

3. Results

3.1. Temporal Change Characteristics of Natural Disasters

3.1.1. Variations in Total Natural Disasters

To clarify the temporal characteristics of the disasters during 1978–2014 in China, heatmaps of three different degrees of disaster area were generated by Origin software (Figure 2a–c). The results indicate the following: (1) the area covered by natural disasters exhibited a declining trend in 1978–1984 and 1992–2014 (Figure 2a). From 1985 to 1991, natural disaster-covered area fluctuated upward and in 1991 reached its maximum value (1.79 × 10⁶ ha). In 1991, China experienced a major flood, the worst of the century. In addition, some extreme disaster events (e.g., floods and droughts) occurred in China in 1980, 2003, 2007, and 2013 (Guan et al., 2015; Zhang et al., 2014) [46,56]. (2) The area affected by natural disasters decreased from 1978 to 1984, but it exhibited an increasing trend from 1985 to 2000, and the average areas affected by natural disasters was the largest (1.11 × 10⁶ ha) in 2000. In addition, the curve exhibited a downward trend in volatility from 2001 to 2014. (3) From 1978 to 2000, the average crop failure area exhibited an upward trend and reached a maximum in 2000 (2.86 × 10⁵ ha). From 2001 to 2014, the average crop failure areas showed a decreasing trend. However, it was relatively large in 2003 (2.76 × 10⁵ ha), and this reflected a huge negative effect on grain production in China. (4) Before 2003, the crops areas in Henan and Shandong were seriously affected by natural disasters and then began to weaken significantly. (5) After 2004, the crop area affected by natural disasters in Heilongjiang and Inner Mongolia increased significantly, which has a certain relationship with the increase of crop-sown area (Zhang et al., 2014) [56]. From what has been analyzed above, we can come to a conclusion that there is no uniform a temporal change trend in disaster areas of different degrees at the annual scale, and it is difficult to accurately reflect the natural disaster intensity changes in China. Therefore, it will be a major challenge for China’s agricultural sector to overcome the discrete and highly uncertain risks of natural disaster occurrences.
This section introduced the Q index and developed a heat map graph of the intensity of disasters to study the associated trend characteristics. Figure 3 shows the following results: (1) From 1978 to 2000, China’s disaster intensity index increased, reaching its peak in 2000. China’s average disaster intensity index exhibited a significant upward trend in 1978, 1984, and 1986 because a succession of extreme events (e.g., droughts, floods, and hail events) occurred in these years. (2) With the improvement of China’s science and technology, China’s disaster intensity index shifted downward significantly during 2001–2014. (3) A series of extreme floods, droughts, and low-temperature events occurred frequently in 2003, 2006, and 2008.

3.1.2. The MK Text for Natural Disasters

To clarify the temporal changes of different disaster types from 1978 to 2014, we used the MK text to eliminate the effect of serial correlation, determined the trends of different natural disasters and their significance. We also detected any step change points of different disasters by MK test in this section. For illustrative purposes, their corresponding MK sequential test in 1978–2014 are shown in Figure 4a,c,e,g,i, and Figure 4b,d,f,h,j, respectively.

Analysis of Flood Disaster Characteristics

The MK test was applied to analyze the trend and step changes of the annual flood intensity index series. Figure 4a shows that the flood intensity index experienced a significant increasing trend at the annual scale in China from 1978 to 2014. For the annual flood intensity index series (Figure 4b), the step change points occurred between 1983 and 1984 and the UF and UB curves exceeded the critical value of ±2.58, indicating that step changes in the annual flood were significant. The previous studies indicated that extreme flood events might be expected to occur more frequently in the future under the background of the continuously global warming (Guan et al., 2015; Zhang et al., 2014) [46,57]. Therefore, flood prevention efforts should be strengthened in China in the future.

Analysis of Drought Disaster Characteristics

The MK test was applied to analyze the trend and step changes of the annual drought intensity index series. This figure presents some noticeable changes in droughts. Figure 4c,d show huge fluctuations of more than 15% from 1995 to 2014. As shown in Figure 4d, the two-step change points occurred during 1985–1990 (significant at the 0.01 level), suggesting that the step changes in droughts were also significant in China. It was found that the drought intensity index showed a significant increasing tendency in 2002–2003. This finding concurred with Zhang et al. (2014) [23] who demonstrated that a significant increasing tendency has been observed in two decades. These trends reflected the high uncertainty and high risks of droughts in China during the study period.

Analysis of Hail Disaster Characteristics

The same analysis was conducted to analyze the annual hail disaster series by MK test, and it is shown in Figure 4e. Figure 4f also exhibits that the hail intensity index showed a noticeable upward trend since 1994, which is significant during the period 1995–2014 as the values of UF are above the critical limit. The two-step change points of annual hail occurred between 1985 and 1990 at the >99% confidence level as the intersection point of the two curves located within the confidence interval. Zhang et al. (2014, 2014) [23,57] indicated that hail was a disaster that occurred frequently in China, and frequency increased largely in the later decade. The hail intensity index reached a maximum in 2014 (Figure 4f), and the high uncertainty of hail in China is one of the main issues limiting current hail prevention.

Analysis of Low-Temperature Disaster Characteristics

Figure 4g,h show the MK test of annual low-temperature disaster from 1978 to 2014 in China. As the results in Figure 4g indicate, low-temperature disasters showed huge fluctuations of almost 15% from 1978 to 2014, and presented an increasing trend at the end of 2002, as the values of UF are above the critical limit. It is worth mentioning that the step change points of low-temperature events occurred during 1991–1992, also exceeding the significance level of ±2.58 (Figure 4g,h). The UF curve of low-temperature intensity index indicates a decreasing trend of low- temperature from 2002 to 2014. Therefore, climate instability led to an increase in low-temperature events, which makes it a noteworthy disaster (Guan et al., 2015; Zhang et al., 2014) [23,46].

Analysis of Typhoon Disaster Characteristics

As shown in Figure 4i, Typhoon events present long-term increase but not significant trends during 2001–2014, as the values of UF are below the critical limit. Figure 4j exhibits that no obvious trend in typhoon activity was detected in China, with UF fluctuating between the two critical value lines. Many significant step change points occurred between 2001 and 2014 at the 1% level of significance in the annual time series, and the UF and UB curves exceed the critical value of ±2.58. Thus, the variation in annual typhoon activity is small during the period, and no obvious trend in the typhoon activity was detected in China.

3.2. Spatial Characteristics of Natural Disasters

3.2.1. The Network Relationship of Disasters and Provinces

Zhang et al. (2014) [23] have pointed out that different disaster types had unique spatial distributions. The network density of disasters in the provinces was analyzed in UCINET 6.0 by reducing the time dimension and summing natural disaster coverage area from 1978 to 2014 (Figure 5). The results indicated that the total network density of the disaster coverage area in the provinces was 25,680.81 from 1978 to 2014, and the average network density was 15,266.79 in different disaster types-provinces. The network density orders of different types of disaster-provinces were droughts (41385.33) > floods (19682.6797) > average (15266.79) > wind hail (8302.61) > low-temperature events (5643.07) > typhoon activity (1320.24). The above results indicate that China was mainly affected by droughts and floods, followed by hail, low-temperature events, and typhoon activity. This further confirms the fact that droughts and floods were the most widely distributed disasters in China (Du et al., 2015; Guan et al., 2015; Zhang et al., 2014) [46,47,56].
The network structures analysis of the disaster provinces in this section was assisted by Netdraw software (Figure 5). According to the degree of network connection (the thicker the tie is, the greater the crop area covered by natural disasters), the disasters could be divided into four levels: mildly affected, moderately affected, severely affected, and extremely affected. Furthermore, the size of the blue squares in Figure 5 indicates the degree centrality of different types of disasters. Moreover, the greater the size of the blue square, the greater the impact of this disaster. The disaster intensity of each province from 1978 to 2014 exhibited a clear hierarchical distribution. The numbers of mildly affected provinces, moderately affected provinces, severely affected provinces, and extremely affected provinces were 8, 4, 9, and 10, respectively. The provinces seriously affected by natural disasters were mostly located in major grain-producing areas, namely Hebei, Heilongjiang, Anhui, Shandong, and the north along the line of Qinling-Huaihe, namely Inner Mongolia, Shaanxi, and Gansu. This finding confirmed that of Zhang et al. (2014) [57]. The regions weakly affected by natural disasters were mainly distributed in rural regions or regions with considerable economic development (Beijing, Shanghai and other economically developed districts, as well as Tibet, Xinjiang and other economically underdeveloped areas). There is a strong relationship between this spatial distribution pattern of natural disasters and the uneven distribution of planting area or some climate variables in China (Gu et al., 2016; Ju et al., 1997; Zhang et al., 2014) [33,43,57]. The spatial pattern of disasters is a result of historically uneven economic development in China (Liu et al., 2012) [42]. Many previous studies have suggested a strong relationship between the spatial distribution of different types of disasters and the local climatic conditions in China (Guan et al., 2015; Zhang, 2004; Zhang et al., 2014) [41,46,57]. At present, we have some difficulties in obtaining long-term and complete climate data (monthly rainfall, temperature, and humidity, etc.). Finally, the distributions of the disaster types and their influences were evaluated by analyzing the disaster-provincial network density relationships in the seven physical geographical regionalizations in China.
North China: Figure 6a shows that the connection between the summed disasters and Hebei province was the largest. Thus, the total area covered by natural disasters in Hebei province was the largest, mainly due to droughts, floods, and hail, followed by Inner Mongolia and Shanxi province, mainly due to droughts and large low-temperature effects (winter cold snaps). Compared to other provinces, Tianjin and Beijing have enjoyed a smaller natural disasters area because of their smaller crop planting area. With the expansion of urban development, the crop planting area of the suburbs has been continuously reduced, which may bring about some interference in the results of this study. The uncertainty introduced by urban expansion is not taken into account in this section. Droughts, floods, hail, and low-temperature events often cause serious grain production losses in North China, except for Beijing and Tianjin. Typhoon disaster only occurred across Hebei and Tianjin. This is coincident with the finding of Du et al. (2015) [47].
Northeast China: In Figure 6b, it can be seen that the disaster coverage area in Heilongjiang province was the largest (1.19 × 10⁹ ha), followed by the Jilin province (9.45 × 10⁸ ha). The least affected area was Liaoning (5.36 × 10⁸ ha). Several previous studies have stated that droughts represent the most serious type of disaster in Northeast China (Du et al., 2015; Guo et al., 2016; Zhang et al., 2014) [25,47,57]. Droughts displayed the highest impacts, followed by floods, hail, and low-temperature events, with typhoon activity having the smallest effect. This finding confirmed that of Guo et al. (2016) [25].
East China: The disaster coverage area in East China showed different characteristic among the provinces. Figure 6c shows that the provinces most affected by natural disasters were Shandong, Anhui, and Jiangsu, which were mainly affected by droughts, floods, and hail. These high correlations were followed by Jiangxi, Fujian, and Zhejiang, and Shanghai was the least affected. Shandong, Anhui, and Jiangsu were mainly affected by floods and droughts. Moreover, Jiangxi was mainly affected by a flood, whereas Fujian and Zhejiang were affected by typhoon activity. Shanghai was affected by various disasters, but extreme flood events were the principal disaster events and the effects of the other disasters were not significant.
Central China: Zhang et al. (2014) [57] pointed out that flood events generally occurred in Central and East China. The highest total disaster coverage area was in Henan, followed by Hubei and Hunan provinces (Figure 6d). Droughst, flood, sand hail were the major disasters in Henan from 1978 to 2014, whereas droughts, floods, and low-temperature events were the main disasters in Hubei and Hunan (Liu et al., 2012) [42]. Surprisingly, Hunan was also affected by typhoon activity more than other provinces in Central China were.
South China: The sum of the disaster coverage area in Guangdong and Guangxi was obviously different compared to that in Hainan, and the total disaster coverage area in Hainan was relatively small. Floods, droughts, and hail were the most common disasters in Guangdong and Guangxi provinces. Meanwhile, low-temperature events, hail, and typhoon activity were the most common disasters in Hainan (Figure 6e).
Southwest China: Sichuan was the major disaster area in Southwest China, and Yunnan, Guizhou, Tibet, and Chongqing were the areas with the fewest disasters (Figure 6f). The distributions of different disaster types in the Southwest China showed significant differences (Zhang et al., 2014) [57]. Therefore, it is necessary to implement protection measures based on the distribution characteristics of different disaster types in different provinces. Droughts mainly occurred in Yunnan, Guizhou, Sichuan, and Chongqing. Typhoon activity mainly occurred in Yunnan, Guizhou, and Chongqing. Hail events mainly occurred in Yunnan. droughts and low-temperature events mainly occurred in Tibet. Such results will provide a scientific basis for preventing and mitigating natural disasters.
Northwest China: The impact of natural disasters in Shaanxi and Gansu was the largest, followed by Xinjiang and Ningxia, and that in Qinghai was the weakest. The distribution of different types of disasters in Northwest China possesses significant regional disparities (Liu et al., 2012) [42]. Shaanxi province was mainly affected by droughts and floods. Xinjiang and Ningxia provinces were mainly affected by droughts. Qinghai and Ningxia were mainly affected by hail. Typhoon disasters had little effect on Northwest China (Figure 6g). This finding confirms that of Du et al. (2015) [47].

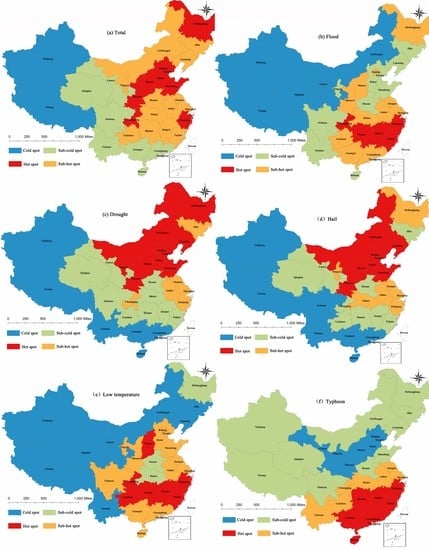
3.2.2. Spatial Distribution of Natural Disasters in China

(1) The characteristics of the disaster coverage area
To assess the spatial distributions of the cumulative disaster coverage areas in China by province from 1978 to 2014, a stack chart of the total disaster areas of the 31 provinces and municipalities was created (Figure 7). These charts were constructed in ArcGIS 10.2 to visualize the spatial distribution of the area covered by different disasters at a provincial level. The results indicated the following: (1) The distribution of the disaster coverage area in China was “dense in central, East, and North and sparse in West and South China”. Meanwhile, the distribution of disasters diversified from north to south and west to east, suggesting that a variety of disasters occurred in parallel in Southeast China. (2) Hebei, Shandong, Henan and Heilongjiang provinces showed the highest cumulative numbers of coverage areas, all of which were mainly affected by droughts, followed by floods and hail. In contrast, extreme low-temperature and typhoon events were negligible. (3) Beijing, Tianjin, Chongqing, Tibet, Qinghai, Ningxia, and Shanghai showed fewer stacked columns than did other provinces, indicating that the total disaster coverage areas were relatively small. However, it is significant that the distribution of disasters showed regional distribution characteristics (Liu et al., 2012; Du et al., 2015; Zhang et al., 2014) [23,42,47]. The main disaster coverage areas in Beijing and Tianjin were caused by droughts, floods, and hail. Chongqing, Tibet, Qinghai, and Ningxia were mainly affected by droughts, floods, low-temperature events, and hail, and Shanghai was mainly affected by flood extreme events; the above conclusions confirm that the north was mainly threatened by droughts, and the south was threatened by floods and other disasters in all time periods (Liu et al., 2012; Du et al., 2015) [42,47].
(2) The spatial trend of disasters in China
Using the global trend surface analysis in ArcGIS 10.2 and taking the directions of east and north as the x- and y-axes, respectively, with the area covered by different disaster types as the z-axis, this research created a three-dimensional perspective of disasters to better represent China’s provincial trends and the spatial characteristics of different disaster types (Figure 8). The results indicate the following: (1) The total area covered by natural disasters showed gradually increasing trends from west to east and from south to north in China (Figure 8a), indicating that the spatial trend of natural disasters varied with region. (2) Flood disasters showed an increasing trend from west to east and from north to south in China (Figure 8b), suggesting that floods generally occurred in South and East China. This is consistent with that of Zhang et al. (2014) [57]. (3) The spatial distribution of droughts exhibited a declining trend from east to west and from north to south, and droughts were mainly distributed in north, Central China (Figure 8c). (4) The spatial trend of hail in China showed an increased trend from south to north. The hail zone consists of Southwest, Northwest, and Northeast China (Figure 8d), which is the widest and longest hail zone (Guan et al., 2015) [46]. (5) Low-temperature events occurred principally in Northeast, Northwest China, and some regions in South China (Figure 8e). (6) The spatial distribution of typhoon activity exhibited a decreasing trend from east to west and from south to north in China (Figure 8f). This further demonstrates the fact that the Southeast coast of China was mainly affected by extreme typhoon events (Du et al., 2015) [47].
(3) Global spatial correlation analysis of natural disasters
To investigate the spatial pattern of natural disasters in China, this section analyzes the spatial correlation of different disaster type by calculating the Global Moran’s I index (Table 2). The Global Moran’s I index of natural disasters was −0.068137, and it did not pass the 10% significant test, which indicated that the natural disasters were randomly distributed. Meanwhile, the values of Moran’s I for floods and typhoon activity were 0.101204 and 0.225771, and these values passed 10% and 5% significant tests, respectively. It means the spatial distribution of typhoon and floods disasters is a significant agglomeration. Furthermore, the Global Moran’s I values for droughts, hail and low-temperature disasters were −0.028817 (p > 0.1), −0.141690 (p > 0.1), and 0.018095 (p > 0.1), respectively, and their absolute values were close to 0, which indicated significant random patterns. The above results indicate that the spatial pattern of disasters also changed along with the disaster type across different geographical areas.
(4) Hotspot analysis of the spatial distribution
Based on spatial hot spot analysis tools in ArcGIS 10.2, the clustering patterns of each disaster type in China were divided into a cold area, sub-cold area, sub-thermal area and a hot spot area (Figure 8). The spatial distribution of natural disasters hot spots in China exhibited certain zonal characteristics. Hot spots indicate high-value clusters of crop areas affected by natural disasters over the past four decades. Cold spots indicate low-value clusters of crop area affected by natural disasters. The cold and sub-cold spots were mainly distributed on the Northwest in China, except for those associated with droughts and hail. The hot and sub-hot spots were observed in Southeast China. For the 31 provinces/municipalities, the ratio of cold spots, sub-cold spots, sub-hot spots and hot spots of total disasters, floods, droughts, hail, low-temperature events, and typhoon activity were 2:7:13:9, 5:10:11:5, 6:9:6:10, 7:9:7:8, 9:9:7:6, and 7:10:7:7, respectively. Additionally, the distributions of hot and cold spots gradually balanced out. The hot spots of totals disasters were mainly distributed in North China, Shandong, Heilongjiang, Shaanxi, Chongqing, and other provinces. The sub-hot spots were located in Central China, parts of East China, Inner Mongolia, Jiangxi, and Jilin. The sub-cold spots were mainly distributed in the Southwest and South China, Gansu, Qinghai, and other provinces, and the cold spots were mainly distributed in Xinjiang and the Tibet Autonomous Region. The typhoon hot spots were concentrated in some areas of East China and South China. The sub-spots were concentrated in the southwest and some parts of East China. The cold spots were concentrated in inland areas (Du et al., 2015; Shi et al., 2014; Zhang et al., 2014) [23,47,48]. See Figure 9.

3.3. The Spatial Distribution of Grain Losses

To analyze the spatial distribution of grain losses in China by province from 1978 to 2014, the annual average grain loss amount and rate due to natural disasters were calculated by the grain loss model (Equation (16), Figure 10a,b). Figure 10 shows the following: (1) The grain loss amount and rate in China exhibited a fluctuating upward trend from 1978 to 2000. In 2000, the annual average grain loss amount and the rate in China reached a maximum (3.26 million tons, 24.79%, respectively). (2) The average grain loss in China between 2001 and 2014 exhibited a declining trend (1.58 million tons, 10.03%, respectively, in 2014). The spatial distribution maps of annual grain losses were obtained based on ArcGIS 10.2 in this section (Figure 11). As the peak of grain losses in China occurred in 2000, therefore, the average grain loss amount and rate in China from 1978 to 1999, from 2000 to 2014, and from 1978 to 2014 were calculated, respectively. The average grain loss amount and rate in 1978–1999 and 2000–2014 at a provincial level exhibited an increasing trend, except for those in Beijing, Jiangsu, Shandong, Tianjin, Hebei, Henan, and Sichuan (Figure 11a,b,d,e). Figure 11c shows that there were four provinces with a rate greater than 1 × 10⁸ t year−1 in grain loss amount, namely Heilongjiang, Inner Mongolia, Chongqing, and Yunnan province. In addition, by comparing and analyzing the values in Figure 11a–c, the regional gravity center of grain losses moved from south to north in China and was closely related to the northward shift in the grain production center of China (Du et al., 2015) [47]. It can be seen that the provinces with the most significant increases in the rate and amount of grain losses were concentrated in West and North China, namely Inner Mongolia, Ningxia, Xinjiang, and Heilongjiang (Figure 11c,f). Therefore, those provinces should be the focus of China’s grain production protection efforts. There were significant differences in grain losses among different regions in China. The annual average grain loss amount and rate in the central, North, Northwest and northeastern regions in China were significantly larger than those in the Beijing–Tianjin, the Yangtze River Delta, the Pearl River Delta, and Southwest China regions (Figure 11c,f). There were significant differences in grain losses between different provinces in China. From 1978 to 1999, the grain losses in Shandong province were the most serious in China (Figure 11a,d). Then, the grain losses in northeastern China were the most serious in China from 2000 to 2014. The average annual grain loss amount in Heilongjiang province (6.5897 × 10⁶ t) from 2000 to 2014 was larger than the sum of the total grain output from Ningxia (3.7260 × 10⁶ t), Tibet (1.0363 × 10⁶ t), and Qinghai (1.0272 × 10⁶ t) in 2014 (Figure 11b). During 1978–2014, there were high grain loss rates in Inner Mongolia, Gansu, Liaoning and Jilin provinces. The above results indicate that the grain losses induced by disasters showed different characteristic among different geographical areas and provinces. In addition, some major grain-producing areas in China, such as Heilongjiang, Hebei, Anhui, and Shandong, were severely affected by natural disasters (Figure 11c). Therefore, the government should invest more money in disaster prevention and mitigation in these main grain-producing areas.

4. Discussion

According to previous studies, the concept of natural disasters risk or intensity is defined and understood in different ways (Liu et al., 2012; Du et al., 2015; He et al., 2016) [30,42,47]. Thus, there were no evaluation criteria for natural disasters risk. An assessment model of natural disaster risk by using the MAWM method was proposed in this study, and risks of different types of natural disaster in relation to grain production at the provincial level in China were then calculated on the basis of the natural disaster database and the crop database of 31 provinces/municipalities during 1978–2014. Unlike the assessments of natural disaster risk based on the disasters area or frequencies models used in previous studies (Liao et al., 2013; Du et al., 2015; Yang et al. 2016) [45,47,49], the MAWM method improved the credibility of the evaluation results by considering the dataset in terms of hectares of all crops covered by, affected by, and destroyed by natural disasters.
The previous studies focused on the long-term changing trends of the natural disaster by linear or nonlinear regression models in China (Li et al., 2010; Liu et al., 2012; Shi et al., 2014; Zhang et al., 2014a; Gu et al., 2016) [23,42,43,44,48] However, it is difficult to detect the step change point of natural disaster. Accordingly, in this study, we used the MK test to detect any step change points of five major natural disasters from 1978 to 2014 in Mainland China (Figure 3). Compared to the linear or nonlinear regression models, the MK test can describe the time series characteristics of natural disasters more accurately.
In recent decades, some scholars have focused on the spatial and temporal characteristics of a specific region, such as the Yangtze River, Songliao Plain, the Yellow River, Poyang Lake, Liaoning province, and Jilin province. Although previous studies have focused on only droughts and floods, our evaluation of seven geographical regions revealed spatial diversity for five different types of natural disasters (Figure 5). Recently, Yang et al. (2016) [49] analyzed the spatio-temporal patterns of a floods in Southwest China and found that rainfall-caused rice flood disaster was more severe in the early mature stage, followed by the jointing-booting and transplanting-tillering stages. Zhang (2004) [41] presented a risk analysis and assessment of droughts disaster to agricultural production in the maize-growing area of Songliao Plain of China, indicating that droughts were the most serious disaster. Du et al. (2015) [47] used a linear regression model to evaluate the situation of grain production affected by disasters, indicating that grain production was unstable, and disasters may threaten China’s food security. However, the linear regression model in previous studies did not accurately calculate the amount of grain loss caused by natural disasters. We used the SDM model to calculate the amount and ratio of grain loss caused by different types of disasters at the provincial scale from 1978 to 2014 (see Supplementary Material).
Additionally, it is worth noting that historical Argo-meteorological disaster data are important in exploring the occurrence, development and spatio-temporal distribution of natural disasters (Du et al., 2015; Guan et al., 2015; Zhang, 2004; Yang et al., 2016; Wang et al., 2017; Wang et al., 2018) [41,46,47,49,58,59]. Even though this paper provides the spatio-temporal characteristics of natural disasters over the last four decades, it does not fully reveal all of their characteristics. Due to data availability issues and planting area restrictions in different regions, our findings can only partly reflect the impacts of extreme disaster events on grain production, while interaction mechanisms between natural disasters and climate change require further research and exploration. Future research focuses on the spatio-temporal characteristics of the effects of different disaster types on different grain types under the background of different climates zones and different crop growth conditions.

5. Conclusions

Natural disaster information is often incomplete or imprecise, and the existing methods are limited. The disaster intensity index based on multi-area weighting was constructed in this paper to better describe the interannual variability characteristics of natural disasters. The results show that the intensity of natural disasters initially increased and then later decreased over the four-decade study period, with a peak at 2000. Meanwhile, significant differences existed between the distributions of different disaster types. The step change points in floods, droughts, hail, and low-temperature events began to occur around 1983, 1988, 1988, and 1992, respectively. No obvious trend in typhoon activity was detected in China, with UF fluctuating between the two critical value lines. Moreover, natural disasters exhibited spatial heterogeneity in China. The most serious disaster type in China was found to be droughts, followed by floods, hail, low-temperature events, and typhoon activity. Natural disasters became diversified from north to south in China, and a variety of natural disasters were observed to occur in parallel in Southeast China. It is distinct that the distribution of disasters showed significant regional distribution characteristics. Floods and typhoon activity were concentrated and greatly limited to Central China, East China and the Southeast coast of China, while other disasters were randomly distributed. In addition, the center of grain losses gradually moved northward from 1978 to 2014. Moreover, some major grain-producing areas, namely Heilongjiang, Shandong, Henan, and Inner Mongolia, were increasingly affected by natural disasters, which threatens the grain security in China in the future.
Based on these results, we suggest that drought prevention and floods prevention and mitigation are considered the highest priority among major disaster types in order to protect China’s future sustainability. It is highly necessary to develop different disaster prevention strategies and mitigation programs based on the latest characteristics of natural disasters across different geographical areas in China in an attempt to ensure food security. Hence, our government should adopt different precautionary measures across different geographical areas: measures against droughts and hail in Northwest China; measures against droughts and waterlogging in Northeast China; measures against floods and low-temperature events in Central China; and measures against floods and typhoon activity in coastal areas of Southeast China.

Supplementary Materials

Author Contributions

J.G. and Y.Z. conceived and designed the experiments; J.G. and Z.L. performed the experiments; J.G. and K.M. analyzed the data; X.L. contributed analysis tools; J.G. wrote the paper; Funding Acquisition, K.M.

Acknowledgments

This work was supported by the National Key R&D Program of China (grant number: 2018YFC1506602 & 2018YFC1506502) and Natural Science Foundation of China for their financial support (grant number: 41571427).

Conflicts of Interest

The authors declare no conflict of interest.

References

  1. Lesk, C.; Rowhani, P.; Ramankutty, N. Influence of extreme weather disasters on global crop production. Nature 2016, 529, 84–87. [Google Scholar] [CrossRef]
  2. Klomp, J.; Hoogezand, B. Natural disasters and agricultural protection: A panel data analysis. World Dev. 2018, 104, 404–417. [Google Scholar] [CrossRef]
  3. Coffman, M.; Noy, I. Hurricane Iniki: Measuring the long-term economic impact of a natural disaster using synthetic control. Environ. Dev. Econ. 2012, 17, 187–205. [Google Scholar] [CrossRef]
  4. Goldenberg, S.B.; Landsea, C.W.; Mestas-Nuñez, A.M.; Gray, W.M. The recent increase in Atlantic hurricane activity: Causes and implications. Science 2001, 293, 474–479. [Google Scholar] [CrossRef] [PubMed]
  5. Craft, K.E.; Mahmood, R.; King, S.A.; Goodrich, G.; Yan, J. Droughts of the twentieth and early twenty-first centuries: Influences on the production of beef and forage in Kentucky, USA. Sci. Total Environ. 2017, 577, 122–135. [Google Scholar] [CrossRef] [PubMed]
  6. Kantamaneni, K.; Phillips, M.; Thomas, T.; Jenkins, R. Assessing coastal vulnerability: Development of a combined physical and economic index. Ocean Coast. Manag. 2018, 158, 164–175. [Google Scholar] [CrossRef]
  7. Belasen, A.R.; Dai, C. When oceans attack: Assessing the impact of hurricanes on localized taxable sales. Ann. Reg. Sci. 2014, 52, 325–342. [Google Scholar] [CrossRef]
  8. Mu, J.E.; Chen, Y. Impacts of large natural disasters on regional income. Nat. Hazards 2016, 83, 1485–1503. [Google Scholar] [CrossRef]
  9. Held, I.M.; Delworth, T.L.; Lu, J.; Findell, K.L.; Knutson, T.R. Simulation of Sahel drought in the 20th and 21st centuries. Proc. Natl. Acad. Sci. USA 2005, 102, 17891–17896. [Google Scholar] [CrossRef]
  10. Delgado, J.M.; Apel, H.; Merz, B. Flood trends and variability in the Mekong River. Hydrol. Earth Syst. Sci. 2010, 14, 407–418. [Google Scholar] [CrossRef]
  11. Philpott, S.M.; Lin, B.B.; Jha, S.; Brines, S.J. A multi-scale assessment of hurricane impacts on agricultural landscapes based on land use and topographic features. Agric. Ecosyst. Environ. 2008, 128, 12–20. [Google Scholar] [CrossRef]
  12. Tubiello, F.; Schmidhuber, J.; Howden, M.; Neofotis, P.G.; Park, S.; Fernandes, E.; THAPA, D. Climate Change Response Strategies for Agriculture: Challenges and Opportunities for the 21st Century; Agriculture and Rural Development Discussion Paper 42; The International Bank for Reconstruction and Development/The World Bank: Washington, DC, USA, 2008. [Google Scholar]
  13. Miraglia, M.; Marvin, H.J.P.; Kleter, G.A.; Battilani, P.; Brera, C.; Coni, E.; Cubadda, F.; Croci, L.; De, S.B.; Dekkers, S.; et al. Climate change and food safety: An emerging issue with special focus on Europe. Food Chem. Toxicol. 2009, 47, 1009–1021. [Google Scholar]
  14. Kim, S.; Shin, Y.; Kim, H.; Pak, H.; Ha, J. Impacts of typhoon and heavy rain disasters on mortality and infectious diarrhea hospitalization in South Korea. Int. J. Environ. Health Res. 2013, 23, 365–376. [Google Scholar] [CrossRef] [PubMed]
  15. Mottaleb, K.A.; Mohanty, S.; Hoa, T.K.H.; Rejesus, R.M. The effects of natural disasters on farm household income and expenditures: A study on rice farmers in Bangladesh. Agric. Syst. 2013, 121, 43–52. [Google Scholar] [CrossRef]
  16. Marvin, H.J.P.; Kleter, G.A.; Van der Fels-Klerx, H.J.I.; Noordama, M.Y.; Eelco, F.; Willems, D.J.M.; Boxalld, A. Proactive systems for early warning of potential impacts of natural disasters on food safety: Climate-change-induced extreme events as case in point. Food Control 2013, 34, 444–456. [Google Scholar] [CrossRef]
  17. Chau, V.N.; Holland, J.; Cassells, S.; Tuohy, M. Using GIS to map impacts upon agriculture from extreme floods in Vietnam. Appl. Geogr. 2013, 41, 65–74. [Google Scholar] [CrossRef]
  18. Ray, D.K.; Gerber, J.S.; Macdonald, G.K.; West, P.C. Climate variation explains a third of global crop yield variability. Nat. Commun. 2015, 6, 5989–5998. [Google Scholar] [CrossRef] [PubMed]
  19. Keating, B.A.; Meinke, H. Assessing exceptional drought with a cropping systems simulator: A case study for grain production in northeast Australia. Agric. Syst. 1998, 57, 315–332. [Google Scholar] [CrossRef]
  20. Lansigan, F.P.; Delos Santos, W.L.; Coladilla, J.O. Agronomic impacts of climate variability on rice production in the Philippines. Agric. Ecosyst. Environ. 2000, 82, 129–137. [Google Scholar] [CrossRef]
  21. Cheng, X.F.; Sun, H.; Zhang, Y.; Xu, G. Flood disaster risk assessment and spatial distribution characteristics along the Yangtze River in Anhui Province. J. Risk Anal. Crisis Response 2014, 4, 238–242. [Google Scholar] [CrossRef]
  22. Simelton, E. Food self-sufficiency and natural hazards in China. Food Secur. 2011, 3, 35–52. [Google Scholar] [CrossRef]
  23. Zhang, Q.; Zhang, J.; Wang, C.; Cui, L.; Yan, D. Risk early warning of maize drought disaster in Northwestern Liaoning Province, China. Nat. Hazards 2014, 72, 701–710. [Google Scholar] [CrossRef]
  24. Hong, M.; Wang, D.; Zeng, W.H.; Ma, C.; Zhao, L. The variable characteristics and response to climatic factors of the runoff in the downstream areas of the Yellow River under the background of global change. J. Risk Anal. Crisis Resp. 2015, 5, 257–263. [Google Scholar] [CrossRef]
  25. Guo, E.; Zhang, J.; Wang, Y.; Si, H.; Zhang, F. Dynamic risk assessment of waterlogging disaster for maize based on CERES-Maize model in Midwest of Jilin Province, China. Nat. Hazards 2016, 83, 1747–1761. [Google Scholar] [CrossRef]
  26. Lu, H.; Zhang, X.; Liu, S. Risk assessment to China’s agricultural drought disaster in county unit. Nat. Hazards 2012, 61, 785–801. [Google Scholar]
  27. Chen, Z.; Yang, G. Analysis of drought hazards in North China: Distribution and interpretation. Nat. Hazards 2013, 65, 279–294. [Google Scholar] [CrossRef]
  28. Li, K.; Wu, S.; Dai, E.; Xu, Z. Flood loss analysis and quantitative risk assessment in China. Nat. Hazards 2012, 63, 737–760. [Google Scholar] [CrossRef]
  29. Nie, C.; Li, H.; Yang, L.; Wu, S.; Liu, Y.; Liao, Y. Spatial and temporal changes in flooding and the affecting factors in China. Nat. Hazards 2012, 61, 425–439. [Google Scholar] [CrossRef]
  30. He, B.; Wu, J.; Lu, A.; Lei, Z.; Ming, L.; Lin, Z. Quantitative assessment and spatial characteristic analysis of agricultural drought risk in China. Nat. Hazards 2013, 66, 155–166. [Google Scholar] [CrossRef]
  31. Li, K.R.; Yin, S.M.; Sha, W.Y. Characters of time-space of the recent drought in China. Geogr. Res. 1996, 15, 6–15. (In Chinese) [Google Scholar]
  32. Li, M.S.; Li, S.; Li, Y.H. Study on drought in the past 50 years in China. Chin. J. Agrometeorol. 2003, 24, 7–10. (In Chinese) [Google Scholar]
  33. Ju, X.S.; Yang, X.W.; Chen, L.J.; Wang, Y.M. Research on determination of station indices and division of regional flood/drought grades in China. Q. J. R. Meteorol. Soc. 1997, 8, 26–33. [Google Scholar]
  34. Shi, Y.; Shen, Y.; Kang, E.; Li, D.L.; Ding, Y.J.; Zhang, G.W.; Hu, R.J. Recent and future climate change in northwest China. Clim. Chang. 2007, 80, 379–393. [Google Scholar] [CrossRef]
  35. Meng, L.; Wang, C.Y.; Zhang, J.Q. Heat injury risk assessment for single-cropping rice in the middle and lower reaches of the Yangtze River under Climate Change. J. Meteorol. Res. 2016, 30, 426–443. [Google Scholar] [CrossRef]
  36. Sun, H.; Cheng, X.F.; Dai, M.Q. Regional flood disaster resilience evaluation based on analytic network process: A case study of the Chaohu Lake Basin, Anhui Province, China. Nat. Hazards 2016, 82, 39–58. [Google Scholar] [CrossRef]
  37. Huang, J.; Hu, R.; Rozelle, S. China’s agricultural research system and reforms: Challenges and implications for developing countries. Asian J. Agric. Dev. 2004, 1, 98–112. [Google Scholar]
  38. Liu, J.G.; Diamond, J. China’s environment in a globalizing world. Nature 2005, 435, 1179–1186. [Google Scholar] [CrossRef] [PubMed]
  39. Kellenberg, D.K.; Mobarak, A.M. Does rising income increase or decrease damage risk from natural disasters? J. Urban Econ. 2008, 63, 788–802. [Google Scholar] [CrossRef]
  40. Waddington, S.R.; Li, X.; Dixon, J.; Hyman, G.; Vicente, M.C.D. Getting the focus right: Production constraints for six major food crops in Asian and African farming systems. Food Secur. 2010, 2, 27–48. [Google Scholar] [CrossRef]
  41. Zhang, J.Q. Risk assessment of drought disaster in the maize-growing region of Songliao Plain, China. Agric. Ecosyst. Environ. 2004, 102, 133–153. [Google Scholar] [CrossRef]
  42. Liu, Y.; Yu, Y.; Li, L. Major natural disasters and their spatio-temporal variation in the history of China. J. Geogr. Sci. 2012, 22, 963–976. (In Chinese) [Google Scholar]
  43. Gu, X.; Zhang, Q.; Zhang, S. Spatio-temporal properties of flood/drought hazards and possible causes and impacts in 1961–2010. Sci. Geogr. Sin. 2016, 36, 439–447. (In Chinese) [Google Scholar]
  44. Li, W.J.; Qin, Z.H.; Lin, L. Quantitative analysis of the agro-drought impact on food security in China. J. Nat. Disasters 2010, 19, 111–118. (In Chinese) [Google Scholar]
  45. Liao, Y.F.; Zhao, F.; Wang, Z.Q.; Li, B.; Lv, X.F. Spatial pattern analysis of natural disasters in China from 2000 to 2011. J. Catastrophol. 2013, 28, 55–60. [Google Scholar]
  46. Guan, Y.; Zheng, F.; Zhang, P.; Qin, C. Spatial and temporal changes of meteorological disasters in China during 1950–2013. Nat. Hazards 2015, 75, 2607–2623. [Google Scholar] [CrossRef]
  47. Du, X.; Jin, X.; Yang, X.; Yang, X.H.; Xiang, X.M.; Zhou, Y.K. Spatial-temporal pattern changes of main agriculture natural disasters in China during 1990–2011. J. Geogr. Sci. 2015, 25, 387–398. [Google Scholar] [CrossRef]
  48. Shi, W.; Tao, F. Spatio-temporal distributions of climate disasters and the response of wheat yields in China from 1983 to 2008. Nat. Hazards 2014, 74, 569–583. [Google Scholar] [CrossRef]
  49. Yang, J.; Huo, Z.; Wu, L.; Wang, T.; Zhang, G. Indicator-based evaluation of spatio-temporal characteristics of rice flood in Southwest China. Agric. Ecosyst. Environ. 2016, 230, 221–230. [Google Scholar] [CrossRef]
  50. Wang, Z.; Zhang, X.; Su, W.; Siquan, Y.; Sanchao, L. Spatial auto-correlation of three natural disasters in China. Trans. CSAE 2010, 26 (Suppl. 2), 302–306+428. (In Chinese). [Google Scholar]
  51. Wu, H.; Soh, L.; Samal, A.; Chen, X.H. Trend analysis of streamflow drought events in Nebraska. Water Resour. Manag. 2008, 22, 145–164. [Google Scholar] [CrossRef]
  52. Ye, X.; Zhang, Q.; Liu, J.; Li, X.; Xu, C.Y. Distinguishing the relative impacts of climate change and human activities on variation of streamflow in the Poyang Lake catchment. China J. Hydrol. 2013, 494, 83–95. [Google Scholar] [CrossRef]
  53. Varda, D.M.; Forgette, R.; Banks, D.; Contractor, N. Social network methodology in the study of disasters: Issues and insights prompted by post-Katrina research. Popul. Res. Policy Rev. 2009, 28, 11–29. [Google Scholar] [CrossRef]
  54. Christina, P.; Klaus, H.; Mark, R. Stakeholder Analysis and Social Network Analysis in Natural Resource Management. Soc. Nat. Resour. 2009, 22, 501–518. [Google Scholar]
  55. Zhang, C.; Luo, L.; Xu, W.; Ledwith, V. Use of local Moran’s I and GIS to identify pollution hotspots of Pb in urban soils of Galway, Ireland. Sci. Total Environ. 2008, 398, 212–221. [Google Scholar] [CrossRef] [PubMed]
  56. Zhang, Z.; Wang, P.; Chen, Y.; Zhang, S.; Tao, F.; Liu, X. Spatial pattern and decadal change of agro-meteorological disasters in the main wheat production area of China during 1991–2009. J. Geogr. Sci. 2014, 24, 387–396. [Google Scholar] [CrossRef]
  57. Zhang, Z.; Chen, Y.; Wang, P.; Zhang, S.; Liu, X. Spatial and temporal changes of agro-meteorological disasters affecting maize production in China since 1990. Nat. Hazards 2014, 71, 2087–2100. [Google Scholar] [CrossRef]
  58. Wang, J.; Zhang, Z.; Liu, Y. Spatial shifts in grain production increases in China and implications for food security. Land Use Policy 2018, 74, 204–213. [Google Scholar] [CrossRef]
  59. Wang, Z.; Li, J.; Lai, C.; Zeng, Z.; Zhong, R.; Chen, X.; Zhou, X.; Wang, M. Does drought in China show a significant decreasing trend from 1961 to 2009? Sci. Total Environ. 2017, 579, 314–324. [Google Scholar] [CrossRef] [PubMed]
Figure 1. China’s provincial administrative divisions and physical geographical division map.
Sustainability 11 00869 g001
Figure 2. Temporal variation of disasters in China by province/municipality from 1978 to 2014: (a) changes in the crop-covered area of different provinces at different times; (b) changes in the crop-affected area of different provinces at different times; (c) changes in the crop failure area of different provinces at different times. Crop yields are reduced by >10%; >30%, and >70%, for graphs a, b, and c, respectively. The red line in Figure 2a–c show the average crop area affected by disasters in China during that period.
Sustainability 11 00869 g002
Figure 3. Intensity index of the overall disasters in China by province/municipality from 1978 to 2014. The red line in Figure 3 shows the average of the Q index in China during that period.
Sustainability 11 00869 g003
Figure 4. Time series of annual intensity for different disaster types (a,c,e,g,i) and their corresponding MK change point tests (b,d,g,h,j). The red dashed line in the left figures means linear trend for this period, and UF and UB in the right figures represent the statistics of forwarding and backward sequence, respectively.
Sustainability 11 00869 g004
Figure 5. Classification of the intensity of natural disasters in China.
Sustainability 11 00869 g005
Figure 6. Network density structure map of natural disasters-the province in China.
Sustainability 11 00869 g006
Figure 7. The cumulative overall impact of natural disasters, i.e. area covered by natural disasters of total crop area (104 ha), for the period 1978–2014. The bar graphs show the cumulative crop area covered by floods, droughts, hail, low-temperature events, and typhoon activity.
Sustainability 11 00869 g007
Figure 8. Overall trends in the distribution of natural disasters in China. The trend line (green, and blue) shows the trend of total crop area covered by natural disasters in the east-west direction of China and the south-north direction of China, respectively. The colored dots are the projection positions of the crop-covered area value for each province in the north-south and east-west directions.
Sustainability 11 00869 g008
Figure 9. Spatial pattern of natural disasters in China from 1978 to 2014.
Sustainability 11 00869 g009
Figure 10. Heat map of grain loss amount and rate at the provincial scale from 1978 to 2014 in Mainland China: (a) grain loss amount per year at the provincial scale; (b) percentage of grain loss per year at the provincial scale.
Sustainability 11 00869 g010
Figure 11. Spatial-distribution of the grain loss amount and rate in 31 provinces/municipalities in China: (ac) present the annual grain loss amount caused by natural disasters (104 t/year) in different stages; (df) present the ratio (%) in grain loss caused by natural disasters to total grain output in different stages.
Sustainability 11 00869 g011
Table 1. Description of the database in this paper.
DatabaseDatasets NameDatasets Time SpanDatasets Sources
Natural disaster datasetsCrop-covered area a (104 ha)1978–2014Website of the Ministry of Agriculture of China (http://zzys.agri.gov.cn/nongqing.aspx), Chinese Statistical Yearbook, Database of China’s social and economic development (http://tongji.cnki.net/kns55/index.aspx)
Crop-affected area b (104 ha)1978–2014
Crop failure area c (104 ha)1978–2014
Crop datasetsGrain yield (Kg ha−1)1978–2014
Crop sown area (104 ha)1978–2014
grain sown area (104 ha)1978–2014
Map datasets1:4 million provincial vector mapThe 2008 yearThe National basic geographic information system database (http://www.sbsm.gov.cn/article/zszygx/chzs/jcch/jcdlxxxt/)
Note: a stands for “Crop-covered area” denotes the sown area where yields are reduced by more than 10% due to natural disaster; b stands for “Crop-affected area” is where crop yields are reduced by more than 30% due to natural disaster; c stands for “Crop failure area” is where crop yields are reduced by more than 70% due to natural disaster.
Table 2. Global Moran’s I statistics for different types of disasters in China.
TypeMoran’s I RandomizationZ-Scorep-Value (Significance Level)
Total−0.068137−0.4462360.655426
Floods0.1012041.7363400.082504
droughts−0.0288170.0580490.953709
Hail−0.141690−1.4172050.156423
Low-Temperature Events0.0180950.6635680.506967
Typhoon Activity0.2257713.5710410.000356

