Article

Emission Factors of a Euro VI Heavy-duty Diesel Refuse Collection Vehicle

1
European Commission, Joint Research Centre (JRC), Ispra (VA), Italy
2
Amsa S.p.A.—Gruppo A2A, Milano, Italy
*
Author to whom correspondence should be addressed.
Sustainability 2019, 11(4), 1067; https://0-doi-org.brum.beds.ac.uk/10.3390/su11041067
Submission received: 20 January 2019 / Revised: 16 February 2019 / Accepted: 18 February 2019 / Published: 18 February 2019

Abstract

:
Modern (Euro VI) heavy-duty vehicles have significantly lower pollutant emissions than older vehicles. However, there are still concerns regarding the emissions of refuse collection vehicles in cities, because in some cases they may use engines designed for long haulage trucks. For this reason, we tested a diesel Euro VI (step C) refuse collection heavy-duty vehicle, both in the laboratory on a chassis dynamometer and on the road, similar to the regulated in-service conformity cycle, but also with actual refuse collection cycles. Particle number (PN) and gaseous pollutants (NOx, CO, HC) were measured using a Portable Emissions Measurement System (PEMS). Additionally, in the laboratory we used laboratory grade gaseous, particle number, and FTIR (Fourier-transform infrared spectroscopy) systems to assess the PEMS. For short periods, where the exhaust gas temperature was low for the aftertreatment devices (cold start, some city conditions), the NOx emissions reached 2000 mg/km. Nevertheless, all pollutants were well below the applicable emissions limits expressed in mg/kWh for all cycles examined (in brackets the ratio to the laboratory limit): NOx < 400 mg/kWh (0.87), CO < 850 mg/kWh (0.21), HC < 12 mg/kWh (0.08), PN < 2.4 × 10¹⁰ p/kWh (0.04). To make sure that this will always be the case, future heavy-duty type approval emissions regulations should specifically consider the urban conditions for municipality vehicles, such as refuse trucks.

1. Introduction

Road traffic contributes around 11% to the particulate matter (PM), 28% to black carbon, and 39% to NOx concentrations in Europe [1]. Particularly heavy-duty vehicles, which represent < 5% of the vehicle population in some major cities, contribute 40–60% of their road-traffic PM and NOx emissions [2]. In 2016, around 12% of all the reporting stations in Europe recorded concentrations above the NO2 limit values; 88% of all concentrations above this limit value were observed at traffic stations [1].
The pollution from engines and vehicles is controlled by type approval tests where emission standards have to be fulfilled (for example, in the European Union (EU), the “Euro” standards). Regarding heavy-duty vehicles, the type approval of an engine is conducted in a dynamometer following a prescribed test cycle where the engine revolutions and torque are varied. This engine then can be used for various applications for instance in a truck (category N3) or a bus (category M3). Euro VI legislation [3] includes a Portable Emissions Measurement System (PEMS) based test at type approval, followed by the in-service conformity (ISC) testing, which is devised as a measure to verify that the emissions of the engine are below the regulated limits throughout the engine’s useful life. The PEMS test is carried out under normal driving conditions (i.e., on-road) and the trips performed have to comply with several practical boundaries (e.g., different shares of operation and route composition, amount of work performed by the engine, etc.). For N3 vehicles (trucks) the cycle consists of 20% urban (speed ≤ 50 km/h), 25% rural (speed between 50 and 75 km/h) and 55% motorway (speed > 75 km/h) phases in this order, while for M3 buses the shares are 70% urban and 30% rural.
Under Euro VI step C regulatory requirements [3], only emission windows of mean power > 20% of the maximum engine power are evaluated. An amendment to this regulation [4], called step D, which entered into force from September 2018 for new types (September 2019 for all new vehicles), reduced the threshold to 10% and changed the N3 time shares to 25% (urban), 30% (rural), and 45% (motorway) [5]. Another amendment (step E) in the future is planned to include particle number testing and cold start in the evaluation. Thus, for the same trip and vehicle, the final emissions results can be different depending on the regulatory step and the evaluation method [6].
Refuse collection vehicles are at one extreme of the operating condition range for heavy duty engines. Refuse trucks have unique operating characteristics because they have to start and stop frequently between disposal bins. This results in numerous accelerations, decelerations, and idling for short intervals. The refuse trucks also have to travel on the highway (motorway) to and from the fleet facilities, the service area, and the dump site, which involves high speed cruising. For the ISC test, Euro VI engines of refuse collection vehicles are assessed over a trip that is meant for long haulage trucks (N3). This is because refuse collection vehicles are produced as regular trucks on which the special bodywork and auxiliaries are added later, often by a different manufacturer. This mismatch between regulation and real operation resulted in high emissions of this category of vehicles for older [7,8,9,10,11,12] but even recent technology vehicles [8,12,13,14]. This raised concerns about their sustainability for city applications.
At the moment, during PEMS on-road testing for type-approval and ISC testing, only NOx, CO, and total hydrocarbons (HC) are measured. Particle number (PN) will be introduced with step E. The measurement uncertainty of PEMS has been assessed in the United States of America (USA) [15] and recently in Europe for light duty vehicles [16]. Uncertainty estimations that range from 10 mg/kWh up to 600 mg/kWh were reported (approximately 20–60% of the emission levels) [15,16,17,18].
The main objective of this study is to measure the emissions of a heavy-duty refuse collection vehicle under real operation conditions and compare them with the ISC-like tests for this vehicle category. In order to assess the uncertainty of the measurements, the PEMS was compared with laboratory grade analyzes on a chassis dynamometer. Additionally, the same on-road cycles were retested in the laboratory in order to investigate possible discrepancies between real world emissions and laboratory testing.

2. Materials and Methods

Figure 1 gives a general overview of the experimental setup in the laboratory. The vehicle with the portable instrumentation was also tested on the road. Details follow.

2.1. Vehicle and Fuel
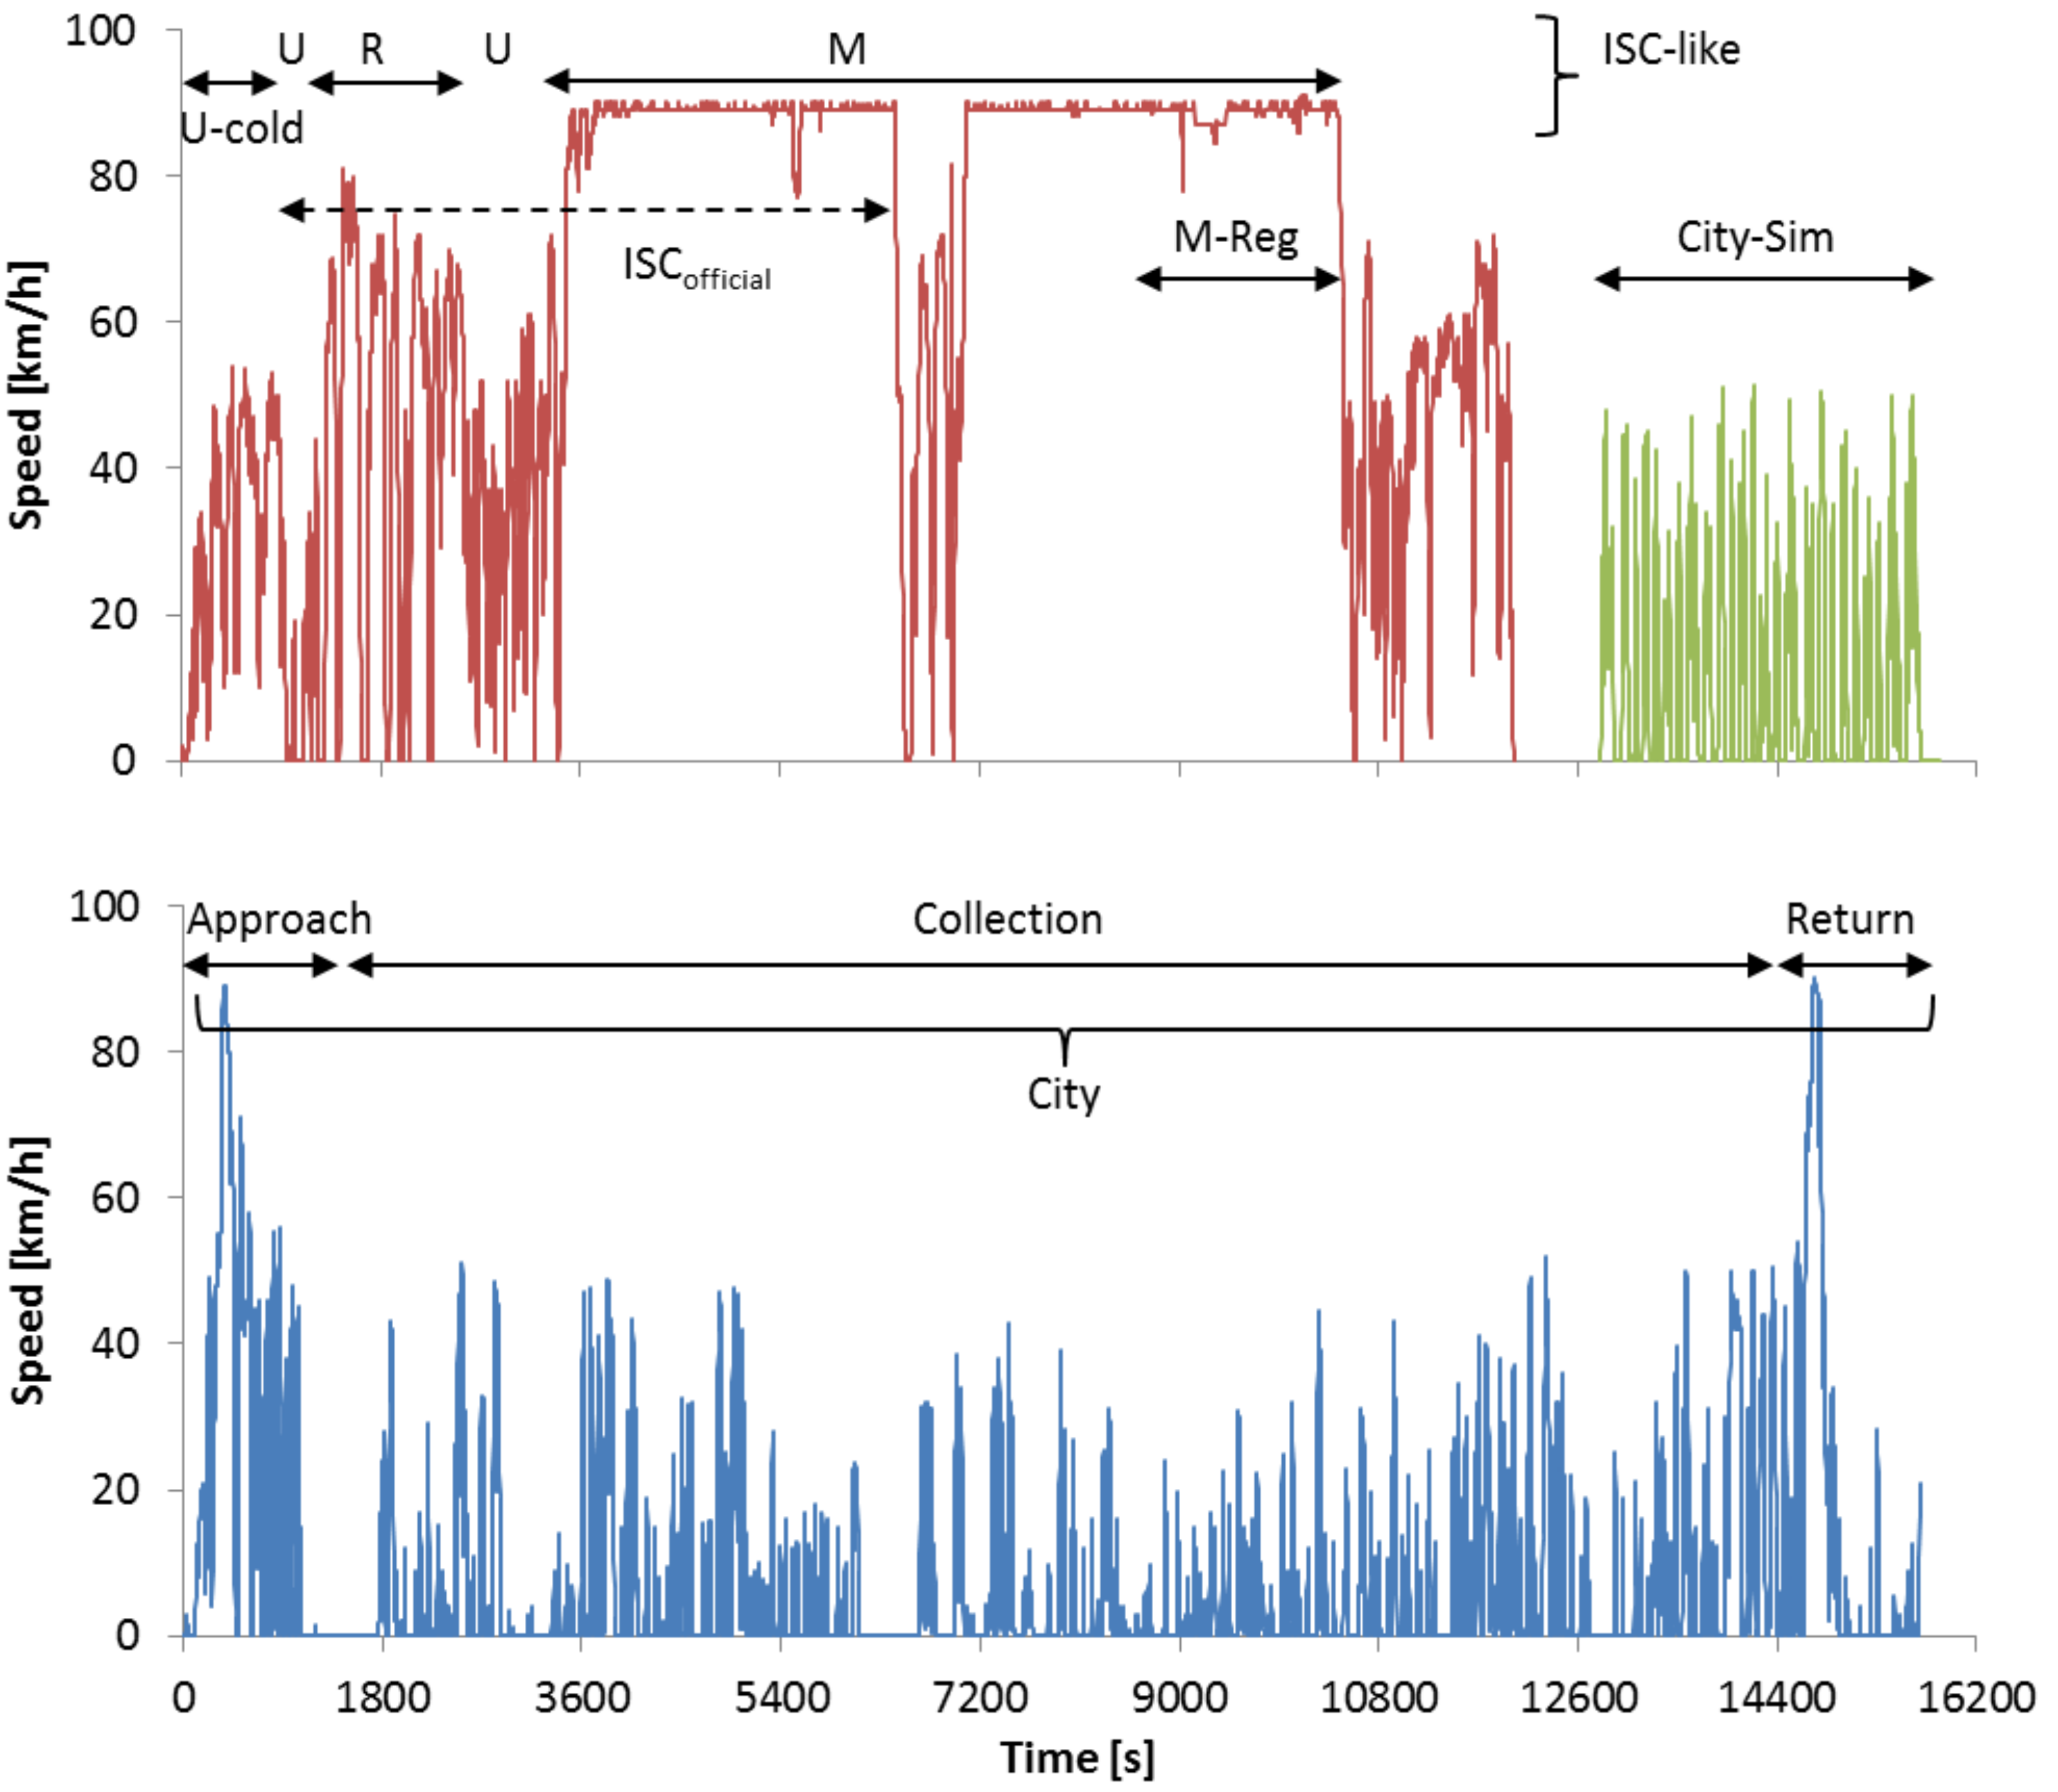
The vehicle was provided by the Environmental services company of Milan (AMSA, Azienda Milanese Servizi Ambientali). The refuse collection vehicle was equipped with a rear container loader that can lift small containers. The waste is compressed against a moving wall, powered by the same engine that moves the vehicle. The characteristics of the engine and the vehicle can be found in Table 1. Diesel B7 market fuel (EN590) was used (biofuel content 6.2% FAME, sulfur content 8.4 ppm, polycyclic aromatics 3.4%). A commercial grade liquid reductant was used for the Selective Catalytic Reduction (SCR) system (Bluechim® from Chimitex, Italy).

2.2. Test Cycles

The test cycles used for the evaluation of the vehicle were (see also Figure 2):
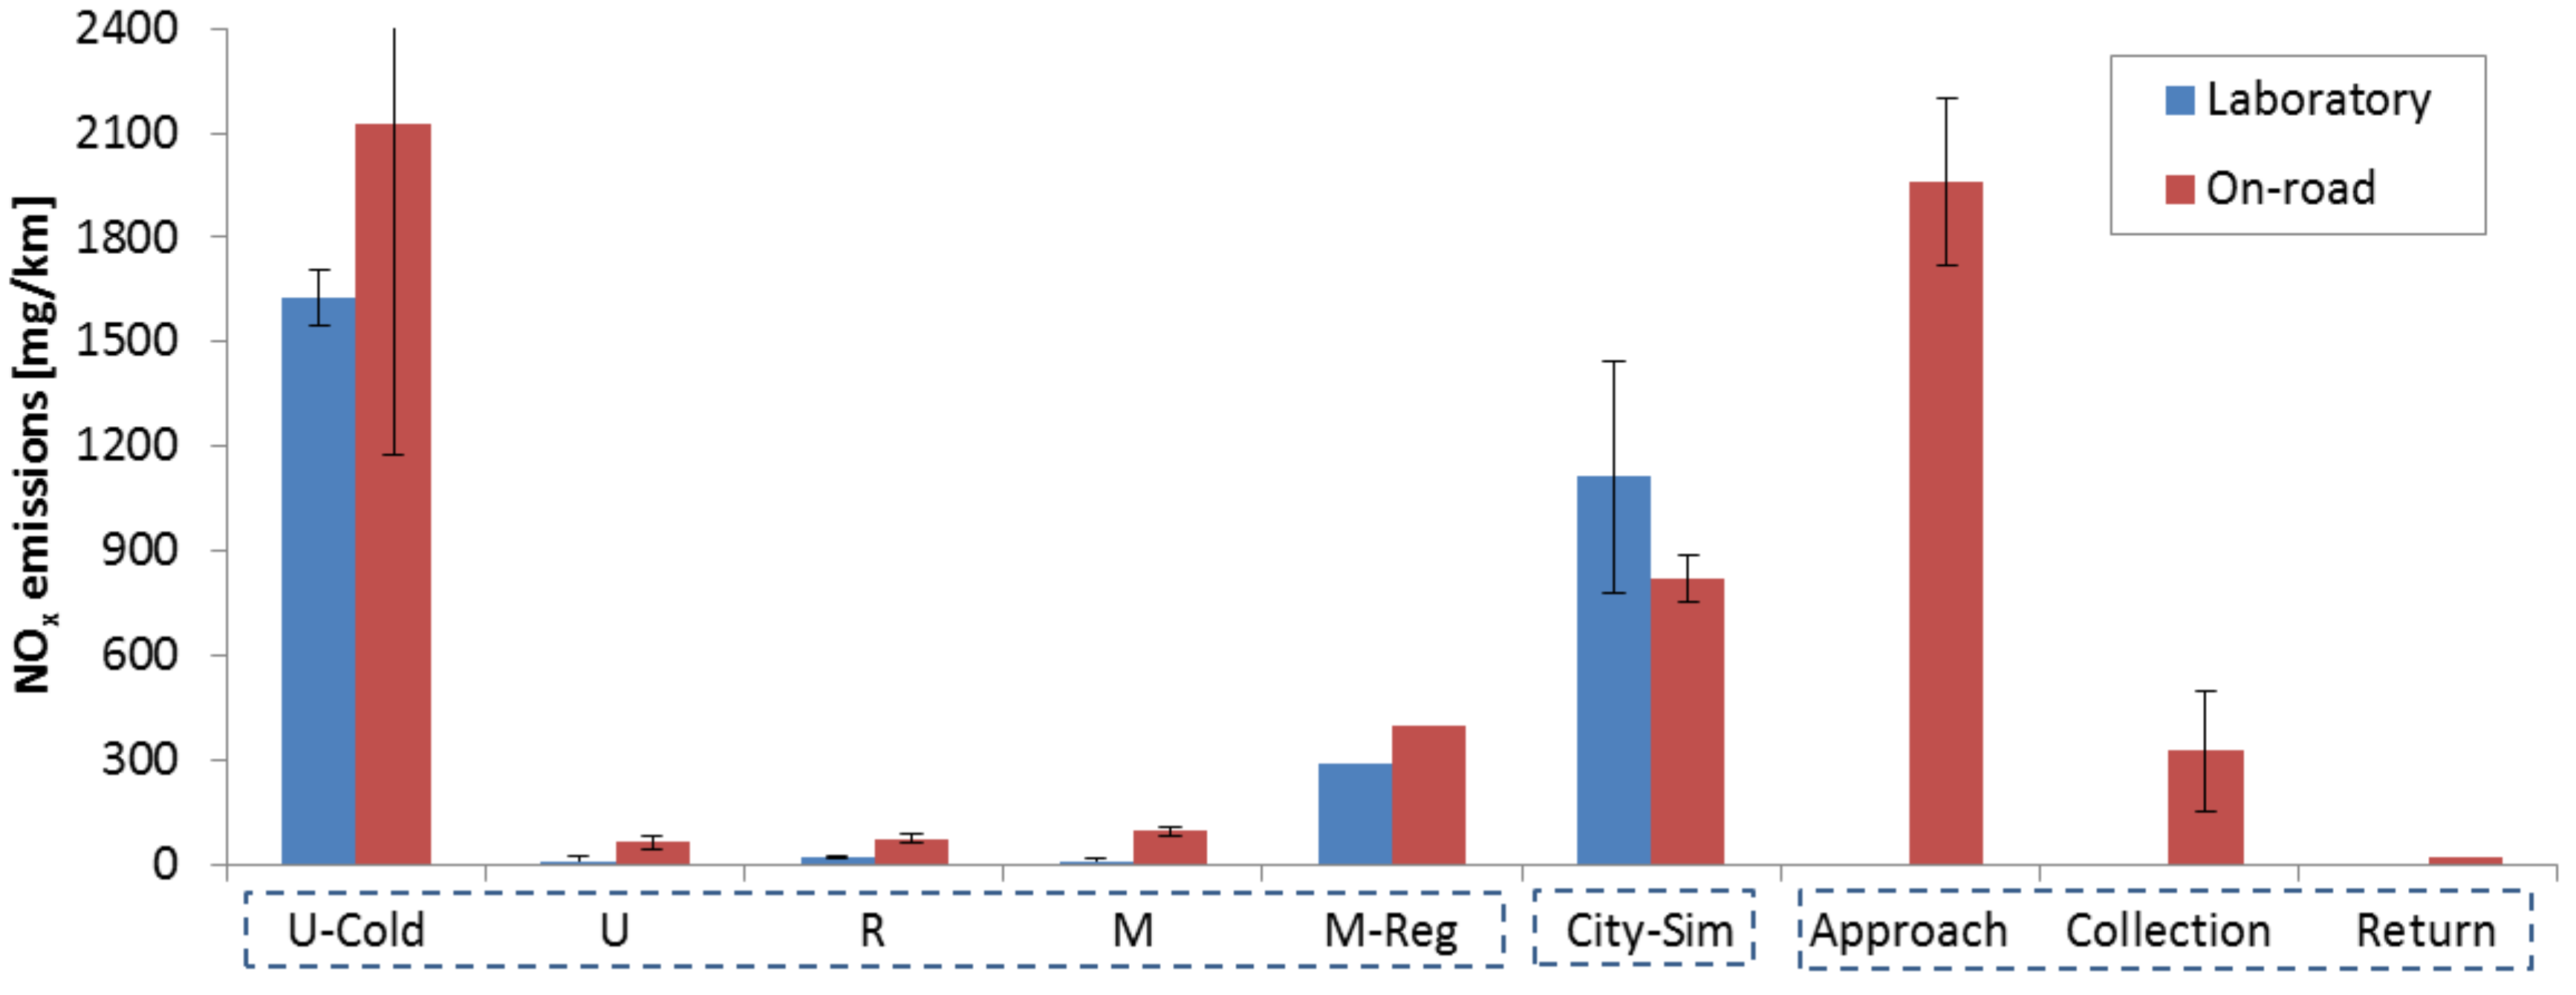
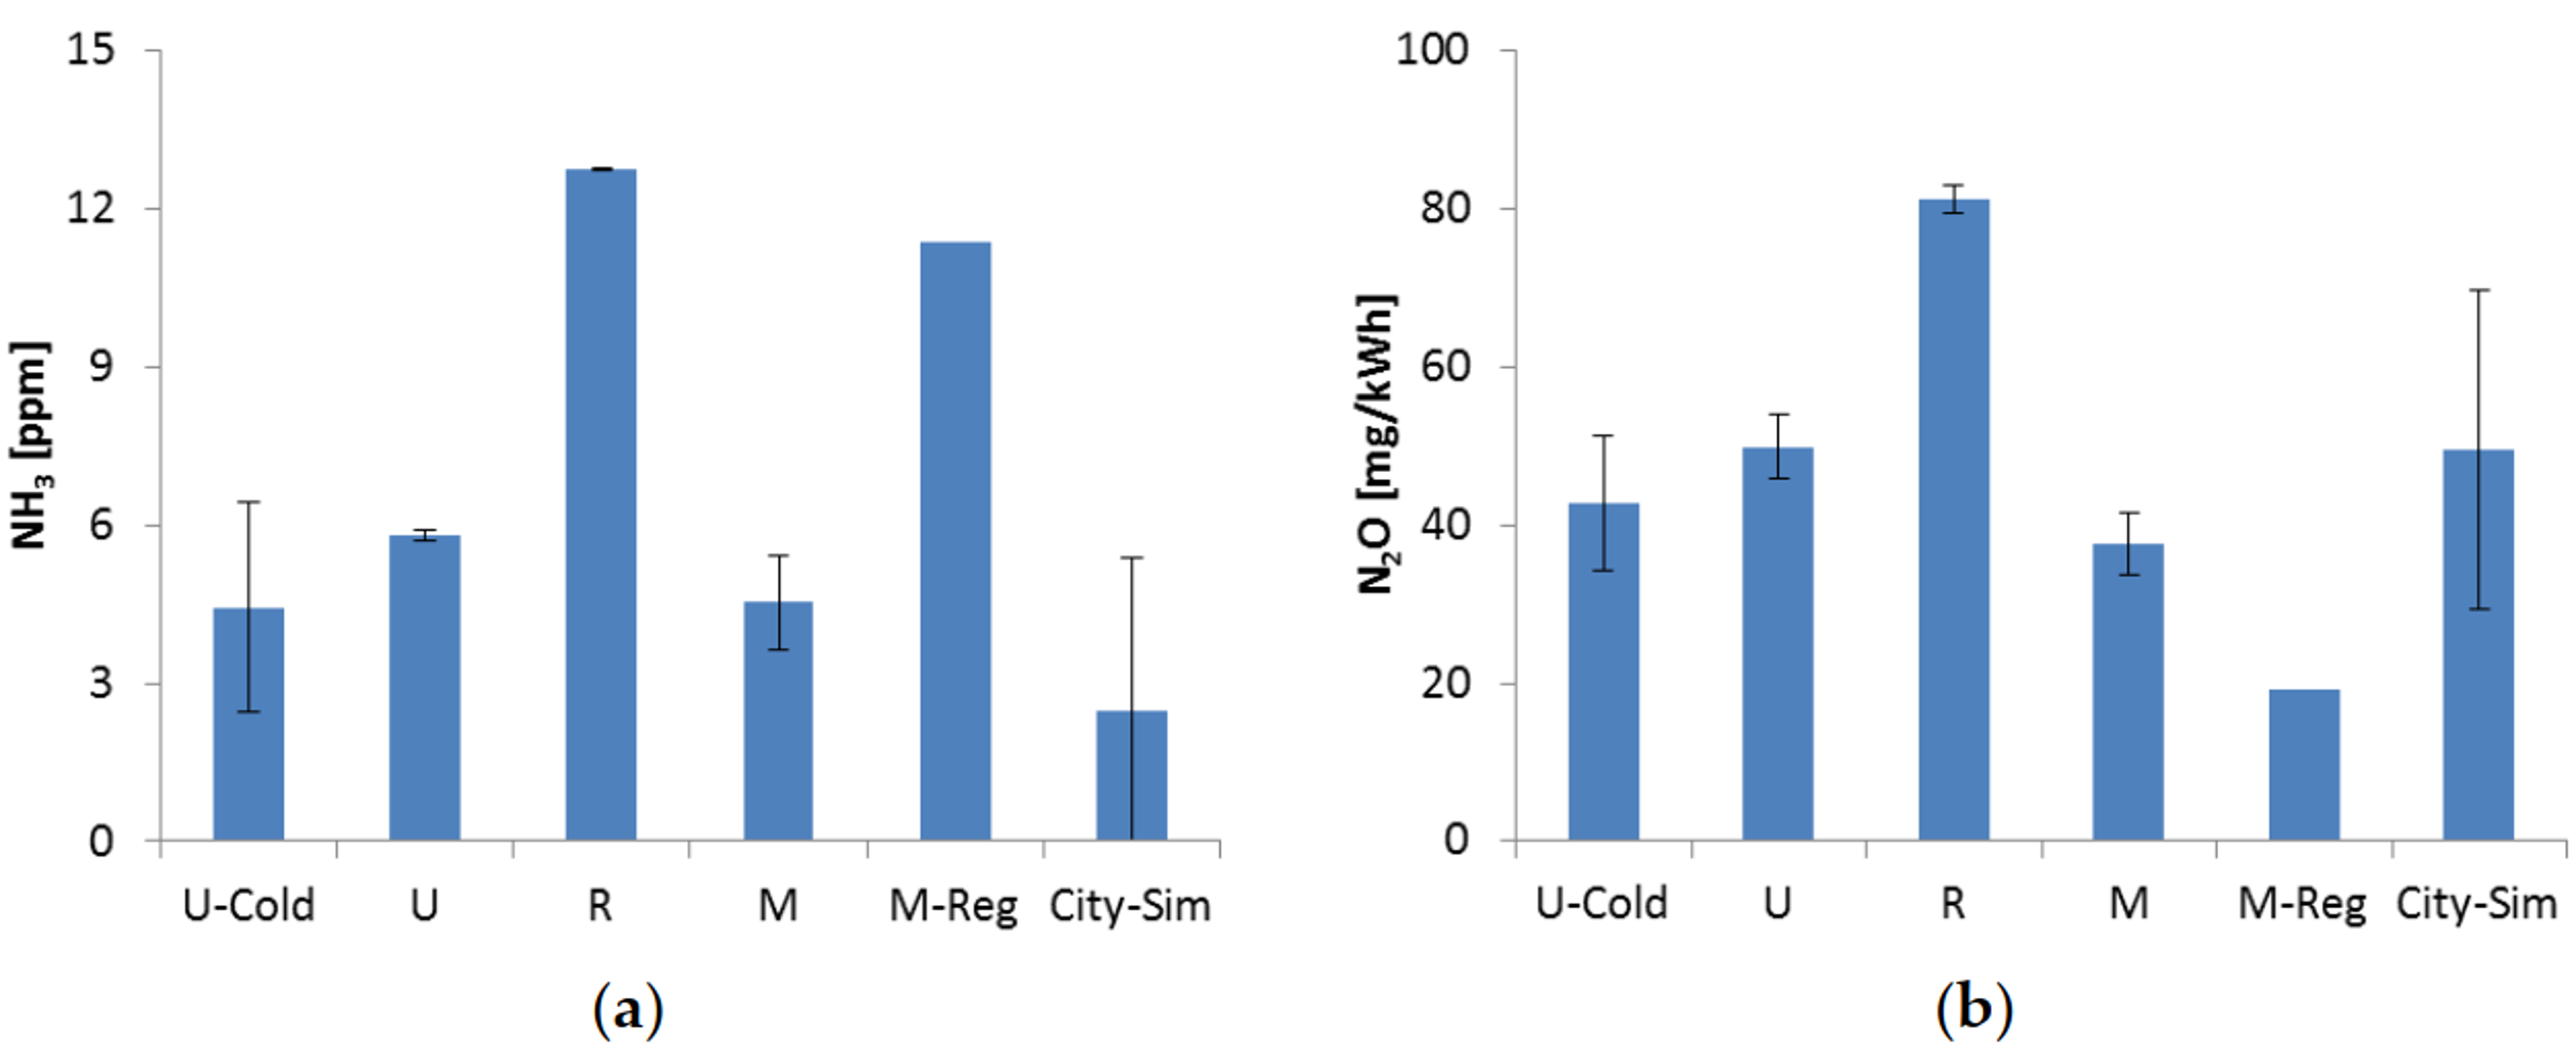
  • In-Service Conformity like (ISC-like): It is an extended version of the cycle required by the regulation (ISCofficial) for the specific engine category (N3) to assess the emissions of the vehicle in service. It consists of an urban part (U) with cold start (U-cold), rural part (R), and motorway part (M). In some trips there was a regeneration at the last part of the motorway phase (M-Reg).
  • City simulation (City-Sim): It is a custom-made cycle to simulate the operation of the vehicle in the city with start and stops and compaction (but with no waste). It starts with hot engine (coolant temperature around 70 °C).
  • City (Milan refuse collection cycle): It is the actual refuse collection cycle tested in the city of Milan. It consists of a part from the depot to the city (Approach), the refuse collection (Collection) (with actual trash pickup and compaction), and the return to the dump and depot (Return). It starts with cold engine.
The ISC-like cycle and the City-Sim cycles were also tested in the heavy-duty chassis dynamometer laboratory. The most important statistics of the cycles are summarized in Table 2. The mean speeds ranged from 5.8 to 81 km/h. The idling time was maximum at the City collection part (56%). The mean power of the cycles ranged from 13% (City collection) to 38% (Motorway). The work to distance ratio (W/D) ranged from 1.01 (motorway) to 5.10 (city collection). The mean SCR temperature was above 200 °C in all cases, except at the cold start parts (U-cold and Approach). The cold start was approximately 5.6–8.8% of the total trips time.
As the main target of this study was to assess the vehicle under different driving conditions, there was no attempt to run an official ISC cycle (for details see Appendix A).

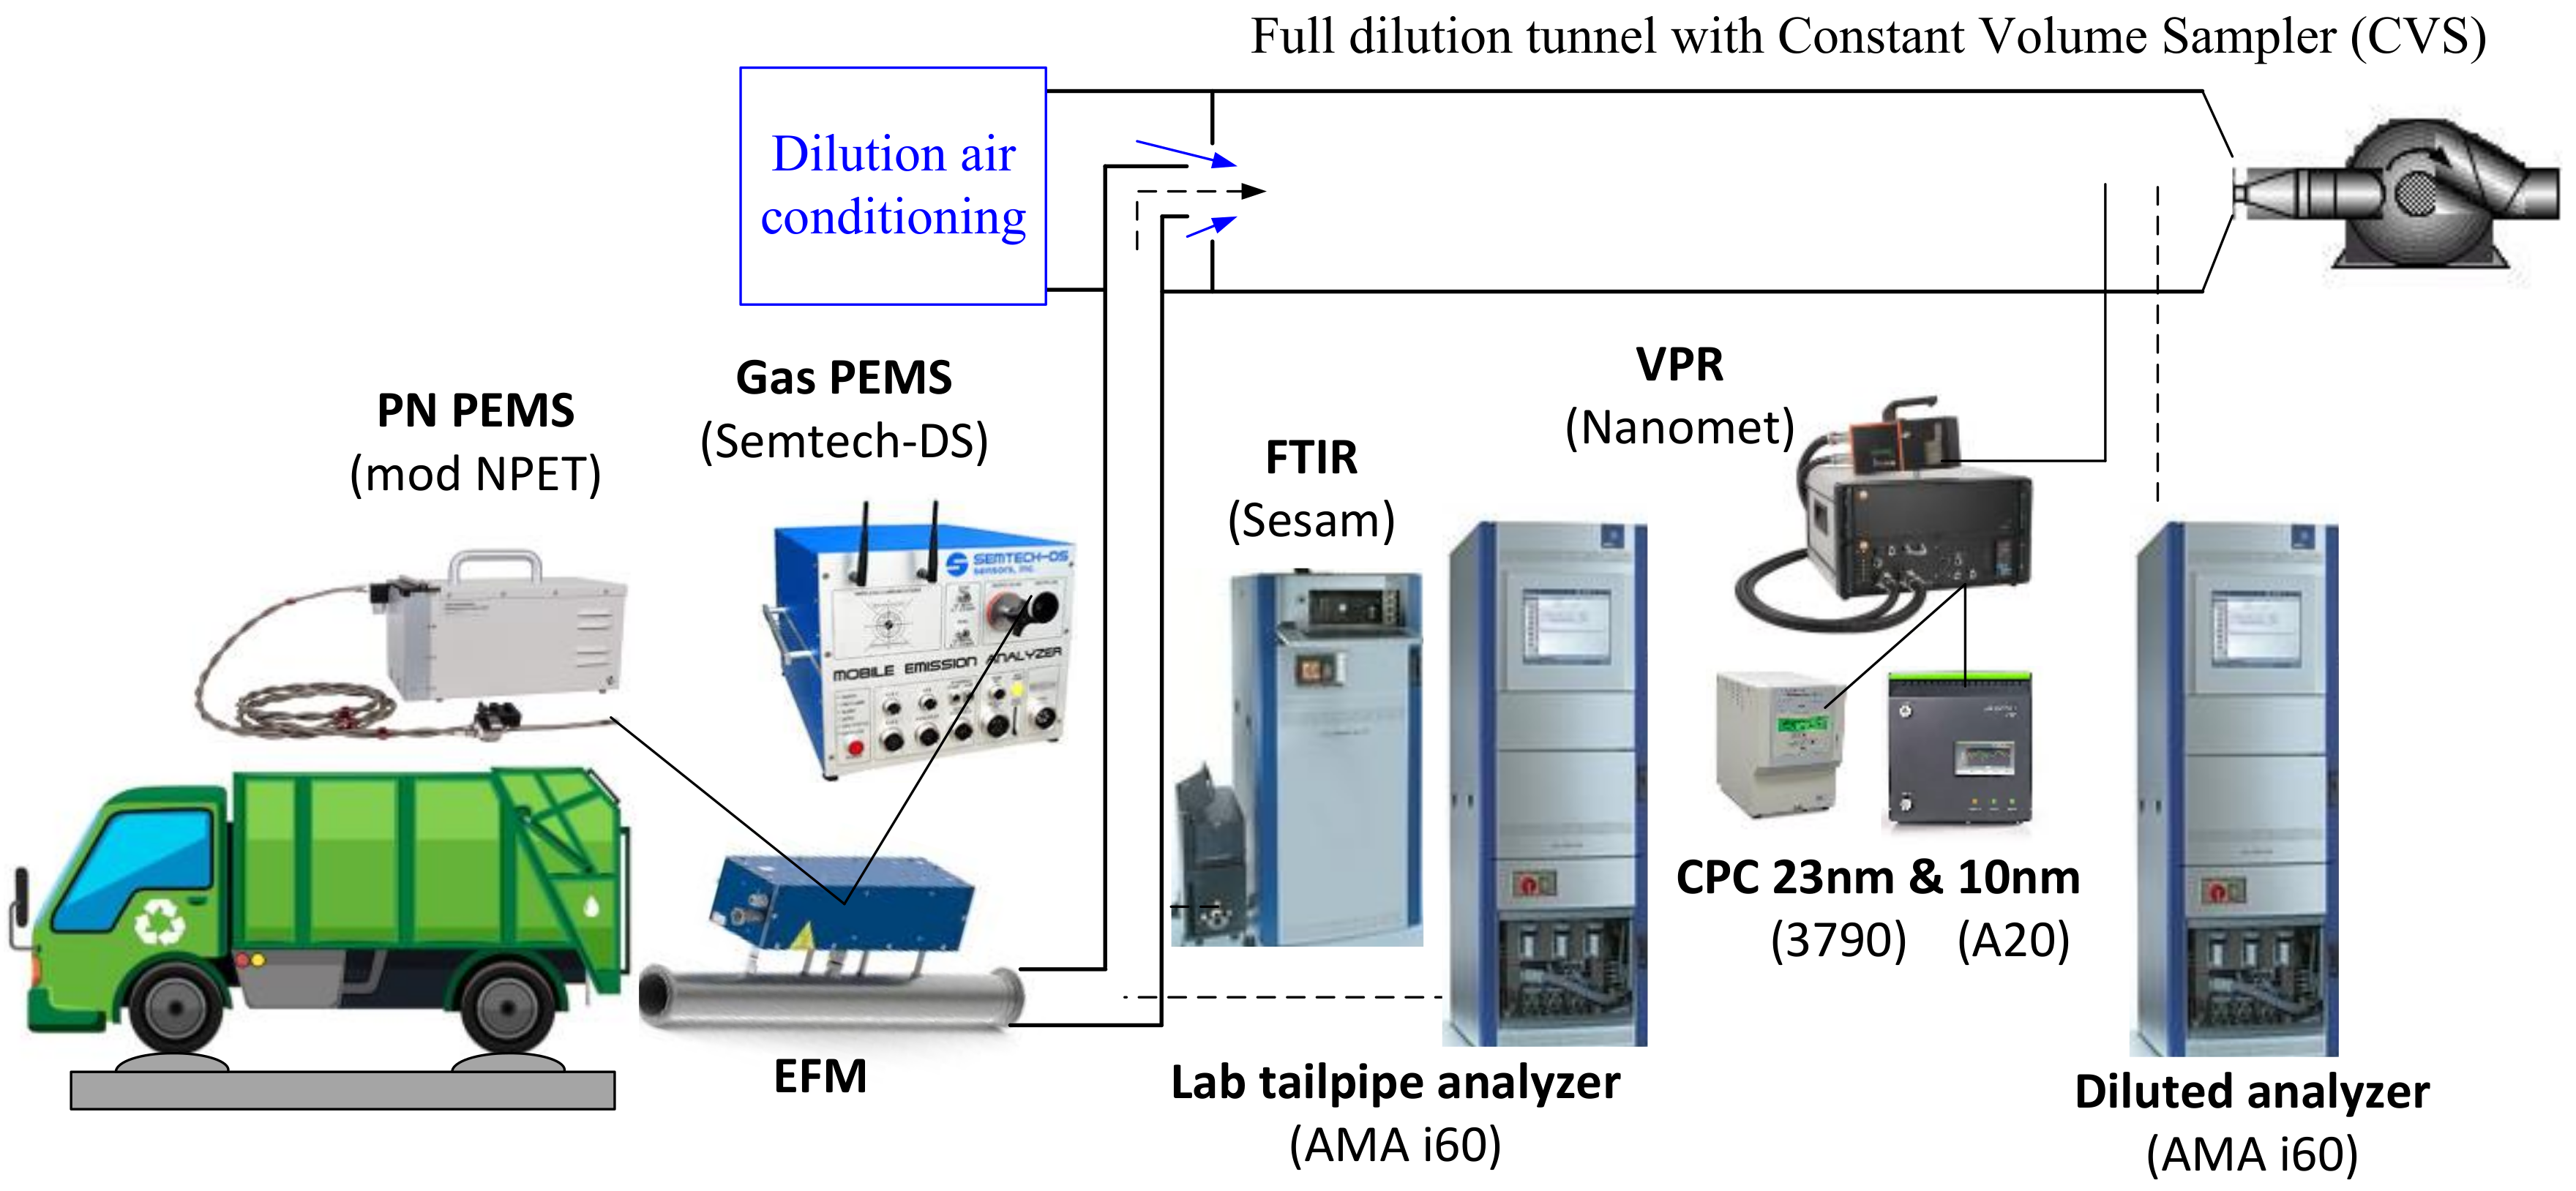
2.3. Instrumentation

For both laboratory and on-road tests, a Portable Emissions Measurement System (PEMS) was used (Semtech-DS from Sensors Inc., Michigan, US) [19] to measure gaseous pollutants. It was sampled via a heated line at 191 °C downstream of a 4 inches exhaust mass flowmeter (EFM) connected to the tailpipe of the vehicle. It measured hydrocarbons (HC) in an FID (Flame ionization detector), NOx (NO + NO2) in a NDUV (non-dispersive ultraviolet), and CO and CO2 in a NDIR (non-dispersive Infrared) analyzer, respectively. The technical characteristics of the instrument are presented in Table 3. The PEMS included a weather station, enabling the measurement of the temperature, pressure, and humidity of the ambient air, and a GPS (Global Positioning System) for the determination of the vehicle speed and altitude. The required power was supplied by external batteries. Before each test the PEMS was zeroed and calibrated with span gases. Note that the Semtech-DS has been replaced in the manufacturer’s catalogue by Semtech-DS+ (2014 some parts, 2018 the complete unit), but nevertheless the older model is widely used (e.g., [20,21]).
For particle emissions, a modified Nanoparticle Emission Tester (NPET, from HORIBA, Kyoto, Japan) [22] was used both in the laboratory and on the road. The first diluter (10:1) was located directly at the sample probe at the tailpipe. With a 4 m line, the diluted aerosol was brought to the main cabinet, where a heated catalytic stripper at 350 °C removed the volatile and semi-volatile particles. A second dilution (10:1) cooled down the aerosol and brought the concentration to the measuring range of the isopropyl alcohol-based CPC (TSI, Shoreview, MN, USA) model 3007 with 50% counting efficiency at 23 nm (with modified saturator and condenser temperatures). The modified NPET was replaced by the OBS-ONE in 2017 with some improvements.
A connection to the Engine Control Unit (ECU) of the vehicle gave the necessary signals to calculate the engine work and auxiliary signals such as vehicle speed, etc.
The laboratory tests were conducted on the 2-axis roller dynamometer of the Vehicle Emissions Laboratory (VELA 7) of the Joint Research Centre (JRC) of the European Commission (see e.g., [23]). The exhaust gas was connected to the full dilution tunnel with a 9 m tube (the last 4 m insulated). The full dilution tunnel with constant volume sampler (CVS) was used with a flow rate of 100 m3/min. With this flow rate, at least a dilution ratio of 6:1 was achieved, even for the highest loads.
Gas analyzers (AMA i60, AVL List GmbH, Graz, Austria) [24] at the tailpipe and the dilution were used (details in Table 3). They measured hydrocarbons (HC) with an FID (Flame ionization detector), NOx (NO + NO2) with a CLD (Chemiluminescence detection), and CO and CO2 with a NDIR (non-dispersive Infrared) analyzer, respectively. They had multiple ranges to determine accurately (typically within 2%) the concentration of the gases.
Particle Number (PN) measurements were performed using a Nanomet 1 (ViPR) system [25]. This consists of an MD19-2E rotating disc diluter followed by an ASET15-1 thermodiluter. The sample is diluted 40:1 at the sample point with the rotating disc diluter using filtered air at 150 °C. The diluted sample is then thermally treated at 350 °C in an evaporating tube and subsequently diluted in a simple air mixer diluter at a rate of 4:1. A TSI 3790 CPC [26] having a 50% counting efficiency at 23 nm and an Airmodus (Helsinki, Finland) A20 CPC [27] modified by the supplier to achieve a 50% counting efficiency at 10 nm were was used to measure the solid PN concentration.
Additional pollutants, including ammonia (NH3) and nitrous oxide (N2O) were measured with a Fourier-Transform Infrared Spectroscopy (FTIR) instrument (Sesam i60 from AVL) [28] connected to the vehicle tailpipe, using a heated polytetrafluoroethylene sampling line (191 °C). The FTIR instrument (Nicolet Antaris IGS Analyzer—Thermo Electron Scientific Instruments LLC, Madison, WI, USA) was equipped with a multipath gas cell of 2 m of optical path, a downstream sampling pump (5.5 lpm flowrate) and had the acquisition frequency of 1 Hz with a working pressure of 860 hPa. The dispersive element of both FTIR instrument was made up of a Michelson interferometer (spectral resolution: 0.5 cm−1, spectral range: 600–3500 cm−1), while the detection was achieved with a liquid nitrogen cooled mercury cadmium telluride detector.
The (empty) mass of the vehicle was 15500 kg. The mass of the refuses was approximately 4700 kg. The total mass, including instrumentation and 3 persons, was around 20500 kg. The simulated mass of the vehicle on the chassis dynamometer was 20800 kg, which represented a 50% payload as it was required in the in-service conformity heavy-duty emissions regulation. The road load coefficients were estimated based on previous similar vehicles.

2.4. Calculations

The PEMS and the laboratory automation system calculate the emissions in g/s (or particles/s) with all requirements described in the regulation (background correction for CVS, zero drift correction for PEMS, dry-to-wet correction (approximately 0.95), time alignment etc.) (see also Reference [29] for more details). No NOx humidity correction was applied in order to present real ambient NOx emissions (correction approximately 0.95). The different parts of the cycle were integrated and divided by the distance or work for the specific part. The work was calculated by the revolutions and torque provided by the ECU as required in the regulation. The results were not evaluated according to the Moving Average Window (MAW) method required in the regulation [3] because the target was to assess the emission factors and not the compliance of the vehicle (Appendix A).
The measurements at the dilution tunnel have less uncertainty because they are close to what the regulations require. The measurements at the tailpipe have a slightly higher uncertainty, usually due to the uncertainty of the exhaust flow measurement. For this reason, PEMS, tailpipe, and FTIR were compared to the analyzers at the dilution tunnel.

3. Results

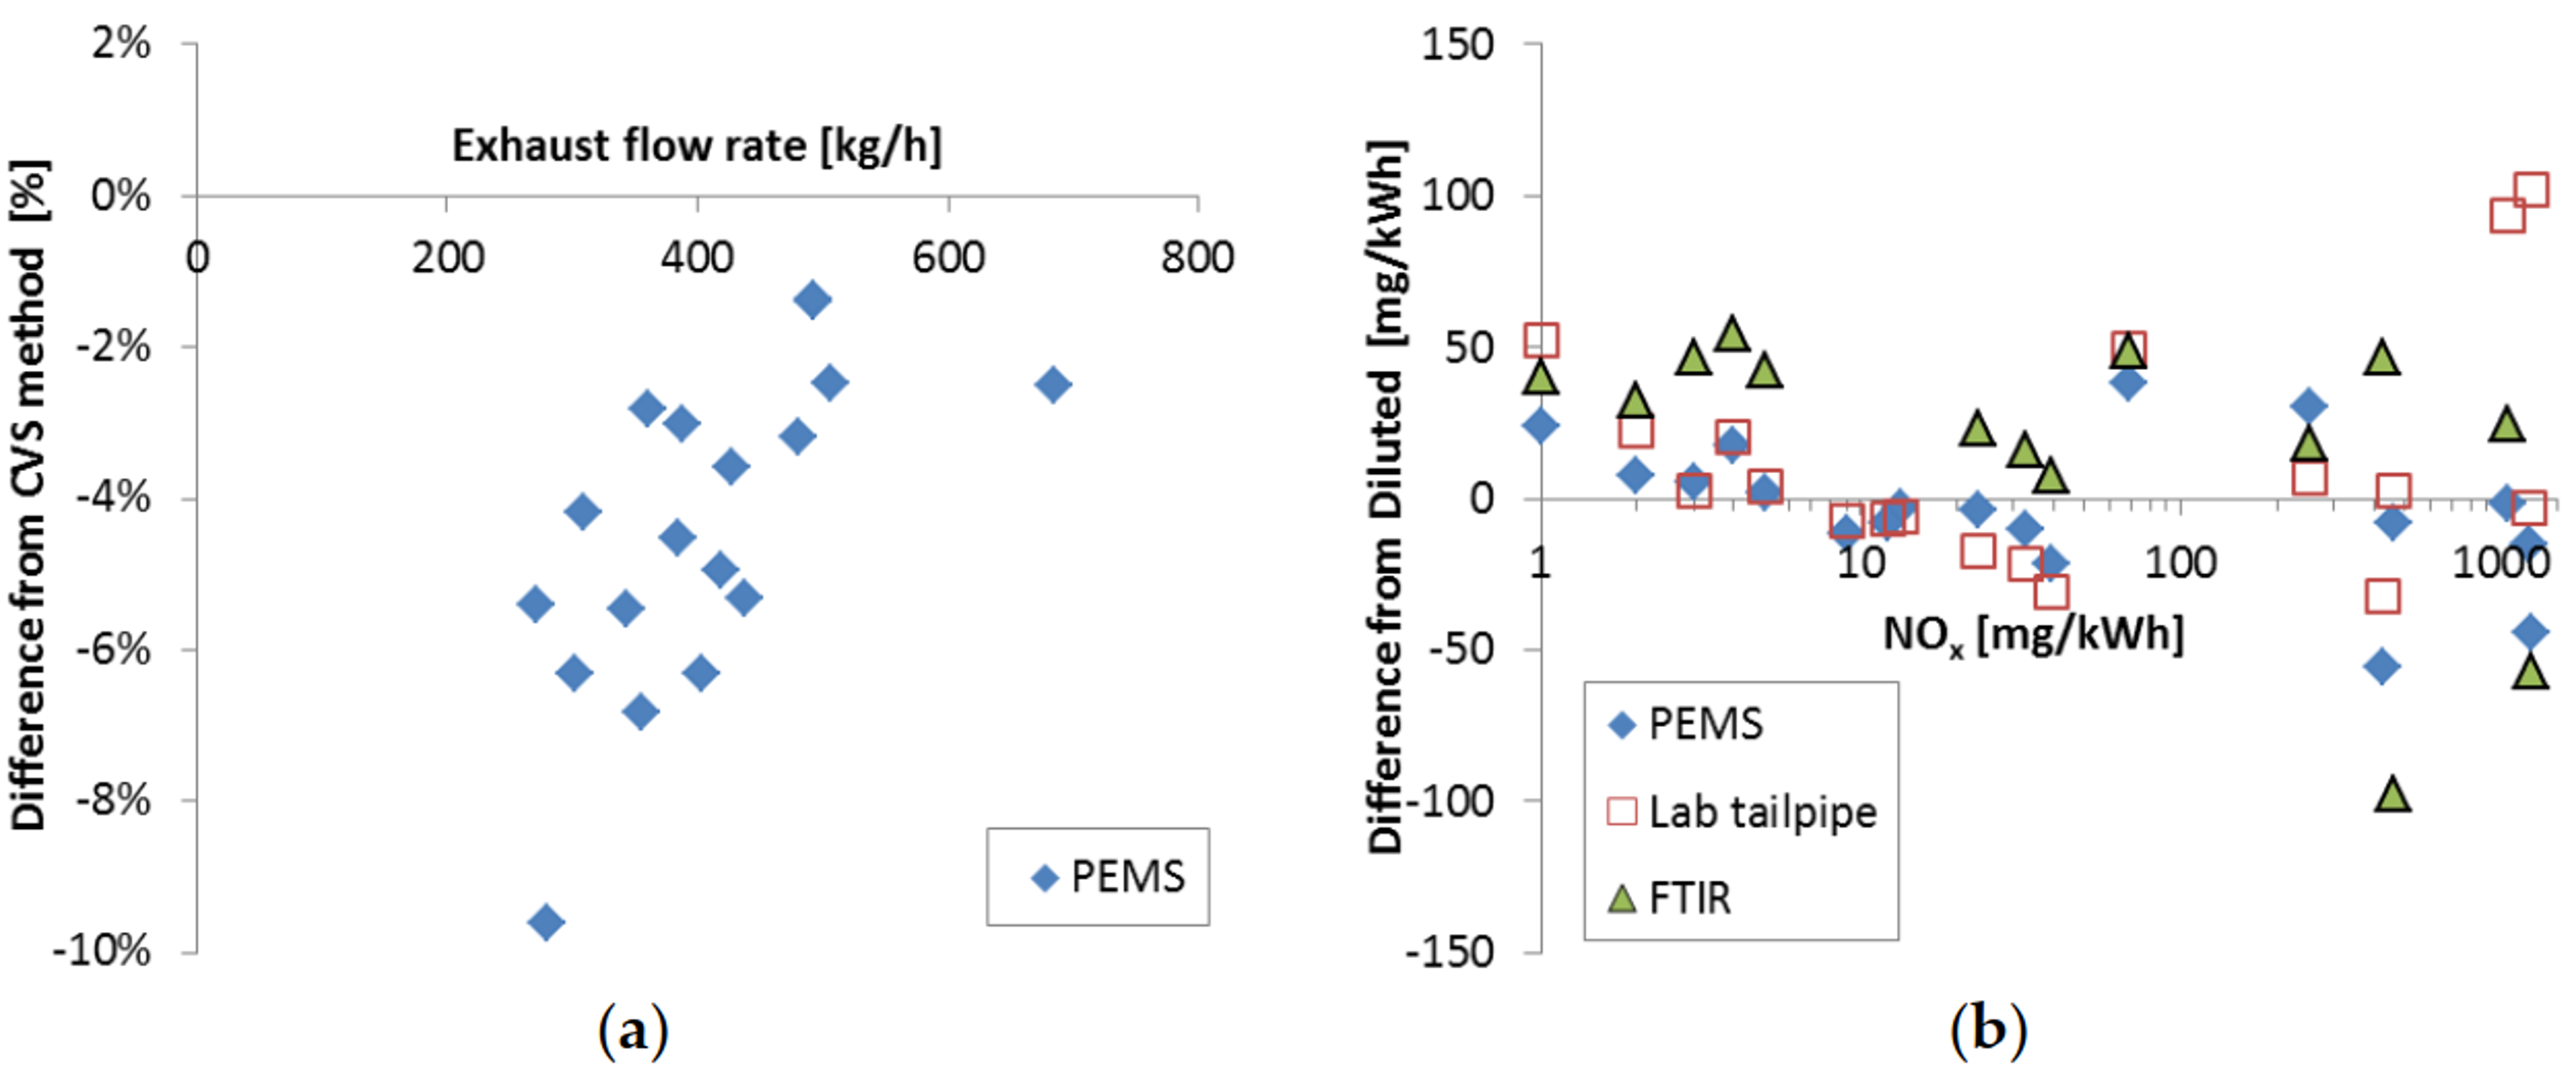
3.1. PEMS Assessment

The PEMS was compared to laboratory grade equipment during the chassis dynamometer tests. Figure 3 summarizes the results for the exhaust flow measurements and NOx. The exhaust flow meter (EFM) of PEMS is around 4% lower than the estimated flow by the dilution tunnel (total diluted flow minus dilution air flow). The differences for NOx are within 50 mg/kWh. In addition, the NOx results from the FTIR and laboratory tailpipe analyzers are given. Their differences to the dilution tunnel analyzers were also typically within 50 mg/kWh, with a few exceptions that reached 100 mg/kWh.
The emissions of CO, HC, and PN were very low, close to the detection limit of the instruments, and no figure is shown.

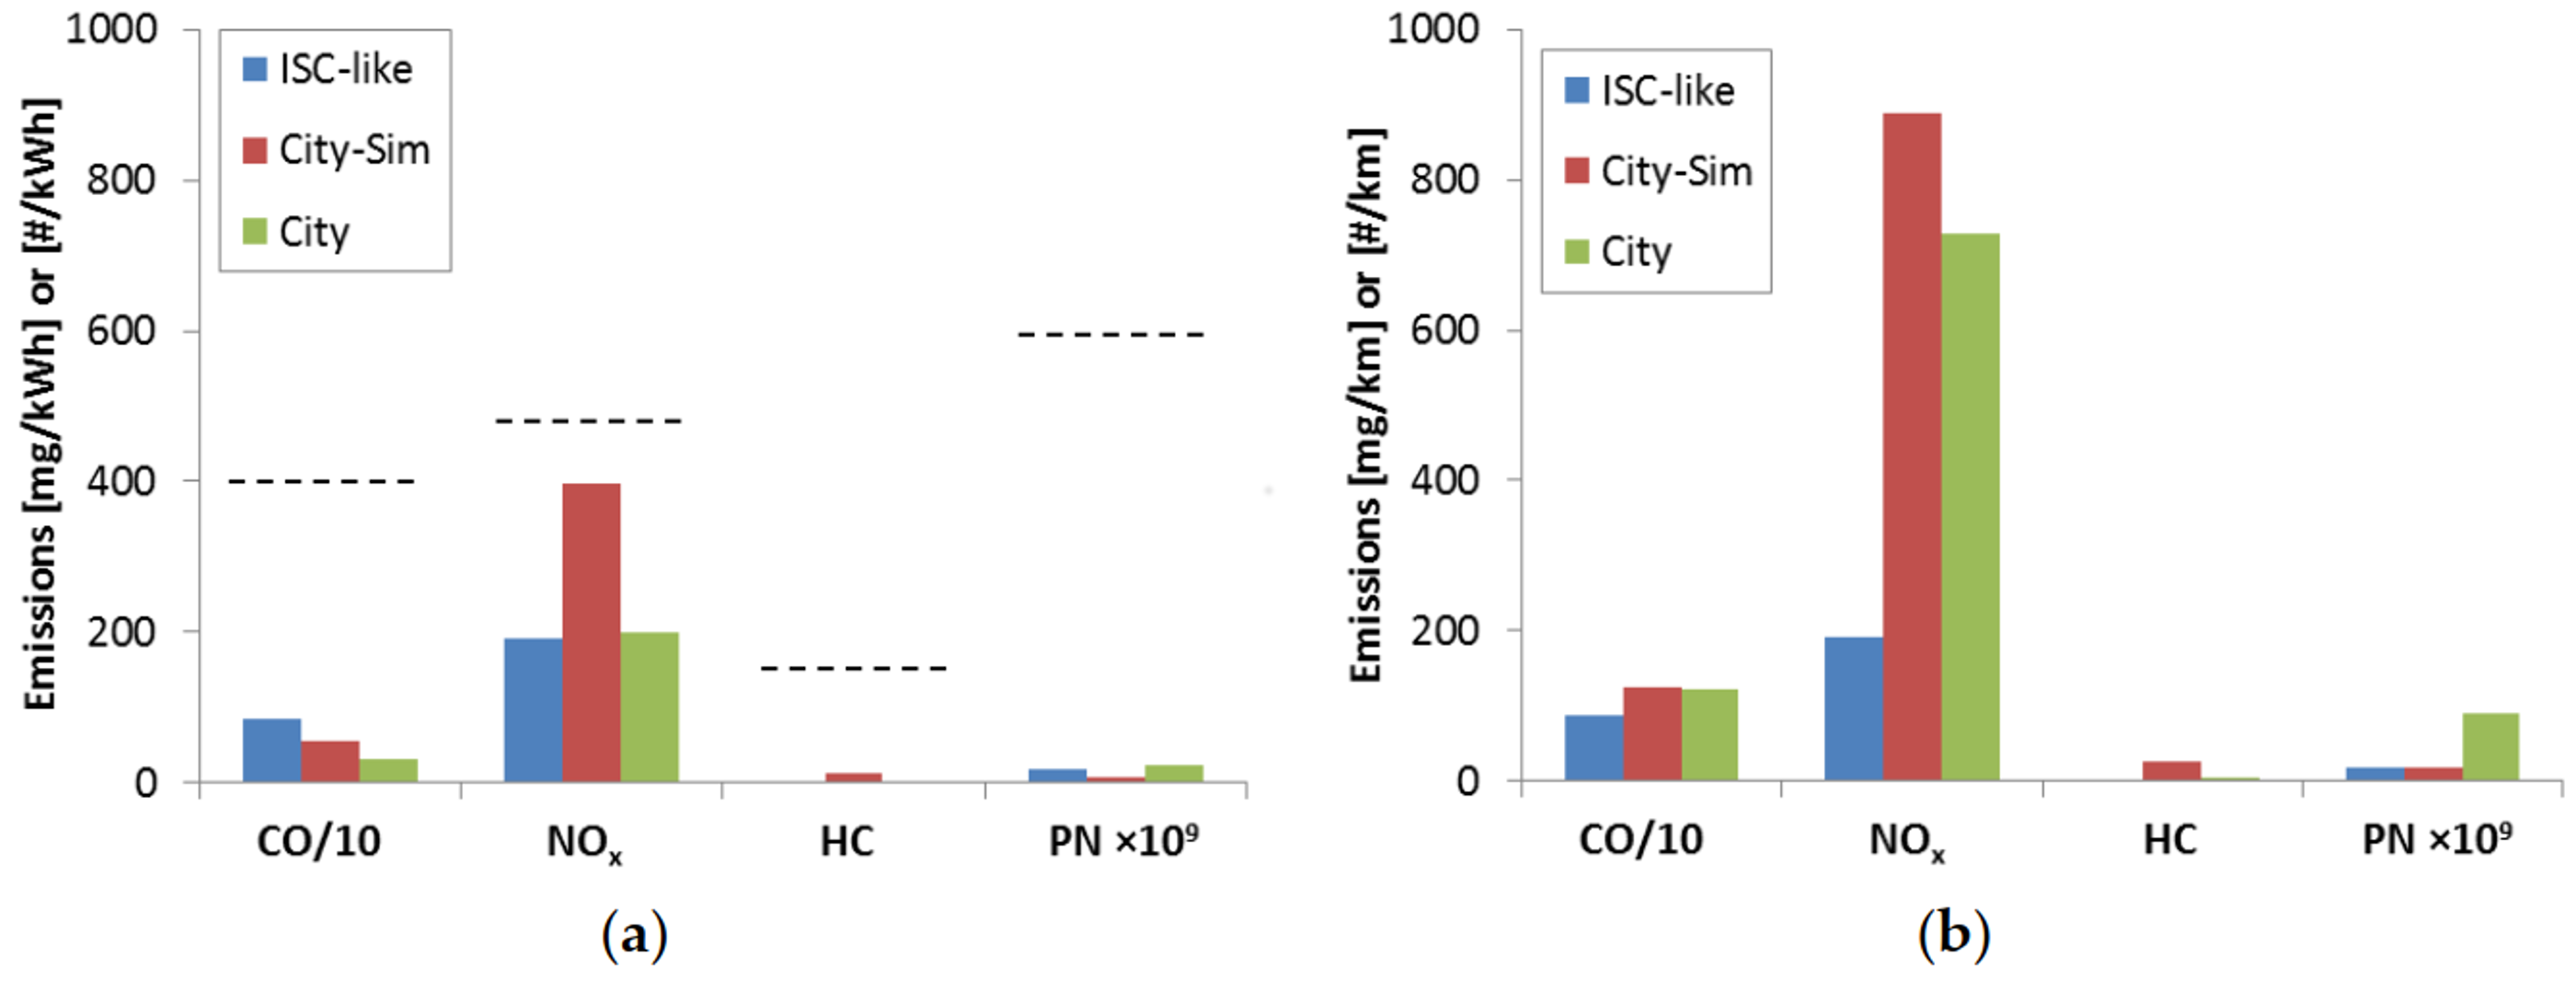
3.2. Vehicle Emissions

Figure 4 presents the regulated pollutants per kWh (left panel) or per km (right panel). The results are integrated emissions (no exclusions of data) including the engine cold start emissions (ISC-like and City cycles). Even though the evaluation and the cycles were not according to the regulation, all pollutants are well within the laboratory Euro VI limits for engines or the on-road ISC limits for Euro VI vehicles, for all cycles (an additional multiplication factor of 1.5 is applied). The emissions expressed per km are also very low. The City cycles for NOx are relatively higher (around 700–900 mg/km) due to the inclusion of cold start and the short distance covered.
Figure 5 presents in more details the NOx emissions (per km) measured with Portable Emission Measurement System (PEMS). The emissions are high at engine cold starts (U-cold, Approach) and city operation (City-Sim, City). The high scatter at the cold urban part (U-cold) is due to high emissions at the 2 °C test; the second test was at approximately 7 °C. There is an increase of the emissions at the motorway during regeneration (compare M and M-Reg). Results are shown for both on-road (right bars) and laboratory tests (left bars). The agreement between laboratory and on-road tests is good (35%)
The FTIR measurements of NH3 and N2O in the laboratory are summarized in Figure 6. The NH3 concentrations were low, reaching 12 ppm in the rural and motorway part during regeneration. The mean cycle NH3 concentrations were approximately 6 ppm, well within the 10 ppm limit for Euro 6 heavy-duty engines. The N2O emissions ranged between 40 and 80 mg/kWh.

4. Discussion

The three main objectives of the paper were to:
  • Compare the PEMS with laboratory grade equipment.
  • Compare laboratory and on-road tests.
  • Evaluate the emissions of the vehicle in city conditions (in mg/kWh or mg/km).

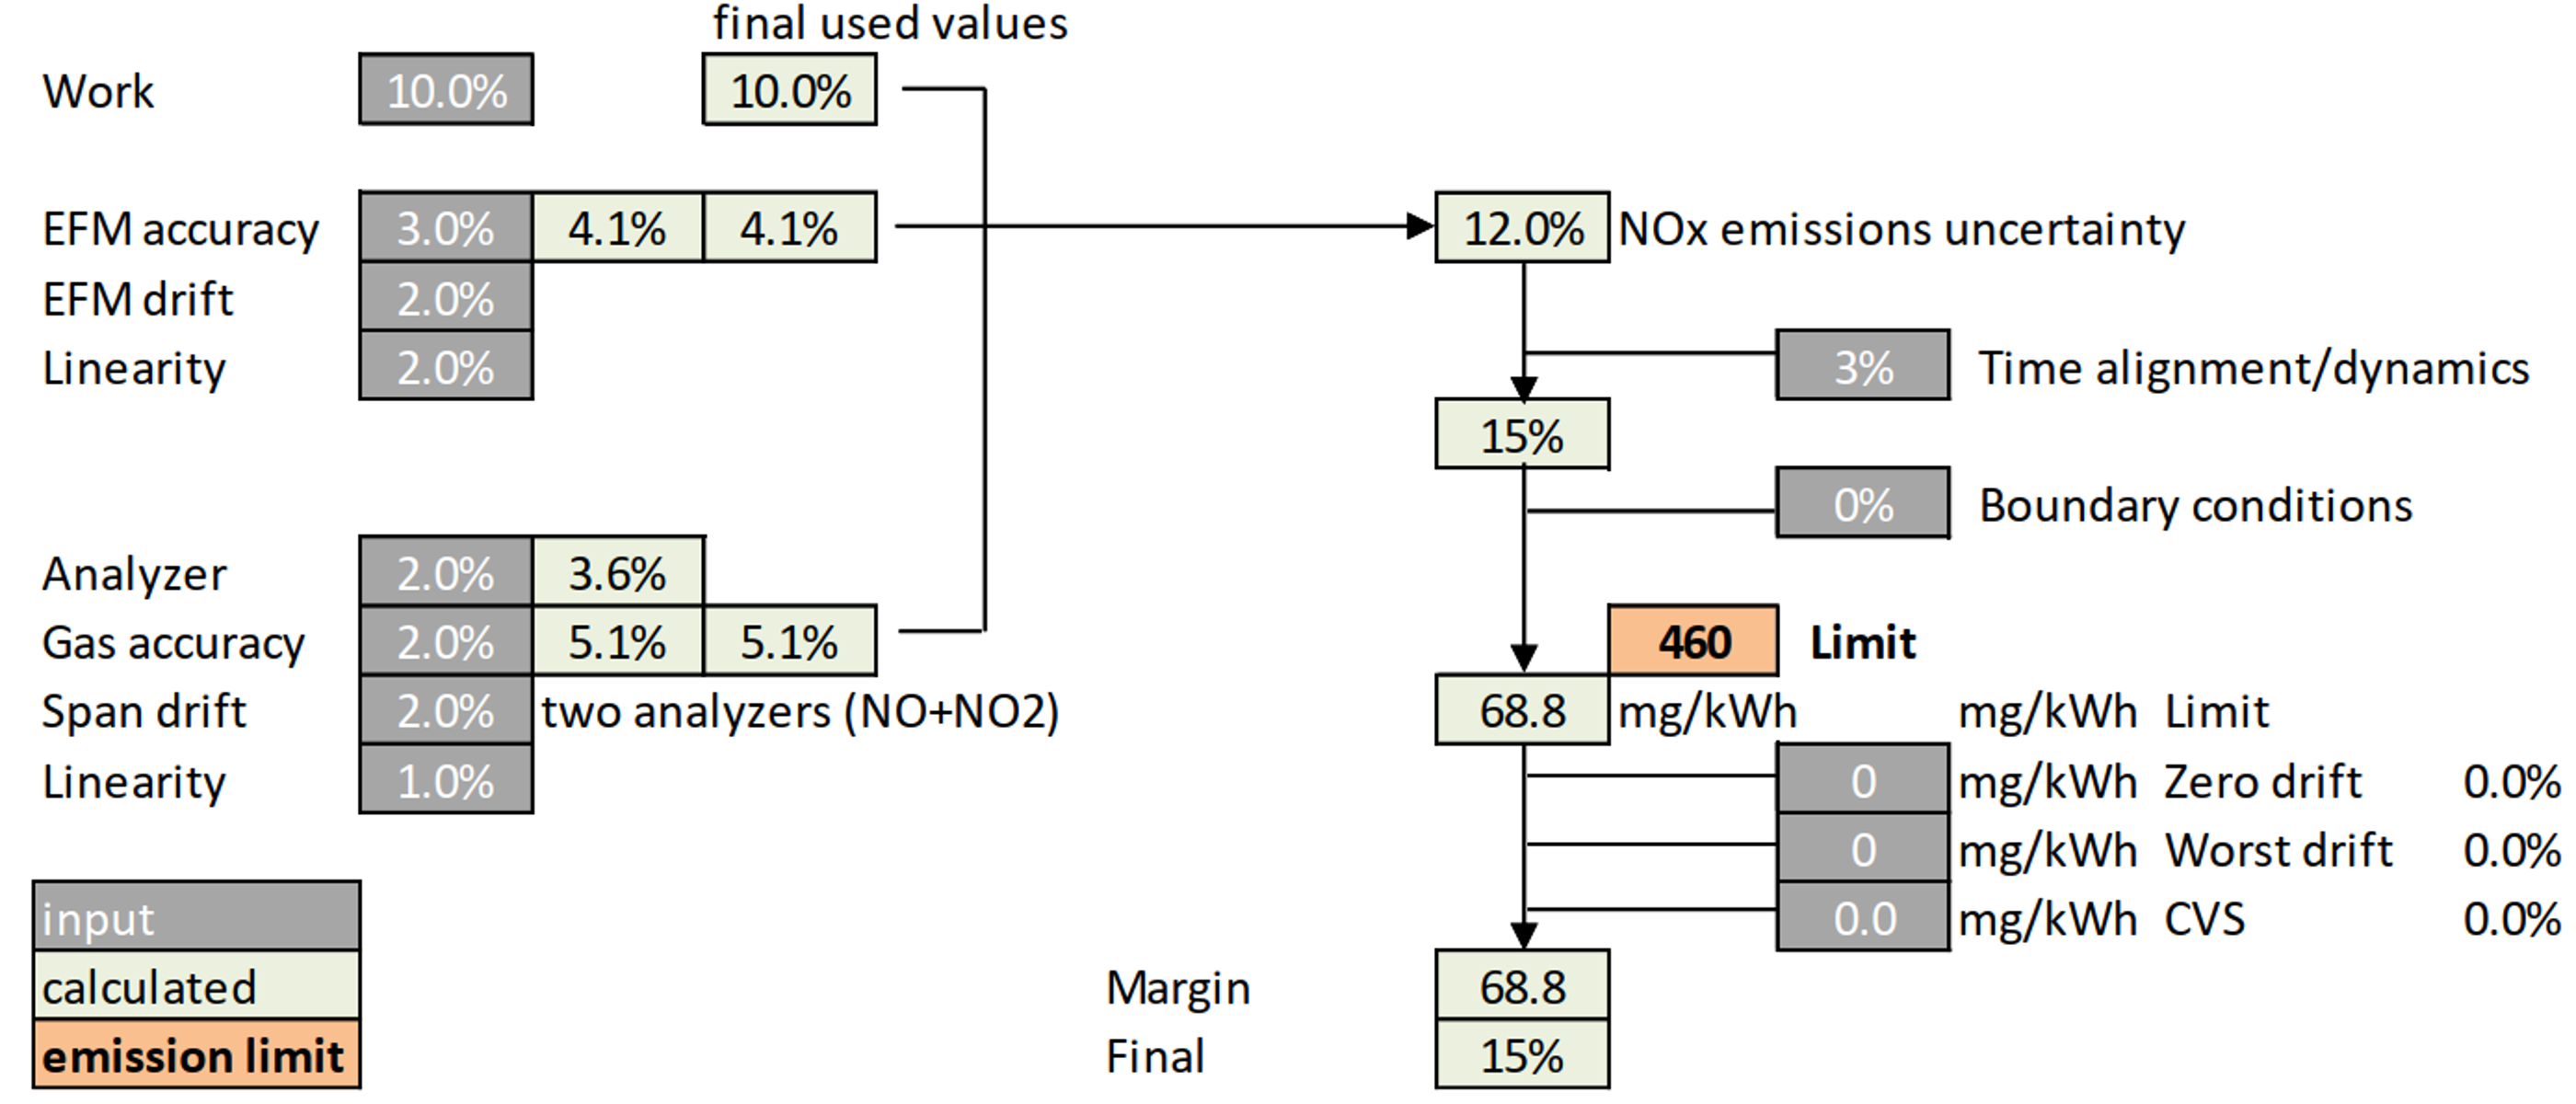
4.1. PEMS Assessment

The comparison of the gas PEMS with the laboratory analyzers (Figure 3) (called “validation” in the light-duty real-driving emissions (RDE) regulation) gave differences of up to 50 mg/kWh for NOx. The FTIR and the tailpipe analyzers had similar or slightly higher differences when compared to laboratory analyzers. It should be mentioned that the diluted values were corrected for the NOx background levels and the PEMS for the zero drift.
The PEMS uncertainty has already been assessed by many researchers. In the USA, the measurement allowance study found a NOx uncertainty (allowance) of 600 mg/kWh for 2007–2009 engines, which was around 23% of the 2007 standard [15,17]. The NOx allowance for post 2010 engines was found to be 200 mg/kWh, which was over 60% of the 2010 Not-To-Exceed (NTE) standard [15]. A recent study at 20 mg/kWh levels found 10 mg/kWh measurement error (50%) [18]. In the EU, an uncertainty of approximately 45% at 80 mg/km levels was found (33 mg/km) assuming a drift of 5 ppm [16]. Thus, our older generation PEMS is between older PEMS assessments and the newer generation PEMS results (more details in Appendix B). As it was mentioned previously, our results were corrected for zero drift (approximately 50–100 mg/kWh), something permitted in the heavy-duty regulation, but not in the light-duty one. Note that a 5 ppm drift, which was equivalent to an error of < 25 mg/km for light-duty vehicles, for a city refuse collection cycle of a heavy-duty vehicle can reach 250 mg/km; more than ten times higher than the light-duty value due to higher exhaust flow rates and shorter distance covered.

4.2. Laboratory vs. On-Road Tests

The comparison between laboratory and on-road tests (Figure 5) showed small differences (within 35% for emissions > 100 mg/km) even though the emission levels had a wide range (5–2030 mg/km). This finding for NOx (and PN with emissions around 2 × 10¹⁰ #/kWh, but no figure is shown) is in agreement with a study that compared PN emissions [30]. The differences can be attributed to differences in engine out emissions and SCR efficiency due to: (1) different ambient conditions (around 5 °C on the road vs. 20 °C in the laboratory) (2) different weight (16000–20000 kg on the road vs. 20800 kg in the laboratory), (3) small differences in the cycles or warm up procedure (for the City-Sim), (4) the inaccurately simulated friction and aerodynamic resistances in the laboratory (also no road slope was added at the dynamometer, which can have an effect [31]). The mean power differences between lab and on-road tests indicate that the aerodynamic resistance was underestimated and the friction resistance was slightly overestimated. For example, the mean power at the motorway part for the on-road tests was 37%, but only 30% for the laboratory tests. In any case, the important message is that there is no large discrepancy between laboratory and real world, since, for example, it was found for light-duty vehicles and reported in many studies [32] or even in the late 90s for heavy-duty vehicles [33].

4.3. Vehicle Emissions

The tests showed that the engine fulfilled the regulated limits even when including cold start and under different test cycles. Additional pollutants, such as NH3 and N2O, were also low. The NH3 emissions (around 6 ppm) were even lower than the laboratory Euro VI type-approval limit of 10 ppm [3]. The low NH3 concentrations are in agreement with others that measured Euro VI vehicles [6,14]. For N2O there is no applicable limit, but they were lower than the USA Environmental Protection Agency (EPA) standard of 0.10 g/bhp-h (133 mg/kWh) for the heavy-duty engine Federal Test Procedure (FTP) cycle [34]; however, it needs to be checked whether this would still hold true with the specific test cycle.
One of the main motives of this study was to explore the concerns of various researchers regarding the emissions of diesel refuse trucks. There are two main reasons for their high emissions: (1) the emissions are expressed in mg/km, and most importantly, (2) the actual city conditions are not appropriate for the specific engines and aftertreatment systems.
In our study, the vehicle was well below the limits (in mg/kWh) at all tested cycles. The emissions looked higher expressed in mg/km (see Figure 4) (e.g., compared with the light-duty limit of 80 mg/km). Work-based emissions that are low can be high as distance-specific emissions, if the work to distance ratio is high (see Table 1). Emissions are expressed per km typically for emission inventories, even though it is not applicable to heavy-duty engines and vehicles.
However, in some cases, modern engines can have high emissions in the city even when expressed in mg/kWh [14]. Cold start and/or some city conditions (e.g., traffic/congestion) result in high engine out emissions (e.g., [35]) and low exhaust gas temperature, and consequently, the SCR system cannot work efficiently. In our study, the emissions were high during cold start and in some city conditions (see Figure 5). The contribution of the cold start to the average NOx emissions was 42–68% for the City cycle and 23–55% for the ISC-like cycle. The SCR temperature was < 200 °C only 3–9% of the time. This percentage of < 200 °C SCR temperature is lower but close to what other researchers measured in USA (11%) for refuse trucks [36]. In our study, the SCR temperature was on average > 200 °C (see Table 1), probably because the hydraulic system that was used to take in and compress the garbage increased the power demand and consequently kept the SCR catalyst temperature high even though the vehicle was idling 56% of the time. However, this also means that other refuse vehicles without such system might not be able to exceed 200 °C at the SCR catalyst, as was the case for many vehicles in another study [14].
In order to put the results of this study in the right perspective, Table 4 summarizes the NOx emissions measured by different researchers for diesel refuse collection vehicles. The actual emission levels range from 18–32 mg/km for no-SCR vehicles and 0.4–10 mg/km for SCR-equipped vehicles. Thus, the 0.7 g/km of this study is at the low end. It should be noted that one of the lowest emitting vehicles of a recent study [14] was from the same OEM as our study, indicating that other OEMs might have much higher emissions.

4.4. Regeneration

Another topic that needs to be considered is the regeneration. During regeneration, the emissions are higher, and this should be taken into account in the overall emission of the vehicle. Table 5 summarizes the emissions during the motorway part where regeneration took place. For the same time period, the motorway emissions of non-regenerating cycles are given. There is an approximately 200 mg/kWh increase of the NOx emissions, and 3 orders of magnitude increase of the PN. Although not reported, the 10 to 23 nm particles were only 1% higher than the 23 nm regeneration emissions. For the non-regenerating cycles, the 10 to 23 nm particles were 80% higher (but the absolute levels very low, around 1.5 × 10¹⁰ #/km).
For the specific vehicle, regeneration was triggered after approximately 1400 km of driving. The regeneration lasted < 30 min during the motorway driving (< 40 km), thus a first approximation to include the regeneration missions would be to increase the emissions without regeneration by 40/1400 (3%) of the emissions during the regeneration. For gaseous pollutants the contribution is negligible. For PN, the regeneration would bring the emission levels to 5–6 × 10¹¹ p/km. The results are in agreement with a study on PN regeneration emissions from heavy-duty vehicles [23].

4.5. Outlook

The mean power demand was, in many cases, below 20% (see Table 1), the level below which the test emissions are not taken into account fort the current in-service conformity (ISC) pass-fail evaluation (step C). However, they were always > 10%, the limit for new vehicle types per September 2018 and for all vehicles after 1 September 2019 (Step D). The next amendment (step E) will also include cold start, and will thus cover the majority of the emission events. What also needs to be considered in the future is the type of cycle that is used to assess the emissions of refuse trucks, as it should be more representative of the actual use of the vehicle.
In closing, sustaining such powertrains (diesel refuse trucks) in cities will need further reduction of the actual NOx emissions (the rest of the pollutants were very low). It was shown that compared to older technologies there is a huge improvement; nevertheless, the ultimate goal is to reach almost zero emission levels. The same applies to other diesel heavy-duty trucks which usually have high emissions under city conditions [14,21,35]. One approach is using compressed natural gas (CNG) vehicles that had lower NOx emissions than diesel vehicles [9,10,13,37,38]. However, whether this is still true compared to the Euro VI diesel vehicles has to be investigated [14]. Other concepts such as hybridization need to be evaluated in the future, as in some cases they show reductions [13,35], but concerns regarding the operating temperature of the after-treatment devices were also raised [13].

5. Conclusions

The emissions (NOx, CO, HC, particle number PN) of a Euro VI (step C) diesel refuse collection vehicle were measured on the road using a portable emissions measurement system (PEMS) and on the chassis dynamometer, using in addition laboratory grade analyzers and a Fourier-transform infrared spectroscopy (FTIR) system. The test cycles were in-service conformity and refuse collection cycles.
Firstly, the assessment of the gas PEMS with the laboratory analyzers gave differences of up to 50 mg/kWh for NOx. However, the results were corrected for zero drift (approximately 50–100 mg/kWh), something permitted in the heavy-duty regulation, but not in the light-duty one.
Secondly, the NOx emissions measured on the road were similar (within 35% for emissions > 100 mg/km) of the emissions measured in the laboratory, even though the emission levels had a wide range (5–2030 mg/km).
Thirdly, the results showed that the vehicle respected the Euro VI certification limits in all cases (number in brackets the ratio to the certification limit): NOx < 400 mg/kWh (0.87), CO < 850 mg/kWh (0.21), HC < 12 mg/kWh (0.08), PN < 2.4 × 10¹⁰ p/kWh (0.04).
A comparison with the emissions of other diesel refuse trucks reported in the literature showed that it is one of the lowest emitting vehicles (700 mg/km vs. reported range 400–10200 mg/km). Including the regeneration events in the emissions increased the PN significantly, but the emissions still remained below the limit of 6 × 10¹¹ p/kWh. Additional pollutants such as NH3 and N2O were also low. The NH3 emissions (the average around 6 ppm) were even lower than the laboratory Euro VI type-approval limit of 10 ppm. The N2O emissions ranged between 40 and 80 mg/kWh.
Although the results of this study cannot be generalized to other vehicles, they show that Euro VI diesel vehicles can still be suitable as refuse collection vehicles.

Author Contributions

Conceptualization, G.M. and R.T.; methodology, B.G., R.G., M.C., A.P.; formal analysis, B.G.; data curation, B.G., R.G., M.C., T.L., F.F.; writing—original draft preparation, B.G.; writing—review and editing, R.G., T.L., L.B., A.P., G.M.; supervision, A.P., G.M.

Funding

This research received no external funding.

Acknowledgments

The authors would like to thank Mauro Cadario, Andrea Bonamin, Alessandro Zappia, Giancarlo Peruccio for their experimental support.

Conflicts of Interest

The authors declare no conflict of interest.

Disclaimer

The opinions expressed in this manuscript are those of the authors and should in no way be considered to represent an official opinion of the European Commission. Mention of trade names or commercial products does not constitute endorsement or recommendation by the authors or the European Commission.

Appendix A

This Appendix summarizes the Euro VI in-service conformity (ISC) requirements. According to the moving average (MAW) method, the pollutant emissions are integrated over windows which reach the reference engine work or CO2 mass emissions of the specific engine in the engine dynamometer type approval test (WHTC). The calculation is then repeated for each second. The requirements are summarized in Table A1. EMROAD is a calculation tool that can be used to analyze the data.
Table A1. Most important Euro VI in-service conformity (ISC) requirements.
Euro VI (ISC)Step A–CStep D
Regulation582/2011 [3]2016/1718 [4], 2018/932 [5]
Duration5 × WHTC4–8 × WHTC
Payload50–60%10–100%
Definition U, R, MSpeed < 50, 50–75, > 75 km/hMap or first acceleration
Time shares U, R, M20%, 25%, 55%30%, 25%, 45%
Mean speeds U, R, M-15–30, 45–70, > 70 km/h
OrderU → R → M (recommended)U → R → M
Cold start inclusionNoNo
Starting Tcoolantany< 30 °C
Evaluation starts atTcoolant > 70 °CTcoolant > 70 °C
Evaluation methodMAWMAW
MAW power threshold > 20% > 10%
Cumulative percentile MAW90%90% 1
1 The test is not valid if three are no valid windows left in urban operation after the 90 percentile rule has been applied. WHTC = World harmonized U = Urban; R = Rural; M = Motorway; MAW = Moving average window.

Appendix B

This Appendix gives the PEMS uncertainty of heavy-duty vehicles based on the analysis that was conducted for light-duty vehicles [16]. The uncertainty values were taken from the regulation requirements regarding accuracy, linearity etc. No drift uncertainty was considered because drift correction was applied in our results. The final theoretical uncertainty of 68.8 mg/kWh (15%) (Figure A1) is in line with the one found experimentally (Figure 3).
Figure A1. PEMS measurement uncertainty for heavy-duty vehicles.
Sustainability 11 01067 g0a1

References

  1. European Environmental Agency. Air Quality in Europe 2018; EEA: Copenhagen, Denmark, 2018. [Google Scholar]
  2. Wagner, W.; Rutherford, D. Survey of best practices in emission control of in-use heavy-duty diesel vehicles. In International Council Clean Transportation (ICCT) Report; ICCT: Washington, DC, USA, 2013. [Google Scholar]
  3. European Commission. Commission regulation (EU) No 582/2011 of 25 May 2011 implementing and amending regulation (EC) No 595/2009 of the European Parliament and of the Council with respect to emissions from heavy-duty vehicles (Euro VI) and amending annexes I and III to directive 2007/46/EC of the European Parliament and of the Council. Off. J. Eur. Union 2011, L167, 1–168. [Google Scholar]
  4. European Commission. Commission regulation. (EU) 2016/1718 of 20 September 2016 amending regulation (EU) No 582/2011 with respect to emissions from heavy-duty vehicles as regards the provisions on testing by means of portable emission measurement systems (PEMS) and the procedure for the testing of the durability of replacement pollution control devices. Off. J. Eur. Union 2016, L259, 1–41. [Google Scholar]
  5. European Commission. Commission regulation (EU) 2018/932 of 29 June 2018 amending regulation (EU) No 582/2011 as regards the provisions on testing by means of portable emission measurement systems (PEMS) and the requirements for universal fuel range type-approval. Off. J. Eur. Union 2018, L165, 32–34. [Google Scholar]
  6. Mendoza-Villafuerte, P.; Suarez-Bertoa, R.; Giechaskiel, B.; Riccobono, F.; Bulgheroni, C.; Astorga, C.; Perujo, A. NOx, NH3, N2O and PN real driving emissions from a Euro VI heavy-duty vehicle. Impact of regulatory on-road test conditions on emissions. Sci. Total Environ. 2017, 609, 546–555. [Google Scholar] [CrossRef] [PubMed]
  7. Farzaneh, M.; Zietsman, J.; Lee, D.-W. Evaluation of in-use emissions from refuse trucks. Transport. Res. Rec. J. Transport. Res. Board 2009, 2123, 38–45. [Google Scholar] [CrossRef]
  8. Sandhu, G.; Frey, C.; Bartelt-Hunt, S.; Jones, E. In-use activity, fuel use, and emissions of heavy-duty diesel rolloff refuse trucks. J. Air Waste Manag. Assoc. 2015, 65, 306–323. [Google Scholar] [CrossRef] [PubMed]
  9. López, J.; Flores, N.; Jiménez, F.; Aparicio, F. Emissions pollutant from diesel, biodiesel and natural gas refuse collection vehicles in urban areas. In Highway and Urban Environment. Alliance for Global Sustainability Bookseries (Science and Technology: Tools for Sustainable Development); Rauch, S., Morrison, G., Monzén, A., Eds.; Springer: Dordrecht, The Netherlands, 2009; Volume 17, pp. 141–148. [Google Scholar]
  10. Fontaras, G.; Martini, G.; Manfredi, U.; Marotta, A.; Krasenbrink, A.; Maffioletti, F.; Terenghi, R.; Colombo, M. Assessment of on-road emissions of four Euro V diesel and CNG waste collection 2 trucks for supporting air-quality improvement initiatives in the city of Milan. Sci. Total Environ. 2012, 1(426), 65–72. [Google Scholar] [CrossRef]
  11. Sandhu, G.; Frey, H.; Bartelt-Hunt, S.; Jones, E. In-use measurement of the activity, fuel use, and emissions of front-loader refuse trucks. Atmos. Environ. 2014, 92, 557–565. [Google Scholar] [CrossRef]
  12. Sandhu, G.; Frey, H.; Bartelt-Hunt, S.; Jones, E. Real-world activity, fuel use, and emissions of diesel side-loader refuse trucks. Atmos. Environ. 2016, 129, 98–104. [Google Scholar] [CrossRef]
  13. Misra, C.; Ruehl, C.; Collins, J.; Chernich, D.; Herner, J. In-use NOx emissions from diesel and liquefied natural gas refuse trucks equipped with SCR and TWC, respectively. Environ. Sci. Technol. 2017, 51, 6981–6989. [Google Scholar] [CrossRef]
  14. Vermeulen, R.; van Gijlswijk, R.; van Heesen, D.; Buskermolen, E.; Verbeek, R.; van Goethem, S. Tail-pipe NOx emissions of refuse collection vehicles with a Euro VI engine in daily operation in The Netherlands. TNO Report 2018 R10313v2. 2018. Available online: publications.tno.nl/publication/34626702/B6Ih3F/TNO-2018-R10313-vs2.pdf (accessed on 11 February 2019).
  15. Sharp, C.; Feist, M.; Laroo, C.; Spears, M. Determination of PEMS measurement allowances for gaseous emissions regulated under the heavy-duty diesel engine in-use testing program. Part 3—results and validation. SAE Int. J. Fuels Lubr. 2009, 2, 407–421. [Google Scholar] [CrossRef]
  16. Giechaskiel, B.; Clairotte, M.; Valverde-Morales, V.; Bonnel, P.; Kregar, Z.; Franco, V.; Dilara, P. Framework for the assessment of PEMS (portable emissions measurement systems) uncertainty. Environ. Res. 2018, 166, 251–260. [Google Scholar] [CrossRef]
  17. Johnson, K.; Durbin, T.; Cocker III, D.; Miller, W.; Bishnu, D.; Maldonado, H.; Moynahan, N.; Ensfield, C.; Laroo, C. On-road comparison of a portable emission measurement system with a mobile reference laboratory for a heavy duty diesel vehicle. Atmos. Environ. 2009, 43, 2877–2883. [Google Scholar] [CrossRef]
  18. Cao, T.; Durbin, T.; Cocker, D., III; Wanker, R.; Schimpl, T.; Pointner, V.; Oberguggenberger, K.; Johnson, K. A comprehensive evaluation of a gaseous portable emissions measurement system with a mobile laboratory. Emiss. Control Sci. Technol. 2016, 2, 173–180. [Google Scholar] [CrossRef]
  19. Sensors, Semtech DS. Available online: http://www.sensors-inc.com/Products/SEMTECH/DS_Plus_Heavy_Duty (accessed on 11 February 2019).
  20. O’Driscoll, R.; Stettler, M.; Molden, N.; Oxley, T.; ApSimon, H. Real world CO2 and NOx emissions from 149 Euro 5 and 6 diesel, gasoline and hybrid passenger cars. Sci. Total Environ. 2018, 621, 282–290. [Google Scholar] [CrossRef]
  21. Grigoratos, T.; Fontaras, G.; Giechaskiel, B.; Zacharof, N. Real world emissions performance of heavy-duty Euro VI diesel vehicles. Atm. Environ. 2019, 201, 348–359. [Google Scholar] [CrossRef]
  22. TSI, NPET. Nanoparticle Emission Tester Model 3795. Available online: https://www.tsi.com/products/particle-counters-and-detectors/engine-exhaust-particle-counters/nanoparticle-emission-tester-model-3795/ (accessed on 11 February 2019).
  23. AVL, AMA i60. Available online: https://www.avl.com/testing-solutions-for-tractors/-/asset_publisher/gYjUpY19vEA8/content/avl-ama-i60-exhaust-measurement-system (accessed on 11 February 2019).
  24. Testo, ViPR. Available online: https://www.testo.com/en-US/testo-vipr/p/1122B (accessed on 11 February 2019).
  25. TSI, CPC 3790. Available online: http://tsi.com/engine-exhaust-condensation-particle-counter-3790/ (accessed on 11 February 2019).
  26. Airmodus, CPC A20. Available online: https://airmodus.com/a20-condensation-particle-counter/ (accessed on 11 February 2019).
  27. AVL. FTIR Sesam. Available online: https://www.avl.com/testing-solutions-for-large-engines/-/asset_publisher/gYjUpY19vEA8/content/avl-sesam-i60-ft-multi-component-exhaust-measurement-system (accessed on 11 February 2019).
  28. Giechaskiel, B. Solid particle number emission factors of Euro VI heavy-duty vehicles on the road and in the laboratory. Int. J. Environ. Res. Public Health 2018, 15, 304. [Google Scholar] [CrossRef]
  29. Varella, R.; Giechaskiel, B.; Sousa, L.; Duarte, G. Comparison of portable emissions measurement systems (PEMS) with laboratory grade equipment. Appl. Sci. 2018, 8, 1633. [Google Scholar] [CrossRef]
  30. Giechaskiel, B.; Riccobono, F.; Vlachos, T.; Mendoza-Villafuerte, P.; Suarez-Bertoa, R.; Fontaras, G.; Bonnel, P.; Weiss, M. Vehicle emission factors of solid nanoparticles in the laboratory and on the road using portable emission measurement systems (PEMS). Front. Environ. Sci. 2015, 3, 82. [Google Scholar] [CrossRef]
  31. Zhang, W.; Lu, J.; Zhang, Y. Moving towards sustainability: road grades and on-road emissions of heavy-duty vehicles—A case study. Sustainability 2015, 7, 12644–12671. [Google Scholar] [CrossRef]
  32. Baldino, C.; Tiegte, U.; Muncrief, R.; Bernard, Y.; Mock, P. Road Tested: Comparative Overview of Real-World versus Type-Approval NOx and CO2 Emissions from Diesel Cars in Europe. White paper of International Council on Clean Transportation Europe (ICCT); International Council on Clean Transportation Europe (ICCT): Berlin, Germany, September 2017. [Google Scholar]
  33. Altshuler, S.; Ayala, A.; Collet, S.; Chow, J.; Frey, C.; Shaikh, R.; Stevenson, E.; Walsh, M.; Watson, J. Trends in on-road transportation, energy, and emissions. J. Air Waste Manag. Assoc. 2018, 68(10), 1015–1024. [Google Scholar] [CrossRef] [PubMed]
  34. EPA; NHTSA. Greenhouse Gas Emissions Standards and Fuel Efficiency Standards for Medium- and Heavy-Duty Engines and Vehicles—Phase 2. Regulatory Impact Analysis. Final rule. EPA-420-R-16-900; EPA and NHTSA: Washington, DC, USA, 2016. [Google Scholar]
  35. Liu, D.; Lou, D.; Liu, J.; Fang, L.; Huang, W. Evaluating nitrogen oxides and ultrafine particulate matter emission features of urban bus based on real-world driving conditions in the Yangtze river delta area, China. Sustainability 2018, 10, 2051. [Google Scholar] [CrossRef]
  36. Boriboonsomsin, K.; Durbin, T.; Scora, G.; Johnson, K.; Sandez, D.; Vu, A.; Jiang, Y.; Burnette, A.; Yoon, S.; Collins, J.; Dai, Z.; Fulper, C.; Kishan, S.; Sabisch, M.; Jackson, D. Real-world exhaust temperature profiles of on-road heavy-duty diesel vehicles equipped with selective catalytic reduction. Sci. Total Environ. 2018, 634, 909–921. [Google Scholar] [CrossRef] [PubMed]
  37. Karavalakis, G.; Jiang, Y.; Yang, J.; Hajbabaei, M.; Johnson, K.; Durbin, T. Gaseous and Particulate Emissions from a Waste Hauler Equipped with a Stoichiometric Natural Gas Engine on Different Fuel Compositions; SAE Technical Paper, 2016-01-0799; Society of Automotive Engineers, Inc.: Detroit, MI, USA, 2016. [Google Scholar]
  38. Grigoratos, T.; Fontaras, G.; Martini, G.; Peletto, C. A study of regulated and greenhouse gas emissions from a prototype heavy-duty compressed natural gas engine under transient and real life conditions. Energy 2016, 103, 340–355. [Google Scholar] [CrossRef]
Figure 1. Experimental setup. PEMS = Portable emissions measurement system; PN = Particle number; EFM = Exhaust flow meter; VPR = Volatile particle remover; CPC = Condensation particle counter.
Sustainability 11 01067 g001
Figure 2. Test cycles: ISC-like = In-Service Conformity like cycle with engine cold start consisting of urban (U), rural (R), and motorway (M) parts. In some cases, there was regeneration at the last part of the motorway part (M-Reg). City-Sim = the simulated refuse collection and refuse compactions cycle with engine hot start. City = The actual Milan City refuse collection cycle consisting of the approach to the city (Approach), the refuse collection and compaction (Collection) and the return to the depot (Return) parts.
Sustainability 11 01067 g002
Figure 3. (a) Comparison of Portable Emissions Measurement System (PEMS) exhaust flow meter (EFM) with dilution tunnel constant volume sampler (CVS) based estimation of exhaust flow rate. (b) Comparison of PEMS, Fourier-transform infrared spectroscopy (FTIR) and laboratory grade tailpipe analyzers with dilution tunnel (CVS) analyzers for NOx. Each point is one test of a part (phase) of a cycle.
Sustainability 11 01067 g003
Figure 4. Maximum (from 2 repetitions) vehicle integrated emissions including engine cold start expressed. (a) Emissions per kWh (b) Emissions per km. Results are from on-road measurements with Portable Emissions Measurement System (PEMS). Although not applicable, the laboratory Euro VI engine limits are given with dashed lines. For vehicles, an additional multiplication factor of 1.5 is applied to the limits.
Sustainability 11 01067 g004
Figure 5. NOx emissions measured with the Portable Emissions Measurement System (PEMS) in the laboratory (left blue bars) and on the road (right red bars). Error bars show max-min values of 2 repetitions. Dashed boxes indicate the complete cycle. The U-Cold and Approach parts start with cold engine. The laboratory temperature was 20 °C, while the ambient temperature at the on-road tests was between 2 °C and 14 °C.
Sustainability 11 01067 g005
Figure 6. (a) NH3 concentrations and (b) N2O emissions, as measured with the Fourier-transform infrared spectroscopy (FTIR) in the laboratory. Error bars show max-min values of 2 repetitions.
Sustainability 11 01067 g006
Table 1. Daimler Econic NGE-L62N Farid T23C engine characteristics.
Technical DataOM936 LA
TypeCompression Ignition with turbocharger and EGR
Fuel injection systemCommon rail
Vehicle mass empty/max (kg)15500/26000
Displacement (cm3)7698
Cylinders6 in-line
Engine max power 220 kW at 2200 rpm
Engine max torque 1200 Nm at 1200–1600 rpm
AftertreatmentDOC + DPF + SCR
Production year6/2018
Mileage3200
Emission standardEuro VI step C
EGR = Exhaust gas recirculation; DOC = diesel oxidation catalyst; DPF = Diesel Particulate filter; SCR = Selective catalytic reduction.
Table 2. Statistics of test cycles (see Figure 2). W/D = Work/Distance. The City part includes actual refuse compaction, while the City-Sim only the compaction action (without refuse inside).
ParameterU-ColdURMM-RegCity-SimAppr.Coll.Ret.
Duration (s)90012001230693018003100900131002000
Duration fraction8.8%11.7%12.0%67.5%17.5%100%5.6%81.9%12.5%
Distance (km)6.111.116.615639.811.27.621.29.0
Distance fraction3.2%5.8%8.7%82.2%21.0%100%20.1%56.1%23.8%
Engine off (%time)< 2%0%0%0%0%0%4%5%2%
Idling (%time)11%6%12%0%0%38%19%56%45%
Mean speed (km/h)24.534.348.681.079.613.030.45.816.2
Mean/Max power18%18%25%37%38%15%25%13%16%
W/D (kWh/km)1.521.211.141.011.082.231.795.102.17
Mean TSCR (°C)147222248245494218149245256
Tamb (road) (°C)2–72–72–72–72–710–146–76–76–7
Tamb (lab) (°C)202020202020202020
Table 3. Characteristics of the equipment. The span range used (not the maximum of the instrument) for the Portable Emissions Measurement System (PEMS) is also given. Note that the laboratory grade analyzers have many ranges and select automatically the appropriate one.
TechnologyPEMS Laboratory (Tailpipe and Diluted)
Gas analyzers
ManufacturerSensors Inc.AVL GmbH
ModelSemtech-DSAMA i60
CO2 principle (range)NDIR (14%)NDIR
CO principle (range)NDIR (3000 ppm)NDIR
NO principle (range)NDUV (2000 ppm)CLD
NO2 principle (range)NDUV (500 ppm)CLD
Total HC (range)FID (250 ppm)FID
Exhaust flowEFM pitot 4 inchesCVS—dilution air
PN analyzers
ManufacturerHORIBATesto
ModelMod. NPETNanomet 1 (ViPR)
Thermal pre-treatmentCatalytic stripper (350 °C)Evaporation tube (350 °C)
Detection principleCPC 23 nmCPC 23 nm and 10 nm
NDIR: Non-dispersive infrared detection; CLD: Chemiluminescence detection, NDUV: Non-dispersive ultraviolet; FID = Flame ionization detector; EFM: Exhaust flow meter; CVS = Constant volume sampler; NPET = Nanoparticle tester; CPC = Condensation particle counter.
Table 4. NOx emissions of refuse collection vehicles over actual operation cycles.
Emissions LevelNo. VehiclesNOx [g/km]Mean Speed [km/h]Reference
MY 2002–2006313.5–24.0 116–25 2[7]
MY 2005–2007410.5–12.420–27[8]
MY 2004–201065.6–12.415–30[11]
MY 2003–201054.0–30.415–17[12]
MY 2012 321.0–2.022–27[8]
MY 2012 311.212[12]
MY 2010 323.4–8.2 49–15[13]
MY 2012 3 (hybrid)11.9 47–9[13]
Euro IV118.1–25.5n/a[9]
Euro V132.36–8[10]
Euro VI 370.4–10.26–27[14]
Euro VI 310.78–9This study
1 Estimated from distance percentages and emissions per mile from each part of the cycle. 2 Estimated from time percentages and average speed from each part of the cycle. 3 With Selective Catalytic Reduction (SCR). 4 Estimated from reported g/bhp-h, bhp-h and distance. MY = Model Year.
Table 5. Emissions at the motorway part with and without regeneration.
PollutantLaboratoryOn-Road
RegenerationNoYesNoYes
Distance (km)43.343.641.639.8
CO (mg/km)2505831160905
NOx (mg/km)17287271395
HC (mg/km)0104
PN × 1011 (#/km)0.151190.19144
Texh (°C)226448194385
TSCR (°C)264508249494

