Article

An Assessment Framework for Grassland Ecosystem Health with Consideration of Natural Succession: A Case Study in Bayinxile, China

1
Grassland Research Institute, Chinese Academy of Agricultural Sciences, Hohhot 010010, China
2
Graduate School of Chinese Academy of Agricultural Sciences, Beijing 100081, China
3
Grassland Investigation and Planning Institute of Inner Mongolia, Hohhot 010051, China
*
Author to whom correspondence should be addressed.
Sustainability 2019, 11(4), 1096; https://0-doi-org.brum.beds.ac.uk/10.3390/su11041096
Submission received: 20 November 2018 / Revised: 27 January 2019 / Accepted: 28 January 2019 / Published: 19 February 2019
(This article belongs to the Section Environmental Sustainability and Applications)

Abstract

:
Grassland health assessment is the basis for formulating grassland protection policy. However, there are few assessment methods that consider the angle of natural succession for northern China’s regional native grassland with excessive human activities. The main purpose of this study is to build an assessment system for these areas from the perspective of natural succession. Besides, the minimal cumulative resistance (MCR) model was used to extract potential ecological information from the study area as a supplementary reference for the assessment results. The result for Bayinxile pasture, a typical semiarid steppe with excessive human activities located in northern China, showed that: (1) The ecological function of eastern hilly area was better than that of other regions and the western area was lowest as a whole. (2) The river was the most important ecological network in the whole grassland in that it was of vital significance in the prevention of retrogressive succession and in the linking of ecological communities. (3) The density of ecological network was closely related to the intensity of human activities, and farmland and roads had great negative influence on the connection of the grassland ecological network. We further proposed an ecological control zone and made suggestions for Bayinxile ecological management to prevent grassland degradation based on the above results. This study should provide a new perspective for grassland health assessment and sustainable development of regional grassland.

Graphical Abstract

1. Introduction

Grassland, being the largest part of the terrestrial ecosystem, has always been the most concentrated area that links other ecosystems together and carries human activities [1]. Moreover, due to its vulnerability, it is also a most problematic ecosystem under the interference of human activities, including grazing, mowing, mining, farming [2], etc. In China, native grasslands cover about 392 million hm2, accounting for 41.7% of the total land area and play a significant role in economic development, ecological security and social stability [3,4]. However, because of the overgrazing and disorderly exploitation that has taken place since the 1950s, the structure and function of grassland have changed, and the necessary ecological function of maintaining ecological processes has declined or has even been lost in some areas [5]. During the period from the 1980s to 2011, more than 90% of available native grassland has degraded in different levels, and moderate desertification and salinization of the grassland area has accounted for 50% of the total grassland in China [5,6]. To prevent grassland degradation, the Chinese government has launched several ecological restoration programs, the “Returning Graze Land to Grassland Program” initiated in 2003 and the “Grassland Ecological Compensation Program” launched in 2011 being especially significant [6]. These initiatives have been effective in grassland recovery overall in China. For better protection, specific measures based on ecological assessment still need to be taken for specific area, especially for the northern China’s grassland, which has insufficient hydrothermal conditions and excessive human activities [7].
As a new perspective in ecological assessment, ecosystem health is a metaphor for the state of the ecosystem and has grown rapidly as a concept in recent years [8]. However, due to the complexity of a human–environmental system, there is no single definition or assessment framework available for ecosystem health [9]. Many researchers have given different opinions from their own fields. Rapport et al. [10] argued that the concept of an ecosystem should emphasize stability and sustainability, and that its health condition should be diagnosed using some indicators, a process similar to that of physical examinations for humans. Costanza [11] suggested that ecosystem health should be closely linked to the idea of sustainability, which implies the ability of the system to maintain its structure (organization) and function (vigor) over time in the face of external stress (resilience). Maron et al. [12] presented an assessment framework for assessing the degree to which the adequate and sustainable provision of a given ecosystem service is threatened. Drobnik et al. [13] proposed an approach to assess ecosystem services by developing a soil quality index based on ecosystem services and soil functions. Raufirad et al. [14] built a system for designing a rangeland vulnerability assessment that captures a set of both socioeconomic and biophysical variables. Sheley et al. [15] provided a method to link the information collected in rangeland health assessment using the successional management framework. With regard to China’s regional grassland, Li et al. [16] modified the Constanza model of vigor, organization and resilience (VOR) and applied it to assess the rangeland health of alpine meadow of the Qinghai–Tibetan plateau. Yan et al. [17] changed the VOR model to the vigor, organization, resilience and service (VORS) model via the introduction of ecosystem services, including water conservation and soil conservation, to assess the ecosystem health of Liao River basin upstream. Qin et al. [18] proposed a method integrating remote sensing and GIS technology to evaluate grassland health in northern China.
Although the methods or theories discussed above have great significance in grassland health assessment, there are still limitations of application on some areas with excessive human activities. First, there are few assessment methods which take into account the natural succession for northern China’s native grassland area, which results in the fact that it is difficult to highlight the influence of some artificial patches, such as cultivated land, roads or mining land, on the ecosystem; second, the application of assessment results fails to go deep enough, which leads to the omission of some crucial information. Therefore, the objective of this study is to build a health assessment framework for northern China’s regional grassland from the angle of natural succession and to enhance the applicability of the assessment results by identifying potential ecological information, including ecological corridor and ecological node, based on the minimal cumulative resistance (MCR) model. The ecological corridor has a function of transmitting ecological flow and restraining negative energy, while the ecological node can be considered as the intersection of an ecological corridor and cumulative maximum cost resistance pathway [19,20].
Bayinxile, located in the northern native grassland of China, is a representative area that is under the disturbance of excessive human activities. Since landscape modification in the 1970s, land-use types such as farmland, construction land and mining areas have been formed here successively, and the natural succession of the original grassland has been influenced and damaged seriously. To assess the ecological value of some man-made patches in a reasonable way, in this study, we built a grassland health assessment system and classified the indicators into positive and negative categories. We propose that grassland should be assessed from a “vigor assessment” and “diseases diagnosis” standpoint respectively to make sure a seemingly healthy “sick ecosystem” could be evaluated more accurately and objectively. Moreover, to use the information in the assessment results effectively and to provide a more scientific basis for regional ecological management, we identified the potential ecological information of Bayinxile using the MCR model and then made suggestions for the study area combined with the assessment results. We hope this study will have an important theoretical and practical significance for grassland management where the natural succession of grassland has been interfered with human activities.

2. Materials and Methods
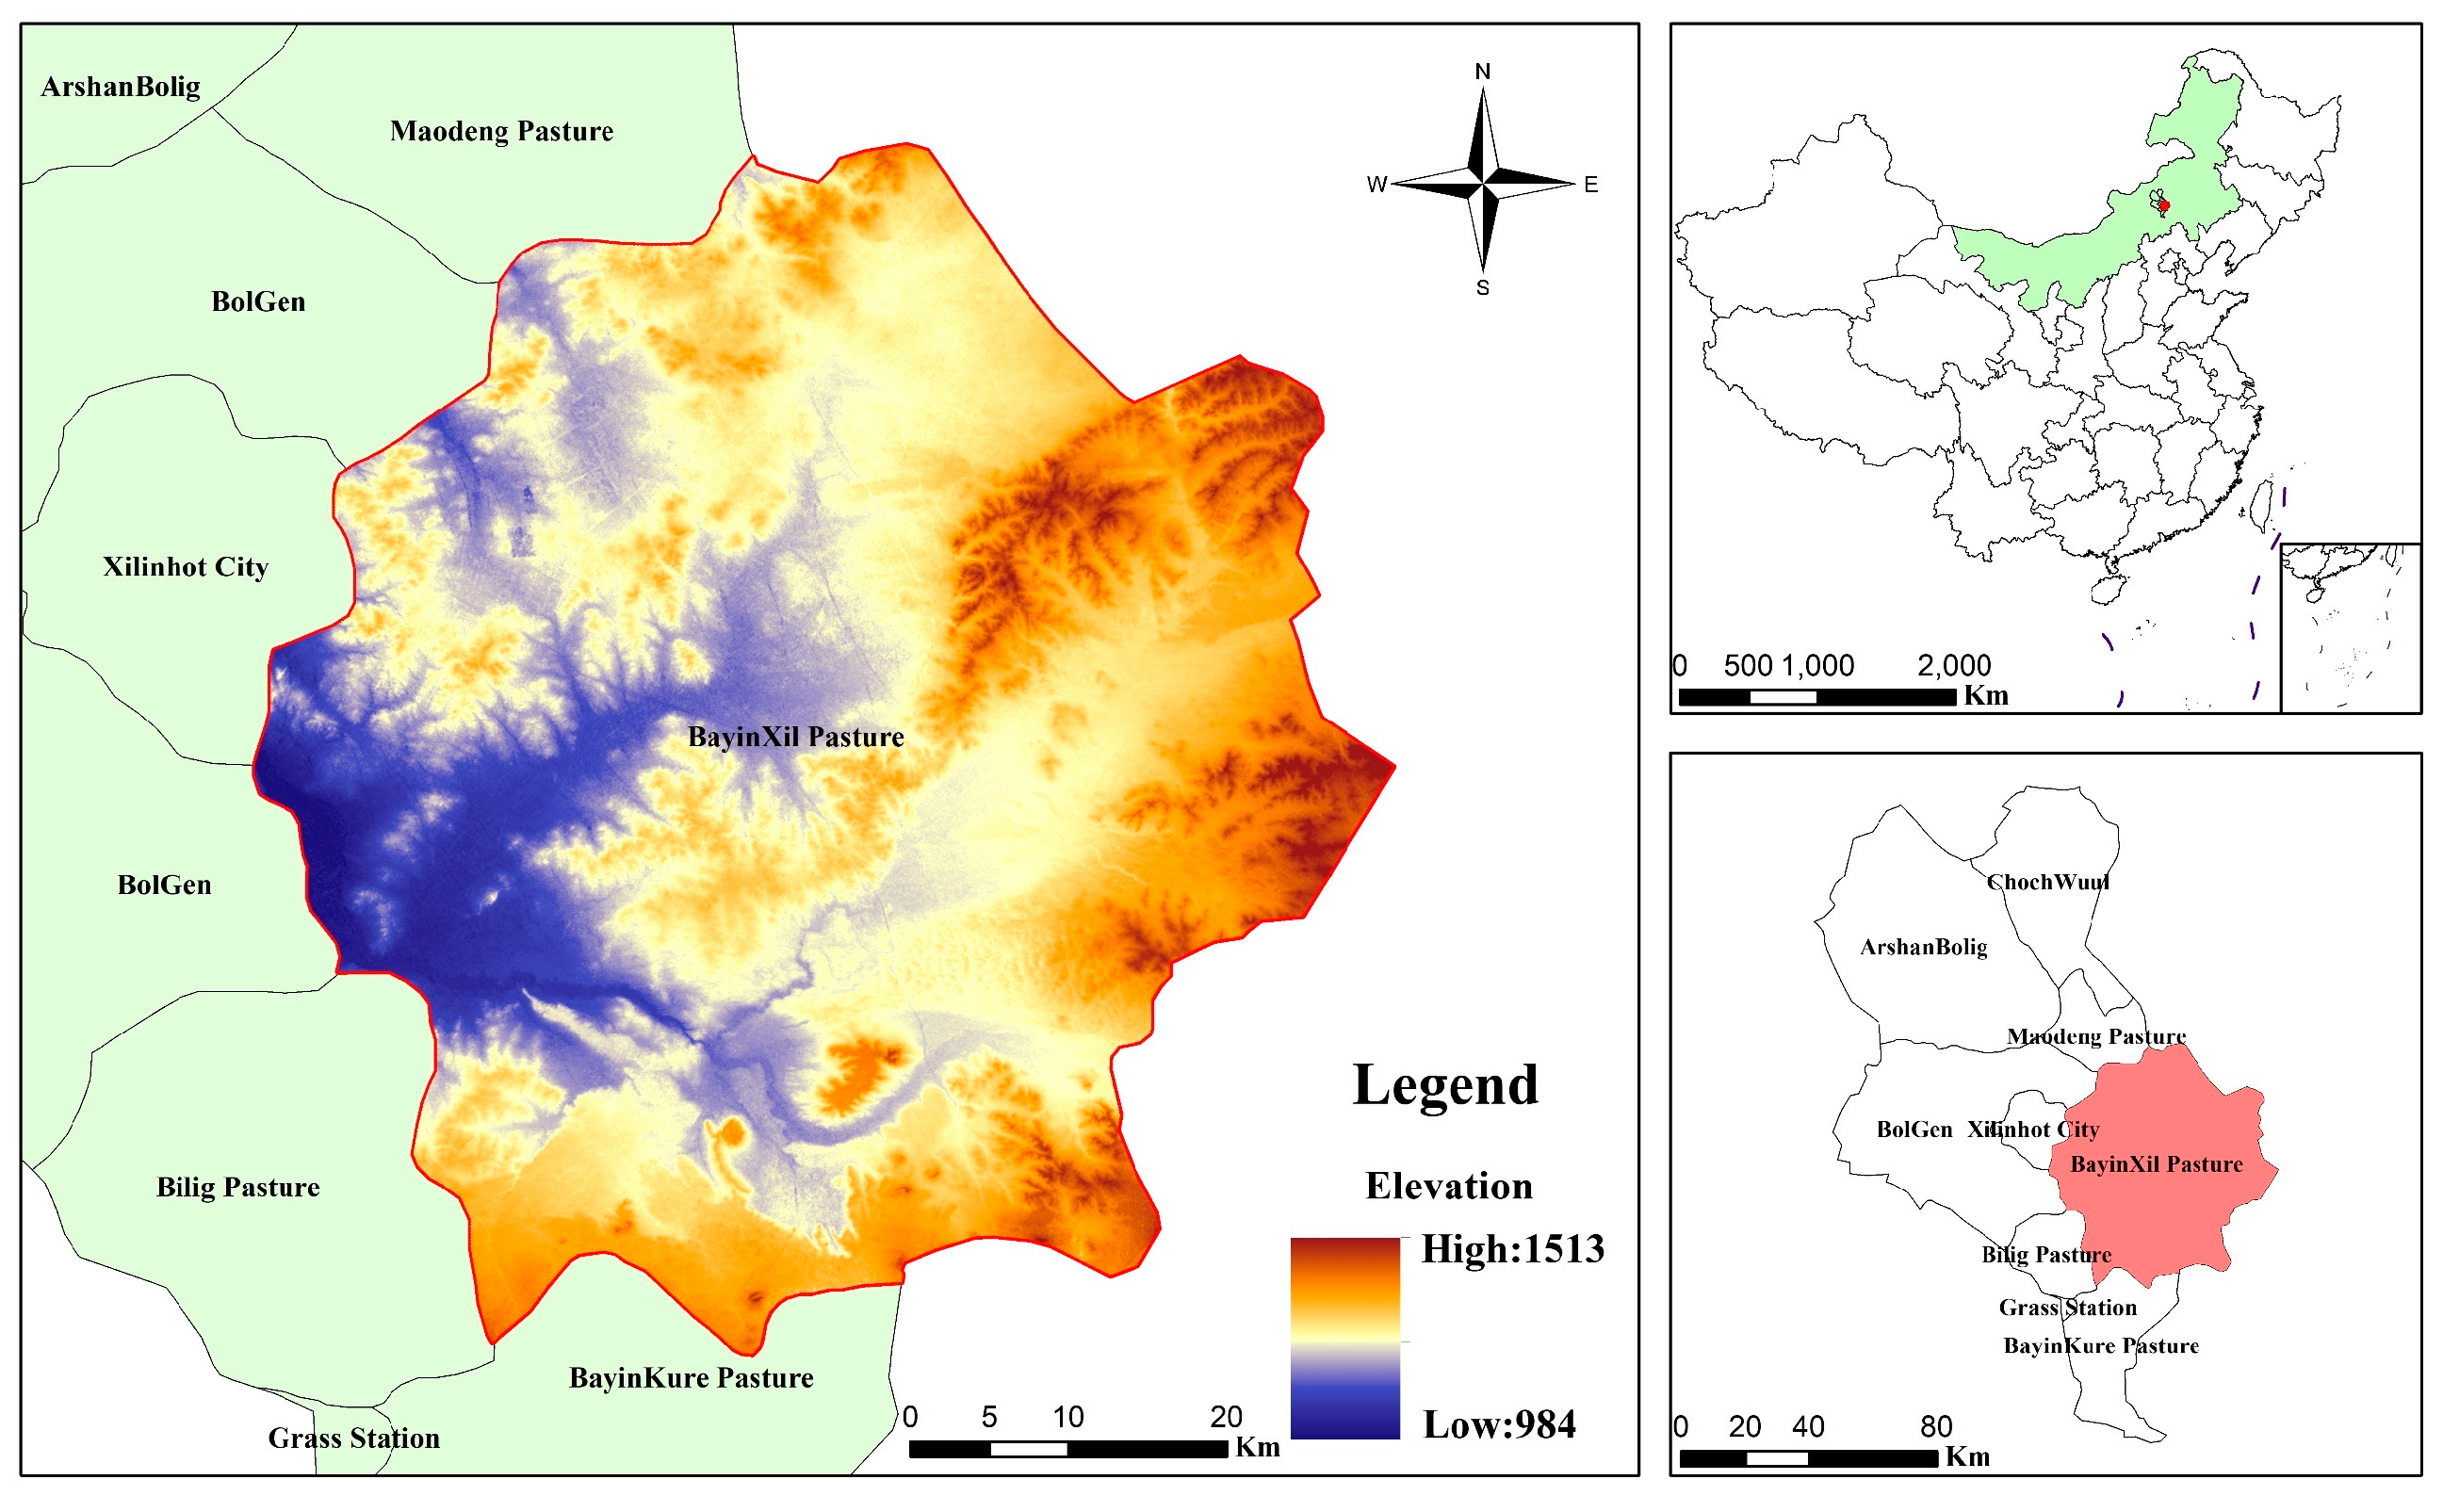
2.1. Study Area

Bayinxile is the western part of Xilinhot, Inner Mongolia, China (43°02′–44°52′ N, 115°18′–117°06′ E), and is the core area of the Xilingol steppe nature reserve (Figure 1). It is located in the mid-latitude westerly airflow belt, with atypical semiarid continental climate in the middle temperate zone. Average annual precipitation is 294.9 mm with a frost-free period of 110 d. The total area of Bayinxile is 3555 km2, with the main land type being rangeland, which mainly consists of warm steppe varieties. The dominant species, Stipa, is widely distributed, with a small area of lowland meadow in the southeast. The terrain declines from east to west being flat in the middle and west, and hilly in the southeast. It has an altitude of 1513 m at the highest point, 984 m in the lowest level with an average altitude of 1150 m.

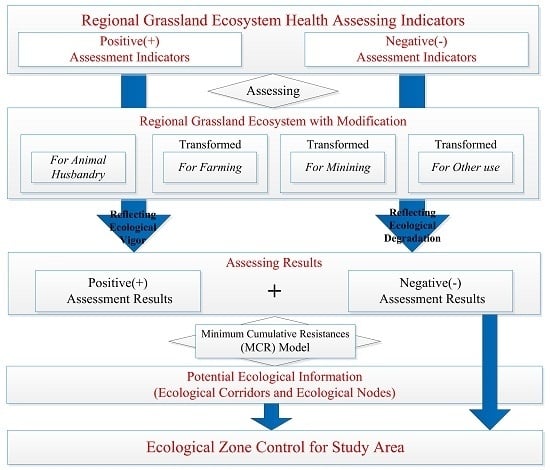
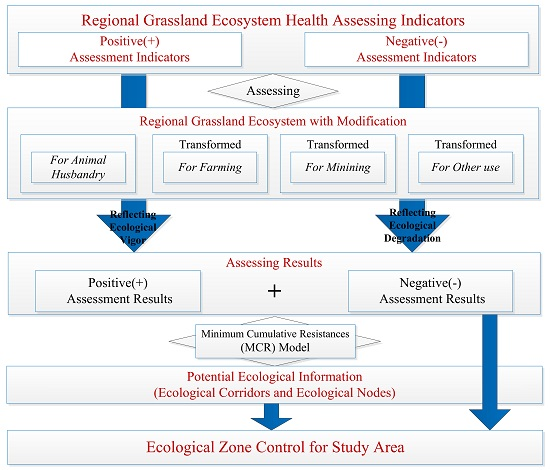
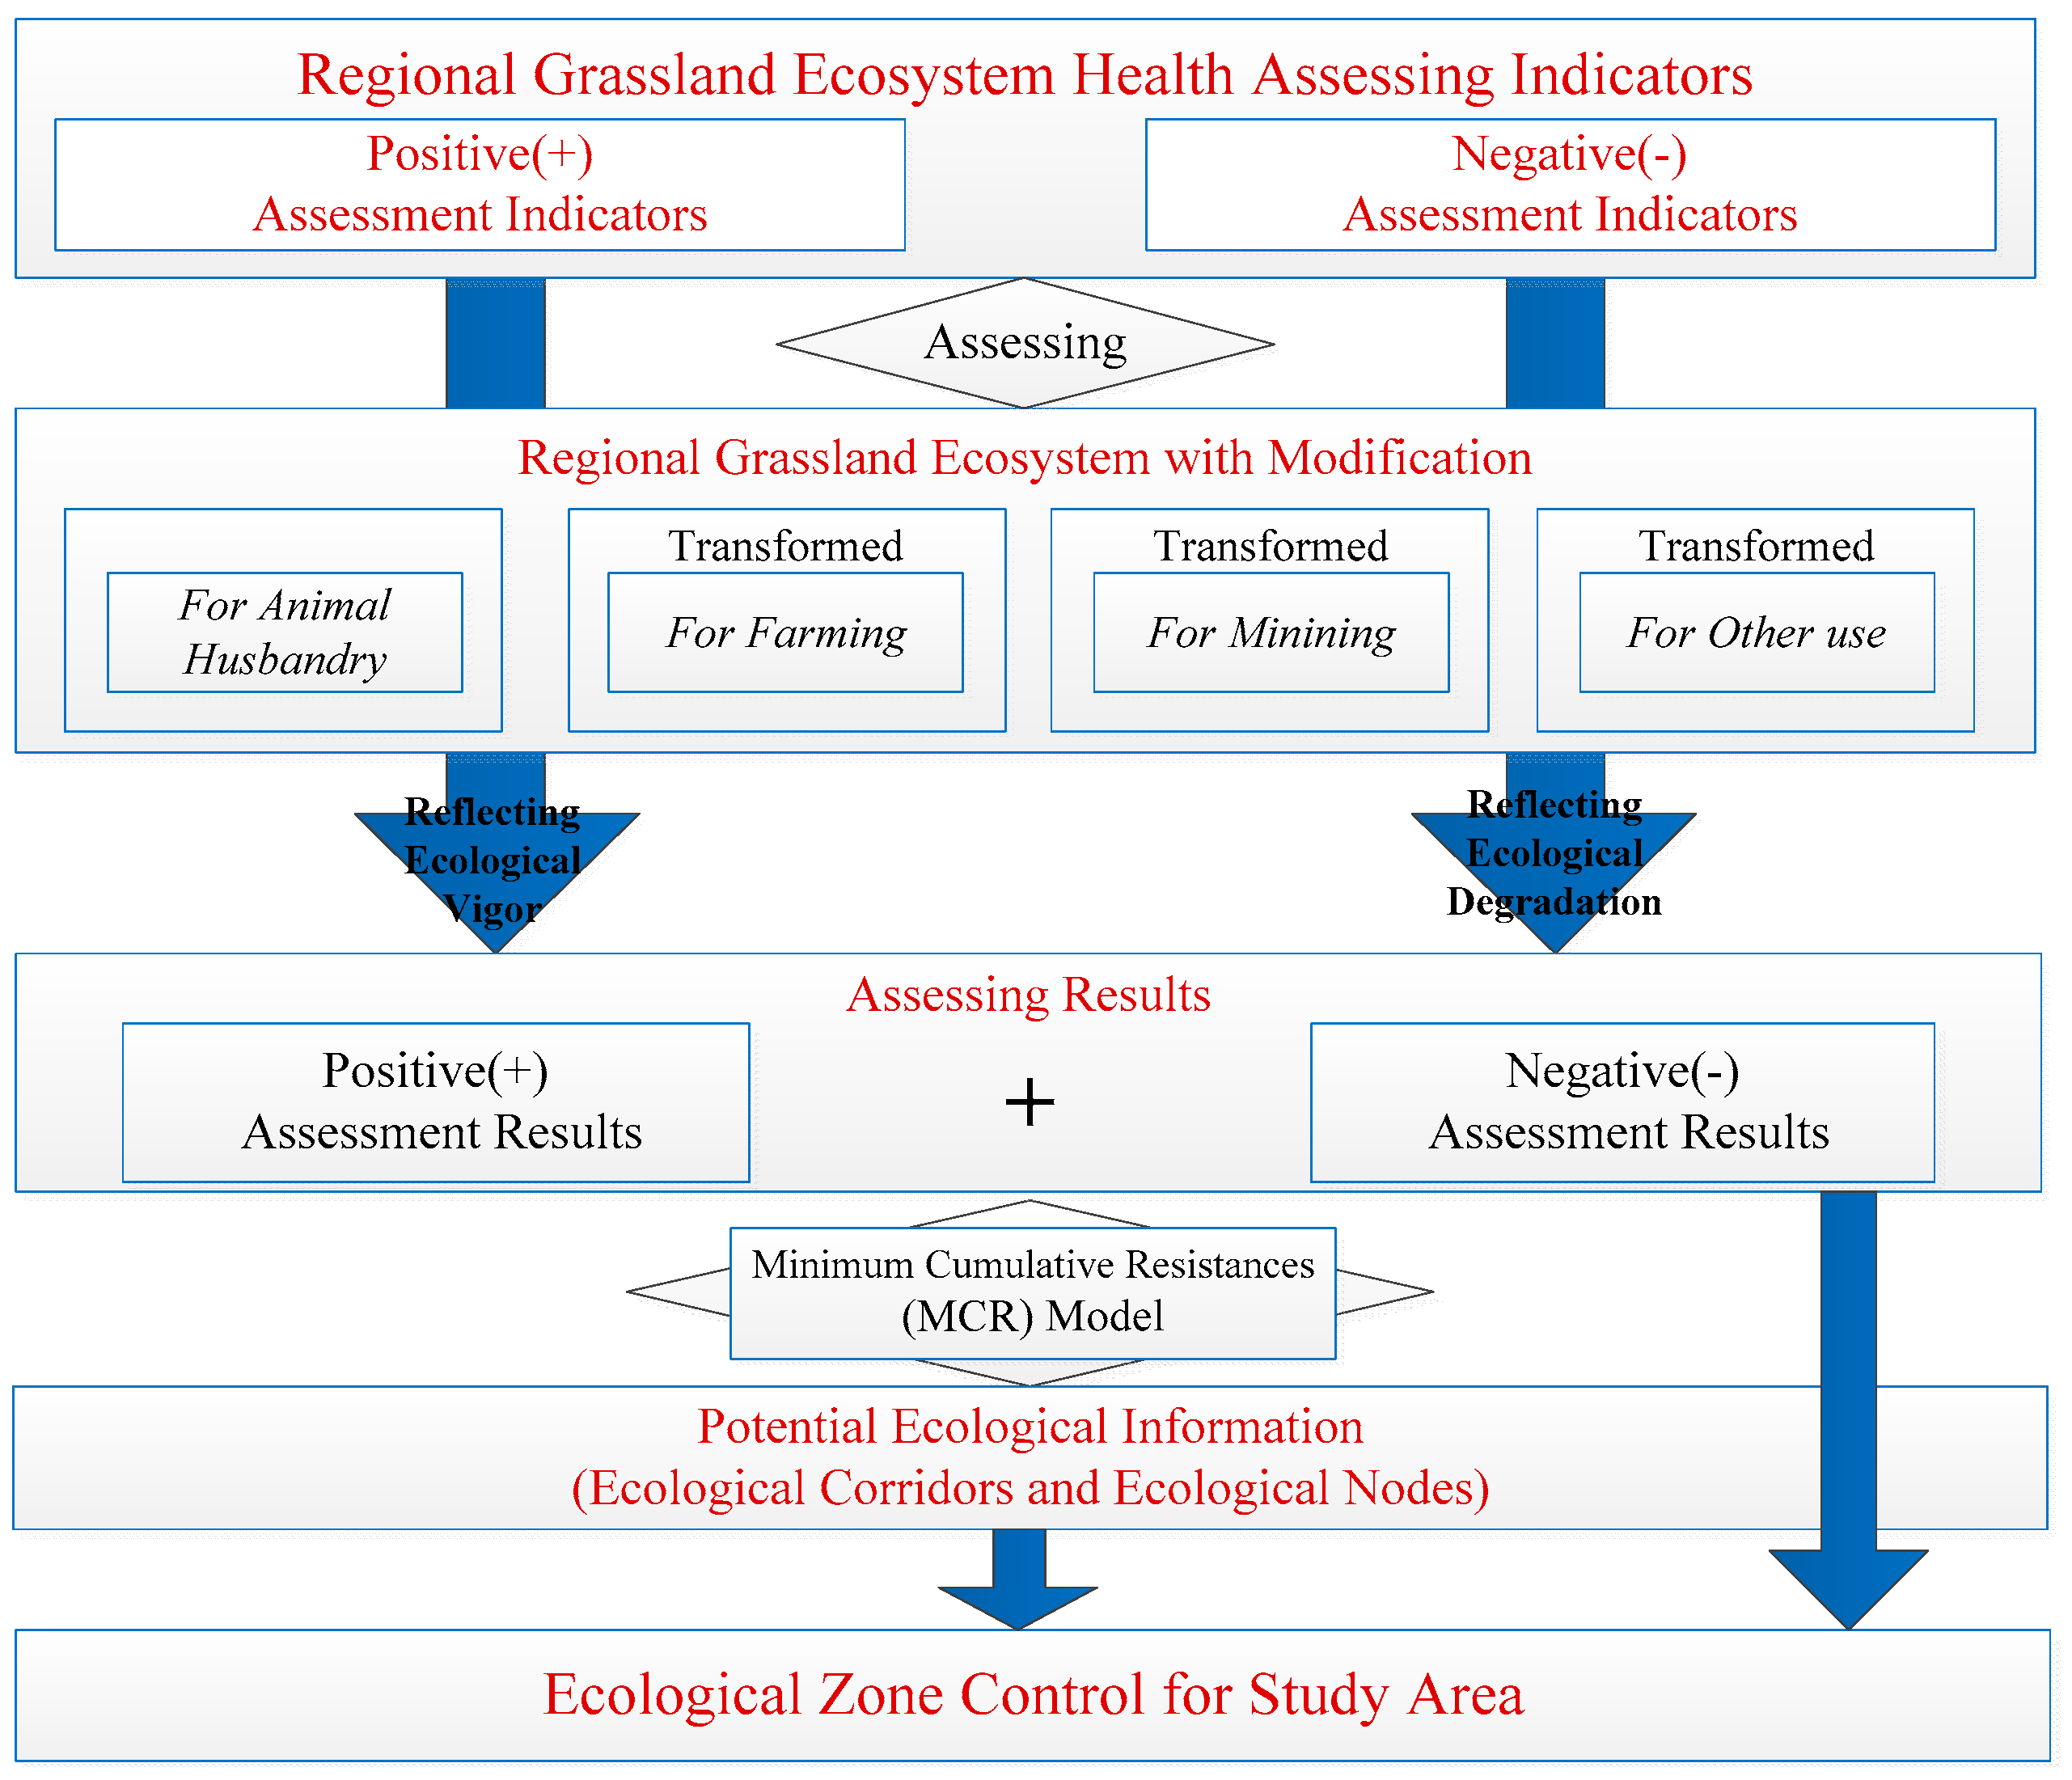
2.2. Building Assessment Framework

The trajectory of grassland successional change can be influenced by regional climatic change, natural disasters, vegetation community competition, soil physical and chemical environment and human disturbance, including grazing, farming, mining, etc. [21,22]. In this study, we adhered to the following principles to select the assessment indicators. Firstly, we took succession as the main line to select the index to reflect the negative impact of human activities on the regional ecosystem. We considered the dominating interference factor for natural succession to be human activities, therefore, both the intensity of human activity and the results of human interference should be taken into account. Additionally, referring to the Constanza (1997) method and what it stated about ecosystem services [23], only the renewable service functions of the ecosystem were considered and the basic function of the system was reflected. Moreover, owing to the implementation of the “grassland ecological compensation award program” started in 2011, grazing and mowing in the study area was considered as a kind of interference within the threshold of the self-regulatory capacity in accordance with the intermediate disturbance hypothesis [24]. Therefore, the effects of grazing and mowing in Bayinxile were not considered to be an act of impeding natural succession. Lastly, some indicators, such as precipitation, were difficult to form heterogeneity on the scale of this study, and other indicators, such as soil heavy metals and underground water, were beyond our current level of data acquisition. Therefore, the selected indicators were not only easy to obtain at the current technical level, but also had differences in the scope of study area.
The process carried out in this study, “building an assessment system—assessing grassland health—identifying the potential ecological information—making proposal for ecological zone control”, is shown in Figure 2. We classified the selected indicators into positive and negative assessment categories. Positive assessment was to reflect the vigor of the grassland ecosystem, and negative assessment was to reflect the degradation processes of the study area. The positive and negative assessment results were obtained respectively by weighted overlapping corresponding index layers, and then final assessment result was found through overlapping the above assessment results. To improve the applicability of the assessment results, we introduced the MCR model to extract the potential ecological information of the study area as a supplementary reference for formulating the ecological management strategy.
We chose plant diversity, climate regulation, water and soil conservation capacity, food supplement, water distribution and entertainment services as the positive assessment indicators. Amongst them, plant diversity was reflected by the species richness Index. Function of climate regulation and soil and water conservation capacity was indirectly reflected by vegetation biomass in this study. According to ecological goods and services, vegetation biomass is positively correlated with the above functions [23,25,26]. Water distribution was reflected by the temperature vegetation dryness index (TVDI). Entertainment service value, which demonstrates the leisure value of natural landscape to human beings, was reflected by density distribution of the tourism spots. Meanwhile, we chose human activity intensity, grassland transformation, soil erosion and grassland retrogressive succession, which include desertification, salinization and degradation as the negative assessment indicators. Among them, human activity intensity, which reflects the potential pressure from human activities, was derived from the density of buildings and villages combined with field investigation data. Soil erosion, reflecting the major natural disasters which happened in the steppe area, was calculated based on the Revised Universal Soil Loss Equation (RUSLE) model. The index of grassland retrogressive succession, which reflects the current state of grassland succession under the driving forces of both human activities and climate condition, was extracted from the grassland resources investigation data of Inner Mongolia in 2010 and 2016. Grassland transformation, highlighting the negative impact of artificial patches, was evaluated according to the restoration difficulty of transformed land types. More details are shown in Table 1.

2.3. Data Acquisition and Processing

The data used in this study included grassland resources investigation data, soil data, land use data, remote sensing data, meteorological data, statistical yearbook data and field monitoring data. The data sources are shown in Table 2.

2.3.1. Present Situation of Land Use

By overlaying land use data from 2010 and the GF–2 image from 2016, the changes in land use type in the study area included newly added farmland, roads, mining lands and villages. For the above land types, we used the visual interpretation method to update the land use data from 2010 and obtained the land use data from 2016. According to the classification standard of <current land use classification> of China (GB/T21010–2007), the land use classes of the study area in 2016 include farmland, grassland (shrub), mining land, construction land, road (country road) and water area (river and lake). Through field verification of the modified spots, we confirmed that the land use data of the study area in 2016 met the research needs.

2.3.2. Net Primary Productivity (NPP)

In this study, NPP was derived from field monitoring production P and NDVI’s statistical model methods. Previous research has confirmed that the predictive results of this method can perfectly reflect the NPP on a regional spatial scale [28]. The value of the NDVI was calculated by the formula (1).
N D V I = N I R R N I R + R
where, NIR and R present the reflectance of near-infrared band and red band. The range of the NDVI value is −1, 1.

2.3.3. Temperature-Vegetation Dryness Index (TVDI)

Sandholt et al. [30] proposed a simplified land surface dryness index, temperature-vegetation dryness index (TVDI), based on a parameterization of the relationship between surface temperature ( T s ) and vegetation (NDVI). Because of the detailed physical parameters and wide range of application, TVDI is widely used in surface moisture monitoring. Likewise, TVDI was adopted to reflect the surface water distribution of the study area.
T V D I = T s T S m i n T S m a x T S m i n
where, T S is the observed surface temperature at a given pixel; T S m a x and T S m i n were obtained respectively by the vegetation index and surface temperature according to the linear fitting of dry and wet edges, and the formula is as follows (3).
T S m a x = a 1 + b 1 · N D V I T S m i n = a 2 + b 2 · N D V I
where, a 1 and b 1 are the linear fitting coefficients of dry edge, and a 2 and b 2 are the linear fitting coefficients of wet edge; For landsat-8TIRS, T s is 10 bands, and the is formula as follows (4).
T 10 = K 2 / l n ( K 1 L ( α ) + 1 )
where, K 1 and K 2 are constants; L ( α ) is the radiance of thermal infrared radiation, and the formula is as follows (5).
L ( α ) = [ ε α b α ( T s ) + ( 1 ε α ) L α ] τ α + L α
where, ε α is the specific radiation rate, and the calculating formula is as follows below (6); the radiative brightness of black body of b α ( T s ) is T s on thermal infrared image; L α and L α are the radiative brightness of atmosphere downward and upward respectively; τ α is the transmittance of thermal infrared images.
ε α = ε g r a s s V C + ε b u i l d i n g ( 1 V C ) + 4 ( d ε ) V C ( 1 V C )
where, ε g r a s s is the specific radiation rate with vegetation cover; ε b u i l d i n g is the relative radiance rate of no vegetation; V C is vegetation coverage; d ε is the specific radiative correction.

2.3.4. Revised Universal Soil Loss Equation (RUSLE)

RUSLE is a revised version of the Universal Soil Loss Equation (USLE), which was developed by the USDA and has been used for decades. Due to its less calculation-intensive process and reasonable physical parameters, RUSLE has been introduced in all fields concerning soil erosion research [31,32]. The formula is as follows (7).
A = R · K · L S · C · P
where, A is the erosion per unit area; R is the rainfall energy factor; K is the soil erodibility factor; LS is the length-slope factor; C is the degree of soil cover factor; and P is the conservation practices factor.
R factor is an index reflecting the effect of rainfall on soil erosion. In this study, the empirical model proposed by Wischmeier [33] was used to calculate R. The formula is as follows (8).
R = i = 1 12 1.735 · 10 [ ( 1.5 l g p i 2 p ) 0.8188 ]
where, p i is month average rainfall; p is mean annual precipitation.
K factor is an index to evaluate the soil’s sensitivity to erosion. In this study, a simplified method proposed by Shirazi et al. [34] was used to calculate K. The formula is as follows (9).
K = { 0.0017 + 0.0494 · e x p [ 1 2 ( log ( D g + 1.675 ) 0.6986 ) 2 ] }
where, D g is geometric mean particle size of soil. In this study, D g was obtained from the soil data of the study area.
LS factor is an index reflecting the effect of topography on soil erosion. In this study, the calculation method refers to the research results of McCool et al. [35] and Liu et al. [36]. The formula is as follows (10).
{ L = ( λ 22.13 ) α S = { 10.8 sin θ + 0.03 ,     θ < 5 ° 16.8 sin θ 0.05 ,     5 ° θ < 14 ° 21.91 sin θ 0.96 ,   θ 14 °
where, L is slope length factor; S is slope factor; λ is value of slope length extracted from DEM; 22.13 m is the slope length of the standard plot; α is slope length factor; θ is slope values extracted from DEM;
C factor reflects the influence of vegetation cover and crop management measures on soil erosion. We used the method proposed by Cai et al. [37] to calculate the C factor. The formula is as follows (11).
C = { 1 f = 0 0.6508 0.3436 l g f 0 < f 78.3 % 0 f > 78.3 %
where, f is vegetation coverage of study area.
P factor refers to the proportion of soil loss after the adoption of water conservation measures relative to the soil loss when planting along the slope. Its value is between 0 and 1; 0 represents the area where no soil erosion occurred, and 1 represents the area where no protection measures have been taken. Based on the land-use data from 2016, this study assigned values according to the research results of Chen et al [38].

2.3.5. Minimum Cumulative Resistance (MCR) Model

The material and energy circulation of landscape, landscape flow, is the decisive factor in the stability of landscape elements in the region [39]. On the landscape scale, the flow needs to overcome some resistance to link together, resulting in many potential “pathways”, in which the landscape flow can potentially circulate well throughout the landscape. These “pathways” are the ecological corridors, which are the minimum resistance distance between ecological source flowing and the intersection of ecological corridors. The cumulative maximum cost resistance pathways can be thought of as the ecological nodes.
In this study, the potential ecological information was extracted by the minimum cumulative resistance (MCR) model, and the pixel value Pj was added to the basis of the original formula.
M C R = f m i n j = n i = m D i j · R i · P j
where, MCR is the minimum cumulative resistance surface; f m i n is the positive correlation between minimum cumulative resistance and ecological processes; D i j is the spatial distance between landscape unit i and source unit j; R i is the resistance coefficient of landscape elements to the landscape flow, which exists in transition from landscape unit i to source unit j; P j is the pixel value of the ecological source.
The assessment index data was transformed and resampled to standard grid of 30 m ground resolution. In the final overlaid raster, the higher the grid value, the stronger the ecological service value. Conversely, the lower the pixel value, the more obvious the ecological vulnerability. Therefore, we considered the high value grid as the ecological sources and thought of the final overlaid raster as the resistance surface.

2.3.6. Comprehensive Assessment

The analytic hierarchy process (AHP) is a convenient and effective method that implements qualitative and quantitative analysis for indicators and compares the indicators one-to-one [40]. In this study, we used the AHP weighted method to assign the weight for indicators. The indicators were compared in pairs by consulting experts in related fields, and then the judgment matrix was established by using the 9-scale method proposed by Saaty et al. Finally, the uniformity was checked for rationality of the matrix.
In this study, we used the comprehensive index model to assess the grassland health of Bayinxile. The formula is as stated (13). The positive and negative assessment images were obtained respectively by weighted overlaying corresponding index layers, and the final health assessment result of Bayinxile was found through overlaying these two images.
E = i = 1 n W i · P i
where, E is the comprehensive assessment index; n is the total number of assessment indicators in the assessment system; P i is the normalized value of the indicator; W i is the weight value of indicator.
Grassland health assessment is utilized to analyze the spatial difference macroscopically rather than to judge the health condition of a certain plot. Therefore, we made a health grading standard (Table 3), which included the categories of excellent, good, average, fair and poor, to classify the final assessment result in different grades by using the Jenks natural breaks classification method [31].

3. Results

3.1. Indicator Weight

As shown in Table 4, the weight of climate regulation was highest and that of entertainment service value was lowest. The indicator weight related to vegetation productivity was higher than others in the positive assessment indicators, which indicated that vegetation productivity directly reflects the vigor of the grassland ecosystem. Meanwhile, the weight of human activity was high, indicating that the pressure from humans was the main driving force for environmental degradation.

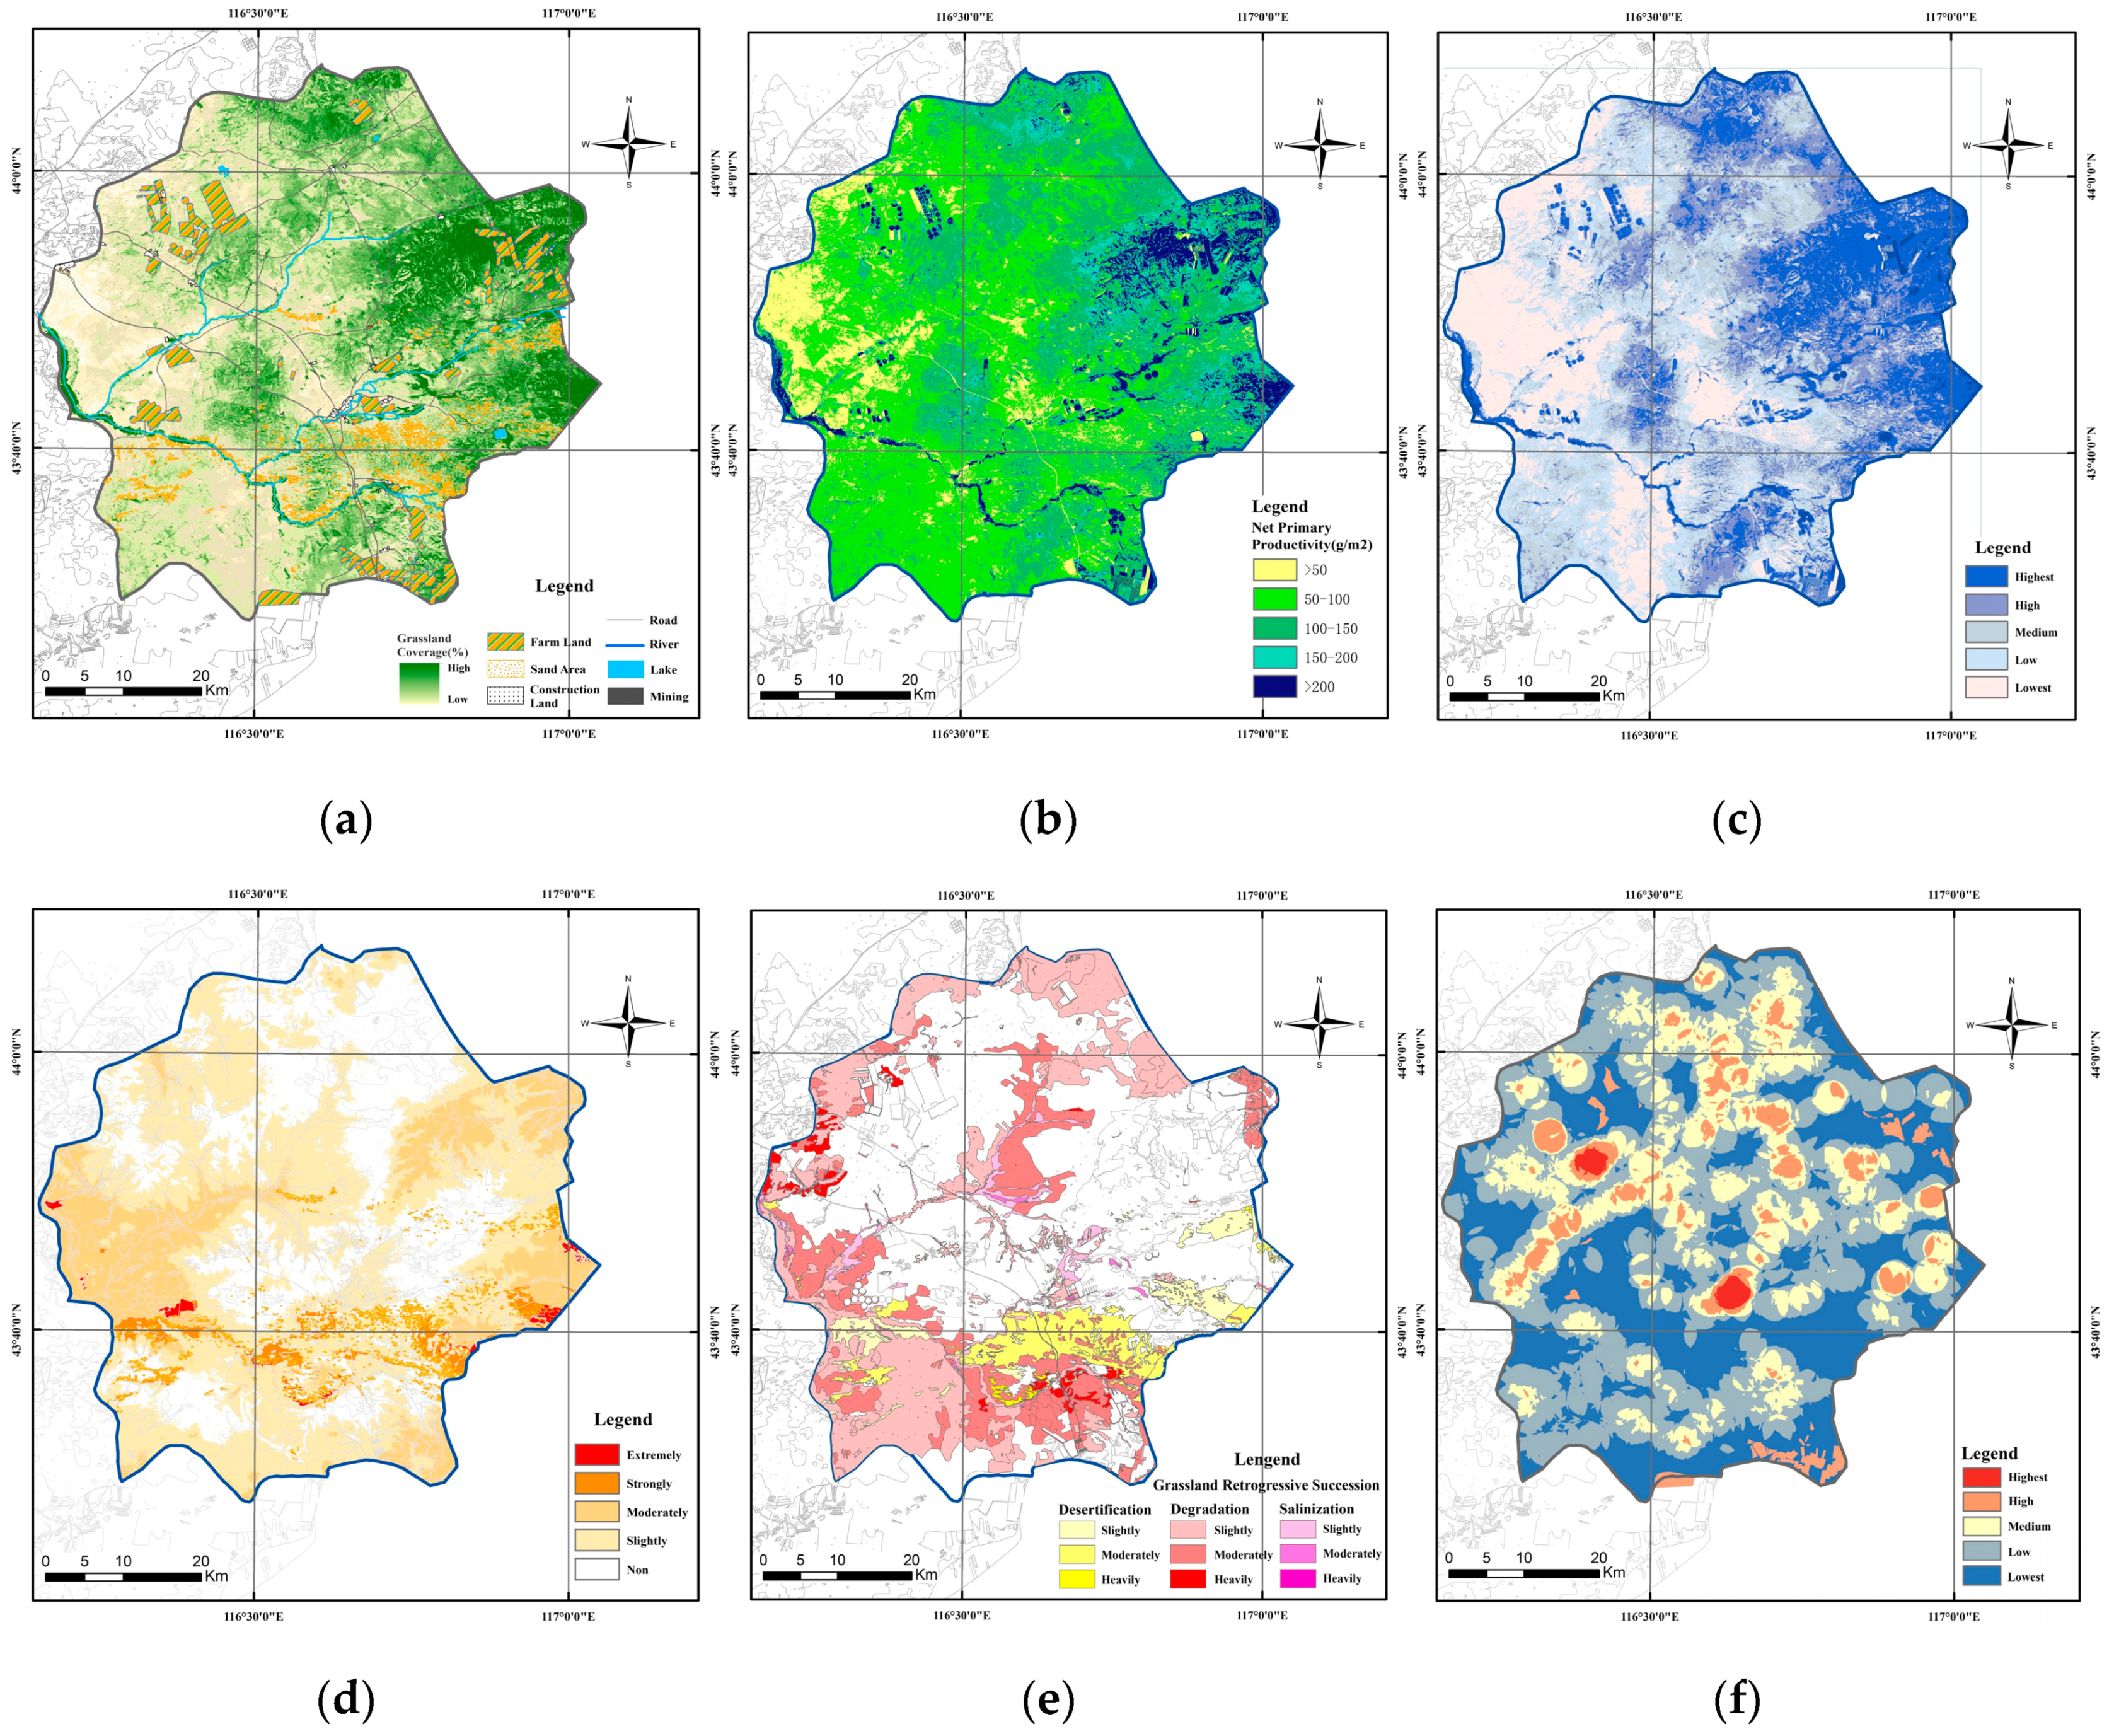
3.2. Result of Assessing Indicators

As seen in the land-use status of Bayinxile in 2016 shown in Figure 3a, the farmland, being the largest land use type transformed from native grassland, was mainly distributed in the eastern hilly area and the western plain area and covered an area of over 200 km2, among which the western farmland began in the 1970s and most of the rest after the 2000s. The sand area was mainly distributed in the south of the study area and villages were mainly located along the G303 national road.
The distribution of vegetation biomass of the study area as of September is shown in Figure 3b; the biomass was highest in the eastern hilly area where it was mainly dominated by shrub and semishrub communities, then the central area had a distribution of dominant species communities of Stipa and dominant species communities of Leymus, and the biomass was lowest in the majority of the western area. It also can be identified that the vegetation production on both sides of the rivers was much higher than that in the surrounding area and production of farmland was significantly higher than that of native grassland. As is indicated in Figure 3c, the water distribution was similar to that of vegetation, and differed in that there was a clear boundary between degraded grassland and nondegraded grassland in some regions. From Figure 3d, it can be seen that soil erosion was serious in the south and in the area of great topographic relief in the east. As for the grassland retrogressive succession of Bayinxile from 2010 to 2016, which is shown in Figure 3e, the degradation was mainly distributed in the south and along both sides of the river and the total area of degradation was over 1700 km2, accounting for 48% of the total area. The main types of degradation were the reduction of fine pasture species, reduction of production, desertification and salinization.

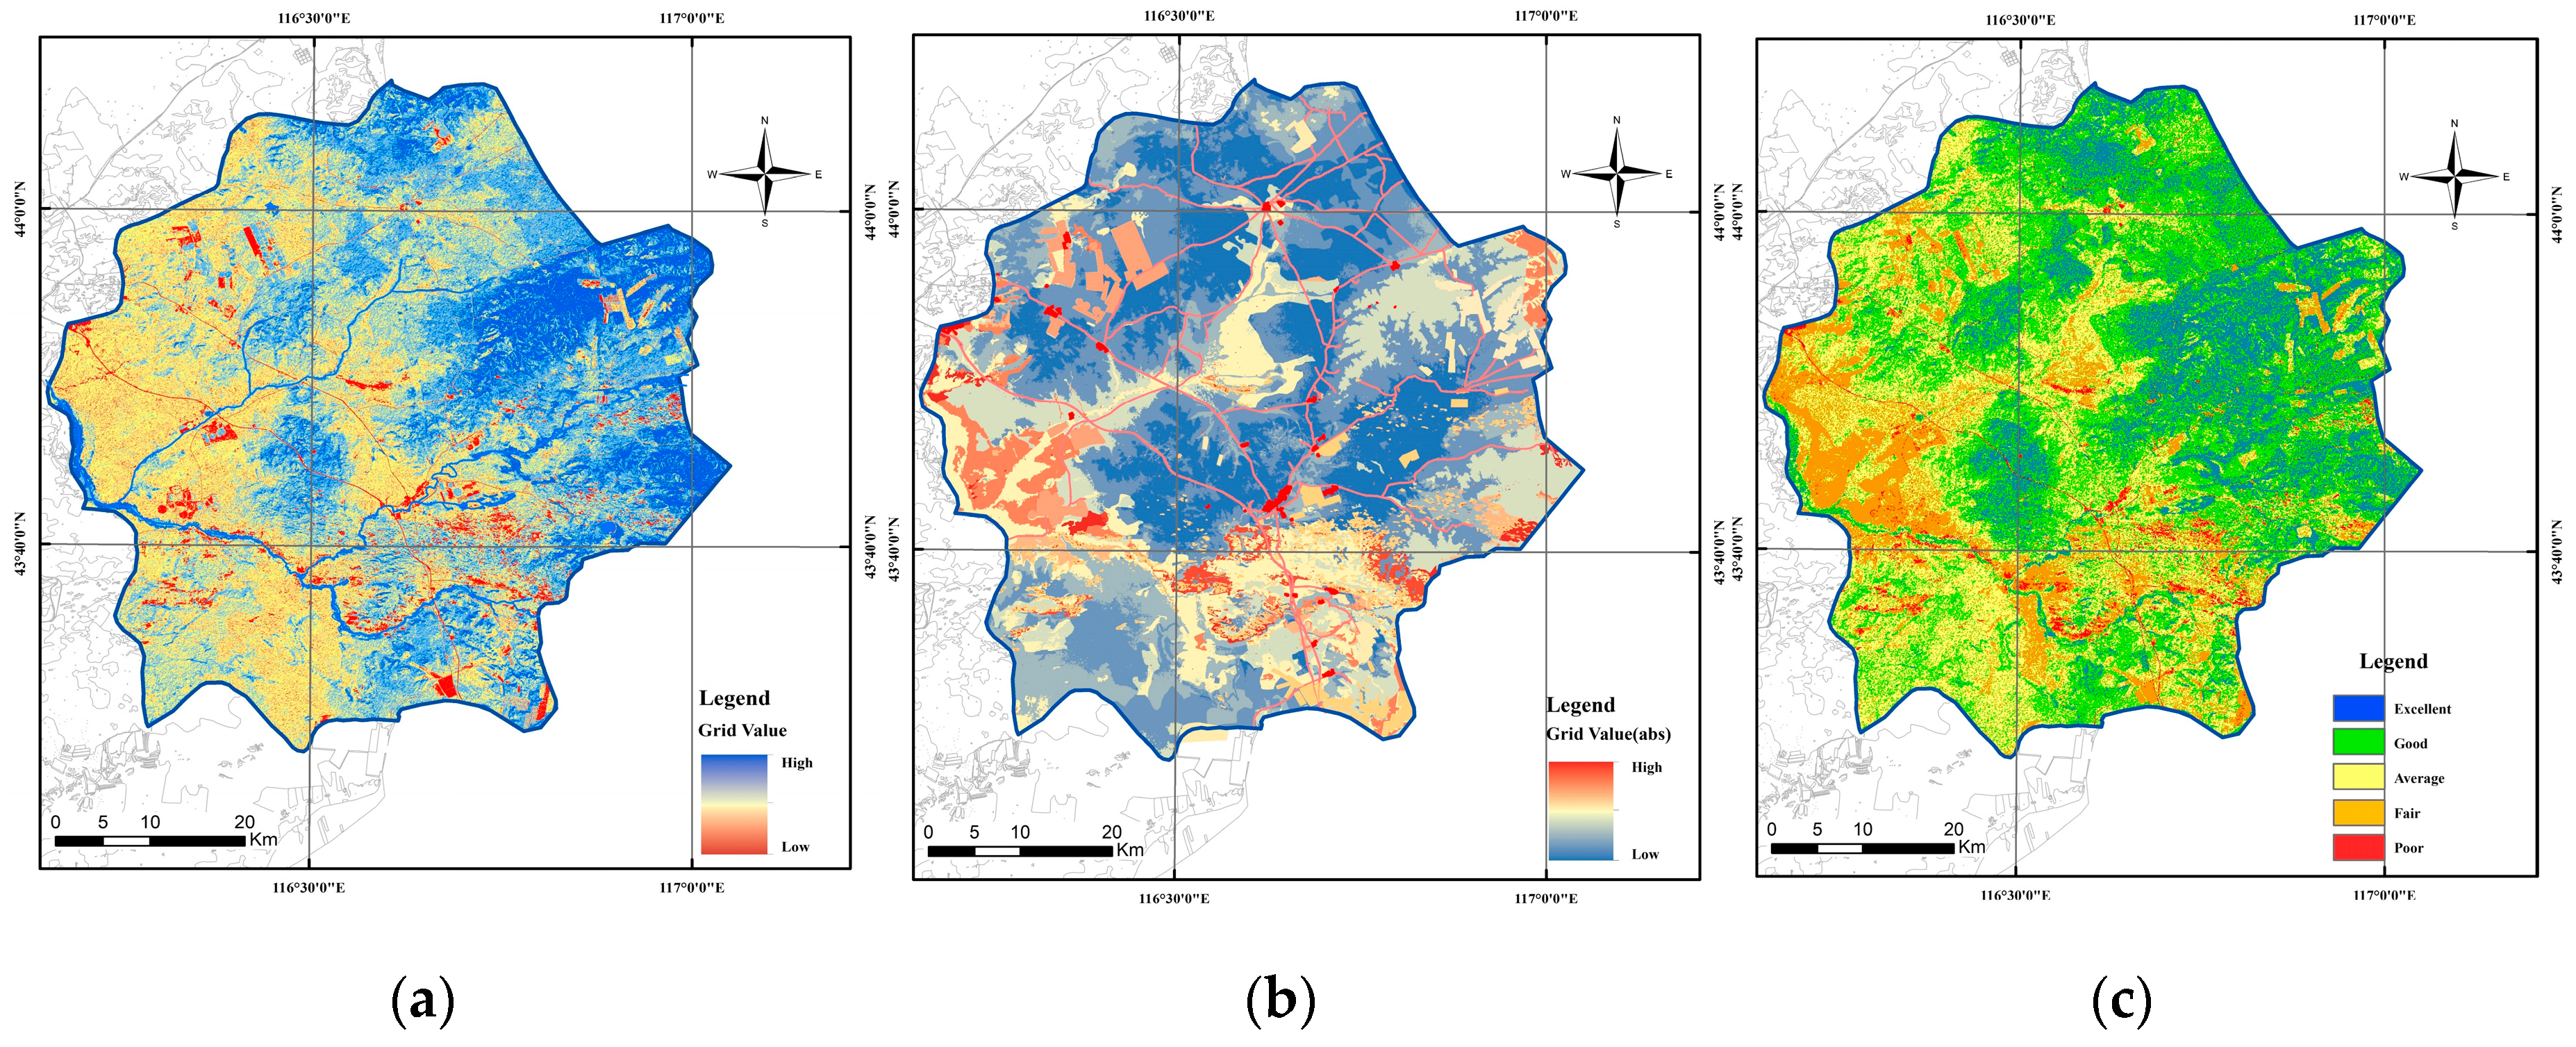
3.3. Results of Grassland Health Assessment

As shown in Figure 4a, there was a significant difference between the east and the west with regards to the intensity of vigor. In the eastern hilly area, due to good performance on vegetation biomass and other indicators, its positive assessment value was significantly higher than that of other regions, while in the west, because of grassland degradation, vigor was low on the whole. It also indicated that the river is like an ecological network that runs through the study area with prominent ecological vigor and the farmland was outstanding because of its high productivity. The dynamic of construction land, including roads, villages, mining areas, etc., was lowest in the whole area. The negative assessment result was a response to ecosystem health at the level of natural succession. From Figure 4b, it can be concluded that the areas with high values were mainly distributed around the river and the areas where human activities were concentrated, such as farmland and villages. It can be observed that the distribution of roads had a great negative impact on the connectivity between vegetation communities. From Figure 4c, the health assessment result of Bayinxile, it can be seen that the vigorous areas were mainly distributed in the northeastern and middle part of the study area. The poor health areas were mainly located in the western and southern part of the study area and distributed along both sides of the river. It also shows that the assessment result of farmland was average and the area around the both sides of the river was lower than that of other areas.

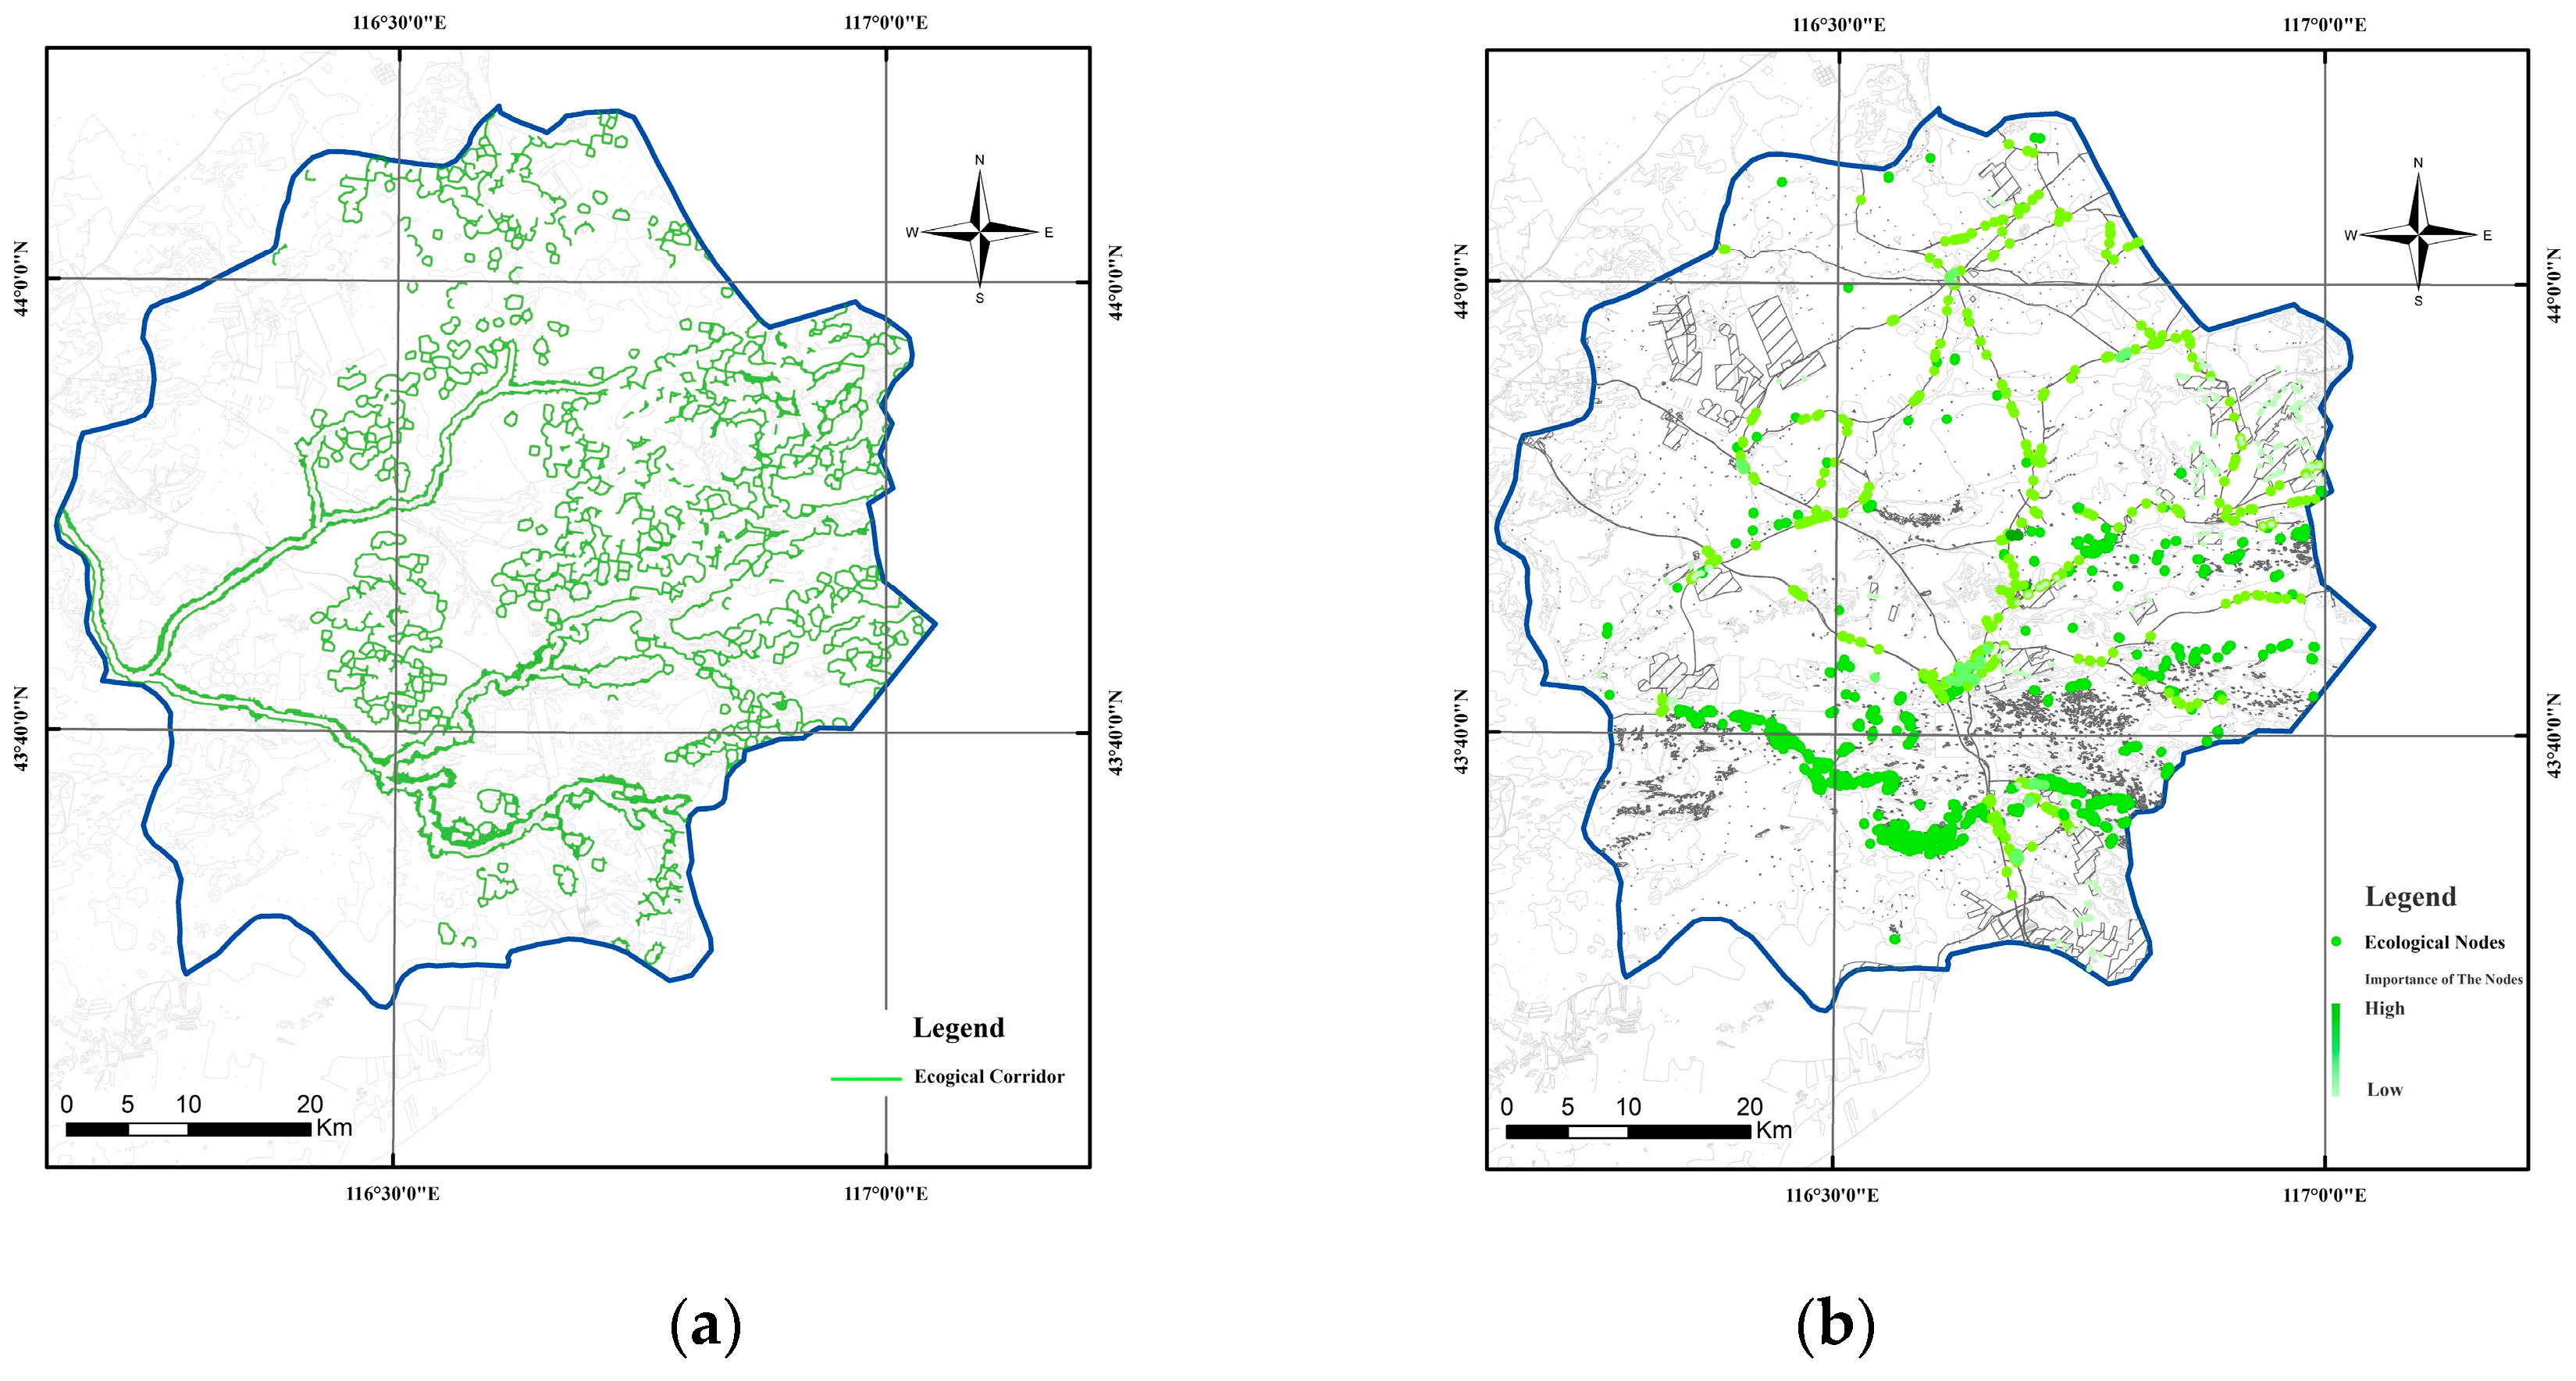
3.4. Potential Ecological Information

Identified potential ecological corridors of Bayinxile are illustrated in Figure 5a. The total length of the corridor was 2703 km and the longest was over 80km. Distribution of corridors was the most dense in the northern hilly area, which indicated that the ecological flow was well connected and the ecosystem structure was relatively complete, and sparsely in the west and south, which indicated that the ecological structure was damaged. It also can be seen that rivers are the longest corridor in the study area and run across the whole area. As shown in Figure 5b, a total of 2142 ecological nodes were identified and the importance of the ecological nodes was graded depending on the size of the resistance pathway. From the graph, ecological nodes were mainly distributed in areas where human activity was concentrated, such as roads, construction land, mining areas and around the southern degraded grassland. The distribution of importance indicated that the nodes with the highest importance were centrally distributed around the southern water, meaning that these areas were more vulnerable and sensitive to disturbances from external factors, especially on both sides of the river. Moreover, the road crossing the study area had been seriously blocking the energy flow between the communities because of its continuity, and the reclamation and mining activities in the east had seriously affected the vegetation communities in these areas.

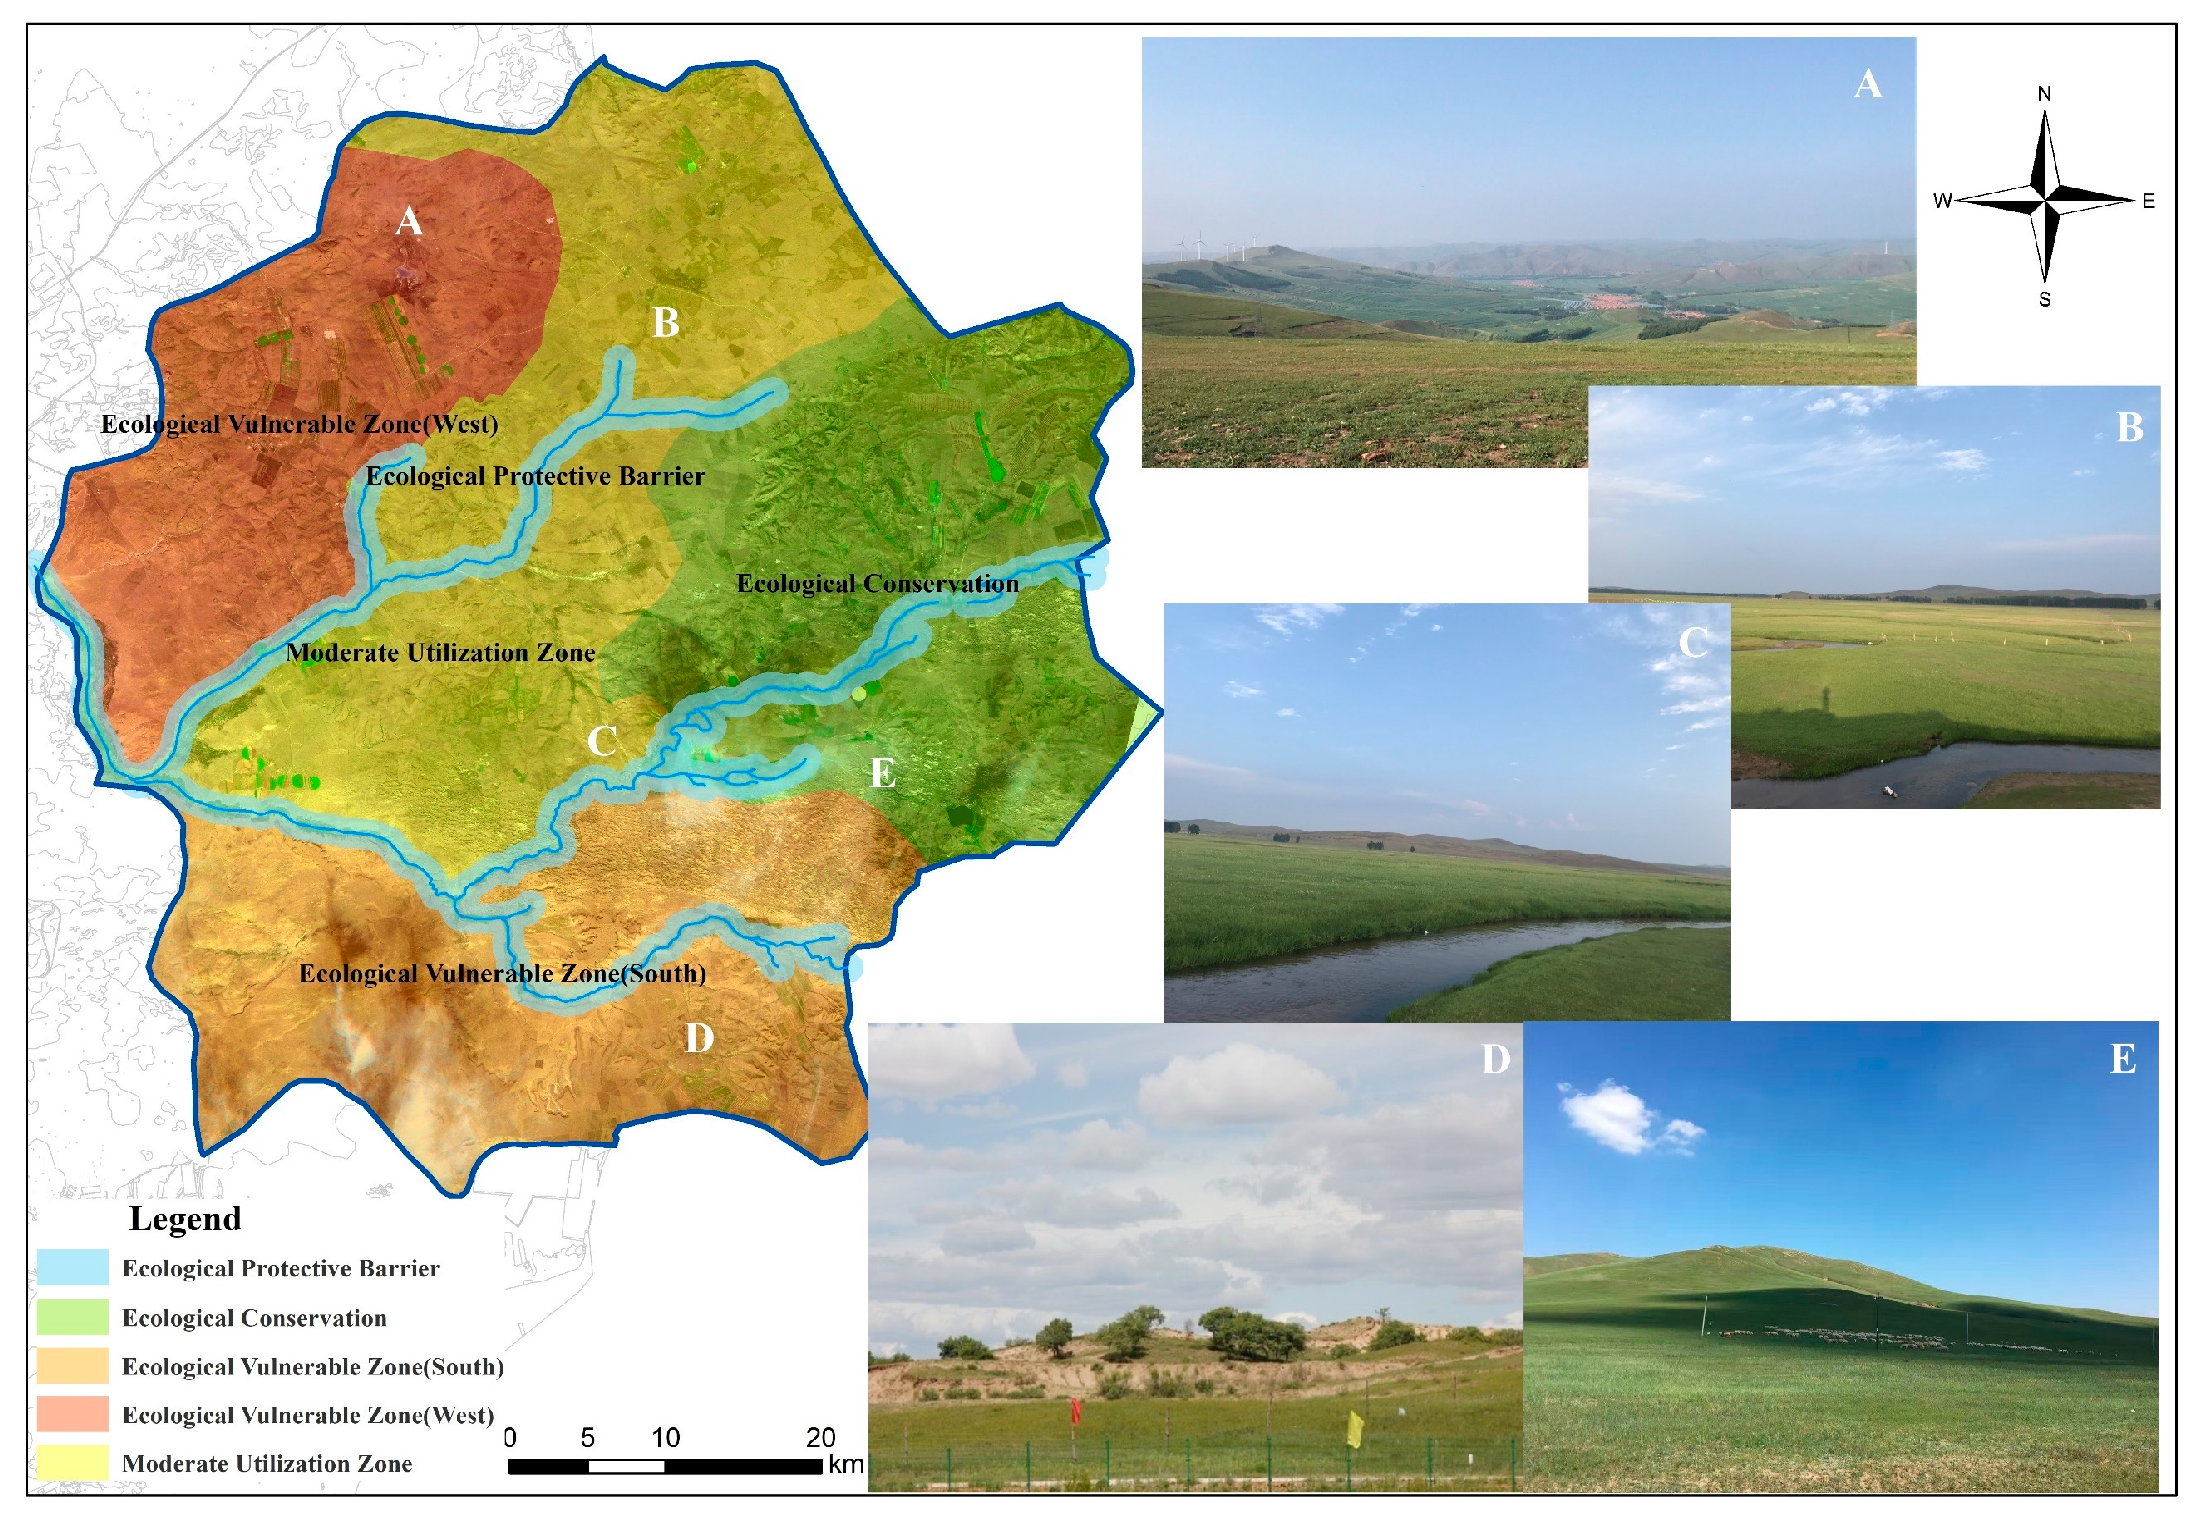
3.5. Ecological Control Zones

As indicated in Figure 6, we divided Bayinxile into different ecological control zones, including the important ecological conservation zone, the ecological protective barrier zone, the ecological vulnerable zone and the moderate utilization zone, based on both the health assessment result and the distribution of ecological potential information. Among them, the area of vulnerable zone was 1555.67 km2, accounting for 43.74% of total study area, the moderate utilization zone was 1098.33 km2, accounting for 30.88%, and the ecological conservation zone was 902.41 km2, accounting for 25.37%. The ecological vulnerable zone consisted of the western part: high-intensity human activity area, and the southern part: desertification area. The river served as a boundary between vulnerable and functional areas, acting in a decisive role in regional ecological stability and supply. Therefore, the buffer zone around the river was defined as an ecological barrier, which acted like a chain to prevent degradation in current ecological status. The ecological conservation zone was constituted by the ecological service area with the higher vegetation coverage of shrubs and semishrubs.

4. Discussion

By comparing the assessment result graphs with the assessment indicator result graphs, it can be observed that the biomass of grassland is directly related to the grassland health. The higher the biomass, the higher the ecological vigor and vice versa. Field monitoring shows that these higher ecological vigor areas are mostly dominant species communities of Stipa, dominant species communities of Leymuschinensis, Achnatherum Splendens, salt semishrub communities, dominant species communities of Filifoliumsibiricum (L.) Kitam and shrub communities [41]. These vegetation communities play an important role in the ecological security of Bayinxile. Moreover, the health assessment value shows average performance from the perspective of succession, though areas around the rivers are seemingly healthy in the landscape. This is because the water volume of the river has reduced significantly in recent years, resulting in grassland degradation around the river and the long-term degradation process has led to the reduction of perennial high-quality herbage and the increase of annual weeds. It also indicates that the assessment grade of the areas near the transformed grassland is lower than that of other areas, which leads us to draw the conclusion that human activities are the main factors leading to grassland degradation.
From the distribution of potential ecological information, it can be seen that the rivers are the longest and most stable ecological corridors and they play a vital role in connecting ecological flow among the ecological sources in the region. By overlaying the ecological corridor distribution graph with the assessment indicator result graphs, there is a positive correlation between the density of ecological corridors and the intensity of human activities. In areas with high human activity intensity, the ecological network is sparse and vice versa. It can be concluded that human activities in grassland are the main cause of the destruction of grassland ecological structure and that the density of the ecological network is directly related to distribution of artificial patches, including farmland, mining areas, roads and construction land, and that farmland and roads have great negative influence on the connection of the grassland ecological network.
Since the 1970s, reclamation of grassland has been done in the west, transforming and destroying the natural landscape pattern and impeding ecological flow, causing obvious grassland degradation. Overgrazing in the 2000s caused the formation of the desertification area. The moisture in the soil under low vegetation coverage, after overgrazing, easily evaporates at high temperatures, leaving the soil vulnerable to soil erosion under the drive of the wind. Prolonged exposure to these conditions eventually resulted in the desertification of the grassland. To prevent grassland degradation, the quantity of livestock has been strictly controlled since the implementation of the "Grassland Ecological Compensation Award Program" started in 2011. However, it is found that the newly increased artificial patch during 2010 to 2016 covered an area of almost 100 km2, which indicates that there is a huge loss of grassland during this time span. Based on the assessment results and combined with the results of ecological zoning, we make the following suggestions for the ecological management of Bayinxile.
In terms of livestock development, from the perspective of ecological theory, the grassland needs moderate interference to maintain abundant productivity [42,43]. Not only will moderate animal husbandry development benefit economic development, but will also be beneficial for the health of the ecosystem. We therefore suggest that it is necessary to make grazing plans according to the biomass of recent years and limit the numbers of livestock in strict accordance with the plans. Additionally, by introducing high quality livestock, improve livestock structures and replace the original model of pursuing quantity of animal husbandry. As for the utilization of mowing, the rangeland supervisory department should strengthen supervision to regulate whether it is carried out according to the prescribed height of mowing grass. In terms of prevention and protection, due to hydrothermal conditions and soil types, it is deemed inappropriate to develop large-scale agriculture in the arid and semiarid steppe areas of northern China. Therefore, punishment of the phenomenon of illegal reclamation according to relevant laws is suggested, and in so doing returning farmland to grassland regulation will be promoted. Likewise, mining causes irreversible damage to the grassland, and it is therefore suggested that local government should strengthen management of the current mining industry, including dust removal and land rehabilitation after mining, and caution should be used when introducing the mining industry to the grassland in future. Moreover, "grassland roads" should be strictly prohibited. The so-called grassland road is a road formed by vehicles running continuously over the grassland, which has a great negative impact on the grassland as is shown in Figure 5. We therefore suggest local government should set up road signs and other measures to prevent the increase of these roads. Furthermore, as discussed above, the rivers play a vital role in the ecological structure of Bayinxile. Hence, attention should be drawn to the protection of the rivers by the relevant departments. In addition, for preventing the expansion of desertification in the south, we suggest planting sand-resistant shrubs in different stages, such as Hedysarummongolicum Turez, Caragana korshinskii and Artemisia desertorum.
Compared with the previous studies, firstly, we put more emphasis on the natural status of the grassland and considered all the behaviors that modified the original landscape to be excessive interference. For example, in the previous studies, due to advantages in key indicators such as biomass and food supply, the ecological value of artificial landscapes such as farmland are often higher than those of native ecosystems. In this study, farming in the native grassland, especially in the arid and semiarid area, is considered as a kind of behavior that destroyed the natural succession of grassland, therefore both the behavior and the resulting secondary ecosystem are reflected as a process of grassland degradation. Secondly, some landscape ecology concepts like corridors and notes have been applied early in the field of urban planning and achieved excellent results, but there are a few applications in the field of grassland ecology. As shown in the result, the distribution of ecological network and the effect of each landscape element have high reference value for the ecological planning of the study area. Thus, it is necessary to introduce the theories and methods of landscape ecology to solve problems concerning grassland ecosystems. In these regards, we consider that this study will provide a new perspective for grassland health assessment and sustainable development of regional grassland. However, there are also some shortcomings which need to be improved in the next step. In terms of indicator selection, this study lacks some key indexes, such as monitoring of the pesticides, groundwater and heavy metals in the assessment system because of the availability and timeliness of the data. Meanwhile, as for data acquisition, some indicators such as food production, water and soil conversation capacity and climate regulation are too dependent on vegetation information.

5. Conclusions

We proposed a grassland health assessment system for Bayinxile, a typical native steppe with landscape modification, from the perspective of natural succession. Moreover, based on the assessment result, we identified the ecological corridors and nodes of the study area using landscape ecological theory. The result showed that cultivated land has great negative impact on grassland ecological network, the road has the influence of obstructing ecological flow due to its continuity, and the river is of vital significance in the prevention of degradation succession and in the linking of ecological communities. Furthermore, based on the above results, we gave ecological planning advice to the local government by dividing the study area into different ecological control zones. Through field investigation and image comparison, the distribution of potential ecological corridors conforms to the vegetation and geographical characteristics of the study area and the proposed ecological control zone is highly representative and feasible. The assessment system has a high value for assessing the ecological health of grassland with excessive human activities. Furthermore, the method of this study also has a high application value to the sustainable development of regional grassland ecosystems.

Author Contributions

N.W. conceived and performed the research; G.L., Y.W. and A.L. mainly contributed by making valuable comments and suggestions on the writing and revision of the paper; all authors participated in data collection and processing; N.W. wrote the paper.

Funding

This work was funded by the Science and Technology Innovation Project “Grassland Non-biological Disaster Prevention and Mitigation Team” of Chinese Academy of Agricultural Sciences (Grant No. CAAS-ASTIP-IGR2015-04).

Acknowledgments

This work was supported by the Science and Technology Innovation Project “Grassland Non-biological Disaster Prevention and Mitigation Team” of Chinese Academy of Agricultural Sciences (Grant No. CAAS-ASTIP-IGR2015-04). We would like to thank local staff from Bayinxile Pasture for their help when we investigated.

Conflicts of Interest

The authors declare no conflicts of interest.

References

  1. Behmanesh, B.; Barani, H.; Sarvestani, A.A.; Shahraki, M.R.; Sharafatmandrad, M. Rangeland degradation assessment: A new strategy based on the ecological knowledge of indigenous pastoralists. Solid Earth 2016, 7, 611–619. [Google Scholar] [CrossRef]
  2. Ojima, D.S.; Chuluun, T.; Galvin, K.A. Social–Ecological Vulnerability of Grassland Ecosystems. In Climate Vulnerability, 1st ed.; Pielke, R.A., Ed.; Academic Press: Salt Lake City, UT, USA, 2013; pp. 151–162. ISBN 978-0-12-384704-1. [Google Scholar]
  3. Guo, Z.G.; Liang, T.G.; Liu, X.Y.; Niu, F.J. A new approach to grassland management for the arid Aletai region in Northern China. Rangel. J. 2006, 28, 97–104. [Google Scholar] [CrossRef]
  4. Wang, X.G.; Han, J.G.; Dong, Y.P. Recent grassland policies in China—An overview. Outlook Agric. 2005, 34, 105–110. [Google Scholar] [CrossRef]
  5. Ma, L. Basin Thoughts and Policy Suggestions of Delimiting Grassland Ecological Protection Red Line. Acta Agrestia Sin. 2014, 22, 229–233. (In Chinese) [Google Scholar] [CrossRef]
  6. Yang, X.D.; Yang, C.; Meng, Z.X. The current situation, problem and suggestions of grassland ecological protection in China. Pratac. Sci. 2016, 33, 1901–1909. (In Chinese) [Google Scholar]
  7. Zhou, W.; Yang, H.; Huang, L.; Chen, C.; Lin, X.S.; Hu, Z.J.; Li, J.L. Grassland degradation remote sensing monitoring and driving factors quantitative assessment in China from 1982 to 2010. Ecol. Indic. 2017, 83, 303–313. [Google Scholar] [CrossRef]
  8. Rapport, D.J. The ecology of health. Ecology 2012, 93, 1241–1242. [Google Scholar] [CrossRef]
  9. Kruse, M. Ecosystem Health Indicators. In Encyclopedia of Ecology, 2nd ed.; Fath, B., Ed.; Elsevier: Amsterdam, The Netherlands, 2019; Volume 1, pp. 407–414. ISBN 978-0-444-64130-4. [Google Scholar]
  10. Rapport, D.J.; Maffi, L. Eco-cultural health, global health, and sustainability. Ecol. Res. 2011, 26, 1039–1049. [Google Scholar] [CrossRef]
  11. Costanza, R. Ecosystem health and ecological engineering. Ecol. Eng. 2012, 45, 24–29. [Google Scholar] [CrossRef]
  12. Maron, M.; Mitchell, M.G.E.; Runting, R.K.; Rhodes, J.R.; Mace, G.M.; Keith, D.A.; Watson, J.E.M. Towards a Threat Assessment Framework for Ecosystem Services. Trends Ecol. Evol. 2017, 32, 240–248. [Google Scholar] [CrossRef] [Green Version]
  13. Drobnik, T.; Greiner, L.; Keller, A.; Grêt-Regamey, A. Soil quality indicators–From soil functions to ecosystem services. Ecol. Indic. 2018, 94, 151–169. [Google Scholar] [CrossRef]
  14. Raufirad, V.; Hunter, R.; Endress, B.A.; Bagheri, S. Application of Vulnerability Assessment to a Grazed Rangeland: Toward an Integrated Conceptual Framework. Rangelands 2018, 40, 17–23. [Google Scholar] [CrossRef]
  15. Sheley, R.L.; James, J.J.; Vasquez, E.A.; Svejcar, T.J. Using Rangeland Health Assessment to Inform Successional Management. Invasive Plant Sci. Manag. 2011, 4, 356–366. [Google Scholar] [CrossRef]
  16. Li, Y.Y.; Dong, S.K.; Wen, L.; Wang, X.X.; Wu, Y. Three-dimensional framework of vigor, organization, and resilience (vor) for assessing rangeland health: A case study from the alpine meadow of the Qinghai-Tibetan plateau, China. EcoHealth 2013, 10, 423–433. [Google Scholar] [CrossRef] [PubMed]
  17. Yan, Y.; Zhao, C.L.; Wang, C.X.; Shan, P.; Zhang, Y.J.; Wu, G. Ecosystem health assessment of the Liao River Basin upstream region based on ecosystem services. Acta Ecol. Sin. 2016, 36, 294–300. [Google Scholar] [CrossRef]
  18. Qin, Z.H.; Xu, B.; Xin, X.P.; Zhou, Q.B.; Zhang, H.O.; Liu, J. Integration of remote sensing and GIS technology to evaluate grassland ecosystem health in north China. In Proceedings of the IEEE 2004 International Geosciences and Remote Sensing Symposium, Anchorage, AK, USA, 20–24 September 2004; pp. 4034–4037. [Google Scholar] [CrossRef]
  19. Hof, J.; Flather, C.H. Optimization of landscape pattern. In Key Topics in Landscape Ecology, 1st ed.; Wu, J.G., Hobbs, R., Eds.; Cambridge University Press: Cambridge, UK, 2007; Volume 8, pp. 143–160. [Google Scholar]
  20. Liang, J.; He, X.Y.; Zeng, G.M.; Zhong, M.Z.; Gao, X.; Li, X.; Li, X.D.; Wu, H.P.; Feng, C.T.; Xing, W.L.; et al. Integrating priority areas and ecological corridors into national network for conservation planning in China. Sci. Total Environ. 2018, 626, 22–29. [Google Scholar] [CrossRef] [PubMed]
  21. Rapport, D.J. Gaining respectability: Development of quantitative methods in ecosystem health. Ecosyst. Health 1999, 5, 1–2. [Google Scholar] [CrossRef]
  22. Chen, T.; Bao, A.M.; Jiapaer, G.L.; Guo, H.; Zheng, G.X.; Jiang, L.L.; Chang, C.; Tuerhanjiang, L. Disentangling the relative impacts of climate change and human activities on arid and semiarid grasslands in Central Asia during 1982–2015. Sci. Total Environ. 2019, 653, 1311–1325. [Google Scholar] [CrossRef]
  23. Costanza, R.; Arge, R.; Groot, R.; Farber, S.; Grasso, M.; Hannon, B.; Limburg, K.; Naeem, S.; O’Neill, R.V.; Paruelo, J.; et al. The value of the world’s ecosystem services and natural capital. Nature 1997, 387, 253–260. [Google Scholar] [CrossRef]
  24. Ministry of Agriculture and Rural Affairs of The People’s Republic of China. Available online: http://www.moa.gov.cn/xw/zwdt/201808/t20180803_6155252.htm (accessed on 5 August 2018).
  25. Lal, R. Soil conservation and ecosystem services. Int. Soil Water Conserv. Res. 2014, 2, 36–47. [Google Scholar] [CrossRef] [Green Version]
  26. Brown, T.C.; John, C.B.; John, B.L. Defining, valuing and providing ecosystem goods and services. Nat. Resour. J. 2007, 47, 329–376. [Google Scholar] [CrossRef]
  27. Klimeš, F.; Kolář, L.; Květ, J.; Boberfeld, W.O.V.; Laser, H. Methodological aspects in the study of species richness, diversity and homotony of grass cover. Plant Soil Environ. 2007, 53, 33–41. [Google Scholar] [CrossRef]
  28. Chang, X.L.; Lv, S.H.; Feng, Z.Y.; Ye, S.X. Impact of topography on the spatial distribution pattern of net primary productivity in a meadow. Acta Ecol. Sin. 2015, 35, 3339–3348. (In Chinese) [Google Scholar] [CrossRef]
  29. Jenks Natural Breaks Classification. Available online: http://wiki.gis.com/wiki/index.php/Jenks_Natural_Breaks_Classification (accessed on 5 August 2018).
  30. Sandholt, I.; Rasmussen, K.; Andersen, J. A simple interpretation of the surface temperature/vegetation index space for assessment of surface moisture status. Remote Sens. Environ. 2002, 79, 213–224. [Google Scholar] [CrossRef]
  31. Erosion Mechanisms and the Revised Universal Soil Loss Equation (RUSLE). Available online: http://rpitt.eng.ua.edu/Class/Erosioncontrol/Module3/Module3.htm (accessed on 20 September 2018).
  32. Revised Universal Soil Loss Equation (RUSLE)—Welcome to RUSLE 1 and RUSLE 2. Available online: https://www.ars.usda.gov/southeast-area/oxford-ms/national-sedimentation-laboratory/watershed-physical-processes-research (accessed on 20 September 2018).
  33. Wischmeier, W.H. A rainfall erosion index for a universal soil loss equation. Soil Sci. Soc. Am. J. 1959, 23, 246–249. [Google Scholar] [CrossRef]
  34. Shirazi, M.A.; Hart, J.W.; Boersma, L. A Unifying Quantitative Analysis of Soil Texture: Improvement of Precision and Extension of Scale. Soil Sci. Soc. Am. J. 1988, 52, 181–190. [Google Scholar] [CrossRef]
  35. McCool, D.K.; Brown, L.C.; Foster, G.R.; Mutchler, C.K.; Meyer, L.D. Revised slope steepness factor for the universal soil loss equation. Trans. ASAE 1987, 30, 1387–1396. [Google Scholar] [CrossRef]
  36. Liu, B.Y.; Nearing, M.A.; Risse, L.M. Slope gradient effects on soil loss for steep slopes. Trans. ASAE 1994, 37, 1835–1840. [Google Scholar] [CrossRef]
  37. Xu, Q.X.; Wang, T.W.; Li, Z.X.; Cai, C.F.; Shi, Z.H. Effect of soil conservation measurements on runoff, erosion and plant production: A case study on steep lands from the Three Gorges Area, China. J. Food Agric. Environ. 2010, 8, 980–984. [Google Scholar] [CrossRef]
  38. Chen, S.X.; Yang, X.H.; Xiao, L.L.; Cai, H.Y. Study of Soil Erosion in the Southern Hillside Area of China Based on RUSLE Model. Resour. Sci. 2014, 36, 1288–1297. (In Chinese) [Google Scholar]
  39. Wu, J.G. Cross-disciplinarily, landscape ecology, and sustainability science. Landsc. Ecol. 2006, 21, 1–4. [Google Scholar] [CrossRef]
  40. Wang, Y.F.; Zhang, J.Q.; Guo, E.L.; Sun, Z.Y. Fuzzy Comprehensive Evaluation-Based Disaster Risk Assessment of Desertification in Horqin Sand Land, China. Int. J. Environ. Res. Public Health 2015, 12, 1703–1725. [Google Scholar] [CrossRef] [PubMed] [Green Version]
  41. Wu, H.W.; Li, J.; Li, X.Y.; He, B.; Liu, J.Z.; Jiang, Z.Y.; Zhang, C.C. Contrasting response of coexisting plant’s water-use patterns to experimental precipitation manipulation in an alpine grassland community of Qinghai Lake watershed, China. PLoS ONE 2018, 13, e0194242. [Google Scholar] [CrossRef] [PubMed]
  42. Ives, A.R.; Carpenter, S.R. Stability and Diversity of Ecosystems. Science 2007, 317, 58–62. [Google Scholar] [CrossRef] [PubMed]
  43. Robinson, B.E.; Li, P.; Hou, X.Y. Institutional change in social-ecological systems: The evolution of grassland management in Inner Mongolia. Glob. Environ. Chang. 2017, 47, 64–75. [Google Scholar] [CrossRef]
Figure 1. The scope of the study area. Source: Authors.
Sustainability 11 01096 g001
Figure 2. Flowchart of the grassland health assessment framework for Bayinxile. Source: Authors.
Sustainability 11 01096 g002
Figure 3. The result of assessment indicators: (a) land-use type; (b) net primary productivity; (c) water distribution; (d) soil erosion; (e) grassland retrogressive succession; (f) human activity intensity. Source: Authors.
Sustainability 11 01096 g003
Figure 4. The assessment results: (a) the result of positive assessment; (b) the result of negative assessment; (c) the result of study area’s health assessment. Source: Authors.
Sustainability 11 01096 g004
Figure 5. The distribution of ecological corridors and nodes of the study area. (a) The distribution of ecological corridors; (b) the distribution of ecological nodes. Source: Authors.
Sustainability 11 01096 g005
Figure 6. The ecological control zone of Bayinxile pasture in 2016. Source: Authors.
Sustainability 11 01096 g006
Table 1. Grassland health assessment indicators for Bayinxile.
1st-Level Indicator2nd-Level Indicator3rd-Level IndicatorDirection and MethodGradeScore
Positive assessing indicatorEcological functionPlant diversityThe species richness index was used to calculate the plant diversity of grassland [27]. Sample points were arranged according to the habitat conditions (human activity intensity being the major consideration) of the study area. Each sample point was set with 3 samples (in which grass community was 1 m × 1 m and shrub was 10 m × 10 m) to record the species richness.Highest5
High4
Medium3
Low2
Lowest1
Productive functionFood supplementOutput of farmland was considered to be the highest. Food productivity of grazing land was reflected by vegetation biomass.High5
Medium3
Low1
Environmental functionClimate regulationNet Primary Productivity (NPP) was used to indirectly reflect climate regulation capacity of vegetation according to the positive correlation between vegetation biomass and its carbon cycle and climate regulation capacity [25,26].Highest5
High4
Medium3
Low2
Lowest1
Water and soil conversation capacity NPP was used to reflect the water and soil conversation capacity. We assigned a value of 5 to the area with a figure above 200 g/m2 and a value of 1 to the area with a figure below 50 g/m2, and assigned null to the area with no vegetation.High5
Medium3
Low1
Water distributionThe TVDI Index was used to reflect the water distribution of the surface soil. Highest5
High4
Medium3
Low2
Lowest1
Cultural service functionEntertainment Service valueThe distribution density of tourist spots was used to reflect the entertainment service value.Highest5
High4
Medium3
Low2
Lowest1
Topographical conditionAspectsThe distribution characteristics of NPP was used on aspects and slope to assign the value for each aspect and slope. Among them, the classification of aspects and slope used was set out in <General rule of planning for comprehensive control of soil erosion> of China (GB/T 15772–2008) and a previous study made by Chang et al. [28]N5
W4
E3
Flat2
S1
Slope15°~25°5
8°~15°4
5°~8°3
<5°2
>25°1
Negative assessing indicatorHuman activityHuman activity intensityThe result of point density analysis for residential buildings was used to reflect the human activity intensity.Highest−5
High−4
Medium−3
Low−2
Lowest−1
Grassland transformationIt was evaluated according to the restoration difficulty of transformed land types. The result showed: Mining land>Road, Construction land>Farmland, Country RoadHeavily−5
Moderately−3
Slightly-1
Natural disasterSoil erosionThe RUSLE model was used to calculate the soil erosion of study area.Extremely−5
Strongly−4
Moderately−3
Slightly−1
Grassland retrogressive successionDesertificationThe grassland resources investigation data of Inner Mongolia in 2010 and 2016, which include information about the degradation, desertification and salinization of Inner Mongolian grassland.Heavily−5
Moderately−3
Slightly−1
SalinizationHeavily−5
Moderately−3
Slightly−1
DegradationHeavily−5
Moderately−3
Slightly−1
Note: Score of the assessment indicator was classified by the natural breaks classification method [29].
Table 2. Basic data and their sources.
Data NameDateSources
Grassland resources investigation data of Inner Mongolia2010, 2016Grassland Investigation and Planning Institute of Inner Mongolia
Soil database of Bayinxile2010Grassland Investigation and Planning Institute of Inner Mongolia
Land use data of Bayinxile2010Grassland Investigation and Planning Institute of Inner Mongolia
GF–2 (1 m × 1 m)July 2016Grassland Investigation and Planning Institute of Inner Mongolia
Landsat-8oli/TIRSJuly 2016, Sep. 2016USGS (http://glovis.usgs.gov)
ASTER GDEM v2 (30 m)-Computer Network Information Centre, CAS (http://www.gscloud.cn)
Rainfall data2010–2016National Meteorological Science Data Sharing Service Platform, China (http://data.cma.cn/)
Statistical yearbook data2010–2016-
Field monitoring data2016-
Table 3. Grade of ecological health assessment.
GradeEcological Status
1ExcellentAn area with dynamic and stable ecological structure
2GoodAn area with better vigor and less external interference
3AverageAn area with moderate external interference and obvious degradation trend
4FairAn area with excessive human activities and degraded grassland
5PoorAn area transformed from native grassland
Table 4. The weight of assessment indicator.
CriterionSubcriterionWeight
Ecological functionPlant diversity0.062
Productive functionFood supplement0.1418
Environmental functionClimate regulation0.2171
Water and soil conversation capacity0.0873
Water distribution0.0266
Entertainment functionEntertainment Service value0.017
Topographical conditionAspects0.0213
Slope0.0183
Human activityHuman activity intensity0.0989
Grassland transformation0.1312
Natural disasterSoil erosion0.0557
Grassland retrogressive successionDesertification0.0366
Salinization0.0345
Degradation0.0515

