Excessive Application of Fertilizer, Agricultural Non-Point Source Pollution, and Farmers’ Policy Choice

1
International Business School, Shaanxi Normal University, Xi’an 710119, China
2
School of Public Finance and Tax, Central University of Finance and Economics, Beijing 100081, China
*
Author to whom correspondence should be addressed.
Sustainability 2019, 11(4), 1165; https://0-doi-org.brum.beds.ac.uk/10.3390/su11041165
Submission received: 28 December 2018
/
Revised: 19 February 2019
/
Accepted: 19 February 2019
/
Published: 22 February 2019
(This article belongs to the Section Sustainable Agriculture)
Abstract
:This paper takes 516 households who planted wheat in Heyang County, Shaanxi Province in 2018, as samples to construct three policy environments: Technological guidance for planting, subsidies for organic fertilizer application, and agricultural tailwater discharge standards. The experimental choice method was used to empirically analyze policy preferences during the process of fertilizer reduction. The results indicate that households show different preferences for the three policy settings: The fertilizer application rate is reduced by 6.98% if providing full technological guidance for farmers throughout the wheat planting process and is reduced by 5.18% under the background of providing appropriate organic fertilizer subsidies. The agricultural tailwater discharge standards have the least impact on the reducing level of chemical fertilizer application, with decreasing amounts of only 1.85% and 0.77% under the second-level and the first-level agricultural tailwater discharge standards, respectively. These results indicate that households in Heyang County, Shaanxi Province, demonstrate a low willingness to accept the agricultural tailwater discharge standards in order to cut down on the amount of chemical fertilizer application and the agricultural non-point source pollution. Therefore, compared with a compounded annual growth rate (CAGR) of 1% of fertilizer usage nationwide according to the Chinese Ministry of Agriculture, given the current planting environment and policies design, providing comprehensive technological guidance as well as price subsidies for the organic fertilizer can significantly and robustly reduce the excessive application of fertilizer in Heyang County, Shaanxi Province, under the best scenario, thereby further alleviating agricultural non-point source pollution.
1. Introduction
According to the report of FAO in 2005, grain is the first necessity for human beings and has been cultivated for more than 8000 years. There is a proverb in China that the “grain industry is the basic industry that settles down the world and secures the support of the people”. Since 2003, China’s grain production demonstrated a consecutive twelve-year incremental increase stimulated by various factors such as economic development, population explosion, technological progress, and policy support [1]. On the other hand, the enhancement of urbanization, the reduction of arable lands, and the transfer of labor from rural to urban areas result in the shortage of arable land resources and rural labor. In this context, in order to ensure grain supply and security, the agricultural producing mode of “high input and high output” has been adopted and widely promoted in many regions, and one of the main characteristics of this mode is the increasing use of fertilizer. Yang and Li [2] find that over the past decade, the fertilizer input of China’s grain production has been rising sharply, contributing more than 50% to the growth of grain yield. Meanwhile, according to the data of the National Bureau of Statistics (Source: China statistical yearbook (1979–2017)), since the reform and open policy in 1978, the levels of China’s grain output and fertilizer application have increased steadily, among which grain output has increased by 83.7%, and fertilizer application has increased by nearly five-fold in the same period; the growth rate of fertilizer application far exceeds the growth rate of grain output. This illustrates that, on one hand, the significant effect of fertilizer input on grain yield promotes the rapid growth of fertilizer application; on the other hand, when fertilizer application reaches a certain amount, the marginal contribution to grain yield increases slowly or even decreases.
The excessive application of fertilizer also aggravates the pollution of agricultural non-point sources and brings heavy ecological and environmental problems. Chen [3], Han & Yang [4], and Min & Kong [5] point out that the environmental problems brought by the China’s agricultural development become increasingly prominent, concentrating on the problem of agricultural non-point source pollution, whereas excessive fertilizer is one of the main casual factors. The data released by the Ministry of Agriculture and Rural Affairs of the People’s Republic of China in 2017 (Source: China Agriculture and Rural Ministry website, http://www.moa.gov.cn/) shows that the average fertilizer application amount in China is 21.9 kg/mu (1 mu = 0.16473 acre), much higher than the world’s average level of 8 kg/mu. The fertilizer application amount in China per unit area is 2.6 times and 2.5 times that of the United States and the European Union respectively. The excessive application of fertilizer directly leads to the obvious decrease in the fertility and fertilizer utilization rates of cultivated land in China. In 2017, the average content of soil organic matter of cultivated land in China is less than 1%, and the utilization rates of nitrogen fertilizer, phosphate fertilizer, and potassium fertilizer for the three major grain crops are only 33%, 24%, and 42% [6]. This not only results in huge economic losses, but also brings about serious environmental pollution, causing serious harm to water, soil, atmosphere, biology, and human health [3,7].
In order to prevent further deterioration of the ecological environment and to achieve sustainable development of grain production, it is imperative to reduce the input of fertilizer. Therefore in 2006, the Chinese government enacted the reduction of excessive fertilizer application and control of non-point agricultural pollution in the outline of the “eleventh five-year (2006–2010) plan for the national economic and social development”, and regarded it as an urgent problem to be solved in China’s sustainable agricultural development and new rural construction [4]. Since then, the “No. 1 document” each year from the national central government has put forward explicitly the control of agricultural fertilizer pollution between 2013 and 2017. In July 2018, the Ministry of Ecology and Environment of the People’s Republic of China passed through the action plan for agricultural and rural pollution control, which determines that China will implement “one protection, two governances, three reductions and four enhancements” proposal, namely the protection of rural drinking water sources, the governance of rural living garbage and sewage, the reduction of chemical fertilizers, pesticides and usage amount of agricultural water, enhancement of agricultural non-point source pollution standard water quality, agricultural waste comprehensive utilization, and the supervisory ability of the rural ecological environment and the rural residents’ participation of ecological environment protection. It can be seen that the problem of agricultural non-point source pollution caused by excessive fertilizer application has attracted the attention of policymakers in many departments.
Compared with developed countries and regions such as Europe and the United States, the studies on environmental pollution control of agricultural non-point source pollution in China have fallen behind, and the existing research mainly focuses on standard formulation [8], technological research and development [8,9], and economic incentives [10]. Whether the above agricultural policies and the control goal of non-point source pollution can be achieved smoothly not only depends on whether the policies can adapt to local conditions, but also depends on whether farmers recognize and accept the relevant control policies of agricultural non-point source pollution. For instance, Brynjolfsson et al. [11] consider the control of non-point source pollution from the aspect of plant growers’ behaviors. Mira et al. [12] investigate the emission of the ammonia from crop residues. Most of those papers enumerate the data from field surveys.
Taking the Northern wheat planting areas of China as an example, on the basic analysis of the mechanisms of agricultural non-point source pollution caused by fertilizer, this paper employs choice experiment and the micro survey data of 516 wheat planting households of the Heyang County of Shaanxi Province to quantitatively evaluate the farmers’ willingness to reduce fertilizer applications under different policy environments so as to provide policy recommendations and decision-making references for efficient agricultural environment policies.
2. Theoretical Analysis Framework
Understanding the forming mechanisms of agricultural non-point source pollution from the perspective of excessive fertilizer application is a vital prerequisite for the design of agricultural non-point source pollution control policy, as well as a reliable guarantee for the secured agricultural environmental policy. This paper attempts to analyze the forming mechanism of agricultural non-point source pollution from the macro level of the country, the mesoscopic level of agriculture itself, and the micro level represented by farmers.
2.1. Macro Level
2.1.1. The National Development Strategy of Increasing Grain Production
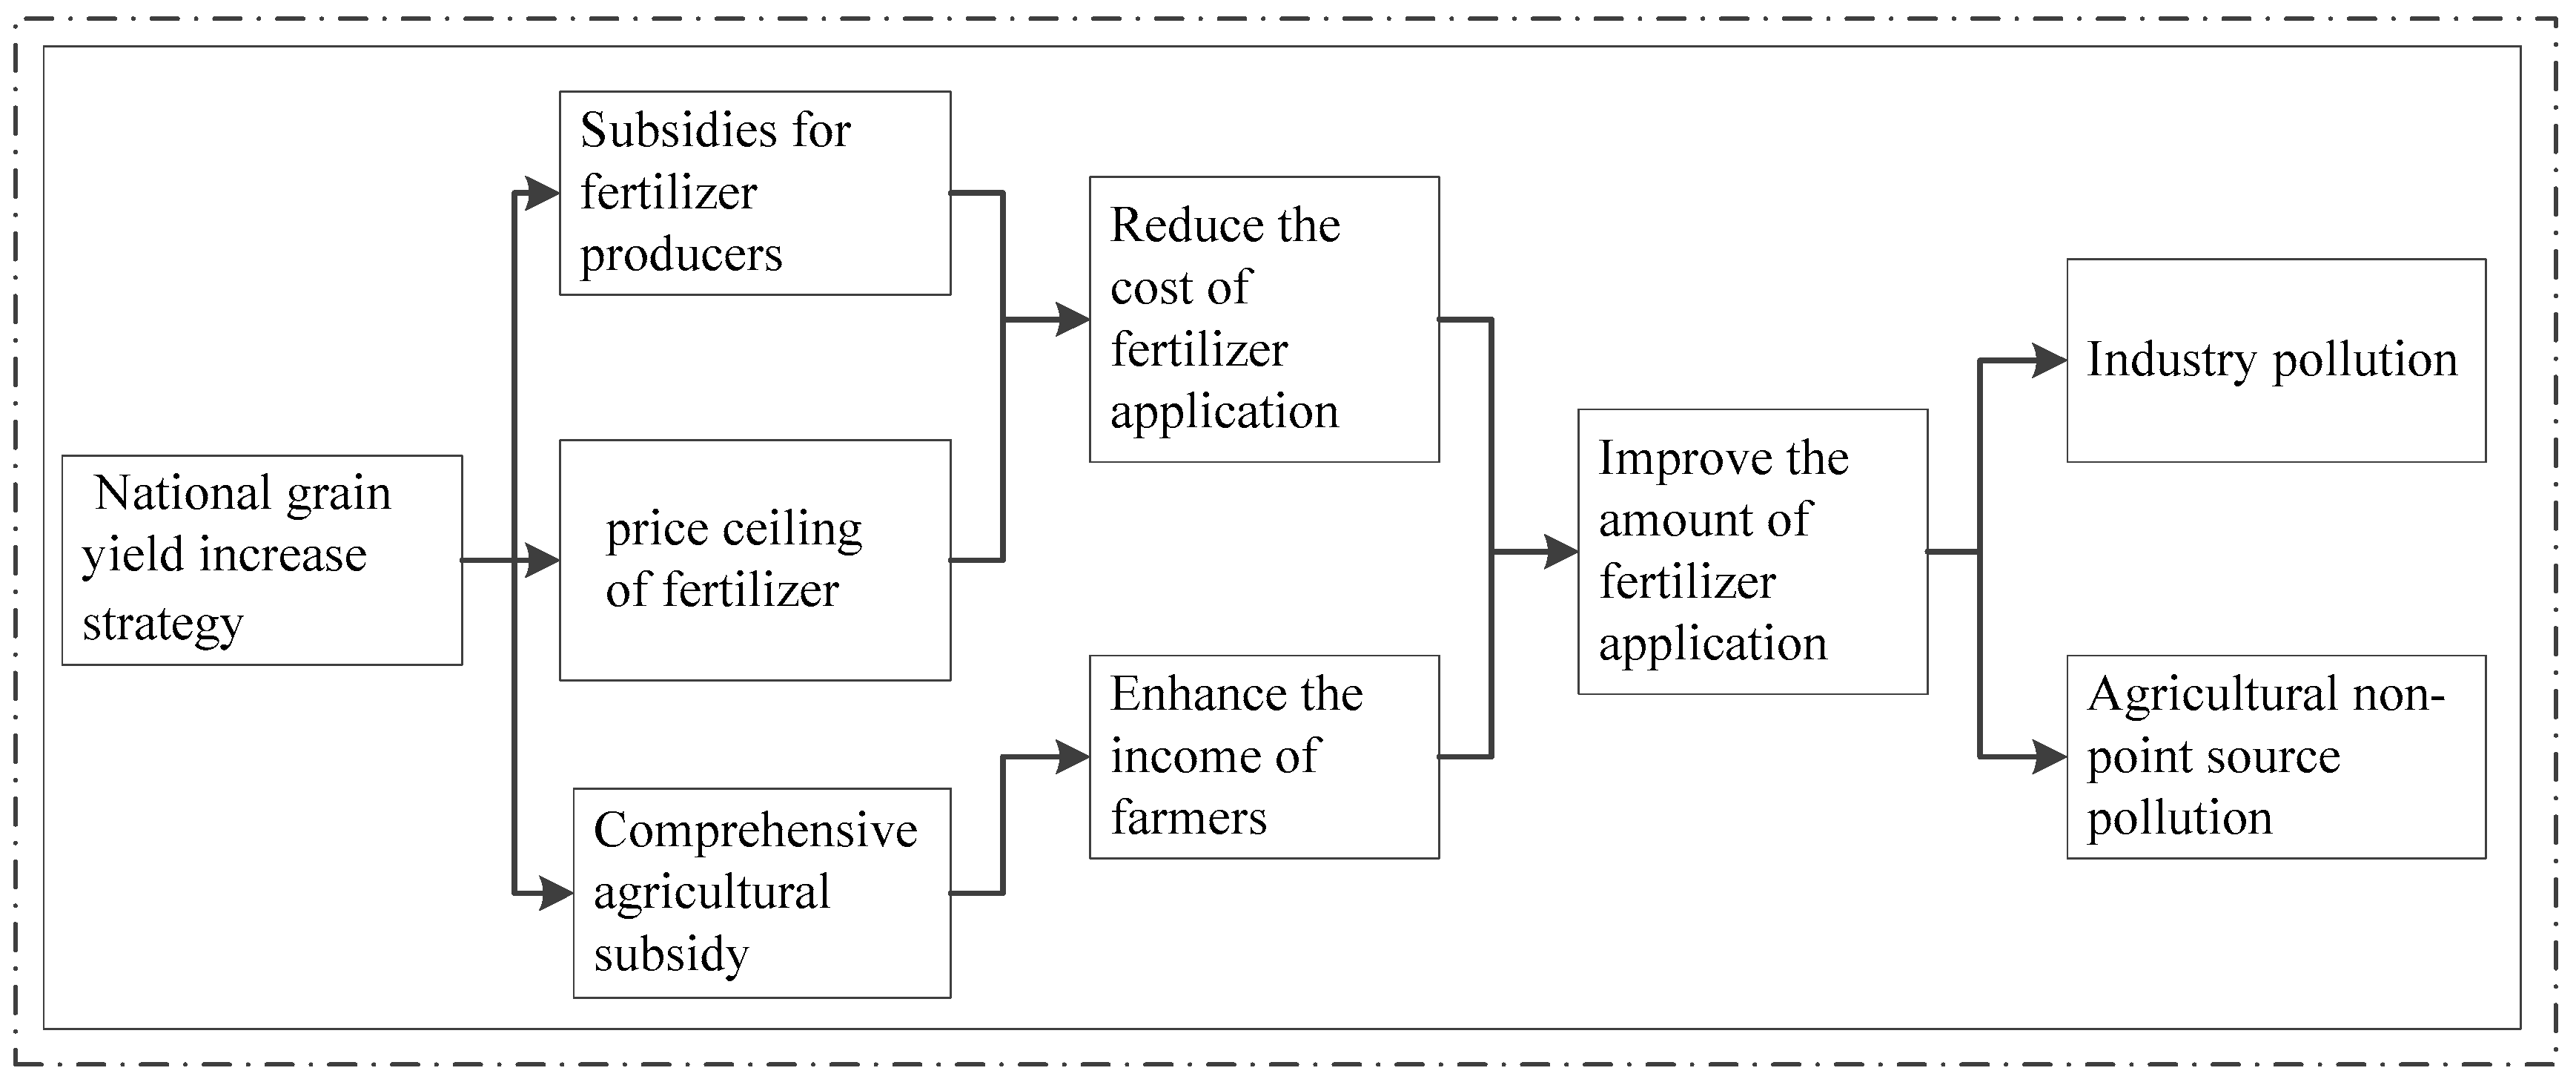
Since the beginning of the 21st century, the Chinese government has paid special attention to grain output, putting forward the agricultural development policy with “high yield, high quality and high efficiency” as the core of grain production in order to stabilize grain supply, and gives a series of policy supports to fertilizer as well as other elements of agricultural input that gradually raised the intensity of fertilizer application. For instance, the government provides preferential policies such as electricity price subsidies, freight price subsidies, price subsidies, interest subsidies, and refund and reduction of value-added taxes for fertilizer manufacturers [13]. Meanwhile, the government carries out the price ceiling policy of fertilizers in order to protect farmers’ grain income from rising prices of input factors such as fertilizers [14]. In addition, the government also supplies direct grain subsidies and comprehensive subsidies to grain farmers [15,16,17].
These policies directly or indirectly affect farmers’ grain planting scale and economic income and heighten the input of fertilizer and other input in the grain industry. Undoubtedly, these agricultural policies ignore the shortage of agricultural resources in China, and the concept of “focus on growth, regardless of development” has led to the continuous increase of chemical inputs such as fertilizers, turning China’s agriculture into the industry with the most extensive non-point source pollution [18,19]. The impact of national grain yield increase strategies on agricultural non-point source pollution through the increase of the fertilizer application amount is shown in Figure 1.
2.1.2. China’s Urban-Rural Dual Structure
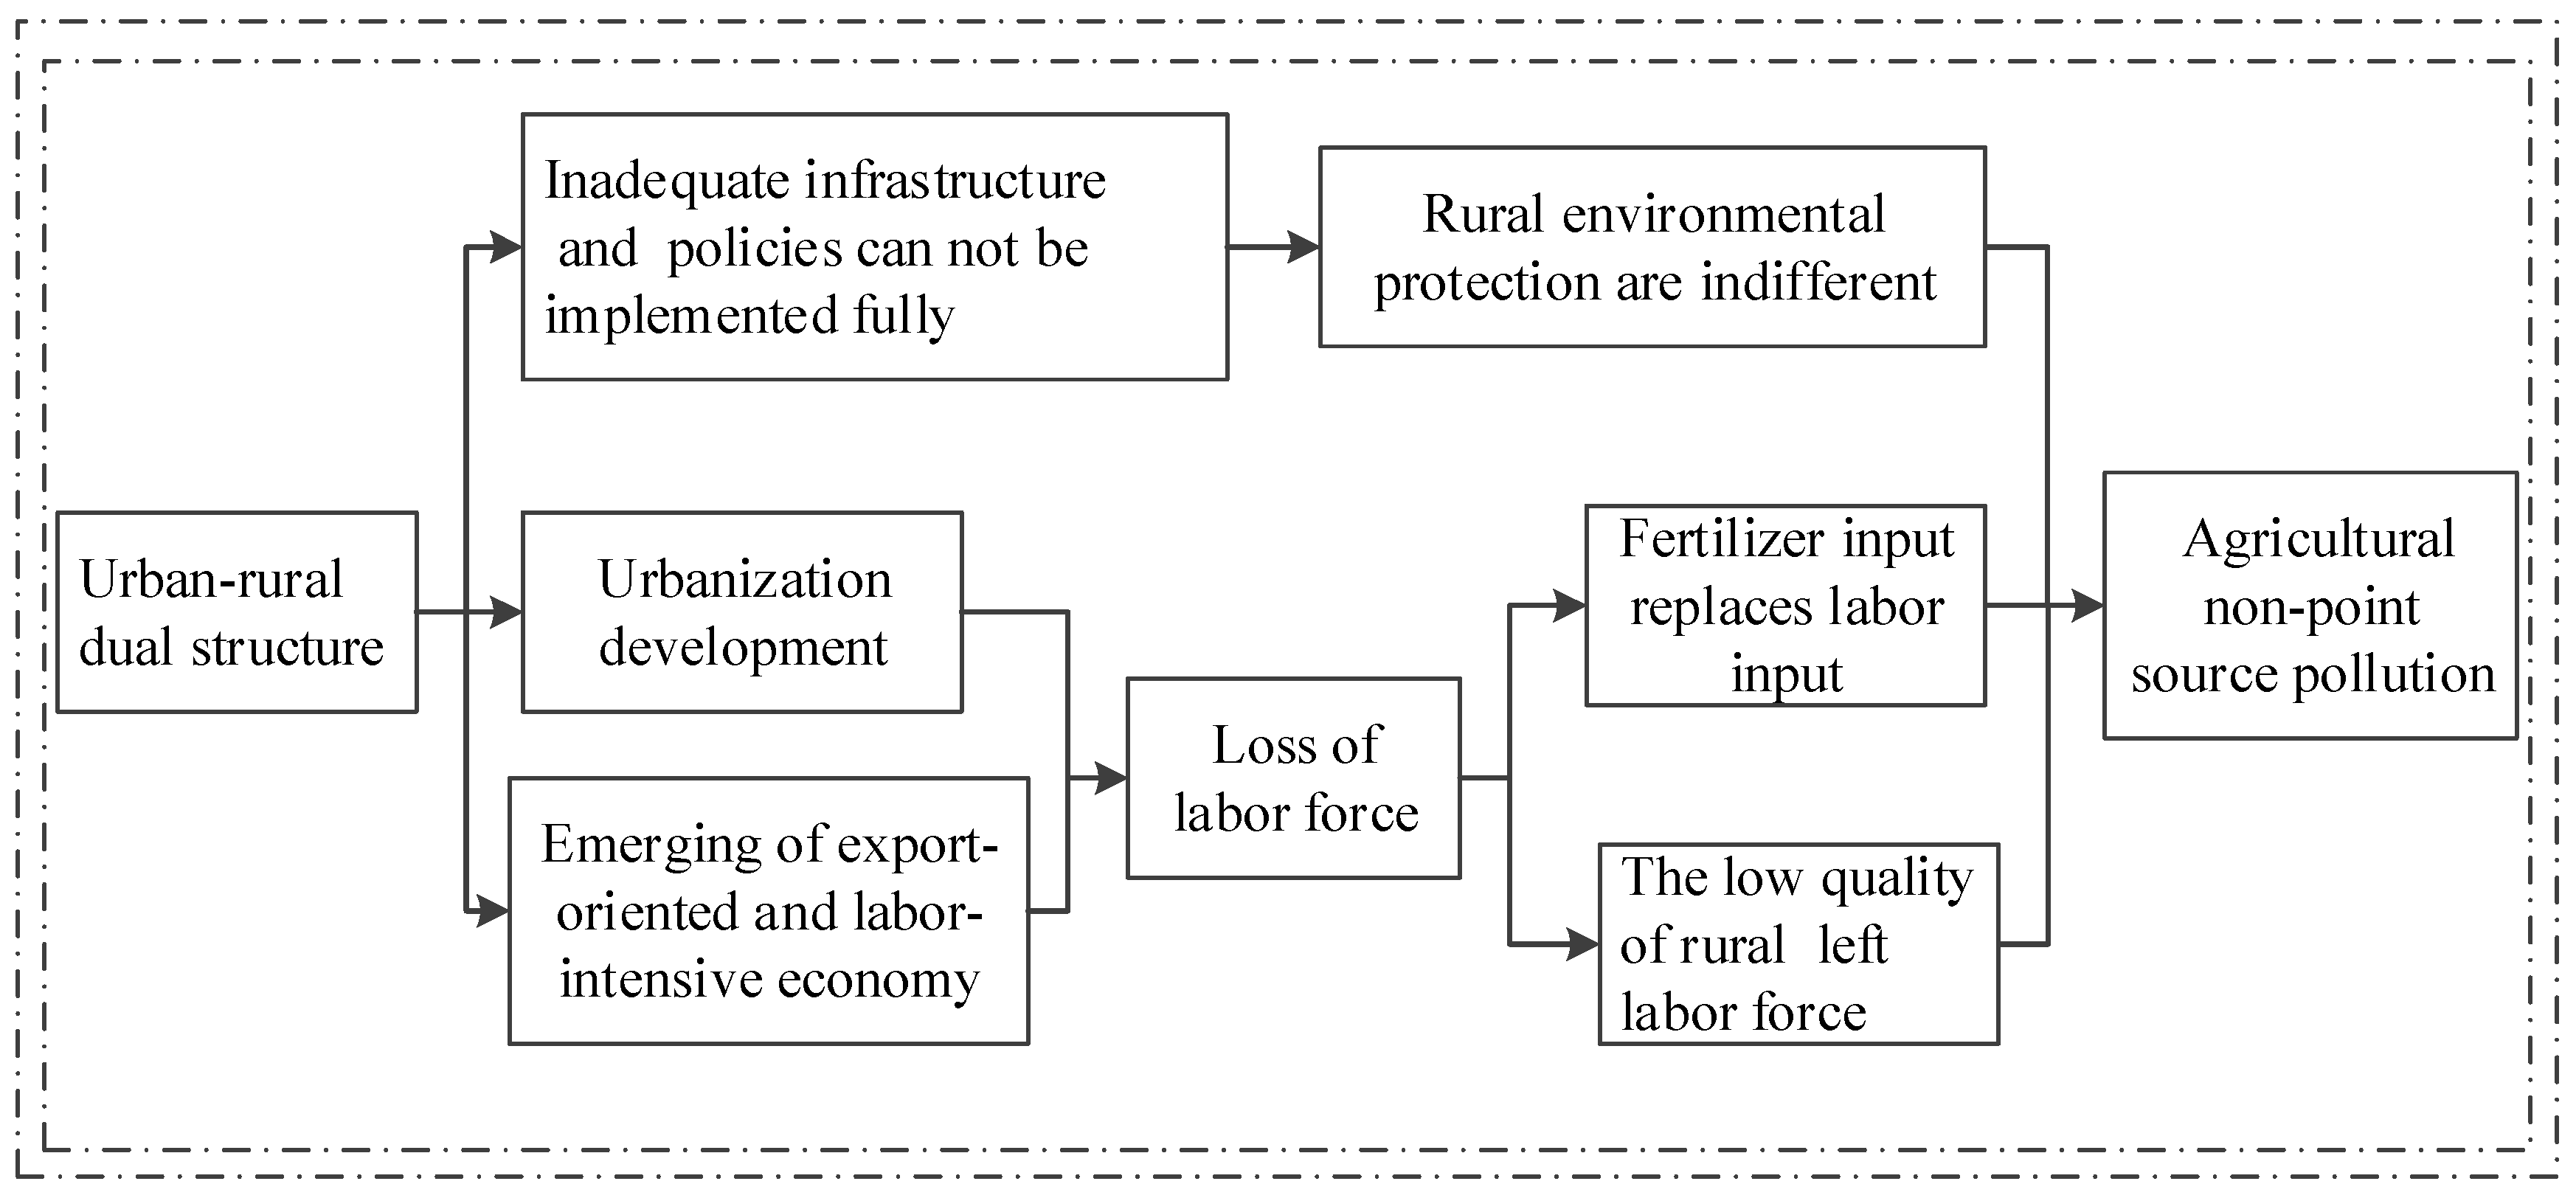
China’s long-standing urban-rural household registration system has accelerated the polarization of the urban-rural dual structure. Under the urban-rural dual structure, compared with urban areas that have solid basic conditions and policies, the supply of rural infrastructure is always insufficient, which results in the neglecting of environmental protection work for long periods of time [20]. On the other hand, since the reform and open policy in 1978, with the improvement of urbanization level and the emergence of export-oriented and labor-intensive economies in the Southeast coast of China, a large number of non-agricultural employment opportunities stimulate China’s unique phenomenon, called the "civilian labor wave", which also brings about the loss of rural young and middle-aged labor.
The influences of this phenomenon are multiple. Firstly, according to the theory of induced technological change and the theory of substitution of productive factors, in order to make up for the shortage of labor in rural areas, farmers will increase capital and technology input such as fertilizers and pesticides to ensure normal agricultural production. Many scholars have confirmed that the higher the level of non-agricultural employment in rural households, the higher the chemical fertilizers input intensity in agricultural production [21,22,23,24]. Secondly, the transfer of the rural labor force brings a large number of young and middle-aged educated workers into the cities, leaving elderly people, women, and children in rural areas who tend to be indifferent to agricultural non-point source pollution in the agricultural production process due to their low levels of education and environmental awareness [25,26]. The impact of China’s urban-rural dual structure on agricultural non-point source pollution is shown in Figure 2.
2.2. The Mesoscopic Level
2.2.1. The “Quasi-Public Good” Attribute of Rural Environment
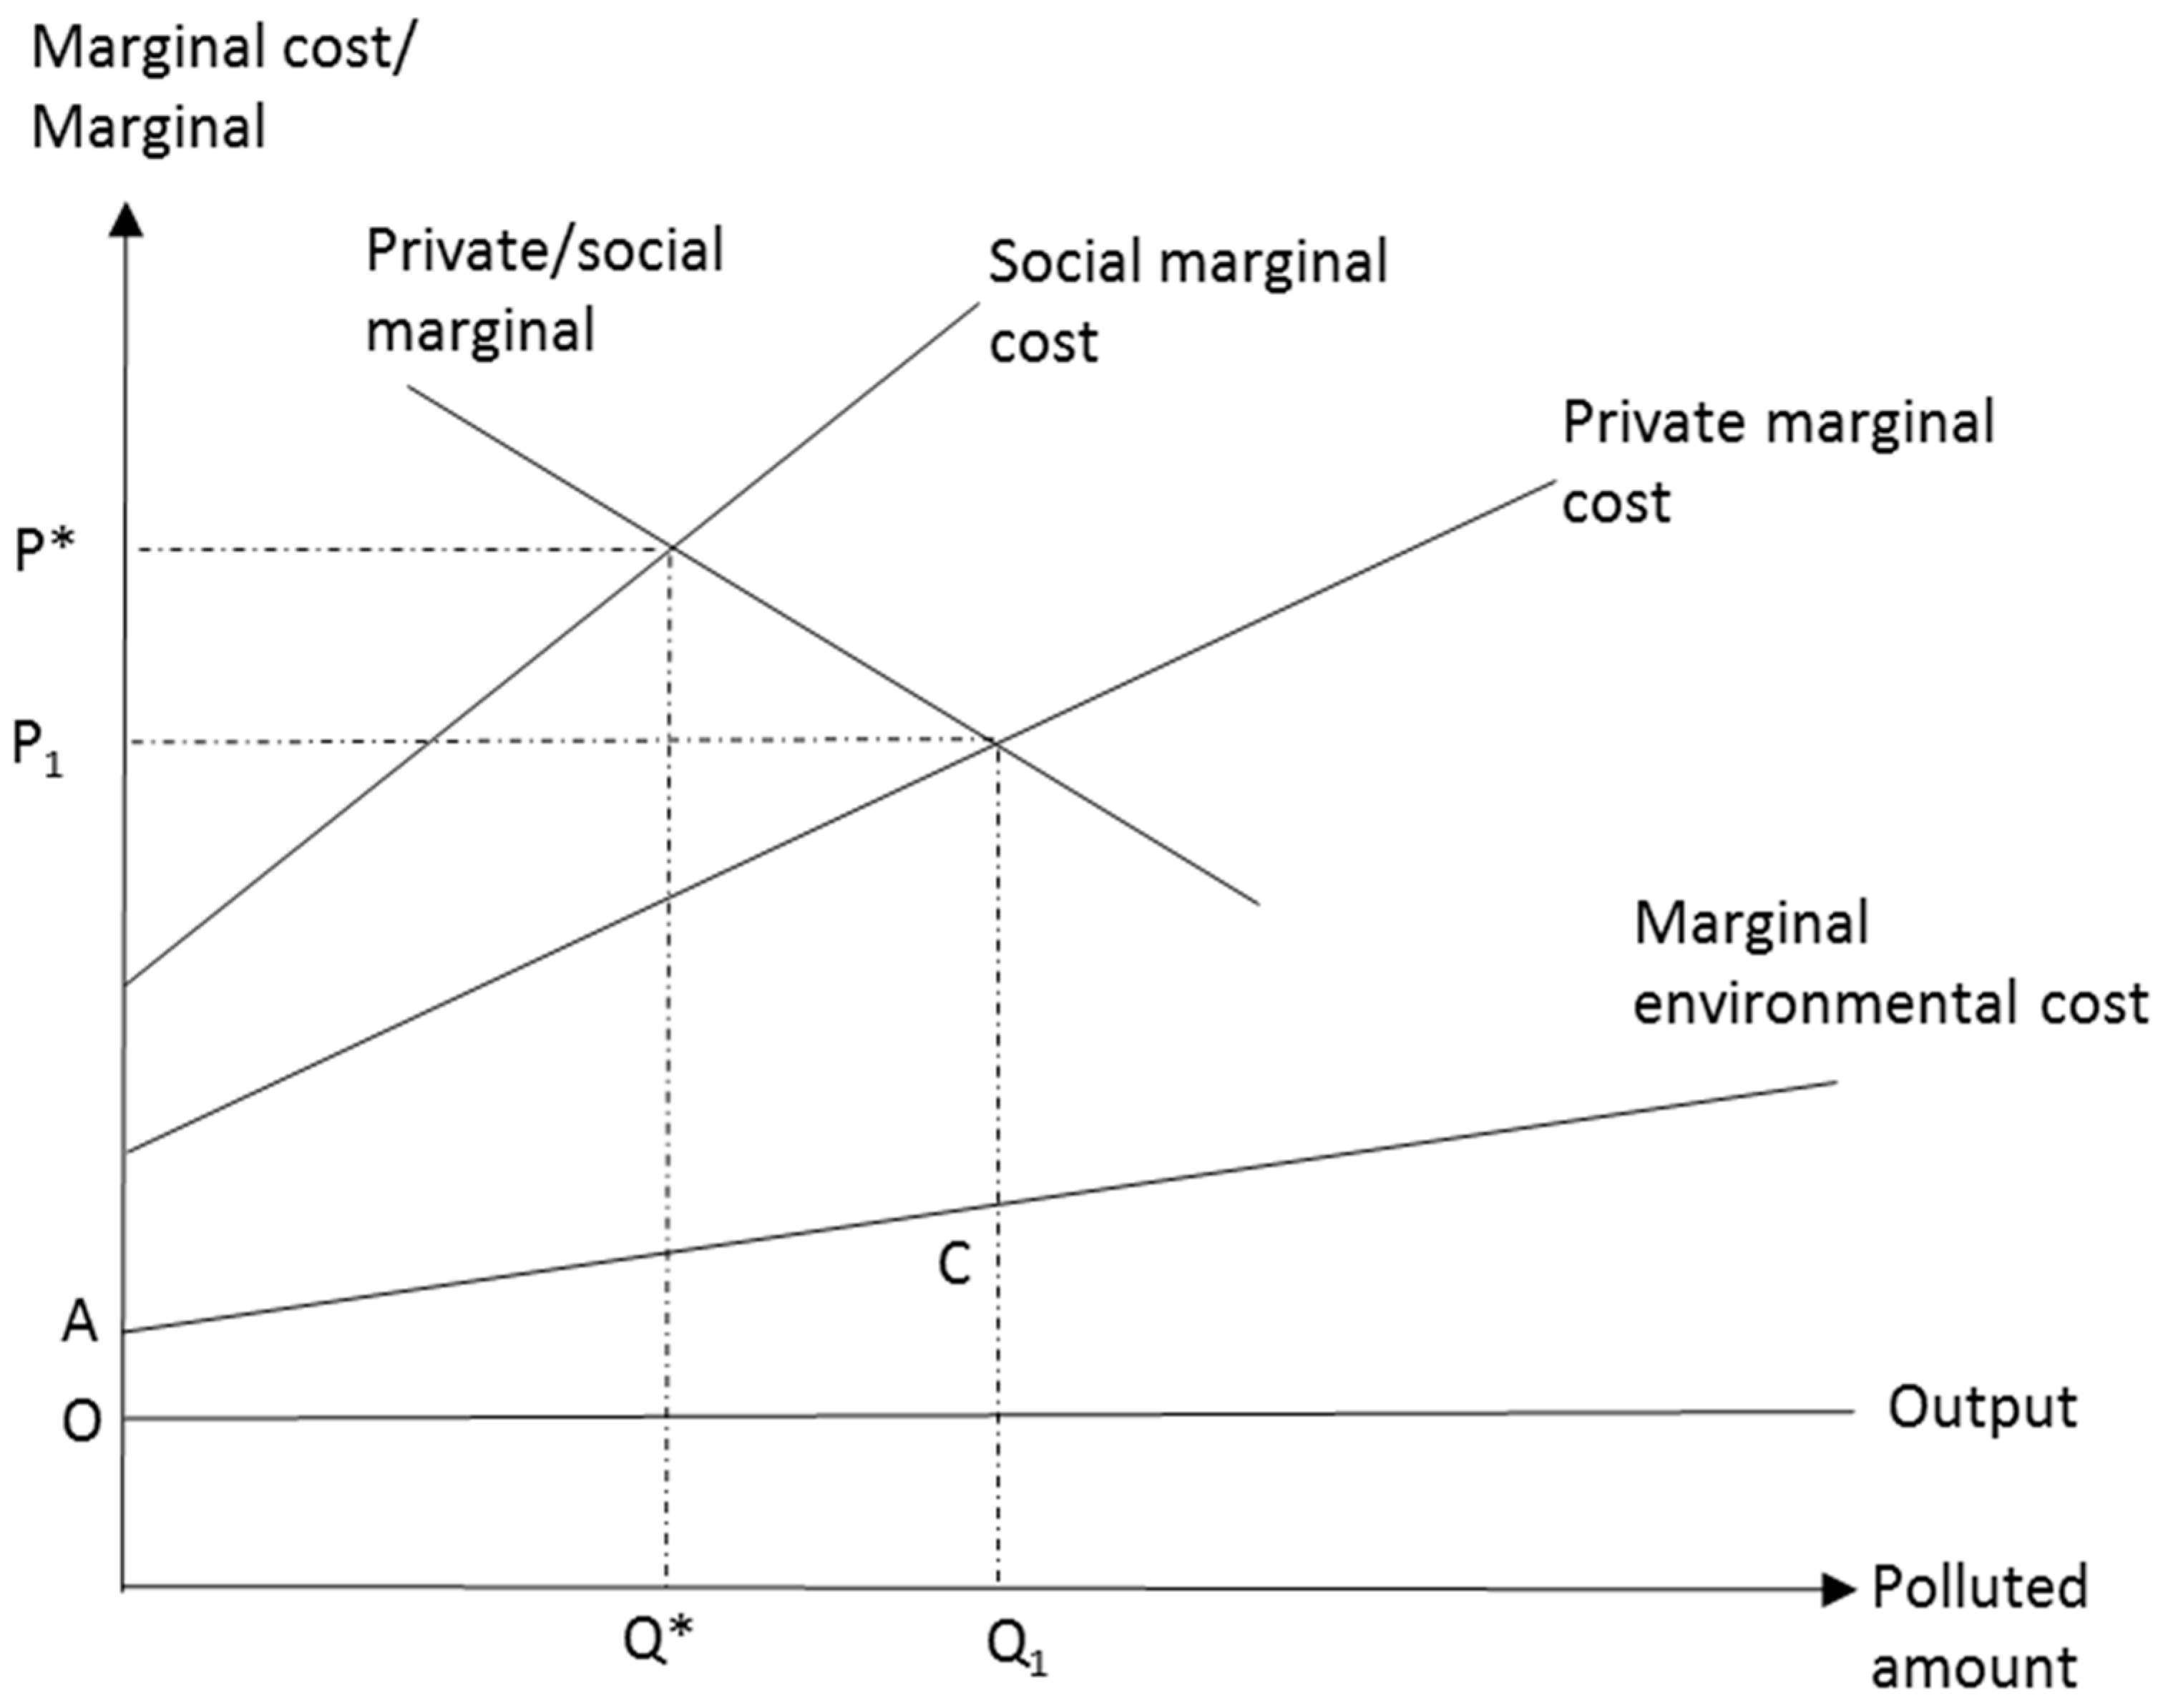
The rural environment has the attribute of quasi-public good in economics in that anyone is permitted to use the product, which will lead to over usage and rapid consumption of public resources, resulting in “Tragedy of the Commons” [15]. Farmers are often assumed to be rational smallholders whose economic behavior is aimed at the maximization of individual interests in economics. Therefore, when the private marginal cost is equal to the private marginal benefit, farmers will adopt a positive production attitude, which is shown in Figure 3. Some of the well-known studies including Hardin [27] and both Feeny et al. [28] and Milinski et al. [29] confirm this view. At this time, the optimal private output of farmers is Q1, and the non-point source pollution emission of agriculture is P1. Taking society as a whole, the social output Q*, including the cost of environmental governance, should be located at the point where the marginal cost to society is equal to the marginal benefit.
Since agricultural production is not completely cost-free to the environment, in order to obtain the optimal social output Q*, the agricultural non-point source pollution emission at this time is P*. Due to the reality of production and decision-making, farmers often do not take the external costs of agricultural production into account, while the external costs are undertaken by the agricultural ecological environment and society. In Figure 3, Q1-Q* is the excess low-efficiency output of agriculture, and P1-P* is the excessive pollution emission of agriculture. The difference between the social marginal cost of agricultural production and the private marginal cost is defined as the marginal cost of the environment, and the area of ACQ1O is the cost required for environmental pollution control.
One of the characteristics of agricultural non-point source pollution is the problem of overproduction, which is caused by negative externalities. The essence of controlling the agricultural non-point source pollution is the process of the internalization of external costs, however, simply relying on market mechanisms will lead to "market failure", and government intervention will lead to "government failure", which is unable to complete the internalization of external costs, resulting in a serious abuse of agricultural fertilizers causing agricultural non-point source pollution. This is the difficulty of establishing the policy of controlling agricultural non-point source pollution [30].
2.2.2. The Disparity of Agricultural Production
The high cost of monitoring and management of agricultural non-point source pollution caused by the disparity of agricultural production is also an important cause for the intensification of agricultural non-point source pollution. The disparity of agricultural production arises from two main reasons. First, the regional and temporal variability of agricultural production. Being different from point source pollution discharged by industrial and service industries through sewage outlets, agricultural non-point source pollution discharge point is not fixed, lacking a clear source of pollution, and meanwhile, the discharge is not continuous. The variation of the spread of climate, geomorphology, geology and other natural environments further deteriorates the uncertainty of agricultural non-point source pollution. As a result, agricultural pollution sources and pollutants are not easy to detect until they have accumulated to a certain extent.
Second, China’s land fragmentation production mode is also inconducive to the control of agricultural non-point source pollution. Goldstein and Udry (2008) [31] and Pan [32] find that measures such as reducing the degree of fragmentation of arable land in China and realizing farmers’ moderate scale of operation are conducive to reducing farmers’ fertilizer input on the whole, so as to control or reduce non-point source pollution caused by excessive fertilizer input. Overall, the dispersity of agricultural production and the fragmentation of land systems, on the one hand, make it difficult to track and monitor the non-point source pollution of agriculture, and on the other hand, make it hard to put into the measures taken to control the non-point source pollution practice.
2.3. Micro Level
The aggravation of agricultural non-point source pollution mainly comes from the farmers’ production behavior at the micro level. It is well known that agricultural production in China is characterized by typical small-scale household production. Under the influence of various factors at the macro and mesoscopic levels, farmers constantly avoid production risks by means of "high chemical input" to ensure the maximization of family interests in a certain year [23]. At the micro level, the main reasons are as follows:
2.3.1. The Pressure of Survival and Development
The high dependence of agricultural production on the natural environment leads to the vulnerability and instability of farmers’ income. Under the current situation of imperfect social security in rural areas, agricultural income is an important source of income for farmers, especially in poor areas. On the way to getting rid of poverty, higher output can be obtained by simply increasing inputs such as that of chemical fertilizers [23]. The exploitative development and utilization of natural resources is the most direct and easy choice to avoid risks, which is bound to be accompanied by the intensification of agricultural pollution and ecological deterioration [24].
2.3.2. Farmers’ Short-Sighted Behavior in Production
There are two incentives for farmers’ short-sighted production behaviors. Firstly, the imperfect farmland property right system induces farmers’ short-sighted production behaviors. Yao [33], Yu et al. [34], and Ali et al. [35] point out that imperfect land property rights systems lead to irregular adjustment of land, which makes it difficult for farmers to expect stable returns. Facing the uncertainty of production resources, farmers are less willing to make long-term investments. He [36] implies that the nature of land property rights is a major factor determining agricultural production input. Compared with rented fields, farmers are more willing to use organic fertilizers to maintain soil fertility in their private fields. Secondly, because of the diversification of the household income, the part-time business model brings about shortages of field management and increased the input of chemical fertilizers and pesticides, thus exacerbating agricultural non-point source pollution [23].
2.3.3. Lack of Scientific and Technological Support
The loss of agricultural technological staff leads to farmers’ lack of scientific and in-depth guidance in the agricultural production process. The phenomenon of "depending on feeling and experience" in agricultural production directly leads to the prominent abuse of fertilizers and pesticides. Zhu et al. [37] imply that farmers’ lack of knowledge and awareness of ecological protection, coupled with the lack of relevant knowledge publicity and promotion technology, are the main reasons why farmers will not take the initiative to adopt environmentally friendly production behaviors. Ge et al. [13] use the micro-survey data of 376 peasant households in Jiangsu province to show that participating in training can significantly reduce the intensity of chemical fertilizer application and enhance a farmer’s willingness to adopt the technologies of soil testing and fertilizer recommendations. Yu and Zhang [38] demonstrate that, given environmental safety, most farmers are willing to adopt environment-friendly agricultural production technology, and participation in agricultural technological training can significantly improve farmers’ willingness to produce environmentally friendly products.
From the macro, mesoscopic, and micro perspectives respectively, we see that some scholars have qualitatively evaluated the effect of policies on farmers’ behaviors, but there is a lack of quantitative analysis. This paper first comprehensively analyzes the formation mechanism of agricultural non-point source pollution due to excessive chemical fertilizer application. Combined with literature review and expert consultation, this paper will carry on the environmental protection policy settings from the macro, the mesoscopic, and the micro aspects, including macro environmental productive input subsidies, enacting tailwater discharge standards at the meso-level and the micro-level, and wheat planting technological support. This paper employs the experimental choice model to examine farmers’ willingness to adopt policy choices, quantifying the results and providing suggestions to optimize current agricultural environmental policies.
3. Basic Principle and Model Design of the Experiment
3.1. Basic Principle of the Experimental Choice
Because of the limitations of knowledge of farmers in China, it is difficult to illustrate the term "revealed preference" to them, and it is time-consuming to teach farmers to choose their best preference among a series of choice. Therefore, using revealed preference data of farmers is inappropriate. We use the stated preference approach that is widely used by economists to analyze consumer behavior and evaluate the value of market and non-market products on this basis [39], providing evidence for marketing strategies and policy development. Stated preferences can be divided into two broad categories: Conditional value assessment and model choice. Among a series of model choice approaches, the experimental choice is one of the most widely used methods. Since the mid-1990s, this method has been applied to environmental resource management and models for policy scenarios and contingent assessments, and a series of achievements have thereby been obtained [4,40,41,42,43,44].
In a choice scenario, the experimental choice requires the respondents to make a choice among a set of virtual products or options. In general, the approach is implemented through the form of questionnaires. The respondents are first presented with a series of problem selection sets, each of which contains a number of projects that are environment-related but composed of different attribute states of public goods. Then the respondents are required to choose their own best preference plan, assuming that the respondents can maximize their own utility and choose the best solution. The difference in the preference values determines the difference in the projects. Often, the respondents are required to make multiple choices in multiple scenarios. According to the information of the selected respondents, a quantitative model is used to quantify the respondents’ preferences for each product and project, and further to evaluate the attributes and values of the products and projects. The specific model assumptions and the construction process are as follows:
Suppose the respondent selects project from selection sets, then the random utility obtained is:
where indicates the observation effect, which can be obtained through the project and the characteristic of the respondent, is the error term. In the detailed process, usually adopts the following two expressions:
Equation (2) is called a base model. In Equation (2), is the alternative specific constant, which represents the benchmark utility of “maintaining the status quo” or “not selecting”, or the average utility attributed by all other programs not included in the model [45]. The explanatory variables contain program attribute variables, are coefficients to be estimated. In order to reflect the difference in behavior between the respondents with different characteristics who choose “maintaining the status quo” or “not choosing”, in Equation (3), a cross term composed of and the characteristic variables of respondents, are added. are the coefficients of the cross terms. Therefore, Equation (3) is also called the cross term model.
When there exists a parallel project , the probability of the respondent selecting the project is:
In Equation (4), under different distribution hypotheses, the corresponding models are formed. Suppose are independently and identically distributed () and satisfy the assumption of independence from irrelevant alternative (), then Equation (4) is a multinomial logit (MNL) model. Therefore, in this paper, we use the MNL model to analyze the selections under different policies since the MNL model is one of the best candidates depicting the reactions of the wheat growers.
On this basis, the marginal value or willingness to pay for each policy attribute is:
where is the coefficient of each policy variable to be estimated, and is the marginal value of the average payment of the farmer. Here, we use the estimated coefficient of the payment term.
3.2. Description of Survey Areas
This paper takes the Fenwei Plain, one of the main wheat producing areas in Northern China, as the main survey area. From the Fenwei Plain, we finally selected Heyang County, Weinan City, Shaanxi Province, to carry out the survey. The specific reasons include the following: Firstly, the main stream of the Weihe River flows from Tianshui (Gansu Province) to Qishan County (Shaanxi Province), Fufeng County (Shaanxi Province) and other counties, and injects into the Yellow River in Tongguan County of Weinan City. It is acknowledged that one of the important pollution sources in the Shaanxi section of the Weihe River Basin is the agricultural non-point source pollution. Farmers’ understanding of the reduction and governing willingness of non-point source pollution caused by excessive usage of fertilizer in this area has important significance for protecting the water quality of the Weihe River and even the water quality of the Yellow River Basin. Secondly, Heyang County is a traditional agricultural county in Weinan City, and its planting area of wheat and corn accounts for more than 80% of the total sown area of crops. It is also an important experimental base for technological innovation and promotion of wheat breeding and cultivation in Northwest A&F University, as this area has a good technological environment.
Heyang County has 11 townships and 1 sub-district office. Therefore, this paper adopts the principle of stratified sampling. In each township except one sub-district office, five administrative districts are selected according to the rank of per capita arable land area from high to low. Then we select 10 sampling farmers each district, achieving 550 samples totally. Excluding the incomplete and invalid questionnaires, the total number of valid questionnaires is 516, and the effective ratio is 93.8%.
3.3. The Design of Policy Variables
Based on the macroscopic, mesoscopic, and microscopic causes of the over-application of fertilizers of farmers, the literature review, expert consultation, and sufficient pre-survey, this paper finally chooses the organic fertilizer subsidies from the macro-level, the agricultural tailwater discharge standards from meso-level, and three environmental policies of wheat planting guidance technologies from the micro-level as policy scenario property variables to analyze the response of wheat growers to policy preferences in reducing the amount of chemical fertilizer applied. The organic fertilizer subsidy refers to encouraging farmers to reduce the amount of chemical fertilizer application and to add organic fertilizer to increase the long-term fertility of the soil. The government subsidizes the price of the organic fertilizer for the farmers based on the volume they use. The agricultural tailwater discharge standard refers to the restrictive technological standards for agricultural production in which the government controls the total amount of nitrogen and phosphorus from the source in order to control the agricultural non-point source pollution. Wheat planting technological guidance refers to comprehensive guidance with regards to the time, amount, and type of fertilization of wheat during the whole growth period. The properties of each variable and their status levels are shown in Table 1.
On 10 July 2018, the Ministry of Agriculture and Rural Affairs of the People’s Republic of China promulgated the "Reply to No. 2357 Recommendation of the 13th National People’s Congress", which explicitly proposed subsidies for the application of organic fertilizers for agricultural production. In many provinces, the subsidy per mu is 100 yuan when the application amount of commercial organic fertilizer per mu is 250 kilograms, that is, 400 yuan subsidy per ton. Based on the current policy, when designing the purchase policy of organic fertilizer, the design of the subsidy standard for applying organic fertilizer in this paper is 400 yuan and 600 yuan per ton. On the other hand, Han and Yang [4] point out that using monetary value to estimate the target results of each program needs to consider the influence of multiple factors, such as the increase and decrease of fertilizer application, and inflation, which may cause deviations in understanding by the farmers. Hence, this paper uses the change in the amount of fertilizer applied to determine the target results. The determination is based on the approximate target by the historical annual increase in the amount of wheat fertilizer input in Shaanxi Province from the "2005–2017 National Agricultural Product Cost-Return Data Collection".
In addition, according to the macro, meso, and micro factors of wheat planter’s chemical fertilizer applications and agricultural non-point source pollution, we also design the characteristic variables of farmer households related to fertilizer reduction, including the age of the household head, gender, per capita arable land area, education level, and the number of wheat plots. The statistical description of each variable is shown in Table 2. It can be seen that the average age of wheat growers in Heyang County of Shaanxi Province is about 55 years old, and the phenomenon of aging is prominent; the labor adequacy ratio is 0.271, indicating that the population engaged in wheat cultivation in the family only take up about 1/4 of the total population of the family. The average number of wheat plots planted is 3.226, which is relatively scattered.
4. Method Model Fitting Results Analysis
4.1. Survey Selection Sets
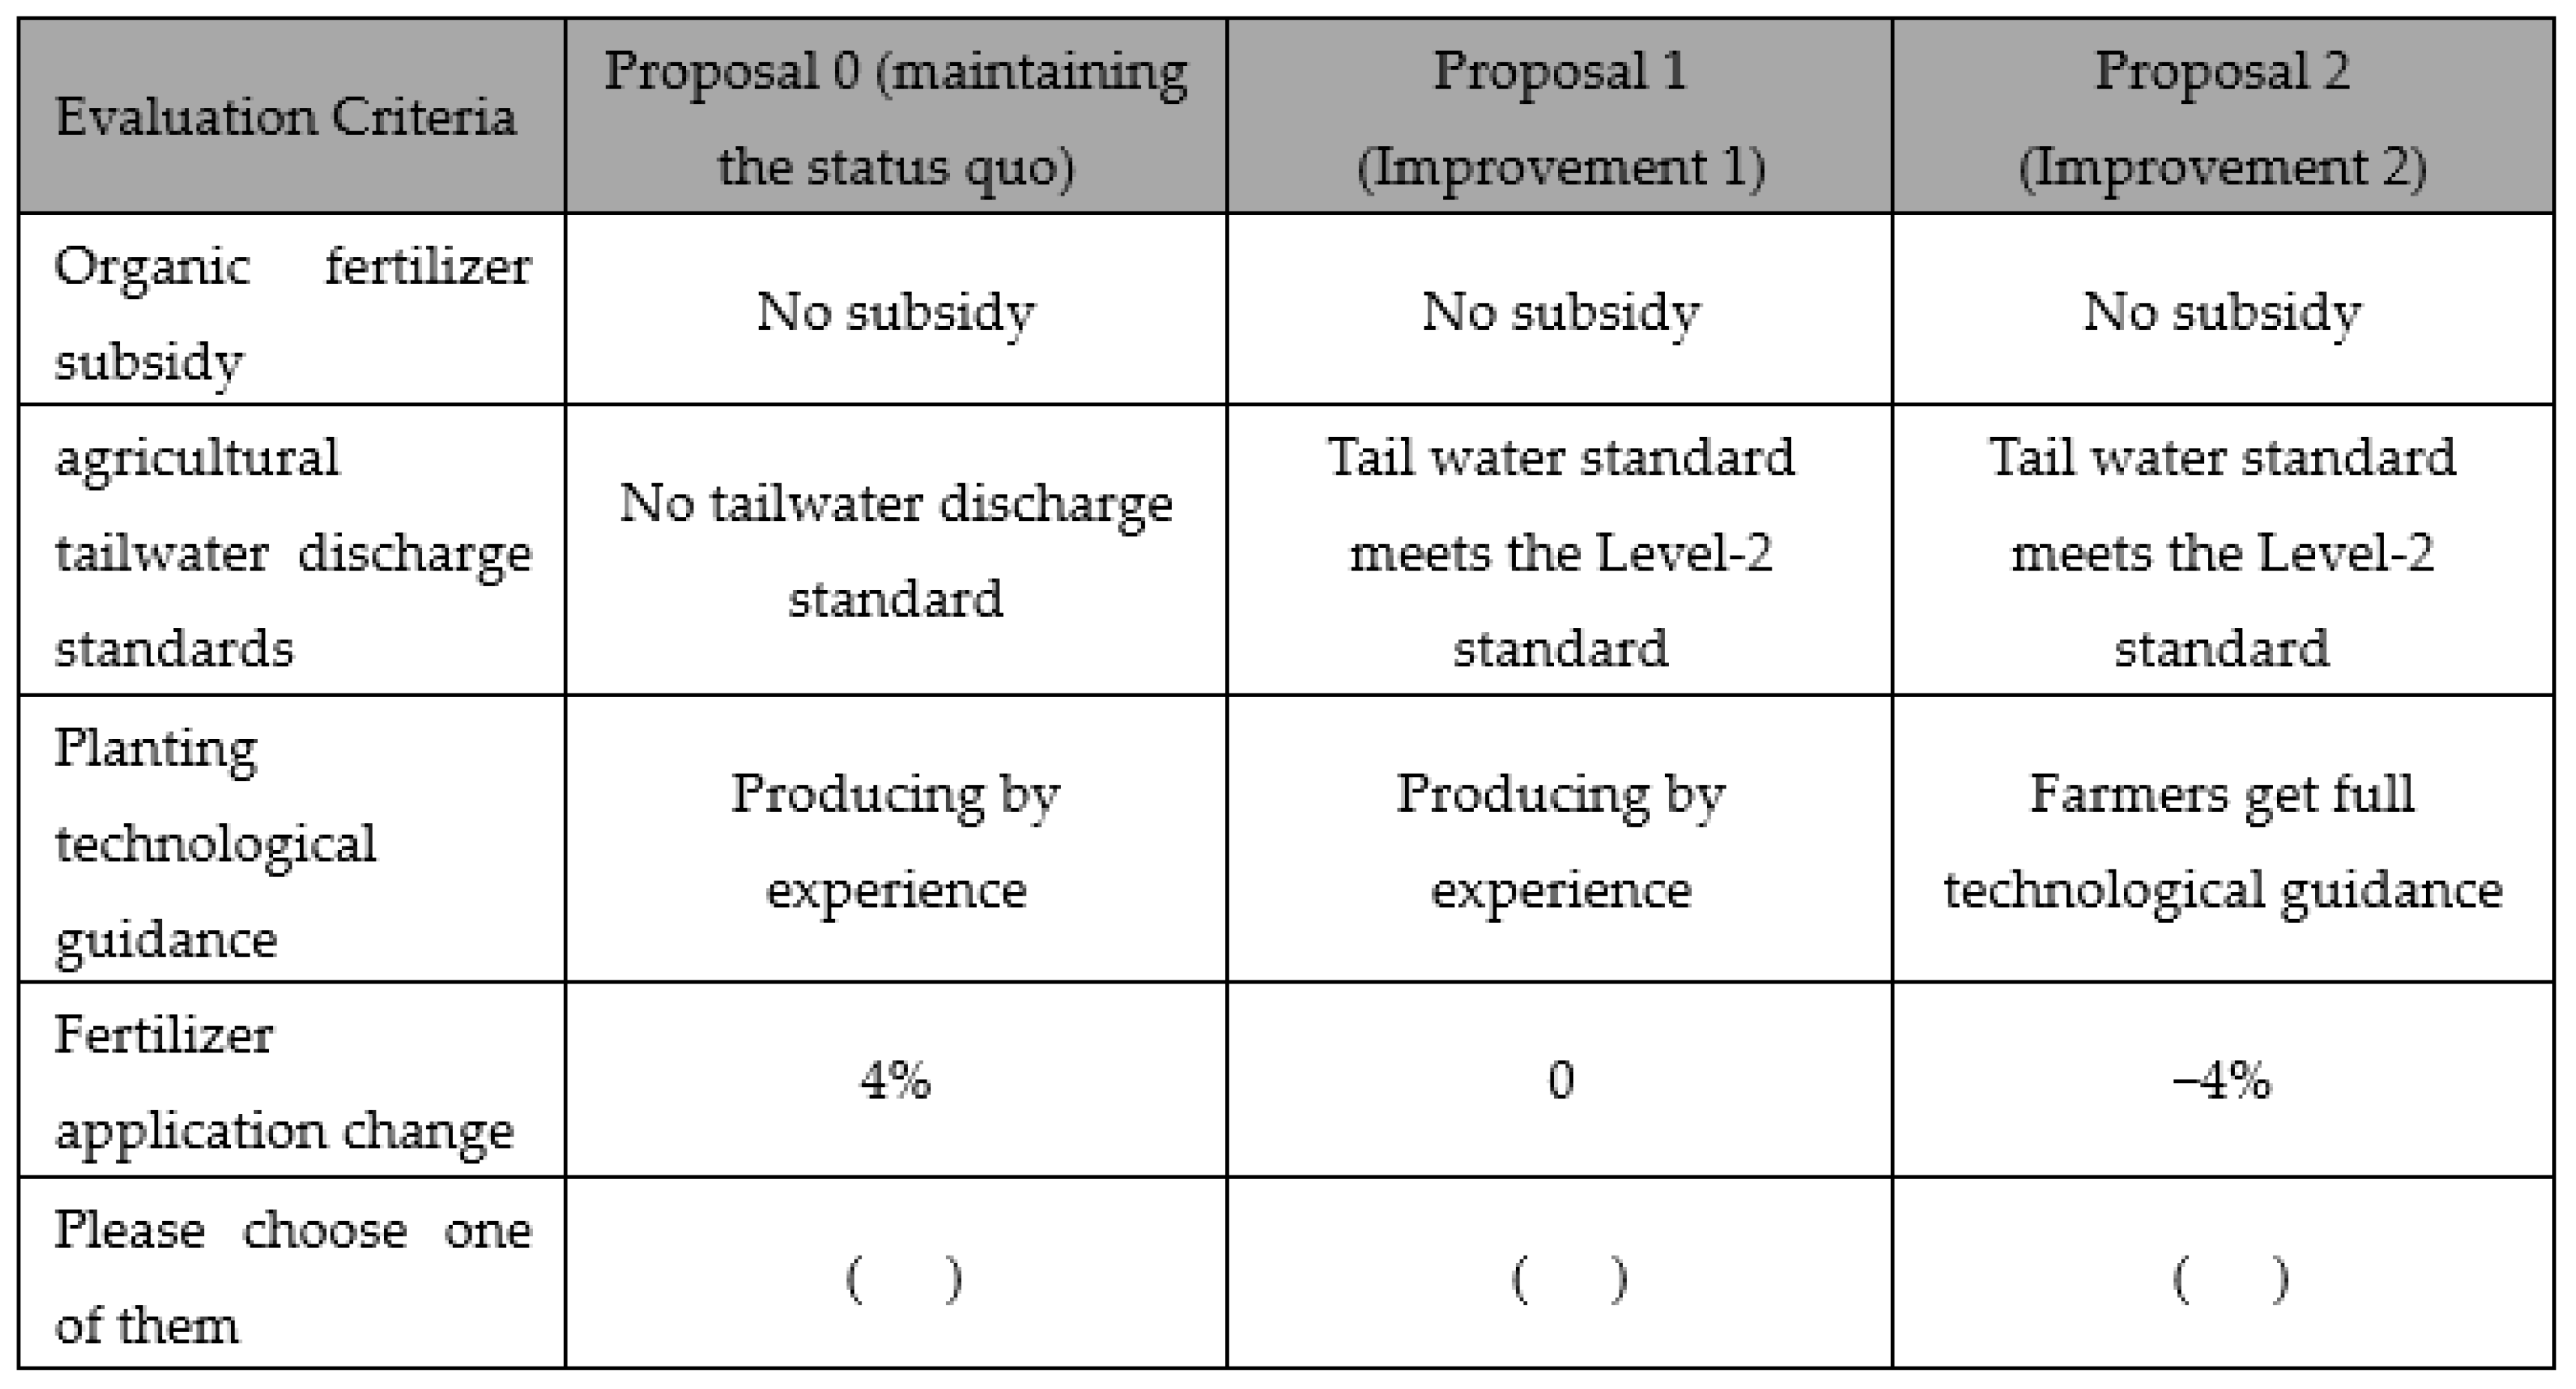
According to the research methods and experience from the relevant literature, in each of the experimental choice questionnaires, the respondents are provided with three selection sets, each of which covers three alternative choices, of which “Scheme 0” refers to the situation of fertilizer application by farmers without taking any fertilizer reduction measures. “Scheme 1” and “Scheme 2” are state values under different fertilizer reduction measures by farmers. There are 81 (3 * 3 * 3 * 3) possible selections after permutation and combination, and 3160 selection sets (, "Scenario 0" does not enter the combination). In practice, it is unrealistic to use so many alternatives for the experimental choice. It is necessary to select representative selection sets [33,46,47]. This paper uses the orthogonal experimental design software "Ngene1.1.1" to generate 12 groups, in total 36 selection sets. The effectiveness of the experimental design test results are , , (where and are derived from the asymptotic variance-covariance matrix, is the determinant of the matrix, is the trace of the matrix, under ideal conditions, the experimental design can minimize both. Furthermore, in the result generation process, by adjusting the selection sets using a dominant strategy, the survey questionnaire is finally shown in Figure 4, which contains 12 different versions. In this table, the percentage change of fertilizer application −4%, 0%, and 4% are from the 10 year training data from Shaanxi Province and are correspond to the dependent variables denoted as 1, 2, and 3 respectively, which indicate that larger values of nominal dependent variables correspond to less fertilizer used.
Combined with the results obtained from the pre-survey, first of all, it is necessary to further optimize the expressions of each indicator to ensure that the questionnaire can be accurately understood by the respondents. Secondly, the investigators will be specially and carefully trained on various indicators, being explained with the specific operation steps of the experiment as well as the attention needed, and being asked to explain the meaning of each indicator and status value to the respondents in detail to ensure that the respondents can understand the meaning of each indicator and policy to the greatest extent.
4.2. Empirical Results and Analysis of the MNL Model
According to the results of the questionnaire survey, this paper uses two different MNL models for quantitative analysis. The dependent variable of MNL model 1 is the choice made by wheat growers under different selection sets. The independent variable is the state attribute of each option under different selection sets, namely price subsidy, tailwater standard, chemical fertilizer application change, state level, and technological support; the dependent variable of MNL model 2 is the same as the dependent variable in MNL model 1. In addition to the independent variable in MNL model 1, the independent variable includes the characteristic variables such as gender of the household head of the wheat grower, age, education level, and per capita cultivated land area and the number of wheat plots.
The fitting results of MNL model 1 and MNL model 2 are shown in Table 3. Both models pass the integrity tests, and the attributes of most variables, such as price subsidies, tailwater standards, and technological support are all positive and significant at the 5% level, indicating that the questionnaire design and model choice are scientific and rational [48]: The organic fertilizer subsidy, tailwater discharge level-1 and level-2 standards, and planting technological guidance lead the growers to reduce the application of fertilizers. We also see that the coefficient of fertilizer application change is negative, which indicates that a higher nominal dependent variable corresponds to less fertilizer applied, which is consistent with the design of the model. Compared with MNL model 1, the results of the paper are based on the MNL model 2, and the reasons are as follows: First, the pseudo R2 value shows that the estimation result of MNL model 2 is superior to that of the MNL model 1. Second, MNL model 1 fails to fully satisfy the IIA, which requires the characteristic of each category of data be either uncorrelated with other characteristics or be weakly correlated with other characteristics. Han and Yang [4] believe that adding explanatory variables to the model can effectively improve this deficiency. Therefore, this paper adds the characteristic variables of the surveyed households to the MNL model 1 to reduce the estimation bias of MNL model 2 caused by the IIA hypothesis. The fitting results of MNL model 2 in Table 3 indicate that under the premise of keeping the policy variables significant, most of the farmer’s characteristic variables have a significant impact on the policy selection results at the 5% level.
4.3. Policy Scenario Analysis
Table 4 shows the changes in the amount of chemical fertilizer applied by farmers under different policy environments. The results indicate that the change in fertilizer application by farmers with comprehensive technological guidance is the most significant. It is shown that if comprehensive technological guidance is provided to wheat growers, the fertilizer application rate will be reduced by 6.975%; The second most significant term is the organic fertilizer price subsidy policy; when providing appropriate organic fertilizer subsidies, the fertilizer application rate of wheat growers will be reduced by 5.182%. The policy variable that has the least impact on the amount of wheat fertilizer application is the farmland tailwater standard. Under level-2 and level-1 standards, the fertilizer application rate by farmers will be decreased by 1.851% and 0.774%, respectively, indicating that wheat growers in Heyang County, Shaanxi Province are not willing to reduce the amount of chemical fertilizer application by adopting the agricultural tailwater discharge standard, thereby reducing agricultural non-point source pollution. Under the current policy design, comprehensive technological guidance for wheat planting, coupled with price subsidies for the application of organic fertilizer, will improve the efficiency of the application of wheat fertilizer in Heyang County, Shaanxi Province, and further reduce agricultural non-point source pollution.
The choices of farmers are quite different when faced with different policy designs, and the main reasons for this are as follows: First, it is difficult for farmers to understand the true meaning of some policies. During the investigation, it is found that the agricultural tailwater discharge standards are more abstract than specific policies such as technological guidance and organic fertilizer subsidies. Therefore, farmers are inclined to make “convenience choices” when they choose, that is, the choice is not based on a complete understanding of the equivalent basis, but based on the individual’s subjective familiarity with the policy.
Second, the tailwater discharge standard has significant externalities. The conventional method for determining agricultural tailwater standards is to calculate the total nitrogen and phosphorus content in the tailwater of cultivated land in a certain area, but it is difficult to accurately quantify the nitrogen and phosphorus emissions of individuals. Therefore, it is hard to specify the punishment measures for each farmer. The effect of the policy can only be guaranteed through collective punishment. Hence, farmers tend to be “free riders”, which will greatly reduce the effect of agricultural tailwater discharge standards. Compared with Dowd et al. [49], who point out similar policies proposed by California’s Central Coast authorities, solving non-point sources of pollution problems by full guidance, subsidies, and tailwater standard, it analytically shows the impact of the policies on growers, but no quantitative results are made.
5. Conclusions and Policy Suggestions
Fertilizer is an important input in agricultural production and is known as “food for producing food”. However, excessive application of chemical fertilizer is prevalent in wheat planting industries in China, and it is also an important cause of agricultural non-point source pollution. Because agricultural non-point source pollution has the characteristics of pollution source diversity, spatial non-specificity, and time uncertainty, it makes agricultural non-point source pollution control difficult. In order to study agricultural non-point source pollution caused by excessive fertilizer application and farmers’ policy choices, this paper takes 516 wheat growers in Heyang County of Shaanxi Province as samples to analyze the formation mechanism of agricultural non-point source pollution from macro, meso, and micro perspectives. Also, three environment policies, organic fertilizer application subsidy, agricultural tailwater discharge standards, and planting technology guidance, are constructed. The experimental choice method is used to empirically analyze the policy preferences, choice behaviors, and fertilizer reduction effects of wheat growers.
The empirical results show that wheat growers show different preferences for the three policy variables. In wheat planting, if the farmers are provided with full guidance, the fertilizer application rate will be reduced by 6.98%. The second most significant variable is the organic fertilizer price subsidy policy. If appropriately provided, the fertilizer application rate will be decreased by 5.18%. The policy variable that has the least impact on the amount of wheat fertilizer application is the agricultural tailwater discharge standards. Under the tailwater level-2 and the level-1 standards, the fertilizer application will be reduced by 1.85% and 0.77%, respectively, indicating that the wheat growers in Heyang County, Shaanxi Province are not very willing to reduce the amount of fertilizer applied by adopting agricultural tailwater discharge standards. Under the current policy design, comprehensive technological guidance for wheat planting coupled with price subsidies for the application of organic fertilizer will improve the efficiency of the application of wheat fertilizer in Heyang County, Shaanxi Province, and further reduce agricultural non-point source pollution.
The research conclusions have important guiding value and policy implications for the application of chemical fertilizers in wheat production, alleviating agricultural non-point source pollution, and achieving the green sustainable development of wheat production. We use field survey collection data, constructing a model and quantitatively analyzing the results. First, most of the farmers’ engagements with wheat cultivation are based on “experience and feeling”, and do not pay attention to the farmland fertility equilibrium. The phenomenon of random fertilization is serious. Therefore, in order to effectively control agricultural non-point source pollution, it is necessary to take full advantage of the guiding role of technology. It is also necessary to promote technological guidance, combining the soil fertility status with local specified conditions to truly reduce the fertilizer input. In recent years, many local governments have vigorously disseminated soil testing and formulized fertilization technology, which not only increases the farmers’ incomes but also significantly reduces the fertilizer input into the farmland and achieves good results. Second, it is necessary to accelerate the enactment of the financial subsidy policy for the application of organic fertilizers, and to implement the organic fertilizer subsidies to the wheat growers, so as to realize the subsidy funding for organic fertilizers “earmarked for special purposes”. Third, strengthen the environmental protection propaganda to solve the problem that rural areas are unable to obtain information timely and effectively, or they obtain insufficient information due to region closure. Government departments can regularly organize environmental protection experts to go to the countryside to carry out these trainings, and to deliver face-to-face technological demonstration guidance, coupled with newspapers, leaflets, television, radio, and rural new media to farmers to raise farmers’ awareness of environmental protection. Compared with other papers qualitatively analyzing the impact of policies on the growers, our paper uses survey data to quantitatively describe the phenomenon. However, in order to have a more throughout conclusion, more field surveys need to be done in the future.
Author Contributions
Conceptualization, H.W. and Y.G.; methodology, H.W.; software, H.W. and Y.G.; validation, H.W., Y.G.; formal analysis, H.W.; investigation, H.W.; resources, H.W.; data curation, H.W.; writing—original draft preparation, H.W.; writing—review and editing, H.W. and Y.G.; visualization, H.W.; supervision, Y.G.; project administration, H.W.; funding acquisition, H.W.
Funding
This research was funded by “National Key Research and Development Program of China “The Assessment of Application Effect of Fertilizer and Pesticide Reduction Technologies on Wheat in Northern China”, grant number 2018YFD0200408” and “National Natural Science Foundation of China Youth Fund Project “Transmission Mechanism and Forecasting Effect of Financial Factors on Corn Price Fluctuation: Based on the perspective of food finance”, grant number 71603153” and “Key Research and Development Program of Shaanxi Province “Study on Long-term Multidimensional Poverty, Poverty Factors and Poverty Reduction Policies for Children in Shaanxi”, grant number 2018KW-065” and “Fundamental Scientific Research Funds of Central Universities in Shaanxi Normal University; the Special Fund Project “Evaluation of Comprehensive Benefits of Fertilizer and Pesticide Reduction Technology in Dryland Wheat in the Loess Plateau”, grant number GK201803092”.
Conflicts of Interest
The authors declare no conflict of interest.
References
- Zhang, J.; Zhang, J.; Wu, F. Study on the Influencing Factors of Fertilizer Input in Grain Production-Analysis Based on Durbin Model. Econ. Geogr. 2018, 2, 1–15. [Google Scholar]
- Yang, W.; Li, Q. Influencing Factors of Fertilizer Reduction Behavior of Rice Farmers. J. South China Agric. Univ. 2017, 16, 58–66. [Google Scholar]
- Chen, X. Environmental Problems and Rural Development in China. Manag. World 2002, 1, 5–8. [Google Scholar]
- Hang, H.; Yang, Z. An Empirical Analysis of Farmers’ Willingness to Accept Agricultural Non-point Source Pollution Control Policy: A Case Study of Mei County, Shaanxi Province. China Rural Econ. 2010, 1, 45–52. [Google Scholar]
- Ming, J.; Kong, X. Research Progress of Agricultural Non-point Source Pollution in China. J. Huazhong Agric. Univ. 2016, 2, 59–66. [Google Scholar]
- Huang, J.; Xu, C.; Ridoutt, B.G.; Wang, X. Nitrogen and phosphorus losses and eutrophication potential associated with fertilizer application to cropland in China. J. Clean. Prod. 2017, 159, 171–179. [Google Scholar] [CrossRef]
- Wen, Q.; Li, Z. Competitiveness Analysis of Coal-to-gas under Fluctuation of Crude-oil. Chem. Ind. 2015, 33, 8–14. [Google Scholar]
- Fang, S.; Liu, Z. Agricultural Non-point Source Pollution and Its Control Measures. Agric. Sci. Technol. Manag. 2006, 3, 22–23. [Google Scholar]
- Zhang, W.; Shi, M.; Huang, Z. Policy Scenario Simulation of Non-Point Source Pollution Control: A Case Study of Pinghu City in Taihu Lake Basin. China Rural Econ. 2006, 3, 40–47. [Google Scholar]
- Salmabi, K.A.; Lynette, K.A.; Bede, S.M.; Andrew, S.W.; Kadambot, H.M.S.; Zakaria, M.S. Response of Wheat to a Multiple Species Microbial Inoculant Compared to Fertilizer Application. Front. Plant Sci. 2018, 9, 1601–1608. [Google Scholar]
- Brynjolfsson, E.; Eggers, F.; Gannamaneni, A. Using Massive Online Choice Experiments to Measure Changes in Well-Being; NBER Working Paper; U.S. Federal Reverse: Cambridge, MA, USA, 2018.
- Mira, A.B.; Cantaralla, H.; Souza-Nettoa, G.J.M.; Moreira, L.A.; Kamogawa, M.Y.; Otto, R. Optimizing Urease Inhibitor Usage to Reduce Ammonia Emission Following Urea Application over Crop Residues. Agric. Ecosyst. Environ. 2017, 248, 105–112. [Google Scholar] [CrossRef]
- Ge, J.; Zhou, S. Economic Influencing Factors of Agricultural Non-point Source Pollution: Based on the Data of Jiangsu Province from 1978 to 2009. China Rural Econ. 2011, 5, 72–81. [Google Scholar]
- Yu, W.; Qi, Y.; Yu, H. An Empirical Study on the Effect of Agricultural Subsidies on Non-point Source Pollution of Fertilizers-Based on Provincial Panel Data. Rural Econ. 2017, 2, 89–94. [Google Scholar]
- Zhu, X.; Suk, H.; Wang, L.; Lee, S.; Shen, D. A Novel Relational Regularization Feature Selection Method for Joint Regression and Classification in AD Diagnosis. Med. Image Anal. 2017, 38, 205–214. [Google Scholar] [CrossRef] [PubMed]
- Cheng, G. The Logic and Thinking of China’s Grain Price Policy Reform. Agric. Econ. Issues 2016, 37, 4–9. [Google Scholar]
- Gao, M.; Song, H. Michael Carter. Does Subsidy Reduce the Loss of Food Production Efficiency?—Analysis Based on the Theory of Dynamic Asset Poverty. Manag. World 2017, 9, 85–100. [Google Scholar]
- Leslie, J.; Weersink, A.; Yang, W.; Fox, G. Actual Versus Environmentally Recommended Fertilizer Application Rates: Implications for Water Quality and Policy. Agric. Ecosyst. Environ. 2017, 240, 109–120. [Google Scholar] [CrossRef]
- Rao, J.; Xu, X.; Ji, X. Current Situation, Occurrence Mechanism and Countermeasure of Agricultural Non-point Source Pollution in China. Agric. Econ. 2011, 32, 81–87. [Google Scholar]
- Hong, D. Dual Control System of Urban and Rural Areas and Environmental Problems in China. J. Renmin Univ. China 2000, 1, 62–66. [Google Scholar]
- Hayami, Y.; Ruttan, V.W. Induced innovation in agricultural development. Curr. Eye Res. 1971, 36, 1028–1036. [Google Scholar]
- Binswanger, H.P. The measurement of technological change biases with many factors of production. Am. Econ. Rev. 1974, 964–976. [Google Scholar]
- Qiu, H.; Luan, H.; Li, J.; Wang, Y. Effect of Risk Avoidance on Farmers’ Excessive Fertilizer Application Behavior. China Rural Econ. 2014, 85–96. [Google Scholar]
- Zhang, K.; Deng, X.; Shen, Q.; Qi, Y. Agricultural Technological Progress, Transfer of Rural Labor Force and Farmers’ Income: A Grouped PVAR Model Based on Agricultural Labor Productivity. Agric. Technol. Econ. 2017, 6, 28–41. [Google Scholar]
- Hong, D.; Ma, F. Reproduction of Dual Social Structure: A Sociological Analysis of Non-point Source Pollution in Rural China. Soc. Res. 2004, 4, 1–7. [Google Scholar]
- Chen, C.; Zhou, N. The Influence of Farmers’ Cultural Qualities on Agricultural Production and Technology Selection Channels—Based on the Analysis of Farmers’ Questionnaires in Ten Provinces of China. China Rural Econ. 2007, 9, 33–38. [Google Scholar]
- Hardin, G. The Tragedy of the Commons. Science 1968, 162, 1243–1248. [Google Scholar] [Green Version]
- Feeny, D.; Berkes, F.; McCay, B.J.; Acheson, J.M. The Tragedy of the Commons: Twenty-two years later. Hum. Ecol. 1990, 18, 1–19. [Google Scholar] [CrossRef]
- Milinski, M.; Semmann, D.; Krambeck, H.-J. Reputation helps solve the ‘tragedy of the commons’. Nature 2002, 415, 424–426. [Google Scholar] [CrossRef]
- Ma, Y. The Origin and Countermeasure of Environmental Pollution in Rural Areas of China at Present: Based on the Research Perspective of Regulatory Economics. J. Guangxi Univ. Natl. 2010, 32, 18–21. [Google Scholar]
- Goldstein, M.; Udry, C. The Profits of Power: Land Rights and Agricultural Investment in Ghana. J. Political Econ. 2018, 116, 981–1022. [Google Scholar] [CrossRef]
- Pan, D. Spatial and Temporal Differences and Influencing Factors of the Driving Effect of the Change of Chemical Fertilizer Consumption Intensity in China. Econ. Geogr. 2014, 34, 121–126. [Google Scholar]
- Yao, Y. China’s Agricultural Land System: An Analytical Framework. Chin. Soc. Sci. 2000, 2, 54–65. [Google Scholar]
- Yu, H.; Huang, J.; Rozelle, S.; Brandt, L.; Zhang, L. Land Right Stability, Land Transfer and Sustainable Utilization of Agricultural Land Resources. Econ. Res. 2003, 9, 82–91. [Google Scholar]
- Ali, D.; Deininger, K.; Goldstein, M. Environmental and Gender Impacts of Land Tenure Regularization in Africa: Pilot Evidence from Rwanda; World Bank Policy Research Working Paper 5765; World Bank: Washington DC, USA, 2011. [Google Scholar]
- He, L.; Huang, J. Stability of Land Use Right and Fertilizer Use: An Empirical Study of Guangdong Province. China Rural Obs. 2001, 42–48. [Google Scholar]
- Zhu, M.; Li, X.; Cheng, G. Analysis of the Impact of Comprehensive Income Subsidies on Total Factor Productivity of Maize in China-DEA-Tobit Two-stage Method Based on Provincial Panel Data. China Rural Econ. 2015, 11, 4–14. [Google Scholar]
- Yu, Y.; Zhang, J. Farmers’ Willingness to Adopt Rice IPM Technology and Its Influencing Factors: Based on Survey Data of Hubei Province. China Rural Agric. 2009, 77–86. [Google Scholar]
- Alemu, M.H.; Mørkbak, M.R.; Olsen, S.B.; Carsten, J. Attending to the Reasons for Attribute Non-attendance in Choice Experiments. Environ. Resour. Econ. 2013, 54, 333–359. [Google Scholar] [CrossRef]
- Zhai, G.; Suzuki, T. Public willingness to pay for environmental management, risk reduction and economic development: Evidence from Tianjin, China. China Econ. Rev. 2008, 19, 551–566. [Google Scholar] [CrossRef]
- Song, Y.; Wang, X.; Zhang, H. Dynamics Simulation of Ammonia Nitrogen Absorption in a Rural–Urban Canal on the Northeast China Plain. Water Sci. Technol. 2018, 11, 622–633. [Google Scholar] [CrossRef]
- Scholz, R.; Geissler, B.W. Feebates for Dealing with Trade-offs on Fertilizer Subsidies: A Conceptual Framework for Environmental Management. J. Clean. Prod. 2018, 189, 898–909. [Google Scholar] [CrossRef]
- Mayer, A.-K.; Wang, H. Regulations Concerning Pesticides and Fertilizers. In Handbook of Agri-Food Law in China, Germany, European Union; Springer: Cham, Switzerland, 2018; pp. 277–346. [Google Scholar]
- Jin, S.; Zhou, F. Zero Growth of Chemical Fertilizer and Pesticide Use: China’s Objectives, Progress and Challenges. J. Resour. Ecol. 2018, 9, 50–59. [Google Scholar]
- Meyerhoff, J.; Liebe, U. Status Quo Effect in Choice Experiments: Empirical Evidence on Attitudes and Choice Task Complexity. Land Econ. 2009, 85, 515–528. [Google Scholar] [CrossRef]
- Duke, J.M.; Borchers, A.M.; Johnston, R.J.; Absetz, S. Sustainable agricultural management contracts: Using choice experiments to estimate the benefits of land preservation and conservation practices. Ecol. Econ. 2012, 74, 95–103. [Google Scholar] [CrossRef]
- Xu, T.; Zhao, M.; Qiao, D.; Shi, H. Accounting of Compensation Standards for Water-saving Irrigation Technology from the Perspective of Externality-Based on Selective Experiment. J. Nat. Resour. 2018, 33, 1116–1128. [Google Scholar]
- Jin, J.; Jiang, C. Application of Selective Test Model Method in the Protection of Cultivated Land Resources: A Case Study of Wenling City, Zhejiang Province. J. Nat. Resour. 2011, 26, 1750–1757. [Google Scholar]
- Dowd, B.M.; Press, D.; Huertos, M.L. Agricultural nonpoint source water pollution policy: The case of California’s Central Coast. Agric. Ecosyst. Environ. 2008, 128, 151–161. [Google Scholar] [CrossRef]
Figure 1.
The impact of the national grain yield increase strategy on agricultural non-point source pollution.
Figure 1.
The impact of the national grain yield increase strategy on agricultural non-point source pollution.

Figure 2.
The impact of China’s urban-rural dual structure on agricultural non-point source pollution.
Figure 2.
The impact of China’s urban-rural dual structure on agricultural non-point source pollution.

Figure 3.
The impact of the "quasi-public good" attribute of the rural environment on agricultural non-point source pollution.
Figure 3.
The impact of the "quasi-public good" attribute of the rural environment on agricultural non-point source pollution.

Figure 4.
Example of a questionnaire in the experimental choice.


Table 1.
The attributes and the state level of each variable in the experimental choice method.
| Attributes | State Level | Definitions of the State | Value |
|---|---|---|---|
| Organic fertilizer subsidy | 1 | No subsidy | 0 |
| 2 | Application of organic fertilizer, 400 yuan per ton subsidy | 400 | |
| 3 | Application of organic fertilizer, 600 yuan per ton subsidy | 600 | |
| Agricultural tailwater discharge standards | 1 | No tailwater discharge standard | Y = 1; N = 0 |
| 2 | Tail water standard meets the Level-2 standard | Y = 1; N = 0 | |
| 3 | Tail water standard meets the Level-1 standard | Y = 1; N = 0 | |
| Planting technological guidance | 1 | Producing by experience | Y = 1; N = 0 |
| 2 | Obtaining partial guidance | Y = 1; N = 0 | |
| 3 | Obtaining full guidance | Y = 1; N = 0 | |
| Fertilizer application changes | 1 | Fertilizer application increased by 4% | 0.04 |
| 2 | Fertilizer application rate keeps the status quo | 0 | |
| 3 | Fertilizer application decreased by 4% | −0.04 |
Table 2.
Control variables and the descriptive statistics.
| Variables | Definition | Mean | SD |
|---|---|---|---|
| Gender of Household head | M = 1, F = 0 | 0.877 | 0.328 |
| Age of Household head | ___ years old | 54.620 | 9.644 |
| Level of Education | 1 = Uneducated; 2 = Primary school; 3 = Middle School; 4 = High school/secondary school; 5 = College and above | 2.652 | 1.701 |
| Labor adequacy ratio | Labor engaged in wheat cultivation/total family population | 0.271 | 0.284 |
| Per capita cultivated area | Total area of cultivated land in households/total number of households | 2.347 | 1.963 |
| Wheat plots | Total number of plots of wheat grown in the family | 3.226 | 2.051 |
Table 3.
The fitted result of the MNL model.
| Sample Size = 1548 | MNL Model 1 | MNL Model 2 | ||||
|---|---|---|---|---|---|---|
| Coefficient | t-Value | Significance | Coefficient | t-Value | Significance | |
| 1. Attribute characteristic variable | ||||||
| Organic fertilizer subsidy | 2.156 *** | 4.220 | 0.000 | 1.469 *** | 4.099 | 0.000 |
| Tail water Level-2 standard | 0.344 | 1.299 | 0.183 | 0.219 | 1.281 | 0.205 |
| Tail water Level-1 standard | 0.632 ** | 2.021 | 0.037 | 0.523 *** | 5.197 | 0.000 |
| Partial technological guidance | 0.926 *** | 2.965 | 0.004 | 0.710 | 1.261 | 0.211 |
| Full technological guidance | 2.752 *** | 7.559 | 0.000 | 1.9770 *** | 5.141 | 0.000 |
| Fertilizer application change | −35.322 *** | −8.349 | 0.000 | −28.348 *** | −6.265 | 0.000 |
| 2. Farmer characteristic variable | ||||||
| Age | — | — | — | −0.025 ** | −1.980 | 0.049 |
| Education level | — | — | — | 0.065 *** | 7.094 | 0.000 |
| Labor adequacy ratio | — | — | — | 0.137 | 1.531 | 0.143 |
| Per capita cultivated area | — | — | — | 0.254 *** | 2.537 | 0.012 |
| Number of wheat plots | — | — | — | −0.212 ** | −1.977 | 0.049 |
| Log likelihood ratio | 46.365 | 52.593 | ||||
| Chi-square | 2761 | 2905 | ||||
| Level of significance | 0.000 | 0.000 | ||||
| Pseudo R2 | 0.458 | 0.561 | ||||
Note: *** significant at 1% level; ** significant at 5% level; * significant at 10% level.
Table 4.
Changes in the amount of chemical fertilizer applied by farmers under different policy environments.
Table 4.
Changes in the amount of chemical fertilizer applied by farmers under different policy environments.
| Attribution | Percentage of Fertilizers Farmers Willing to Reduce | Attribution | Percentage of Fertilizers Farmers Willing to Reduce |
|---|---|---|---|
| Price support | 5.182 | Guidance: (No guidance) | — |
| Tailwater discharge standard (No standard) | — | Guidance: (Partial guidance) | 2.506 |
| Tailwater discharge standard (Level-2 standard) | 0.774 | Guidance: (Full guidance) | 6.975 |
| Tailwater discharge standard (Level-1 standard) | 1.851 |
© 2019 by the authors. Licensee MDPI, Basel, Switzerland. This article is an open access article distributed under the terms and conditions of the Creative Commons Attribution (CC BY) license (http://creativecommons.org/licenses/by/4.0/).
Share and Cite
MDPI and ACS Style
Wu, H.; Ge, Y. Excessive Application of Fertilizer, Agricultural Non-Point Source Pollution, and Farmers’ Policy Choice. Sustainability 2019, 11, 1165. https://0-doi-org.brum.beds.ac.uk/10.3390/su11041165
AMA Style
Wu H, Ge Y. Excessive Application of Fertilizer, Agricultural Non-Point Source Pollution, and Farmers’ Policy Choice. Sustainability. 2019; 11(4):1165. https://0-doi-org.brum.beds.ac.uk/10.3390/su11041165
Chicago/Turabian StyleWu, Haixia, and Yan Ge. 2019. "Excessive Application of Fertilizer, Agricultural Non-Point Source Pollution, and Farmers’ Policy Choice" Sustainability 11, no. 4: 1165. https://0-doi-org.brum.beds.ac.uk/10.3390/su11041165
Note that from the first issue of 2016, this journal uses article numbers instead of page numbers. See further details here.