Using Causal Maps to Analyse the Major Root Causes of Household Food Waste: Results of a Survey among People from Central and Southern Italy


Department of Economics, University of Molise, Via F. De Sanctis, 86100 Campobasso, Italy
Sustainability 2019, 11(4), 1183; https://0-doi-org.brum.beds.ac.uk/10.3390/su11041183
Submission received: 12 January 2019
/
Revised: 15 February 2019
/
Accepted: 20 February 2019
/
Published: 23 February 2019
(This article belongs to the Section Sustainable Agriculture)
Abstract
:Food waste is an important sustainability issue that needs to be addressed. Consumer behaviour is one of the biggest sources of food waste in developed countries. To successfully reduce consumer-related food waste, it is necessary to have a clear understanding of its major root causes at the level of the individual. The present manuscript presents the results of an exploratory on-line survey that was made available through Google Drive and conducted among a representative sample of 1058 Italian individuals. The information contained in the questionnaire related to the characteristics of the individual respondents, their attitudes to expenditure and food, and their opinions of measures to reduce or prevent food waste. Data analysis was conducted in three phases. The first phase allowed for the identification, with the application of descriptive statistics, of the socio-demographic characteristics of the respondents and why, what, and how much they wasted. In the second phase, linear regression analysis and causal maps were used to both measure the statistical dependence between variables and to identify the main root causes of food waste in the phase of individual consumption. As expected, the perceived quantity of food waste that was declared by respondents was very low. Among the major root causes identified, the socio-demographic characteristics of consumers, types of food shopping purchases, and consumer behaviour played a key role. A causal map was drawn, which offers an immediate vision of the major root causes and can be a useful tool for policymakers who intend to introduce measures to combat food waste. Finally, participants’ responses showed that the main initiatives needed to eliminate waste are the separate collection and dissemination of more information on the impact that waste has on the environment. For these reasons, information and education policies are crucial for changing consumer lifestyles and raising awareness of the value of food.
1. Introduction
Approximately 1.3 billion tons of edible foodstuffs that are produced for human consumption, which account for one-third of global food production (32%), are wasted every year along the supply chain, from production to consumption [1]. This portion of lost and wasted food is enough to lift one-eighth of the global population out of malnutrition [2] and to mitigate the global challenge of meeting the increased demand for food, which could reach 50 to 70% by 2050 [3,4]. The amount of food waste (FW) drastically varies between countries and it is influenced by income, industrialization, and development levels [5]. In developing or low-income countries, around two-thirds of the food losses occur at the post-harvest and processing levels. This is mostly attributed to poor agricultural practices, technical limitations, financial and labour restrictions, and inadequate infrastructure for storage, processing, and transport [1,2,6]. On the other hand, in developed or medium to high-income countries, a considerable fraction of wasted food occurs at consumption, which is largely driven by consumer values, behaviour, and attitudes [1,7,8]. For this reason, in recent years, FW has received growing interest from local, national, and European policymakers, international organizations, non-governmental organizations (NGOs), as well as academics from various disciplinary fields.
Reducing food loss and waste is an interdisciplinary and multi-sector task that needs to be studied from different perspectives [9,10,11]. According to Parfitt et al. (2010) [12], an investigation of individual attitudes, values, and motivations behind food waste would be of significant interest and importance. International initiatives to combat the food loss and waste problem have been developed, which have led to the adoption of strategies to tackle this challenge [2,13,14,15,16]. Food is lost or wasted along the entire supply chain, from primary production to final private household consumption. The latter represents the largest food-waste fraction [17]. In the European Union (EU), FW along the supply chain has been estimated at approximately 89 million tons per year, corresponding to 179 kilograms (kg) per capita [18,19], and is expected to rise to about 126 million tons a year by 2020, unless action is taken [20].
Private households produce the largest share of EU FW (42%), followed by agriculture/food processing (39%), food service/catering (14%), and retail/wholesale (5%) [1,18,19,21]. Household FW is largely uncontrolled, despite numerous attempts to reduce it by means of behaviour modification, raising FW awareness, and persuasion using intrinsic and incentive motivation [22,23]. For these reasons, the FW issue is currently high on the political agenda in Europe and there is strong public debate surrounding it. In its roadmap for a resource-efficient Europe, the European Commission (EC) has set a target to cut the generation of food waste by one-half by 2020 [21]. However, the implementation of prevention measures to combat FW requires an understanding of the scale and form of wastage. This, in turn, depends on the availability of reliable data on food waste generation.
The present article aims to provide an overview of the major root causes of household FW, in addition to an analysis of the steps that consumers take to reduce it and further action that they would like to see. The findings of the on-line survey can support the identification of new actions and of new instruments to reduce FW and to increase consumer awareness of the issue. To achieve these aims, the paper is structured, as follows: Materials and Methods, gives a description of the statistical models that were used to analyse the data and the structure of the on-line survey. In Section 3, the sample description and the results of the application of the methods are presented. In Section 4, the findings of the present exploratory on-line survey are discussed in relation to other recent investigations that were conducted in Italy. Finally, in Section 5, there is a summary and some general comments.
2. Materials and Methods
Methodical Approach and the Structure of the On-Line Survey
There are a number of different methodological approaches that can be used to identify household food waste. Several studies [24,25,26,27,28,29,30,31] have used questionnaires or interviews, others kitchen diaries [32,33] or waste composition analysis [34,35,36], and some have used statistical data based on food supply [2,37,38] or on municipal waste [19,21,39]. The present paper is based on the results of an exploratory on-line survey that was performed in Italy using a questionnaire that was adapted for studies on FW that were carried out in Italy [40]. The survey was launched, through Google Drive in April 2017 and it remained on-line until July 2018. In addition, another institutional communication channel was used to distribute the questionnaire (personal e-mail).
In Italy, the results of similar surveys are available [27,28,29,30,31]. The purpose of the new on-line survey was to broaden analysis and to collect more recent information and to cover issues that have not been covered by previous inquiries. The questionnaire that was used for the exploratory on-line survey consisted of an informative introductory part, where the concept of FW was introduced, and a list of 44 questions that covered important issues about domestic FW. For this study, the definition of FW by Monier et al. (2010) [18] was used, which describes it as raw or cooked food materials and it includes food loss before, during, and after meal preparation in the household. Wastage was estimated in grams (g). The list of questions included a combination of one option and multiple-choice questions (Likert scale ranging from 0 to 5). It was divided into the following four sections:
- (I)
- The socio-demographic characteristics of the respondents: region of residence, age, gender, family status, level of education, household composition and size, occupation, and monthly income.
- (II)
- Food shopping purchases, household food expenditure and FW estimation: questions related to this section aimed to check weekly expenditure for food and non-alcoholic beverages, per capita daily food waste, products most wasted, and the behaviour and attitude of Italians towards shopping.
- (III)
- Consumer behaviour: in this section, a set of possible causes of food waste was put forward and the participants were asked to select those they believed to be the cause of their waste.
- (IV)
- Willingness and information needed to reduce food waste: in the last section, a list of possible measures to tackle FW was proposed and the respondents were asked to express their opinions.
Section 1 and Section 2 were made up of closed-ended questions. In contrast, Section 3 and Section 4 required the respondents to self-estimate using a Likert scale from 0 to 5 on issues such as the importance they gave to a set of FW causes and their opinion of a list of possible strategies for tackling food waste. The wording changed from “not at all” for value 0 to “very much” for value 5.
The data from the questionnaires and supplementary documentation were analysed using common descriptive statistics to explain the features of the sample and linear regression to identify the main determinants of FW. On the basis of the results of the linear regression, a causal map [41,42,43,44] was drawn, which was also known as a cause map, in order to have a more immediate vision of the major root causes of consumer behaviour regarding FW. Such maps can be a useful tool for policymakers who wish to introduce measures to address the problem of FW. Indeed, causal maps can be used for different purposes, such as improving quality, identifying root causes, designing information systems, and developing strategy [44]. Wilson et al. (1993) [45] defined Root Cause Analysis as an analytical tool that can be used to perform a comprehensive, system-based review of critical incidents.
3. Results
3.1. Sample Description
The data were collected from 1058 questionnaires that were completed by students and other consumers in some Italian regions. The sample of people who filled in the on-line questionnaire was self-selected, since they participated on a voluntary basis. The questionnaire was completed in its entirety by 80% (1008) of the respondents, as to a series of questions were not given answers. On the basis of the answers given in the first section of the questionnaire, respondents were found to be from five different regions in central and southern Italy: Abruzzo (7%) and Lazio (6%) and Molise (63%) in the centre and Apulia (13%) and Campania (11%) in the south.
The respondents mainly belong to Molise, which is a region of central Italy, with a territorial extension of 4438 km2 and, after the Valle d’Aosta, is the smallest region in Italy. With a population of 319,101 inhabitants, it has a population density of almost 71 inhabitants per km2. The administrative territory of the region is divided into 136 municipalities (comuni). Most of the municipalities (82) are located in mountainous and marginal areas with an altitude of > 600 m above sea level, with the remainder (54), located in hilly areas [46].
In terms of consumer income, tastes, shopping habits, and preferences, he five regions are homogeneous. Furthermore, climatic conditions, urbanization levels, agricultural production, and logistics are reflected in similar national food supply chains and food consumption attitudes. The sample was gender unbalanced (76% female and 24% male), which could be attributed to the prevalence of the idea that food issues are a woman’s responsibility.
Above all, the group of respondents effectively represents the interests of the young. Indeed, the age group most represented by the on-line survey was that between 18 and 27 (41%). The percentages for other age groups were as follows: 28–37 years (22%), 38–47 (13%), 48–57 (11%), 58–67 (9%), while the age group for those aged over 68 was poorly represented (4%). The majority of respondents were from single person households (41%), 22% lived with their parents, 18% lived with partners, 12% were married with children, 5% were divorced, and 2% other. As for household composition, those that were made up of 3–4 people represented about 54% of the total sample, 27% of households were made up of 1–2 people, while 15% were composed of 5–6 people, and only 4% had more than seven members. This indicates that medium-sized and large families still dominate the regions of central and southern Italy. Sixty percent of those surveyed had a high school diploma, 22% a university degree, 8% a primary school diploma, 6% had a higher degree (MSc, PhD), and 4% had no qualifications. This suggests that social media is accessed more by those with higher levels of education. Of all the people interviewed, 41% were students, 20% were homemakers, 16% were employed full time/part time, 8% were unemployed, and 5% were pensioners. Thirty percent of respondents claimed to earn a monthly income of between €401 and €800, 21% between €0 and €400, 14% between €801 and €1200, 12% between €2001 and €2400, 11% between €1201 and €1600, 6% between €1601 and €2000, and 6% €2400 and over (Table 1).
3.2. Descriptive Statistics
Regarding household food expenditure estimation for food and non-alcoholic beverages, the data reported in Table 2 showed that 37% of respondents spent between €51 and €90; 19% between €91 and €120; 16% between €0 and €50; 15% between €121 and €160; 9% between €161 and €200; and, only 4% above €200. Concerning the per capita daily food waste, however, about 2/3 of individuals (72%) wasted up to 100g.
The analysis of this data set with the common descriptive statistics that are reported in Table 3 showed that the average weekly expenditure of a household is almost €100.10; 45% of respondents said that spending on food and non-alcoholic beverages has an impact of between 21 to 50%, of which 5.5% is spent on bread and cereals, 14.1% on meat, 3.3% on fish and sea food, 8.0% on dairy products, 3.7% on oils and fats, 4.2% on fruits, and finally 3.1% on vegetables. Sixty percent of respondents consumed first and second courses at lunch and dinner. The portions, for both lunch and dinner, were all average, almost never exceeding 200g for each course. On average the respondents wasted about 92g of the food that they consumed daily (23%) Table 3.
Concerning food purchasing habits, data obtained by Section 2 of the questionnaire (Table 4), showed that most of the respondents (57%) bought their food at supermarkets and 43% at mini-markets, typically two times per week or more (52%). The high percentage of respondents that bought food from mini-markets may be due to the high prevalence of small shops (groceries) in rural areas and in small municipalities. Among the respondents, 34% did not have a favourite time to go shopping, while many others preferred to do their shopping in the early or mid-morning. Indeed, 18% did their shopping early in the morning to buy the freshest products and during a less chaotic time of day, while 20% preferred to do their shopping in the mid-morning, mainly for convenience, not giving importance to the freshness of the product.
The rate of respondents who used a list when shopping was 25%, those who did not use a list were 56%, while 19% sometimes used a shopping list. In the case of monthly shopping, the use of the shopping list is especially frequent. About 62% of respondents said that the deals (e.g., buy one get one free, etc.) did not attract them and only 21% were interested in special offers, while 17% said that the offers were sometimes attractive. Presently, these kinds of offers are more common in hyper/supermarkets; however, their number in the regions of central and south Italy (especially in Molise) is still limited.
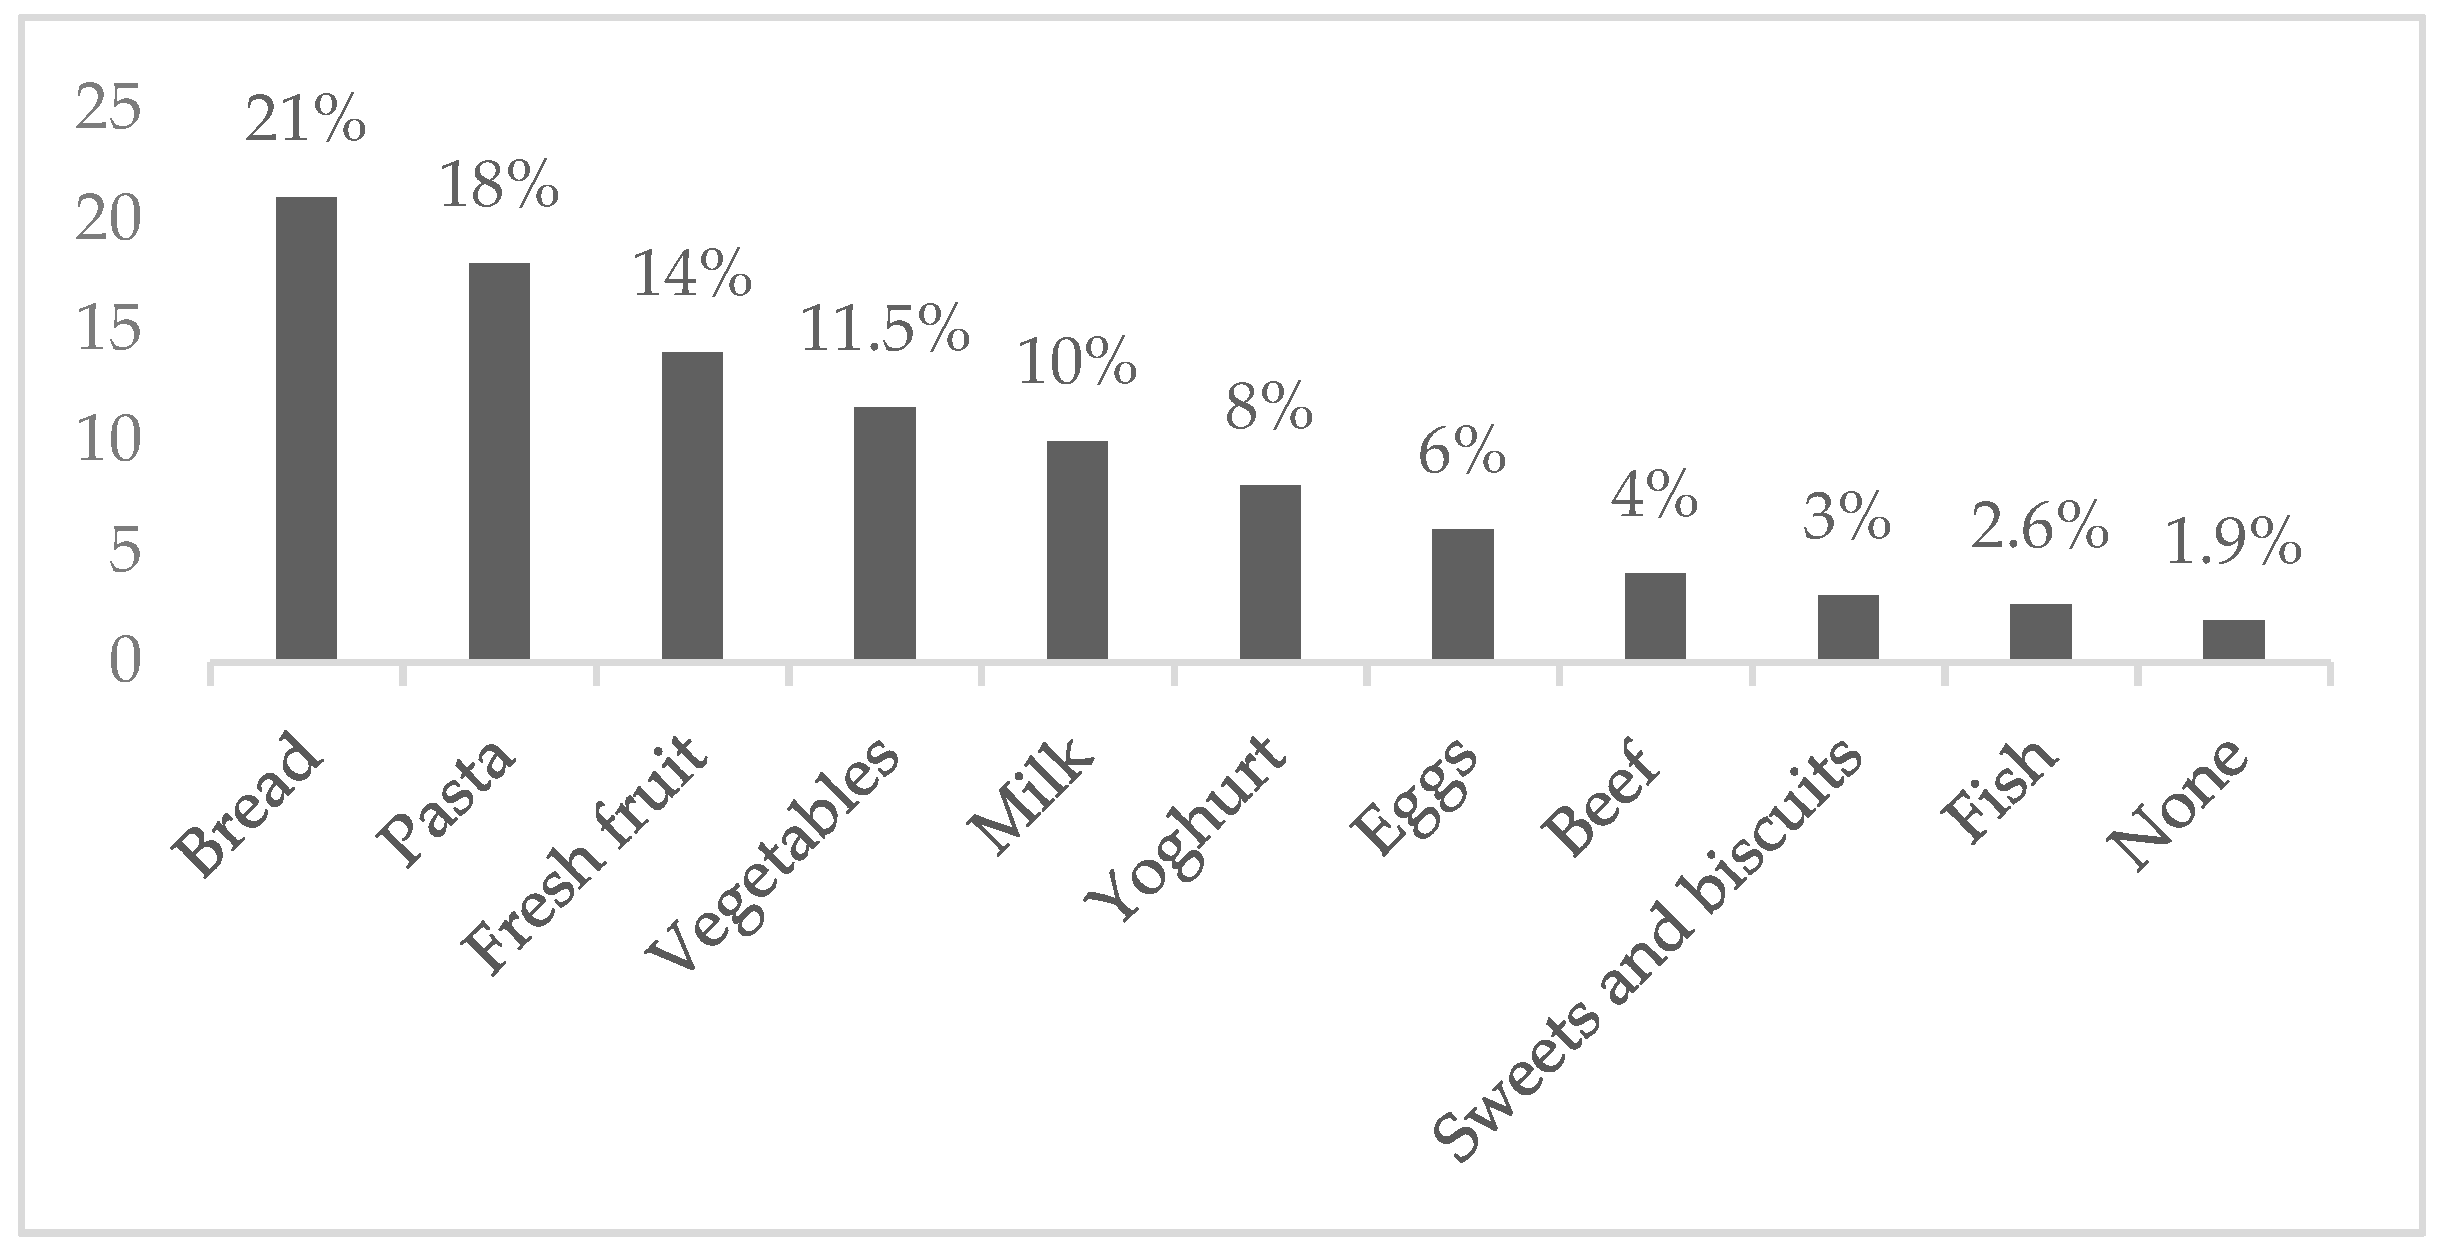
Figure 1 shows the percentages for products, according to the respondents, which were most wasted. Bread (21%), pasta (18%), fresh fruit (14%), vegetables (11.5%), and milk (10%) were the products that were wasted the most (74.5%). These products could be subject of the most waste due to their fragility and the fact that they tend to have a variable or short shelf life. Bread, based on cereal grain, has a variable shelf life (one day–six months), while fruits and vegetables generally have a short shelf life (5–14 days), although some products use temperature control during part of the supply chain. Eight percent of participants wasted yoghurt, 6% eggs, 4% beef, and only 2.6% fish. In the case of the latter two, waste is lower, because beef and fish have a very volatile demand that depends on the price and on the consideration of their high value when compared to other food products. Finally, only about 2% of respondents declared that they created zero waste (Figure 1).
Amongst the causes of waste that are proposed in Section 3 of the questionnaire, as shown in Table 5, expired food (out of data) was a major cause of waste, the average score was 1.057 on a Likert scale, where 0 corresponded to “is not a cause” and 5 to “is the major cause”, followed by bad smell (0.804), bad taste (0.789), and has mould (0.628). Other causes that generated waste varied from 0.494 to 0.053 and they were: over generous portions (0.494), incorrect conservation (0.357), unappetizing appearance (0.303), leftovers from previous days (0.295), items left in the fridge (0.223), food considered unappetizing (0.174), package size (0.143), food considered difficult to measure (0.138), poor culinary skills (0.122), and incorrect interpretation of labels (0.053). The last result could be attributed to the high education levels of the respondents.
With regard to the good intentions and measures that respondents said they had undertaken and/or would like to take in the future (Section 4), the following emerged: Eighty-eight percent of those that were surveyed claimed to be aware of the environmental and economic value of food waste. Eighty-one percent of respondents separated waste for collection and 65% of them said that they had reduced the amount of compostable rubbish thrown away.
The steps that could be taken to reduce and/or minimize food waste according to respondents were:
- -
- improving knowledge in the techniques of food preservation;
- -
- cooking proper portions;
- -
- making available and buying single portions for students and/or for those who live alone;
- -
- checking the expiry dates; and,
- -
- organizing one’s weekly balanced diet and shopping, using shopping lists.
The measures taken by respondents to reduce waste can be grouped into the following categories:
- (1)
- waste separation for collection;
- (2)
- action to minimize or eliminate waste; and,
- (3)
- obtaining more information on the impact waste has on the environment.
The attention of the analysis was mainly focused on the root causes of domestic food waste. In contrast, concerning steps that are taken to reduce waste, the aim of this investigation was merely to gain some indications about consumer behaviour: what action has been taken and what action would consumers like to take in the future.
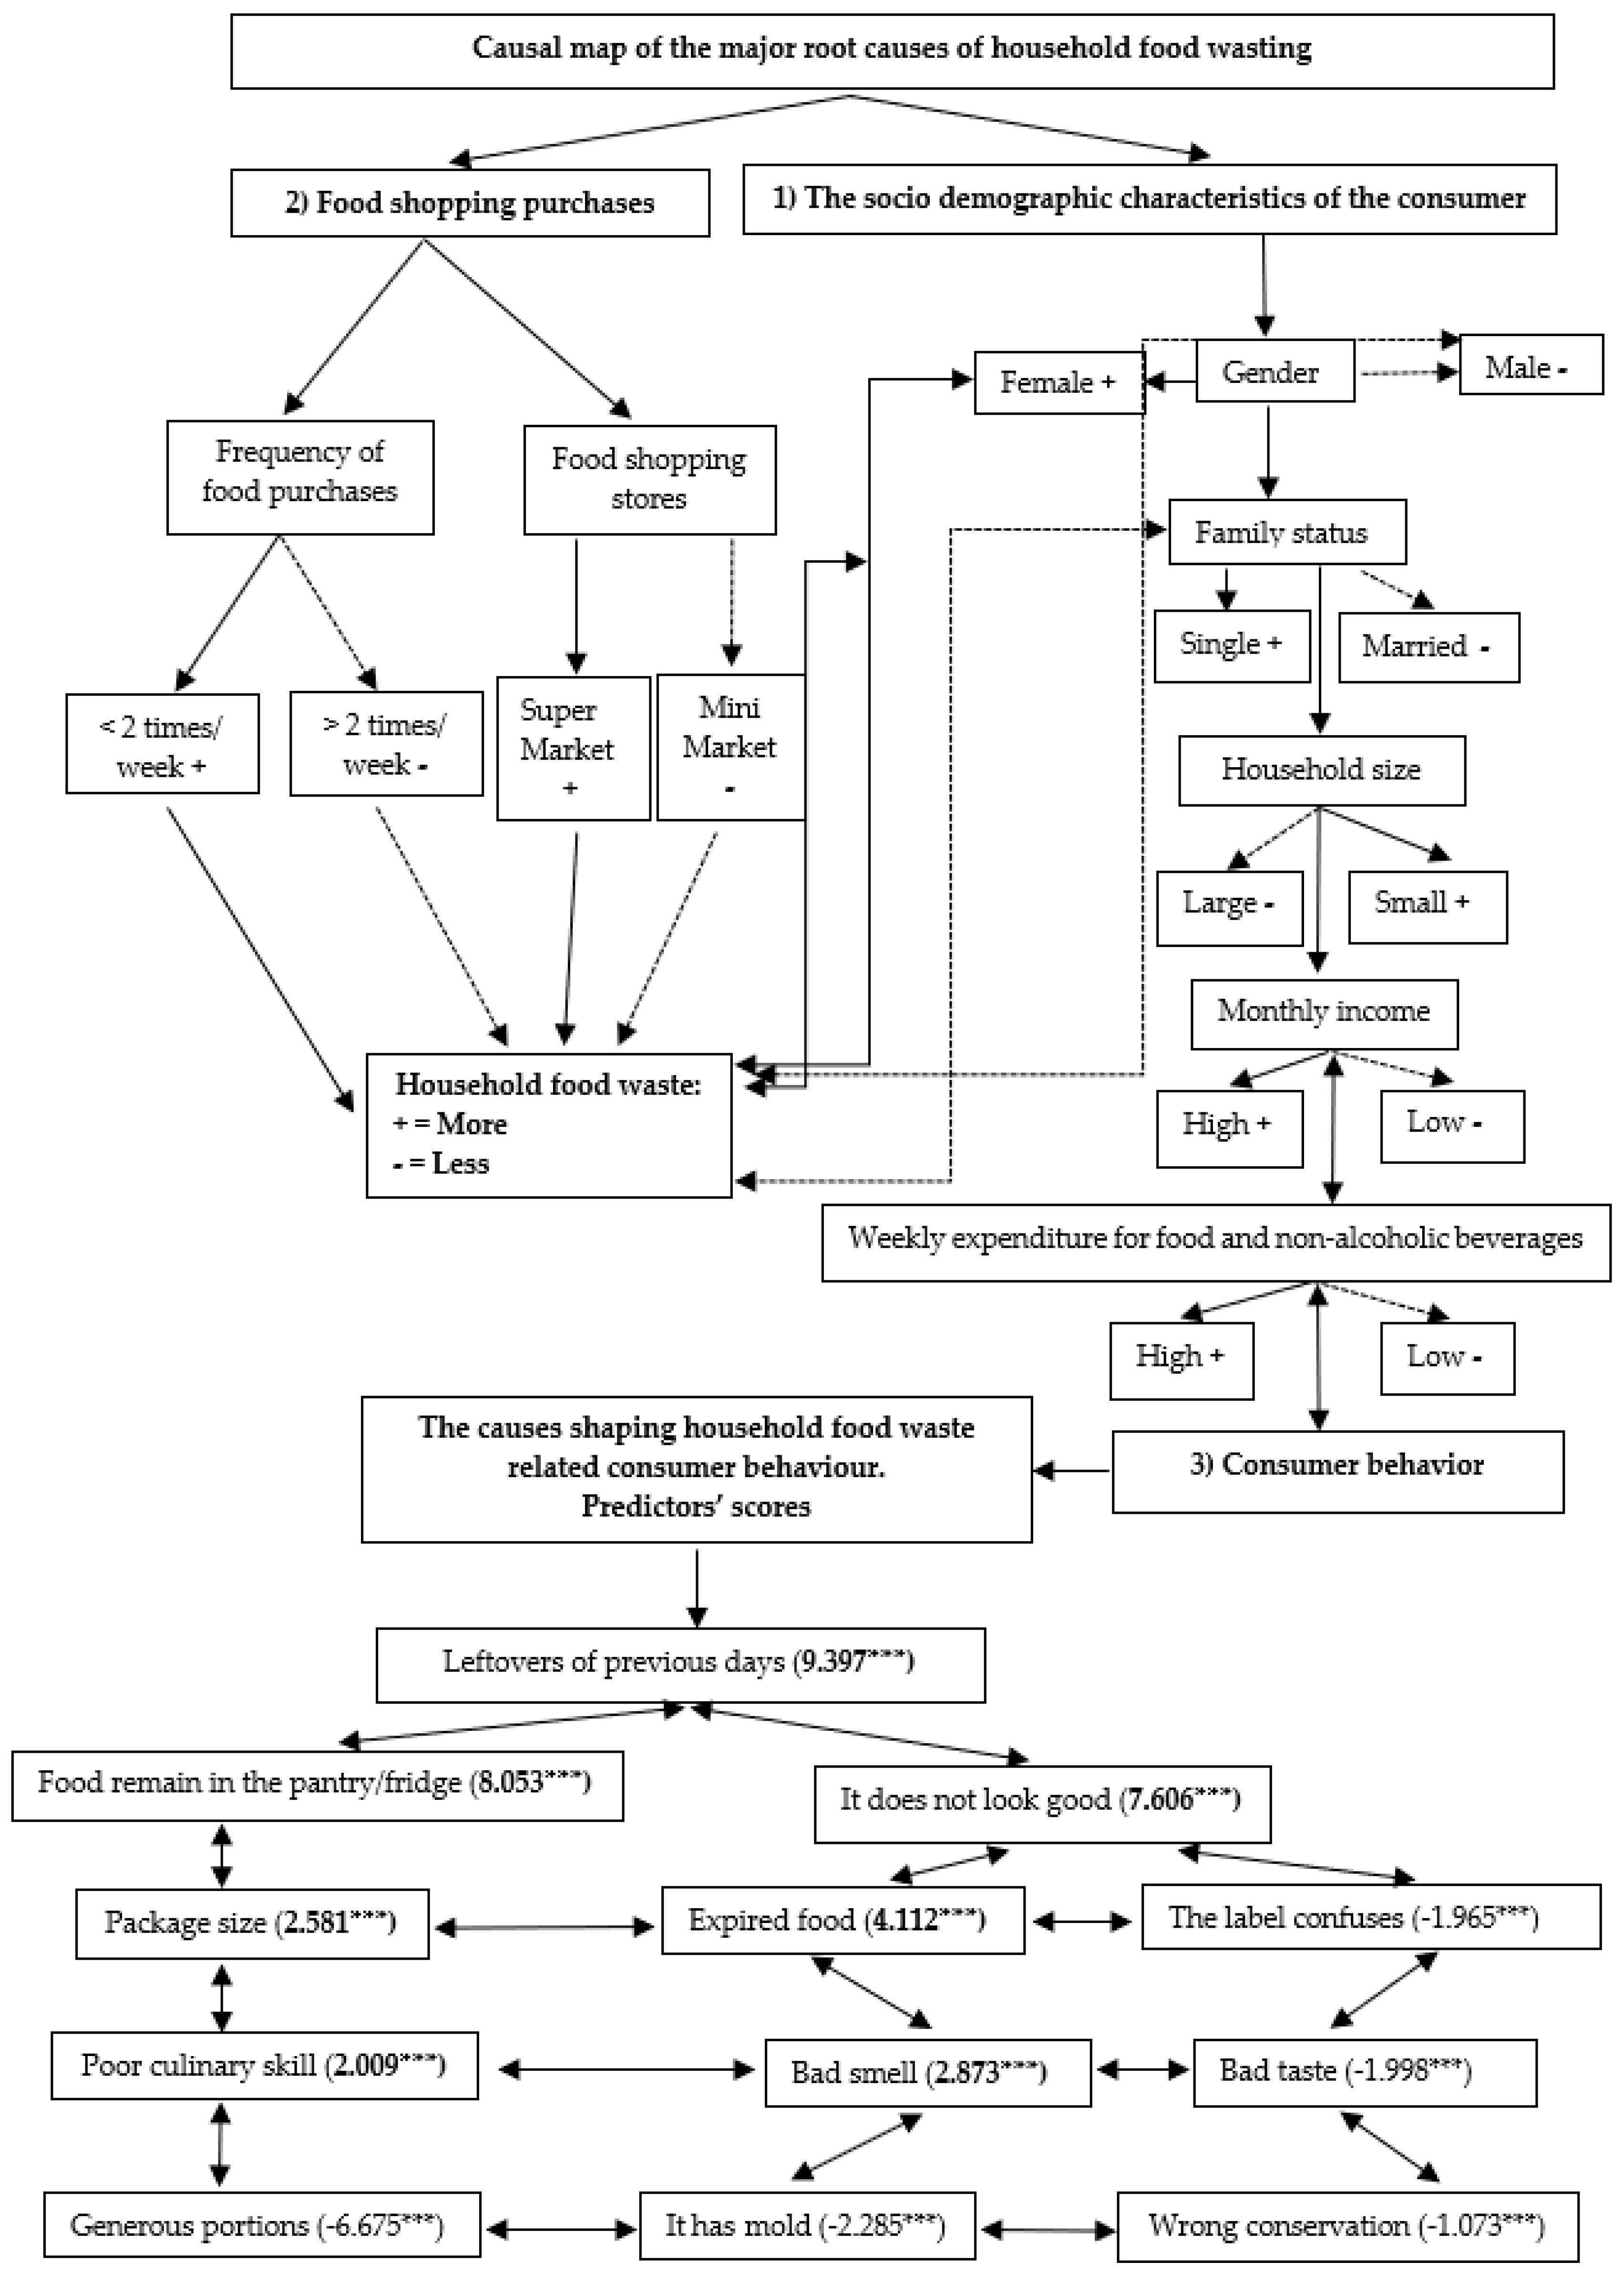
The initial analysis of the causes of household food waste, presented above, highlighted some important issues. Most causes have interdependencies and they are part of a complex relationship between cause and effect. Using linear regression models and causal maps (see Table 6 and Figure 2), it was possible to map the logic between causes and effects, thus creating a tree. Indeed, by analysing the root cause maps, the root causes of waste can be categorised into three groups:
- (1)
- The socio-demographic characteristics of the consumer (age, gender, family status, level of education, household size, and monthly income).
- (2)
- Food shopping purchases: factors that influence household food waste. These constraints are associated with the frequency of food purchases and the location of food shopping.
- (3)
- Consumer behaviour: poor culinary skills, such as cooking or buying too much, not using food in time, a lack of confidence in using leftovers, incorrect conservation, and so on.
In particular, the second group can be influenced by marketing decisions and the commercial interest of the distribution sector. The third group, however, is mainly related to insufficient purchase planning and expiring best-before dates in combination with a careless attitude of consumers who can afford to waste food.
3.3. Linear Regression Analysis and Causal Maps
Per capita daily FW was used as a dependent variable in a linear regression model, with the other variables being inputted as predictors; R2 was 0.95.
Table 6 reports the coefficients of the model. The dependent variable per capita FW is a continuous and quantitative variable. The predicted age, monthly income, and weekly expenditure for food and non-alcoholic beverages are quantitative variables; frequency of food purchase and location of food shopping, gender, family status, level of education, household size, are dichotomous variables (Table 4), and the main root causes of FW declared by respondents were estimated on a 0–5 Likert scale (Table 5). The two socio-economic variables considered showed a quite influence on the dependent variable, the increase of the monthly income and of the weekly expenditure for food and non-alcoholic beverages had a positive effect on the increase of the per capita daily FW.
Regarding the demographic variables however, gender, family status and household size with a negative coefficient predicted that males wasted less than females; families with two people or more wasted less than those with less than two people and married people wasted less than their single counterparts. In the contrast, others demographic variables that had been included in the first round of the modelling, such us age and the level of education of respondents (with a high p value), were not statistically significant in explaining per capita daily FW and they were then excluded from the elaborations of causal map. Concerning food purchasing habits, the negative coefficients of a higher frequency of food shopping and the dimension of the food shopping store (super or mini-markets) had a positive impact on the decrease of FW. Finally, among the causes of FW, leftovers of previous days, it remains in the fridge, it does not look good, bed smell, and the expired data showed a strong influence on the dependent variable, increasing the probability of the individuals to declare a high per-capita daily FW. The causes, I did not like it and I’m not used to measure it, are not statistically significant in explaining per capita daily FW. In contrast, the negative coefficient of generous portions, it has mold, the label is confusing and wrong conservation predicted a declaration by respondents that these causes did not affect their FW. Therefore, they had no trouble in understanding and differentiating between common food label terms, such as “expiration date/use by”, and “best before” and in preserving the food in a correct way.
4. Discussion
The discussion of the results is conducted with regard to the following questions:
Are there any significant deviations between the results of this exploratory on-line survey and those of other available studies conducted more recently in Italy?
In Italy, has food waste received sufficient attention from consumers and policymakers?
4.1. Amount of Food Waste and Products Most Wasted
The present exploratory on-line investigation found that, on average, the respondents wasted 23% of food consumed (approximately 92 g per day/per capita) and less than 1% stated that they wasted only 10 g. A simple extrapolation of these figure to the entire Italian population (59,359,900 million inhabitants) involved results in about two million tons per year. The amount is lower than that estimated in BIOS study [18] equal to 2.7 million tons per year. Moreover, the value is roughly in line with the results of other recent surveys that were carried out in Italy. Indeed, in a recent study conducted in 2018 over one week by Giordano et al. (2018) [28], it was estimated, based on questionnaires and diaries involving 30 households, that edible food waste amounted to 489 g per week (about 70 g per day/pro capita) and 1035 g per week (148 g per day/pro capita), respectively.
The results that emerged from the present study are even more consistent with the findings of a large-scale survey that was conducted in Italy in 2014 by Falasconi et al. (2019) [31], where the respondents, based on the data of questionnaire, declared to waste a very low quantity of food. Likewise, the results are similar to another investigation that was carried out in 2018 for the Reduce project organized by the Ministry for the Environment and the University of Bologna—Distal and a partnership of the University of Tuscia–Deim, the Polytechnic of Milan–Dica, and the University of Udine–Deis [47]. From this project, it emerged that, every day, between what is left on the plate, in the fridge, and in the kitchen store cupboard, Italians throw away 100g of food a day. This figure, if multiplied by 365 days a year, amounts to 36.92 kg of food, costing €250 a year. An average family of 3–4 people wastes approximately 1.5 kg of food every week. The most wasteful meal is dinner where, on average, there is 1.5 times more waste for lunch.
On the other hand, the values from this study are not consistent with the amount of food waste assessed by investigations that were conducted in Italy by Jörissen et al. (2015) [48] and by Waste Watcher-Knowledge for Expo reports [49,50]. In the former study, an on-line survey conducted in 2013 using questionnaires that were completed by 404 employees of the European research centres in Italy (JRC/Ispra), it was found that per capita/per week food waste amounted to 127 g, far below the level that was found by the present investigation, which was 644 g (92 g multiplied by seven days). There is less of a contrast with the findings of the study by the observatory for household food waste (Waste Watcher-Knowledge). In 2013, the latter found that Italians wasted about 76 kg of food per person per year (208 g per day/per capita) and domestic food waste cost €8.7 billion annually, with a weekly amount of €7.06 per family. In 2014, household waste had reduced and its annual cost had fallen to 8.1 billion, with a weekly amount of €6.5 per family.
Regarding the products that were most wasted, the present study found that 74.5% of household waste was made up of bread (21%), pasta (18%), fresh fruit (14%), vegetables (11.5%), and milk (10%), results that are supported by recent literature. Most studies indicate that the large contributors to food waste are these items, because, generally, they are fragile and tend to have a variable or shorter shelf life and are often over-purchased because they are generally cheaper than other product groups, such as meat [27,31,47,48].
4.2. Connections between Food Shopping Purchases and Food Waste
In accordance with previous studies [27,31,47,48], the exploratory on-line survey indicated that the shopping purchases of individuals have a huge impact on the level of FW. As shown in Table 6 and in Figure 2, the amount of food that is thrown away decreases when individuals shop in small markets and when they shop for food with more frequency (two times/week or more). One explanation given is that there are generally fewer special offers in mini-markets when compared to supermarkets and that more frequent shopping allows for a better matching with daily needs. Indeed, about 62% of respondents said that the deals (e.g., buy one get one free and so on) did not attract them and only 21% were interested in special offers, while 17% said that offers are sometimes attractive. Consequently, in line with Falasconi et al. (2019) [31], attention to special offers on food products was not considered to be a driver for domestic FW.
In contrast, the purchase of large quantities for the whole week increases the probability that fragile products, with a shorter shelf life, such as bread, vegetables, fresh fruit, and milk, are thrown away. The results of the present survey found that most of the residents from regions in central and southern Italy behaved in a more exemplary way. Indeed, 48% go shopping once a week, 31% twice a week, and the remaining 21% more than twice a week. This behaviour is considered, in accordance with the findings of the Reduce project [47], ideal in reducing FW. With respect to this issue, several authors [27,31,47,48] also found that making a shopping list may avoid the purchase of unnecessary food. Indeed, the percentage of respondents who used a list when shopping was 25%, while 56% did not use a list at all, and 19% only sometimes used one. The use of a shopping list was especially frequent in the case of monthly shopping.
4.3. Consumer Behaviour and the Major Root Causes of Food Waste
Regarding consumer behaviour and the major root cause of FW, most findings of the present on-line survey are in line with the results of recent research that was conducted in Italy [27,31,47,48]. Indeed, looking at the causal map (Figure 2), the major root causes declared by respondents for FW at home were leftovers from previous days; things that were left in the pantry/fridge; items that did not look good; food that had expired; food with a bad smell; poor culinary skills; and, package size. These predictors had a high and positive impact on the increase of FW at the daily, individual consumer level (Table 6, Figure 2). A dislike of eating the same meal or any leftover food, an estimate of the level of intrinsic food quality by appearance, poor culinary skills and, in general, a lack of planning and management of purchases are at the top of the causal map.
In contrast, the negative coefficient of over generous portions, a presence of mould, the label is confusing, a bad taste, and the wrong conservation had a negative impact on the increase of FW. This demonstrates that, when respondents have a good knowledge of cooking, of preserving food, and can interpret date labelling (avoiding the confusion between “use by” and “best before” dates), FW decreases. An interesting further aspect was that when a food did not taste good enough, it was wasted. Buying only the necessary amount, cooking leftovers in creative ways, and improving storage are ways by which consumers can minimize waste.
4.4. The Socio-Demographic Variables
Different levels of domestic food waste are linked to some socio-demographic and value variables, as well as to lifestyle characteristics and to the socio-cultural resources of the interviewees.
Low levels of waste were more associated with males, singles, small households, and people with a low monthly income. In contrast, age and the educational level did not represent, in accordance with Falasconi et al. (2019) [31], significant predictors of the amount of individual FW. Most of these results are in accordance with others previous studies. In terms of behaviour, the amount of waste is closely linked to spending and increases with a rise in the share of income that is destined for food and beverage consumption, and in the same way, waste increases with the size of the family unit. Furthermore, the lack of planned spending and purchases in large quantities are the main factors that increase the amount of waste. The percentage of those who said that they almost never threw away food was only 2%. In summary, in accordance with [51], it is clear that those who waste more are those with greater economic but also social and cultural resources. Other available studies have shown strong correlation between the amount of food waste and household size, something that was confirmed by this online survey. The absolute amount of food waste strongly depends on the number of people per household, so that smaller households ordinarily produce less waste than larger households, but the amount of food waste generated per person decreases with increasing household size. Single households waste the most on a per capita basis [32,52,53,54]. Moreover, the results of studies in the United Kingdom (UK) [50,52,55] indicate that younger generations waste more than older ones, but no evidence was found in this exploratory on-line survey regarding this.
The creation of a causal map allowed for a visualization of the major root causes of household food waste. Figure 2 provides a representation of the map displaying the socio-economic characteristics of the respondents and the relationship with daily food waste.
4.5. The Good Intentions of the Respondents and the Actions Against Food Waste
Attention will now be turned to addressing the research question: In Italy, has food waste received sufficient attention by consumers and by policymakers? Indeed, there will now be a short overview of the action that was taken by consumers and the good intentions that emerged from the present study. With regard to good intentions and actions that the respondents of the present exploratory on-line survey said that they had taken and/or would like to take in the future, 88% of those surveyed claimed to be aware of the environmental and economic value of food waste. Furthermore, 81% of respondents said that they separated rubbish for collection and 65% of them said that they had reduced the amount of compostable waste thrown away. The respondents highlighted the need to improve their knowledge of techniques for preserving food, the importance of correct food portions, the need for readily available single portions for singles, the necessity of checking expiry dates, and the importance of planning weekly shopping using a shopping list. In addition, concerning future measures to be taken, as already mentioned, responses can be divided into three group: separating waste for collection, taking action to minimize or eliminate waste, and acquiring more information on the impact waste has on the environment. In Italy, only in recent years has food waste received growing interest from local, national, and European policymakers, international organisations, NGOs, as well as researchers from various disciplines. In 2013, the Italian Ministry for the Environment started working on a National Plan for Food Waste Prevention (PINPAS) in collaboration with Last Minute Market, one of the major Italian players in food waste management. During the preparation of this waste prevention programme, the main stakeholders of the food chain were involved in the policy process. These programmes are a comprehensive set of policy measures that specifically address food waste prevention [56].
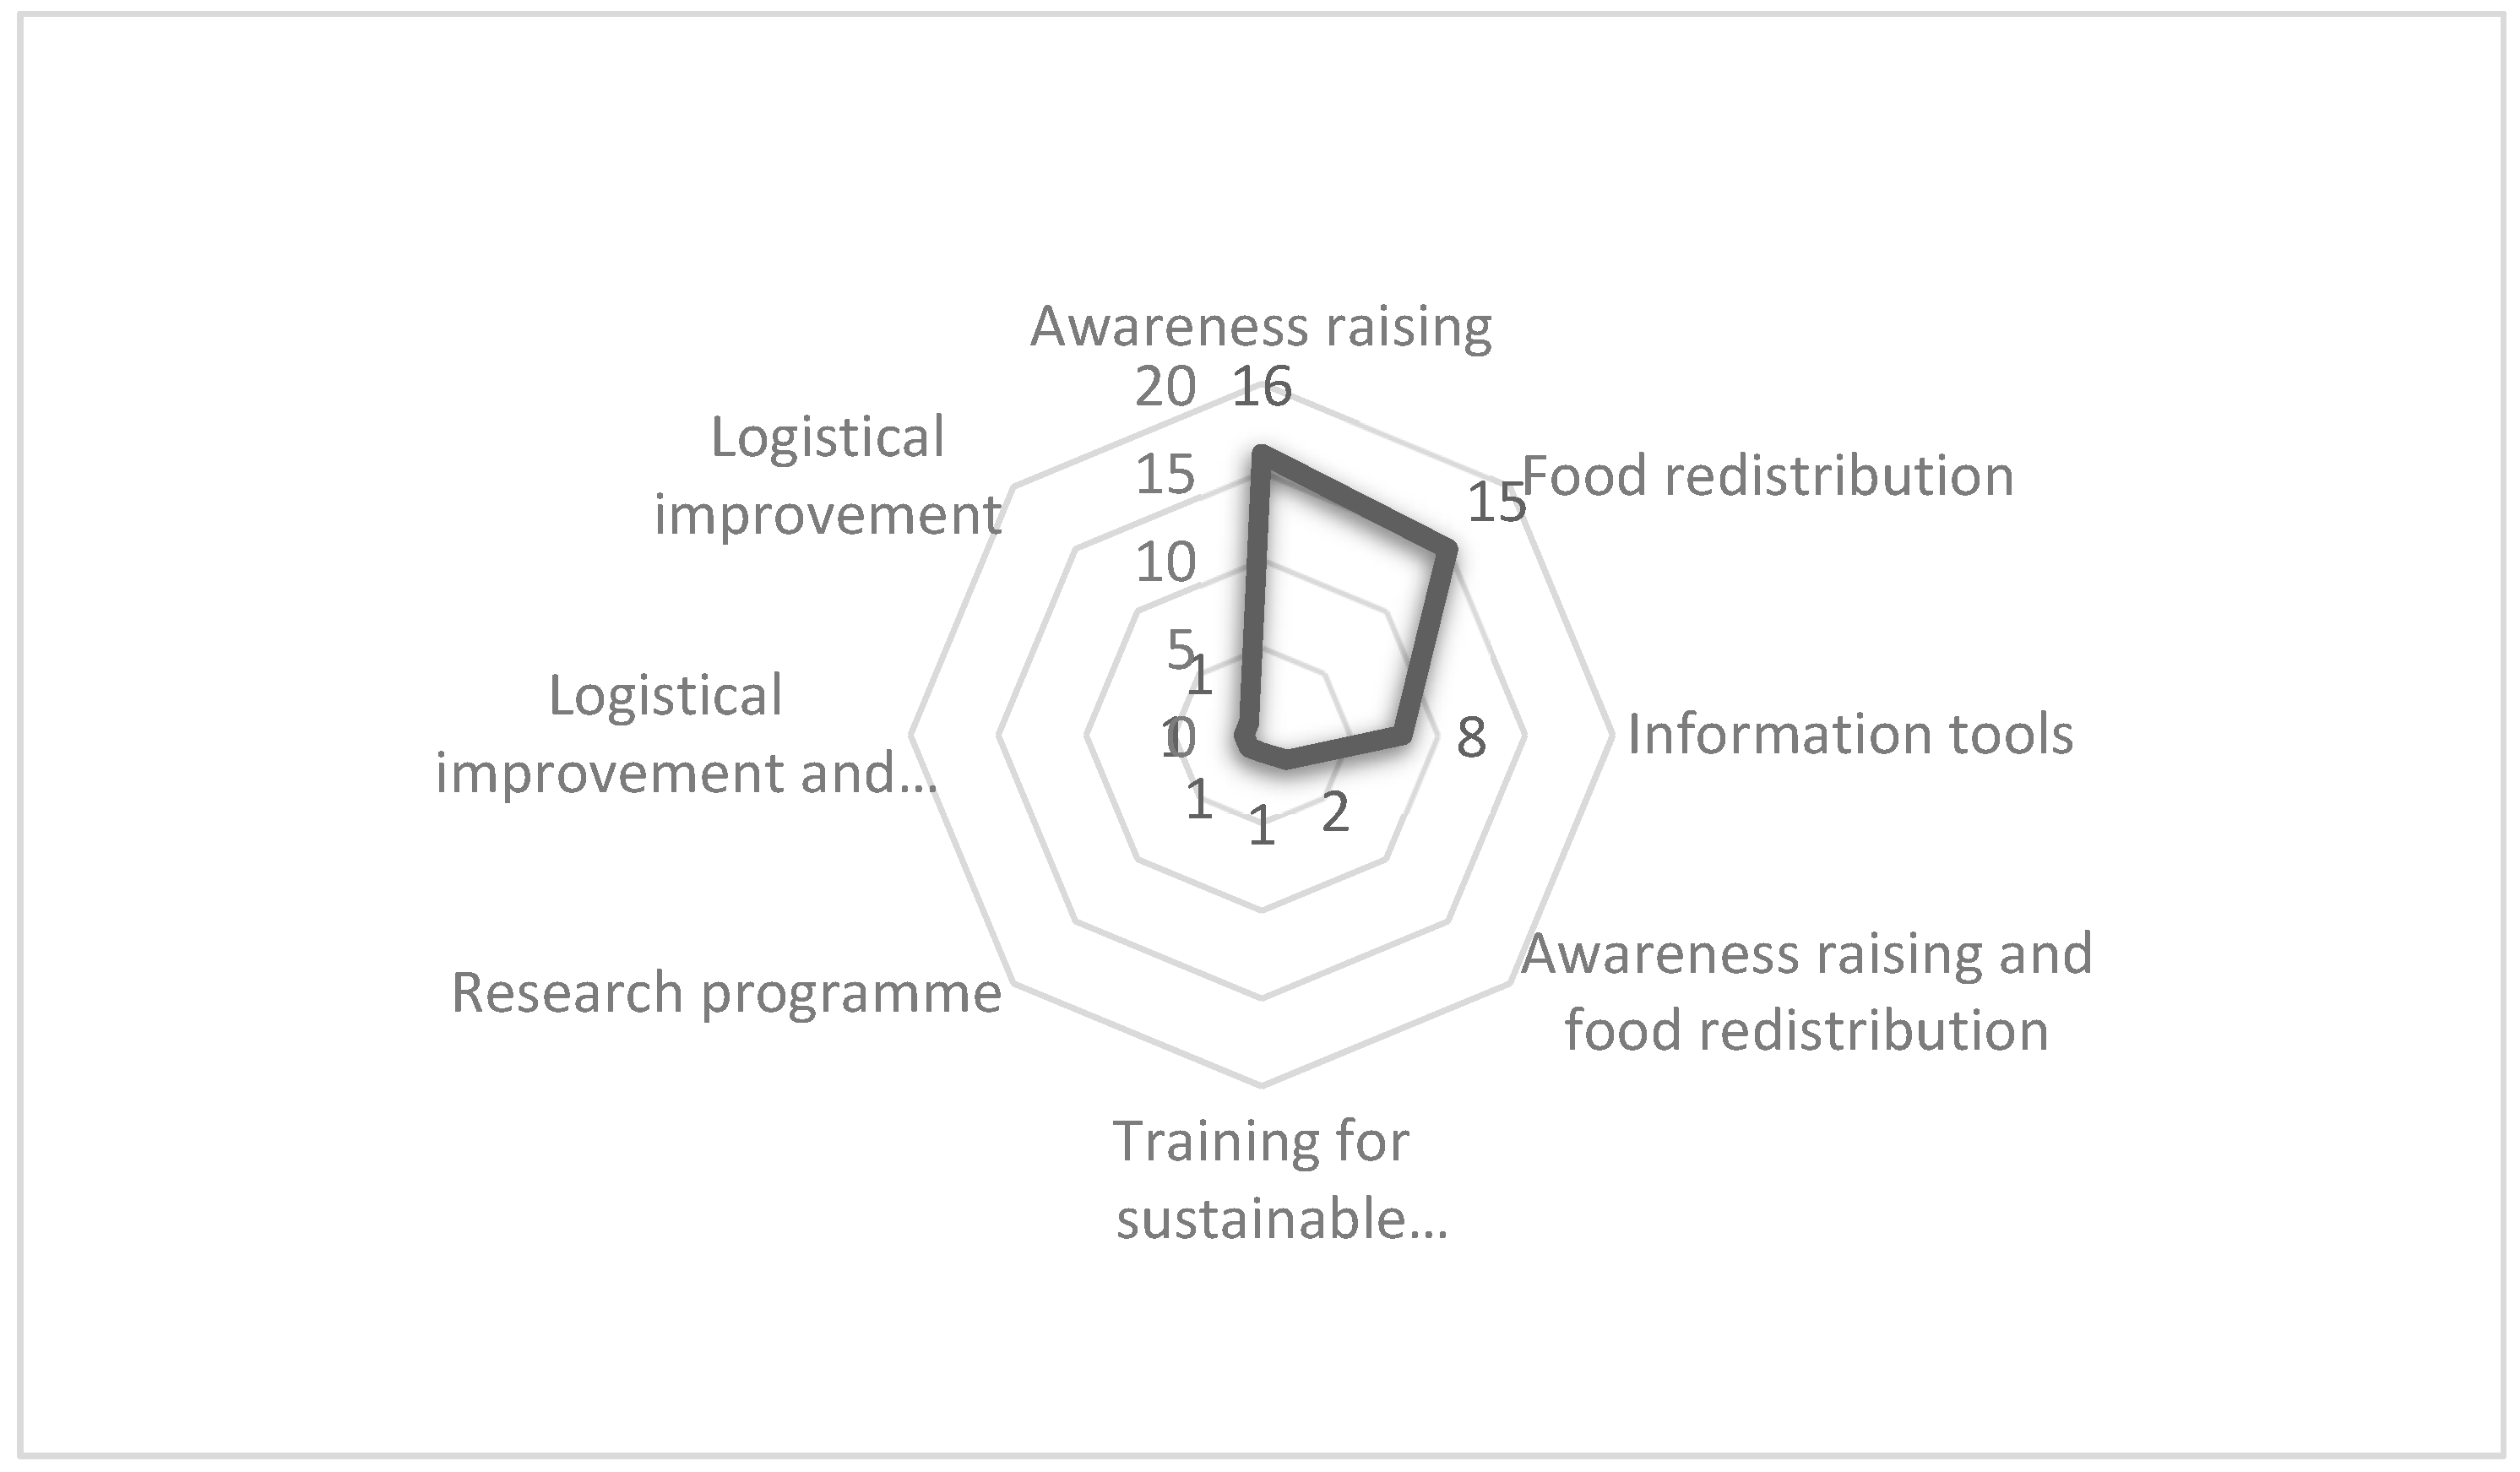
However, on the basis of several studies [57,58,59,60,61,62,63,64,65], Fanelli and Di Nocera (2017) [66] examined 45 best practices by type, the actor responsible, and level of implementation (Figure 3).
Most of the initiatives (26 out of 45) are informative (instruments that are aimed at raising awareness and informational tools have been included), with the intention of raising awareness of the problem and promoting change in consumption patterns, in line with the EU Directive targets, acting on the source of wastage. All of the available studies agree with the fact that consumer information and education are crucial instruments in influencing behaviour [66]. The causes of waste may vary according to socio-economic status and culture, such as bad habits, like preparing more food than can be eaten, leading to leftovers.
5. Conclusions
Food waste is clearly a complex issue, with a multitude of causes that impact food wastage. This study has explored the major root causes of domestic food waste by analysing the findings of a large survey that was conducted in Italy. In trying to expose an immediate visual summary of the results (Figure 2), it has become clear that the issue of waste has been ignored for a long time and has only recently gained interest. The on-line exploratory survey has highlighted that socio-demographic characteristics, food shopping purchases, and the consumer behaviour played key roles in determining the extent of per capita food waste. In particular, among the socio-demographic characteristics of the respondents, monthly income and expenditure for food and non-alcoholic beverages were the factors most related to greater declared food waste. This finding is consistent with previous literature. Other predictors that affected the increase of household FW were cooking too much food (leftovers from previous days, food left in the fridge) and the palatability of products (it does not look good). In contrast, regarding food shopping purchases, the frequency and location of food shopping has a role in decreasing domestic food waste. This could be explained by the fact that approximately 62% of respondents said that deals (e.g., buy one get one free and so on) did not appeal to them. Regarding measures to tackle food waste, a large majority of respondents (88%) recognized the need to pay more attention to the problem. The findings are in line with previous literature. Overall, through the behaviour of the participants, the on-line survey confirmed that they are also careless. Nevertheless, many respondents would be willing to accept advice on how to keep food and how to use leftovers in the kitchen. Perhaps reassuringly, few respondents claimed that they found information on food labels difficult to interpret. The findings also indicate that mechanisms for household waste reduction, such as shopping lists and planning meals, may also reduce waste and help to encourage a shift in shopping routines. The complexity of the problem demands to policymakers to carried out, with a practical approach and with the use of multiple communication channels, new educational campaigns against FW. For these reasons, information and education policies are crucial for providing consumers with a realistic perception of FW, for changing consumer lifestyles, and raising awareness of the value of food. More emphasis is therefore needed to improve the capacity and capability of actors along the food chain and institutions in effective policy formulation and delivery.
The authors acknowledge that the research has some limitations. The population of the survey that is presented here is not representative of Italy. The main reason is that the respondents were from five regions of central and southern Italy. Moreover, the questionnaire was distributed via Google Drive and e-mail and the response to it was completely voluntary. Due to the method used and the circle of addressees, households with a lower educational level, young people (below 18 years), and the elderly (persons aged 68 years and above) were not adequately represented in the sample. Thus, the results cannot be reliably extrapolated to the entire population of Italy. Nevertheless, they provide some interesting insights into the behaviour of households, in comparison with the findings of other studies (for the main results, see Section 4). Future studies could concentrate on other geographical regions and expand the sample to increase the generalizability of the results.
Funding
This research received no external funding.
Conflicts of Interest
The author declares no conflict of interest.
References
- Gustavsson, J.; Cederberg, C.; Sonesson, U. Global Food Losses and Food Waste: Extent, Causes and Prevention. In Proceedings of the International Congress Save Food! (Interpack 2011), Düsseldorf, Germany, 16–17 May 2011; Food and Agriculture Organization of the United Nations: Rome, Italy, 2011. [Google Scholar]
- FAO. FAO Statistical Yearbook 2013—World Food and Agriculture; FAO: Rome, Italy, 2012. [Google Scholar]
- FAO. How to Feed the World in 2050; FAO: Rome, Italy, 2009. [Google Scholar]
- Fanelli, R.M. The Interactions between the Structure of the Food Supply and the Impact of Livestock Production on the Environment. A Multivariate Analysis for Understanding the Differences and the Analogies across European Union Countries. Qual. Access Success 2018, 19, 131–139. [Google Scholar]
- Chalak, A.; Abou-Daher, C.; Chaaban, J.; Abiad, M.G. The global economic and regulatory determinants of household food waste generation: A cross-country analysis. Waste Manag. 2016, 48, 418–422. [Google Scholar] [CrossRef] [PubMed]
- Lang, T.; Rayner, G. Ecological public health: The 21st century’s big idea? BMJ 2012, 345, e5466. [Google Scholar] [CrossRef] [PubMed]
- Bond, M.; Meacham, T.; Bhunnoo, R.; Benton, T.G. Food Waste within Global Food Systems; A Global Food Security Report; Global Food Security: Swindon, UK, 2013; Available online: www.foodsecurity.ac.uk (accessed on 15 October 2018).
- Grethe, H.; Dembélé, A.; Duman, N. How to Feed the World’s Growing Billions. Understanding FAO World Food Projections and Their Implications; Heinrich Böll Stiftung und WWF Deutschland: Berlin, Germany, 2011. [Google Scholar] [CrossRef]
- Elmenofi, A.G.G.; Capone, R.; Waked, S.; Debs, P.; Bottalico, F.; El Bilali, H. An exploratory survey on household food waste in Egypt. In Proceedings of the VI International Scientific Agriculture Symposium “Agrosym 2015”, Jahorina, Bosnia and Herzegovina, 15–18 October 2015; pp. 1298–1304, ISBN 978-99976-632-2-1. [Google Scholar] [CrossRef]
- Kosseva, M.R. Introduction: Causes and Challenges of Food Wastage. In Food Industry Wastes. Assessment and Recuperation of Commodities; Elsevier: Amsterdam, The Netherlands, 2013; pp. xv–xxiv. [Google Scholar] [CrossRef]
- Langley, J.; Yoxall, A.; Heppell, G.; Rodriguez, E.M.; Bradbury, S.; Lewis, R.; Luxmoore, J.; Hodzic, A.; Rowson, J. Food for thought? A UK pilot study testing a methodology for compositional domestic food waste analysis. Waste Manag. Res. 2010, 28, 220–227. [Google Scholar] [CrossRef] [PubMed]
- Parfitt, J.; Barthel, M.; Macnaughton, S. Food waste within food supply chains: Quantification and potential for change to 2050. Philos. Trans. R. Soc. Lond. Ser. B 2010, 365, 3065–3081. [Google Scholar] [CrossRef] [PubMed]
- FAO. Urgent Collaboration Required on Food Wastage; FAO: Rome, Italy, 2013. [Google Scholar]
- FUSIONS. Food Waste Quantification Manual to Monitor Food Waste Amounts and Progression; Wageningen University Publishing: Wageningen, The Netherlands, 2016. [Google Scholar]
- HLPE. Food Losses and Waste in the Context of Sustainable Food Systems: A Report by The High Level Panel of Experts on Food Security and Nutrition of the Committee on World Food Security; HLPE: Rome, Italy, 2014. [Google Scholar]
- Waste & Resources Action Programme (WRAP). Food Waste in School; WRAP Publishing: London, UK, 2011. [Google Scholar]
- Bio Intelligence Service (BIOIS). Modelling of Milestones for Achieving Resource Efficiency, Turning Milestones into Quantified Objectives: Food Waste; Prepared for the European Commission, DG Environment; BIOIS: Paris, France, 2013. [Google Scholar]
- Monier, V.; Mudgal, S.; Escalon, V.; O’Connor, C.; Gibon, T.; Anderson, G.; Montoux, H. Preparatory Study on Food Waste Across EU 27: Technical Report; European Communities: Paris, France, 2010. [Google Scholar]
- BCFN. Food Waste: Causes, Impacts and Proposals; Barilla Center for Food and Nutrition: Parma, Italy, 2012. [Google Scholar]
- Stenmarck, A.; Jensen, C.; Quested, T.; Moates, G. Estimates of European Food Waste Levels; IVL Swedish Environmental Research Institute: Stockholm, Sweden, 2016. [Google Scholar]
- European Commission. Roadmap to a Resource Efficient Europe; COM (2011)571, Communication from the Commission to the European Parliament, the Council, the European Economic and Social Committee and the Committee of the Regions; European Commission: Brüssel, Belgium, 2011. [Google Scholar]
- Bucci, M.; Calefato, C.; Colombetti, S.; Milani, M.; Montanari, R. Fridge Fridge on the Wall: What Can I Cook for Us All? An HMI Study for an Intelligent Fridge; ACM: New York, NY, USA, 2010. [Google Scholar]
- Thieme, A.; Comber, R.; Miebach, J.; Weeden, J.; Kraemer, N.; Lawson, S.; Olivier, P. We’ve Bin Watching You: Designing for Reflection and Social Persuasion to Promote Sustainable Life-Styles; CHI: New York, NY, USA, 2012. [Google Scholar]
- Pekcan, G.; Köksal, E.; Kücükerdönmez, Ö.; Özel, H. Household Food Wastage in Turkey; Working Paper Series, No ESS/ESSA/006e; Food and Agriculture Organisation of the United Nations, Statistics Division: Rome, Italy, 2006. [Google Scholar]
- Lyndhurst, B.; Cox, J.; Downing, P. Food Behaviour Consumer Research: Quantitative Phase; Waste & Resources Action Programme (WRAP): Banbury, UK, 2007. [Google Scholar]
- Göbel, C.; Teitscheid, P.; Ritter, G.; Blumenthal, A.; Friedrich, S.; Frick, T.; Grotstollen, L.; Möllenbeck, C.; Rottstegge, L.; Pfeiffer, C.; et al. Verringerung von Lebensmittelabfällen–Identifikation von Ursachen und Handlungsoptionen in Nordrhein-Westfalen. Studie für den Runden Tisch Neue Wertschätzung von Lebensmitteln des Ministeriums für Klimaschutz, Umwelt, Landwirtschaft, Natur und Verbraucherschutz des Landes Nordrhein-Westfalen; University of Applied Sciences: Münster, Germany, 2012. (In German) [Google Scholar]
- Fanelli, R.M.; Di Florio, A. Domestic food waste, gap in times of crisis. Riv. Econ. Agrar. 2016, 71, 111–125. [Google Scholar] [CrossRef]
- Giordano, C.; Piras, S.; Boschini, M.; Falasconi, L. Are questionnaires a reliable method to measure food waste? A pilot study on Italian households. Br. Food J. 2018, 120, 2885–2897. [Google Scholar] [CrossRef]
- Segrè, A.; Falasconi, L.; Morganti, E. Last Minute Market-Increasing the Economic, Social and Environmental Value of Unsold Products in the Food Chain. In Total Food. Sustainability of the Agri-Food Chain; RSC Publishing: Cambridge, UK, 2010; pp. 162–167. [Google Scholar]
- Falasconi, L. Lo Spreco Alimentare Nella Ristorazione Scolastica: Focus Group Finale; Unpublished Internal Project Report; Università di Bologna: Bologna, Italy, 2011. (In Italian) [Google Scholar]
- Falasconi, L.; Cicatiello, C.; Franco, S.; Segré, A.; Setti, M.; Vittuari, M. Such a shame! A study on self-perception of household food waste. Sustainability 2019, 11, 270. [Google Scholar] [CrossRef]
- Koivupuro, H.K.; Hartikainen, H.; Silvennoinen, K.; Katajajuuri, J.H.; Heikintalo, N.; Reinikainen, A.; Jalkanen, L. Influence of socio-demographical, behavioural and attitudinal factors on the amount of avoidable food waste generated in Finnish households. Int. J. Consum. Stud. 2012, 36, 183–191. [Google Scholar] [CrossRef]
- Quested, T.E.; Marsh, E.; Stunell, D.; Parry, A.D. Spaghetti soup: The complex world of food waste behaviours. Resour. Conserv. Recycl. 2013, 79, 43–51. [Google Scholar] [CrossRef]
- Schneider, F.; Obersteiner, G. Food waste in residual waste of households-regional and socio-economic differences. In Proceedings of the Eleventh International Waste Management and Landfill Symposium, St. Margherita di Pula, Sardinia, Italy, 1–5 October 2007; Cossu, R., Diaz, L.F., Stegmann, R., Eds.; Institute of Waste Management: Wien, Austria, 2007; pp. 469–470. [Google Scholar]
- Ventour, L. Food Waste Report—The Food We Waste; Waste & Resources Action Programme (WRAP): Banbury, UK, 2008. [Google Scholar]
- Van Westerhoven, M.; Steenhuisen, F. Bepaling Voedselverliezen bij Huishoudens en Bedrijfscatering in Nederland; CREM BV: Amsterdam, The Netherlands, 2010. [Google Scholar]
- Watanabe, K. Estimations of quantities of wasted food. In Proceedings of the 3rd BOKU Waste Conference on Prosperity Waste and Waste Resources, Vienna, Austria, 15–17 April 2009; Lecherm, P., Ed.; Facultas Wuv: Vienna, Austria, 2009; pp. 77–84. [Google Scholar]
- Bräutigam, K.-R.; Jörissen, J.; Priefer, C. The extent of food waste generation across EU-27: Different calculation methods and the reliability of their results. Waste Manag. Res. 2014, 32, 683–694. [Google Scholar] [CrossRef] [PubMed] [Green Version]
- Kranert, M.; Hafner, G.; Barabosz, J.; Schneider, F.; Lebersorger, S.; Scherhaufer, S.; Schuller, H.; Leverenz, D. Ermittlung der Weggeworfenen Lebensmittelmengen und Vorschläge zur Verminderung der Wegwerfrate bei Lebensmitteln in Deutschland. Kurzfassung. Institut für Siedlungswasserbau, Wassergüte- und Abfallwirtschaft (ISWA); Universität Stuttgart: Württemberg, Germany, 2012. (In German) [Google Scholar]
- Segrè, A. Last Minute Market. La Banalità Del Bene E Altre Storie Contro Lo Spreco; Edizioni Pendragon: Bologna, Italy, 2010. (In Italian) [Google Scholar]
- Huff, A. Mapping Strategic Thought; Wiley and Sons: Hoboken, NJ, USA, 1990. [Google Scholar]
- Fiol, C.M.; Huff, A.S. Maps for managers: Where are we? Where do we go from here? J. Manag. Stud. 1992, 29, 267–285. [Google Scholar] [CrossRef]
- Jenkins, M.; Johnson, G. Entrepreneurial intentions and outcomes: A comparative causal mapping study. J. Manag. Stud. 1997, 34, 895–920. [Google Scholar] [CrossRef]
- Scardava, A.J.; Bouzdine-Chameeva, T.; Goldestein, S.; Hays, J.M.; Hill, A.V. A methodology for Costructing Collective Causal Maps. Decis. Sci. J. 2006, 37, 263–283. [Google Scholar] [CrossRef]
- Wilson, P.F.; Dell, L.D.; Anderson, G.F. Root Cause Analysis: A Tool for Total Quality Management; ASQC Quality Press: Milwaukee, WI, USA, 1993. [Google Scholar]
- Fanelli, R.M. Rural Small and Medium Enterprises Development in Molise (Italy). Eur. Countrys. 2018, 10, 566–589. [Google Scholar] [CrossRef]
- Eco dalle Città. Spreco di Cibo: Ecco i Dati Sullo Spreco Domestico di 400 Famiglie Italiane Nell’ambito del Progetto Reduce. 2018. Available online: http://www.ecodallecitta.it/notizie/388981/spreco-di-cibo-ecco-i-dati-sullo-spreco-domestico-di-400-famiglie-italiane-nellambito-del-progetto-reduce/ (accessed on 10 September 2018).
- Jörissen, J.; Priefer, C.; Bräutigam, K.-R. Food Waste Generation at Household Level: Results of a Survey among Employees of Two European Research Centers in Italy and Germany. Sustainability 2015, 7, 2695–2715. [Google Scholar] [CrossRef] [Green Version]
- Waste Watcher. Knowledge for Expo; Waste Watcher: Bologna, Italy, 2015. [Google Scholar]
- Waste Watcher. Rapporto 2013 Waste Watcher. Available online: http://www.lastminutemarket.it/ media_news/wp-content/uploads/2014/05/WW-Executive-Summary-2013.pdf (accessed on 8 September 2014).
- Setti, M.; Falasconi, L.; Segré, A.; Cusano, I.; Vittuari, M. Italian consumers’ income and food waste behavior. Br. Food J. 2016, 118, 1731–1746. [Google Scholar] [CrossRef]
- Secondi, L.; Principato, L.; Laureti, T. Household food waste behaviour in EU-27 countries: A multilevel analysis. Food Policy 2015, 56, 25–40. [Google Scholar] [CrossRef]
- Quested, T.; Johnson, H. Household Food and Drink Waste in the UK: Final Report; WRAP: Barbury, UK, 2009. [Google Scholar]
- Neff, R.A.; Spiker, M.L.; Truant, P.L. Wasted Food: US Consumers’ Reported Awareness, Attitudes, and Behaviors. PLoS ONE 2015, 10, e0127881. [Google Scholar] [CrossRef] [PubMed]
- WRAP. The Food We Waste. Food Waste Report; WRAP: Bunbury, UK, 2008. [Google Scholar]
- FUSIONS. Definitional Framework for Food Waste, Full Report. 2007. Available online: http://www.eufusions.org/ (accessed on 16 July 2018).
- Clark, G. Evolution of the global sustainable consumption and production policy and the United Nations Environment Programme’s (UNEP) supporting activities. J. Clean. Prod. 2016, 15, 492–498. [Google Scholar] [CrossRef]
- Bacatariu, C. Save Food, le iniziative globali contro lo spreco, Ecoscienza: Prato, Italy, 2014.
- European Commission, DG ENV (2010). Preparatory study on food waste across EU27, BIO IS, 2010. Available online: http://ec.europa.eu/food/safety/food_waste/library/docs/bio_foodwaste_report_en.pdf (accessed on 15 October 2018).
- Falasconi, L. Waste Watcher, la Sentinella degli Sprechi; Ecoscienza, Numero 5; Waste Watcher: Bologna, Italy, 2014. [Google Scholar]
- Segrè, A. L’oro nel Piatto. Valore e Valori del Cibo; Einaudi: Mondadori, Italy, 2015. [Google Scholar]
- Sobrero, R. Sostenibilità, Sobrietà, Solidarietà. Nuovi Traguardi per la Comunicazione; Fondazione Pubblicità Progresso: Milan, Italy, 2015. [Google Scholar]
- Ufficio Scolastico per la Lombardia. Vademecum L’ABC Contro lo Spreco Alimentare; Regione Lombardia: Lombardy, Italy, 2016. [Google Scholar]
- Fanelli, R.M.; Di Nocera, A. Customer perceptions of Japanese foods in Italy. J. Ethn. Foods 2018, 5, 167–176. [Google Scholar] [CrossRef]
- Priefer, C.; Jörissen, J.; Bräutigam, K.-R. Food Waste Generation in Europe: Reasons, Scale, Impacts and Prevention Strategies. Technikfolgenabschätzung-Theorie Praxis 2014, 23, 21–31. [Google Scholar]
- Fanelli, R.M.; Di Nocera, A. How to implement new educational campaigns against food waste: An analysis of best practices in European Countries. Econ. Agroaliment./Food Econ. 2017, 2, 223–244. [Google Scholar] [CrossRef]
Figure 1.
Percentages of foods most wasted according to respondents.

Figure 2.
Causal map of the major root causes of household food wasting. *** Significant for α < 0.01.
Figure 2.
Causal map of the major root causes of household food wasting. *** Significant for α < 0.01.

Figure 3.
Type of initiative in Italy.


Table 1.
Profile of respondents (N = 1008).
| Items | Absolute Value | Percentage (%) | |
|---|---|---|---|
| Gender€ | Male | 242 | 24 |
| Female | 766 | 76 | |
| Age | 18–27 | 413 | 41 |
| 28–37 | 222 | 22 | |
| 38–47 | 131 | 13 | |
| 48–57 | 111 | 11 | |
| 58–67 | 91 | 9 | |
| 68 and over | 40 | 4 | |
| Family status | Single person household | 413 | 41 |
| Living with parents | 222 | 22 | |
| Living with partner | 181 | 18 | |
| Married with children | 121 | 12 | |
| Divorced | 51 | 5 | |
| Other (housemaid) | 20 | 2 | |
| Level of education | Without qualifications | 40 | 4 |
| Primary school | 81 | 8 | |
| Secondary school | 605 | 60 | |
| University degree | 222 | 22 | |
| Higher degree (MSc, PhD) | 60 | 6 | |
| Household composition (number of members) | 1 to 2 | 272 | 27 |
| 3 to 4 | 544 | 54 | |
| 5 to 6 | 151 | 15 | |
| >7 | 40 | 4 | |
| Occupation | In paid work (full time) | 101 | 10 |
| In paid work (part-time) | 60 | 6 | |
| Student | 413 | 41 | |
| Unemployed and looking for work | 30 | 3 | |
| Unemployed and not looking for work | 50 | 5 | |
| Housewife | 202 | 20 | |
| Discharged | 101 | 10 | |
| Pensioner | 51 | 5 | |
| Monthly income (€) | €0–400 | 212 | 21 |
| €401–800 | 302 | 30 | |
| €801–1200 | 141 | 14 | |
| €1201–1600 | 111 | 11 | |
| €1601–2000 | 60 | 6 | |
| €2001–2400 | 122 | 12 | |
| >€2400 | 60 | 6 | |
Table 2.
Weekly expenditure for food and beverages (€) and per capita daily food waste (g).
| Items | Absolute Value | Percentages (%) | |
|---|---|---|---|
| Weekly expenditure for food and non-alcoholic beverages (€) | €0–50 | 161 | 16 |
| €51–90 | 373 | 37 | |
| €91–120 | 192 | 19 | |
| €121–160 | 151 | 15 | |
| €161–200 | 91 | 9 | |
| >€200 | 40 | 4 | |
| Pro-capita daily food waste (g) | 0–50 g | 312 | 31 |
| 51–100 g | 413 | 41 | |
| 101–150 g | 131 | 13 | |
| 151–200 g | 91 | 9 | |
| >200 g | 60 | 6 |
Table 3.
Descriptive statistics of the socio-demographic characteristics.
| Variables | Mean | SD | Min | Max | CV |
|---|---|---|---|---|---|
| Age (year) | 35.94 | 15.46 | 18 | 85 | 0.43 |
| Monthly income (€) | 1062.83 | 776.47 | 180 | 3560 | 0.73 |
| Weekly expenditure on food and non-alcoholic beverages (€) | 100.73 | 51.08 | 15 | 300 | 0.51 |
| Per capita daily food waste (g) | 91.84 | 58.65 | 10 | 290 | 0.64 |
Table 4.
Descriptive statistics of the sample—categorical variables (N = 1008).
| Variables | Item | N. Obs. | Frequency |
|---|---|---|---|
| Food shopping purchases | |||
| Frequency of food purchases | 0 = less than 2 times/week | 484 | 48% |
| 1 = 2 times/week or more | 524 | 52% | |
| Food shopping stores | 0 = supermarkets | 575 | 57% |
| 1 = mini-markets | 433 | 43% | |
| Socio-demographic variables | |||
| Gender | 0 = female | 766 | 76% |
| 1 = male | 322 | 24% | |
| Family status | 0 = single | 413 | 41% |
| 1 = married | 595 | 59% | |
| Level of education | 0 = without qualifications | 40 | 4% |
| 1 = with qualification | 1048 | 96% | |
| Household size | 0 = less than 2 people | 272 | 27% |
| 1 = 2 people or more | 816 | 73% | |
Table 5.
Descriptive statistics of the major root causes of per capita daily food waste (FW) (N = 1008).
Table 5.
Descriptive statistics of the major root causes of per capita daily food waste (FW) (N = 1008).
| Major Root Causes of Food Waste | Range Min-Max | Mean | SD | CV |
|---|---|---|---|---|
| Expired food | 0–5 | 1.057 | 1.182 | 1.118 |
| Bad smell | 0–5 | 0.804 | 1.028 | 1.279 |
| Bad taste | 0–5 | 0.790 | 1.066 | 1.351 |
| It has mould | 0–5 | 0.628 | 0.870 | 1.385 |
| Over generous portions | 0–5 | 0.494 | 1.033 | 2.091 |
| Wrong conservation | 0–5 | 0.357 | 0.779 | 2.182 |
| It does not look good | 0–5 | 0.303 | 0.692 | 2.284 |
| Leftovers from previous days | 0–5 | 0.295 | 0.722 | 2.447 |
| It was left in the fridge | 0–5 | 0.223 | 0.608 | 2.726 |
| I did not like it | 0–5 | 0.174 | 0.526 | 3.023 |
| Package size | 0–5 | 0.143 | 0.484 | 3.385 |
| Difficult to measure portions correctly | 0–5 | 0.138 | 0.486 | 3.522 |
| Poor culinary skills | 0–5 | 0.122 | 0.478 | 3.918 |
| The label is confusing | 0–5 | 0.053 | 0.309 | 0.587 |
Table 6.
Coefficients of the linear regression.
| Per-capita Daily Food Waste. | Coef. | Std. Err. | t | P > |t| |
|---|---|---|---|---|
| Age | −0.116 | 0.087 | −1.32 | 0.187 |
| Gender | −199.411 *** | 1.315 | −15.16 | 0.000 |
| Family status | −6.268 *** | 1.995 | −3.14 | 0.002 |
| Level of education | 3.473 | 2.137 | 1.63 | 0.104 |
| Household size | −1.074 *** | 3.435 | −3.13 | 0.002 |
| Montly income | 0.018 *** | 0.002 | 7.88 | 0.000 |
| Weekly expenditure for food and non-alcoholic beverages | 0.262 *** | 0.026 | 10.22 | 0.000 |
| Frequency of food purchases | −3.748 *** | 3.648 | −10.27 | 0.000 |
| Food shopping stores | −1.102 *** | 142.205 | −7.75 | 0.000 |
| Expired food | 4.112 *** | 163.234 | 2.52 | 0.012 |
| Bad smell | 2.873 *** | 3.025 | 9.50 | 0.000 |
| Bad taste | −1.998 *** | 3.141 | −6.36 | 0.000 |
| It has mold | −2.285 *** | 3.281 | −6.96 | 0.000 |
| Generous portions | −6.675 *** | 1.993 | −3.35 | 0.001 |
| Wrong conservation | −1.073 *** | 3.241 | −3.31 | 0.001 |
| It does not look good | 7.606 *** | 3.064 | 2.48 | 0.013 |
| Leftovers of previous days | 9.397 *** | 307.732 | 3.05 | 0.002 |
| It remain in the fridge | 8.053*** | 2.765 | 2.91 | 0.004 |
| I did not like it | 2.088 | 3.171 | 0.66 | 0.510 |
| Package size | 2.581 *** | 3.440 | 7.50 | 0.000 |
| I’m not use to measure the portions | 5.694 | 4.685 | 1.22 | 0.224 |
| Poor culinary skills | 2.009 *** | 4.936 | 4.07 | 0.000 |
| The label confuses | −1.965 *** | 3.976 | −4.94 | 0.000 |
*** Significant for α < 0.01.
© 2019 by the author. Licensee MDPI, Basel, Switzerland. This article is an open access article distributed under the terms and conditions of the Creative Commons Attribution (CC BY) license (http://creativecommons.org/licenses/by/4.0/).
Share and Cite
MDPI and ACS Style
Fanelli, R.M. Using Causal Maps to Analyse the Major Root Causes of Household Food Waste: Results of a Survey among People from Central and Southern Italy. Sustainability 2019, 11, 1183. https://0-doi-org.brum.beds.ac.uk/10.3390/su11041183
AMA Style
Fanelli RM. Using Causal Maps to Analyse the Major Root Causes of Household Food Waste: Results of a Survey among People from Central and Southern Italy. Sustainability. 2019; 11(4):1183. https://0-doi-org.brum.beds.ac.uk/10.3390/su11041183
Chicago/Turabian StyleFanelli, Rosa Maria. 2019. "Using Causal Maps to Analyse the Major Root Causes of Household Food Waste: Results of a Survey among People from Central and Southern Italy" Sustainability 11, no. 4: 1183. https://0-doi-org.brum.beds.ac.uk/10.3390/su11041183
Note that from the first issue of 2016, this journal uses article numbers instead of page numbers. See further details here.