Article

Investigation on the Debonding Failure Model of Anchored Polyurea Coating under a High-Velocity Water Flow and Its Application

State Key Laboratory of Simulation and Regulation of Water Cycle in River Basin, China Institute of Water Resources and Hydropower Research, Beijing 100038, China
*
Author to whom correspondence should be addressed.
Sustainability 2019, 11(5), 1261; https://0-doi-org.brum.beds.ac.uk/10.3390/su11051261
Submission received: 21 January 2019 / Revised: 15 February 2019 / Accepted: 19 February 2019 / Published: 27 February 2019
(This article belongs to the Special Issue Sustainable Construction and Building Materials)

Abstract

:
The debonding failure of a polymer-based coating seriously affects the safe operation of buildings under the action of a high-velocity flood discharge flow. In order to achieve a healthy and sustainable operation of hydropower stations, the debonding failure between polyurea coating and concrete was described by the cohesive zone model, and a debonding failure model was proposed and verified. The results obtained from the model were basically consistent with the test results. Accordingly, the influence of the performance of different anchoring types, the material mechanics of polyurea-based coating and the bonding on debonding behavior were analyzed, and engineering application research was also carried out. The impact resistances of polyurea-based coating under different anchoring conditions are obtained, which provide a reference for the anti-shock and wear-resistant design of flood discharge infrastructure. The elastic modulus and Poisson’s ratio of the polyurea-based material have a significant influence on the impact resistance of polyurea-based coatings. When the elastic modulus and Poisson’s ratio of a polyurea-based material are 25 MPa and 0.45, respectively, the impact resistance is optimal. The greater the fracture energy of the bonding material, the better the impact resistance. The engineering application results show that the seepage prevention and anti-wear characteristics of flood discharge infrastructure all meet the engineering requirements.

1. Introduction

Scouring and cavitation damage are among the common problems for water conservation, especially for the high-velocity flow condition, which seriously affects the safe operation and efficiency of hydraulic structures. It is necessary for the application of concrete, with an outstanding impact and wear resistance on flood discharge infrastructure, and measures for resistance to impact and wear should also be adopted [1,2]. At the same time, protective materials used in drainage infrastructure should not only contribute high strength, but also need to improve the toughness of the materials, the resistance to temperature and humidity, and the cohesive force on the base layer, to make it a protective layer against erosion on the surface of flood discharge infrastructure.
Currently, much research is carried out to study the erosion of hydraulic structures under the scouring action of high-velocity water flow. McCall [3] established a flow-based numerical model to study the erosion and wear of stormy sandstone beaches. Buckley [4] studied the scouring effect of tsunamis and storms on pebble beaches by combining a hydrodynamic numerical model, a large gravel back analysis sedimentation-transport model, and on-site monitoring data. Chanson [5] summarized and analyzed a large number of dam flood discharge design methods. Chiganne [6] proposed a new method to evaluate the failure characteristics of earth-rock dykes with concrete on the upstream slope after flooding. Schuttrumpf [7] used theoretical and experimental methods to study the effect of the flow velocity of the dike and the thickness of the protective layer on dam damage. Matsushima [8] adopted a combination of geosynthetics to improve the impact resistance of dams, after crossing the embankment. Bomers [9] established a hydrodynamic-erosion model to study the erosion of asphalt slopes under the dike. Quang [10] studied the scouring effect of the overbank water flow on the grassland slope on the inner side of the seawall by numerical methods. The erosion and wear of a high-velocity water flow are analyzed and considered in the above studies. However, flood discharge infrastructure not only receives erosion and wear under the action of a high-velocity water flow, on account of the complicated turbulent flow of flood discharge, but the water flow will also produce a fluctuating pressure and cavitation on the building surface, which have an important effect on the erosion and wear of flood discharge infrastructure.
Polyurea-based materials are elastomeric materials with high strength and toughness and anti-wear, anti-aging, anti-corrosion, anti-shock properties in a common environment, and are widely used in flood protection [11,12]. The characteristics of polyurea-based materials were studied to provide resistance to impacts and high water pressure [13,14], but the debonding failure and leakage of the polyurea coating and wear of water infrastructure still seriously affect the safe operation of buildings in high-head hydropower engineering. Moreover, little research on debonding failures between polyurea-based coatings and flood discharge infrastructure under the action of a high-velocity water flow has been published. Hence, it is very important to study the mechanical behavior of the debonding failure between polyurea coatings and flood discharge infrastructure under the action of a high-velocity water flow and provide theoretical guidance for the design of anti-shock and wear protection in flood discharge infrastructure.
The problem of the debonding failure between polyurea-based coatings and flood discharge infrastructure is a very complex and highly nonlinear problem, so we cannot accurately describe the process of failure by traditional methods. For such problems, a cohesive zone model is often adopted [15,16], and much research is implemented to describe the debonding failure of the interface of homogeneous materials [17], composites [18], fiber-reinforced polymer-steel [19], pressure-sensitive adhesive and polyethylene substrate [20], titanium alloy stent and polyurea coating [21], and high molecular polymers [22]. In addition, the cohesive zone model is also widely used to study various time- and space-related impact damage and fracture problems, complex damage and fracture processes [23,24], and the dynamic process of crack propagation [25,26]. Hence, the cohesive zone model was adopted to describe the interface behavior between the polyurea coating and flood discharge infrastructure.
In this paper, a debonding failure model was developed to describe the debonding failure between polyurea coating and flood discharge infrastructure under the action of a high-velocity water flow, and was verified by tests. Furthermore, the influence of anchoring conditions, the mechanical properties of the polyurea coating and the interlayer on the impact resistance of polymer-based coatings was studied. Finally, the model was implemented to design the impact resistance of engineering. The remainder of the paper is structured as follows. In Section 2, the debonding failure model of flood discharge infrastructure under a high-velocity water flow is introduced. In Section 3, the feasibility of the model is verified by comparison with tests. In Section 4, the impact resistance under different anchoring conditions is analyzed, and the sensitivity of the polyurea-based coating and bonding layer material parameters are also analyzed. In Section 5, the model is adopted for the impact resistance design of engineering. Finally, the main conclusions of this study are presented in Section 6.

2. Debonding Failure Model under a High-Velocity Water Flow

The water flow acts on the flood discharge infrastructure, causing serious erosion when the polyurea coating is peeled off under the action of a high-velocity water flow. Repairing this not only affects the normal operation of the hydropower station, but also costs a lot. In order to make the hydropower station operate in a healthy and continuous manner, the theory and modeling of the loading of a high-velocity water flow were introduced. According to the debonding failure process between polyurea-based coating and concrete, a debonding failure model was established.

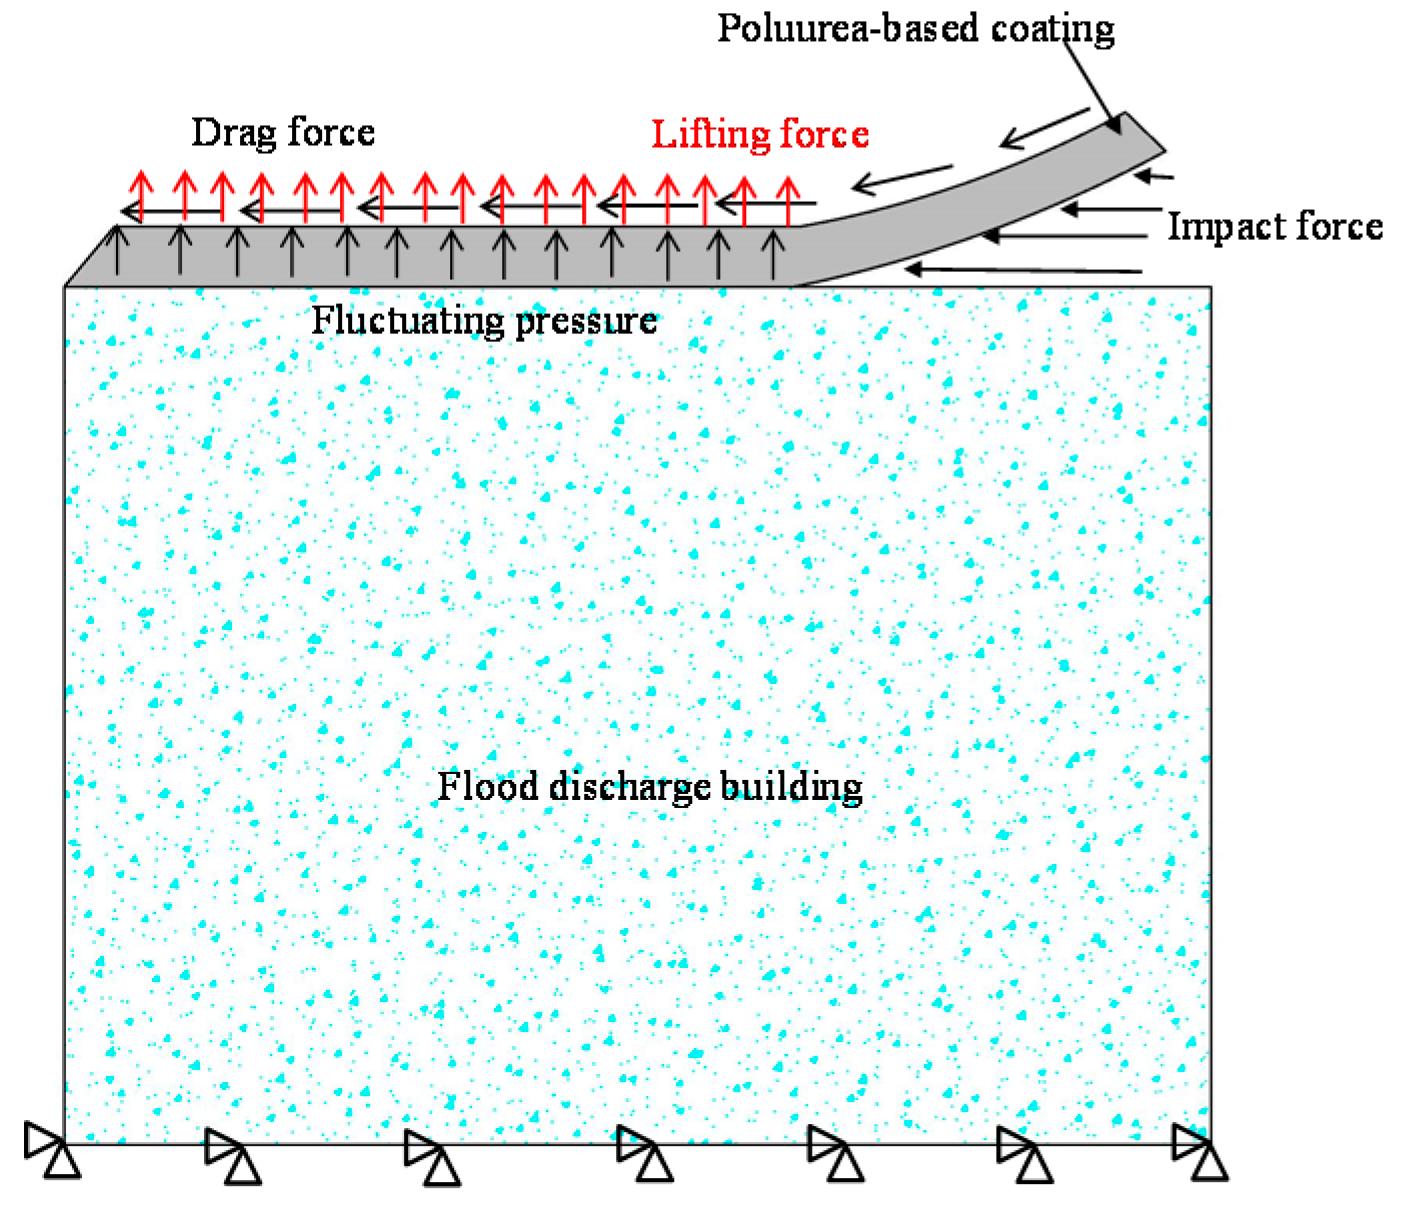
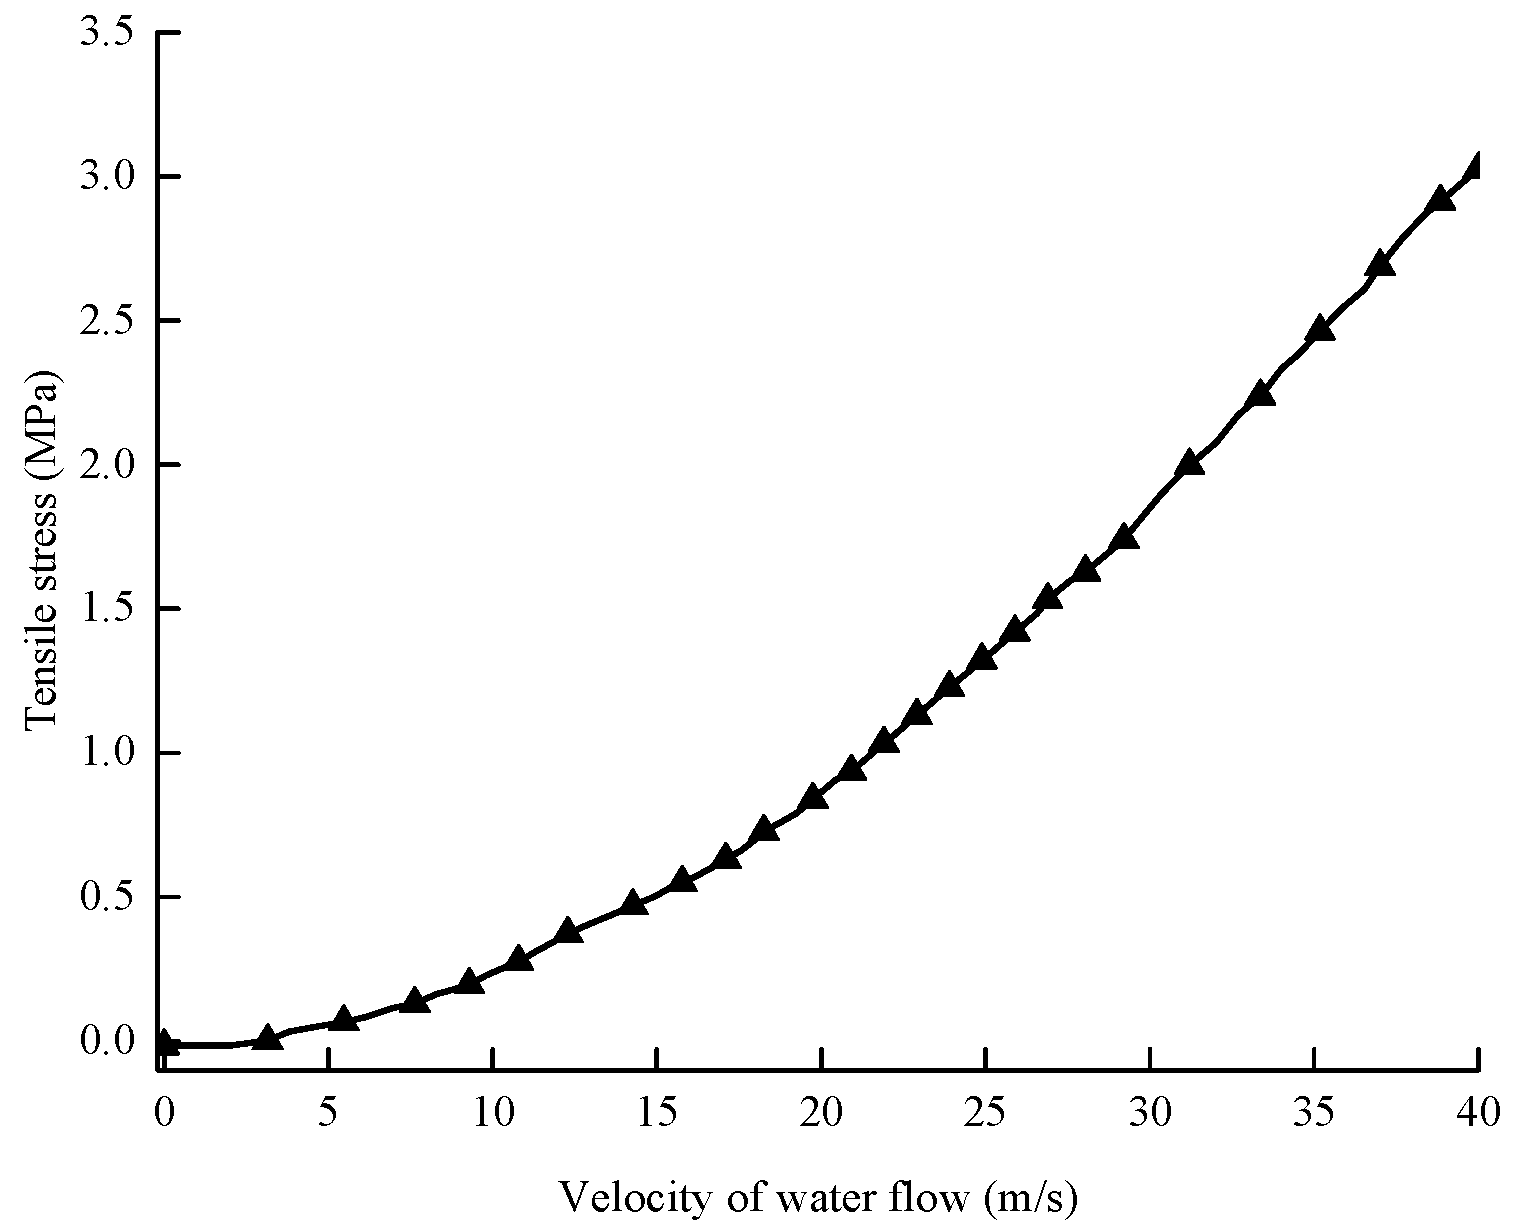
2.1. The Loading of a High-Velocity Water Flow

Loading on the polyurea-based coating is very complicated because of the complicated turbulent flow, and there is no reasonable model to accurately describe such a flow. Therefore, we assume that loading on the polyurea-based coating mainly includes drag force, impact force, fluctuating pressure, and lifting force, and the calculation methods are as follows.
(1) Drag force
The force acting on the polyurea-based coating is generally decomposed into horizontal drag force and vertical lift force under the action of a high-velocity water flow. The drag force exerted by the force body is related to its shape. In this study, the polyurea-based coating is a flat planar, and the classical drag force calculation formula is adopted.
F d = 1 2 ρ C D A C u C 2 ,
where F d is the drag force, A C is the reference plane that the projected area of the water flow, u C is the flow velocity of the undisturbed flow. C D is the drag coefficient for the water flow to the polyurea-based coating and is 0.09 [27].
(2) Impact force
Under the action of a high-velocity water flow, the water flow has an impact on the objects in the flow channel. When the high-velocity water flow has an impact on the polyurea-based coating at a certain speed, the impact force can be calculated based on Newton’s kinetic energy theory:
F i t   =   mv 1     mv 2 ,
where F i is the impact force of a high-velocity water flow on polyurea-based coating; v1 is the initial velocity of water; and v2 is the velocity after impact.
(3) Fluctuating pressure
When the flocculation water flow encounters a boundary or other obstacle (polyurea-based coating), the kinetic energy is converted into pressure energy, and the water flow generates a fluctuating pressure. If the turbulence flow is considered to be homogeneous and isotropic, the calculation formula of the fluctuating pressure can be expressed as follows:
P f = α ρ u 2 ,
where P f is the fluctuating pressure, ρ is the density of water, u is the flow velocity of the water flow, and α is a dimensionless coefficient with a value of 0.6 [28,29].
(4) Lifting force
The high-velocity water flow brings about a load on the surface of the polyurea-based coating, and the force perpendicular to the potential flow direction is referred to as the lifting force. In contrast to the drag force, the lift force is the force perpendicular to the direction of the water flow. The lifting force usually acts in an upward direction to counteract gravity, but it can act in any direction, at right angles to the flow direction. The lifting force of water to the surface of the building can be expressed as [30]:
F l = 1 2 C L ρ Sv 2 ,
where ρ and v are the density and velocity of water, respectively, and S is the projected area of the water flow on the surface of the polyurea-based coating. C L is the coefficient of the lifting force, which is determined by the direction of the water flow, Mach number, and Thunder number, and the value adopted is 0.08 [31].

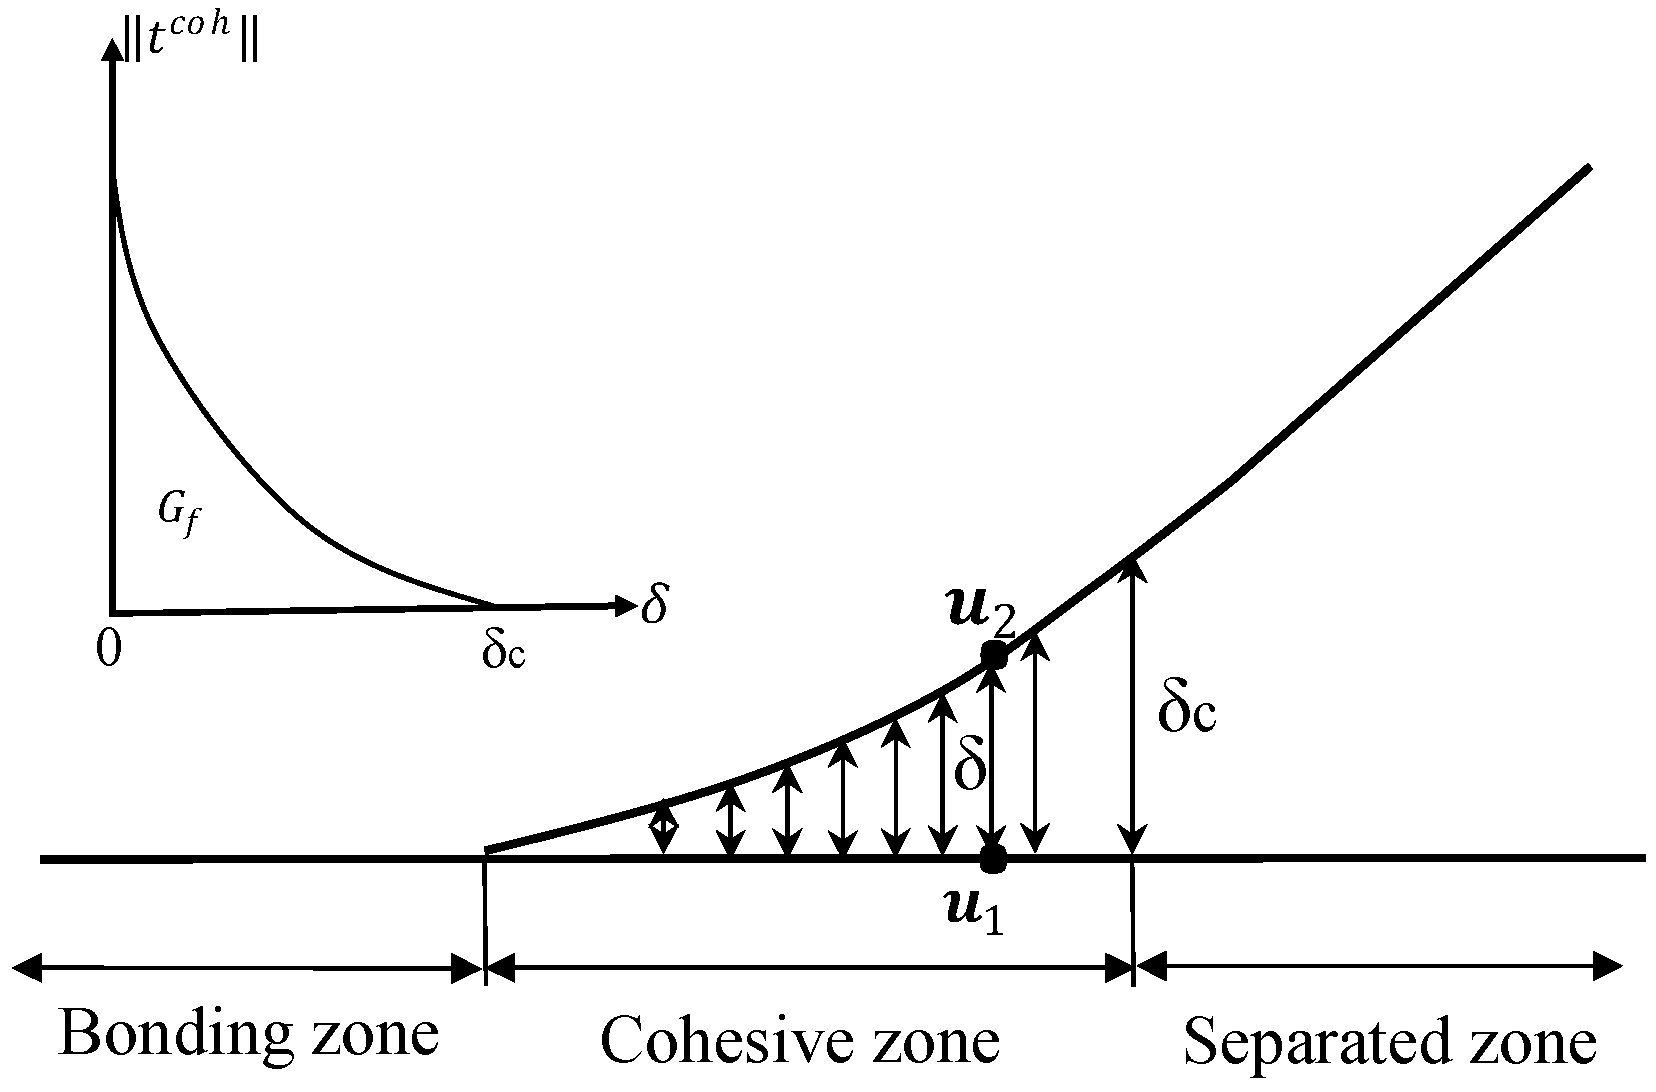
2.2. Debonding Failure Model

Polyurea-based coatings are subjected to the load of the water flow during the process of flood discharge, when the loading of the water flow exceeds the bonding strength between the polyurea-based coating and the flood discharge infrastructure, and cracks occur and continue to expand until complete damage, under the action of water flow, has been achieved. A high-velocity water flow debonding failure model was established to describe this process, and a schematic of the model is shown in Figure 1. According to the idea of the cohesive zone model [15,16], the debonding failure zone can be divided into two parts: one part is the polyurea-based coating, completely separated from the flood discharge infrastructure; the other part is the polyurea-based coating that is not completely separated from the flood discharge infrastructure, and there is also a cohesion between the two parts, as shown in Figure 2.
The cohesive zone model was adopted to describe the mechanical properties of the cohesive crack zone. From the beginning of the crack formation between the polyurea-based coating and the flood discharge infrastructure to the complete separation, the stress‒displacement relationship of the cohesive zone can be expressed by the following formula:
t p ( δ ) = f t exp ( f t G f δ ) ,
where f t is the surface force, G f is the fracture energy, and t p is the tensile stress. Moreover, δ is the relative displacement between the cohesive elements, which can be expressed by the following formula:
δ = u 1 u 2 ,
where u 1 and u 2 are the position coordinates before and after deformation, respectively.
The traction force of the cohesive zone model in the cohesive fracture zone can be expressed as follows:
t p ( δ ) = K coh δ ,
where K coh is the stiffness coefficient, and K is the elastic modulus of the interface material; when the relative displacement δ≪0, K coh = K .
The strength characteristics of the interface material are used to judge the production of cracks in the interface, and the relationship between the traction force and the relative displacement of the interface is expressed as follows:
t p = K ( u 1 u 2 ) .
When the component stress of the surface stress t p in the vector’s normal direction exceeds the tensile strength ( t s ) of the material, damage occurs, and the expression of this is as follows:
t p · n   > 0   and   t p   t s .

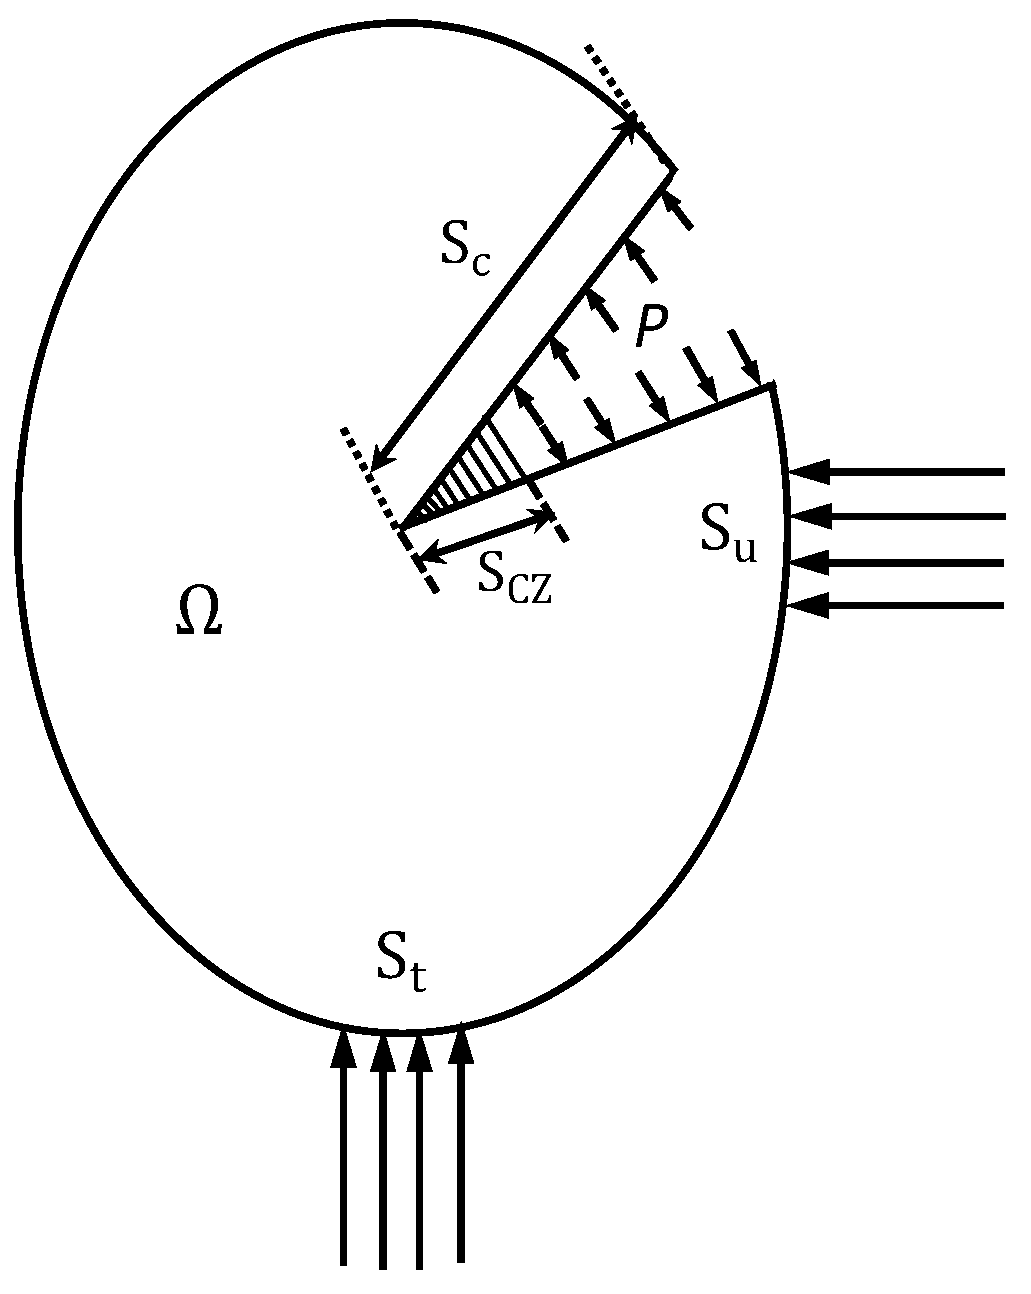
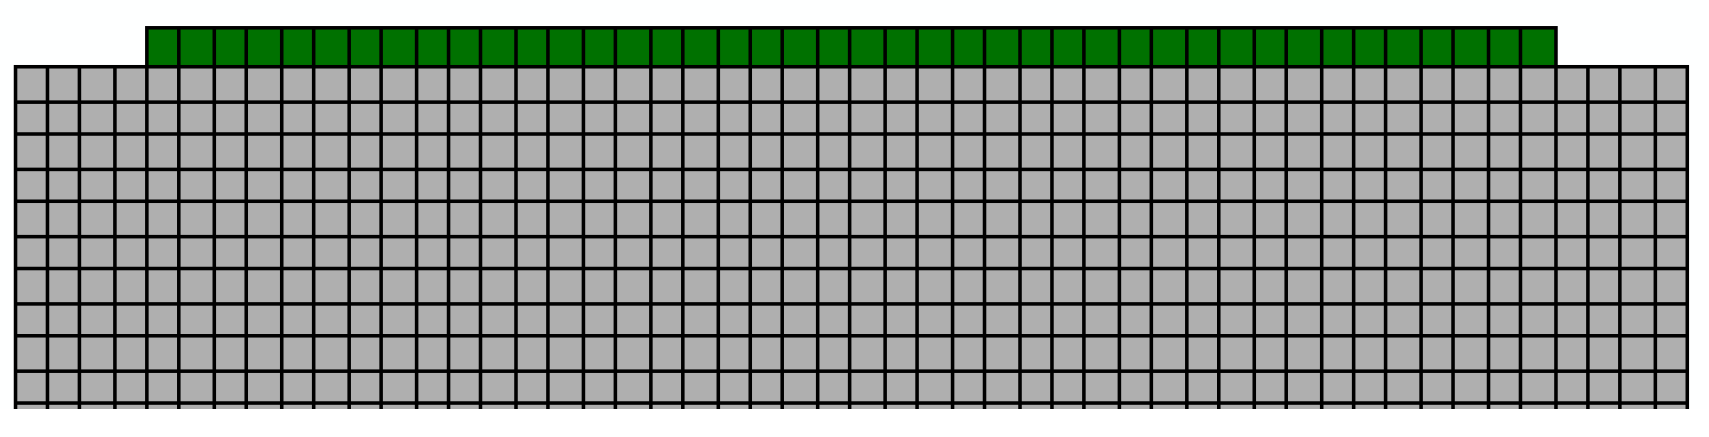
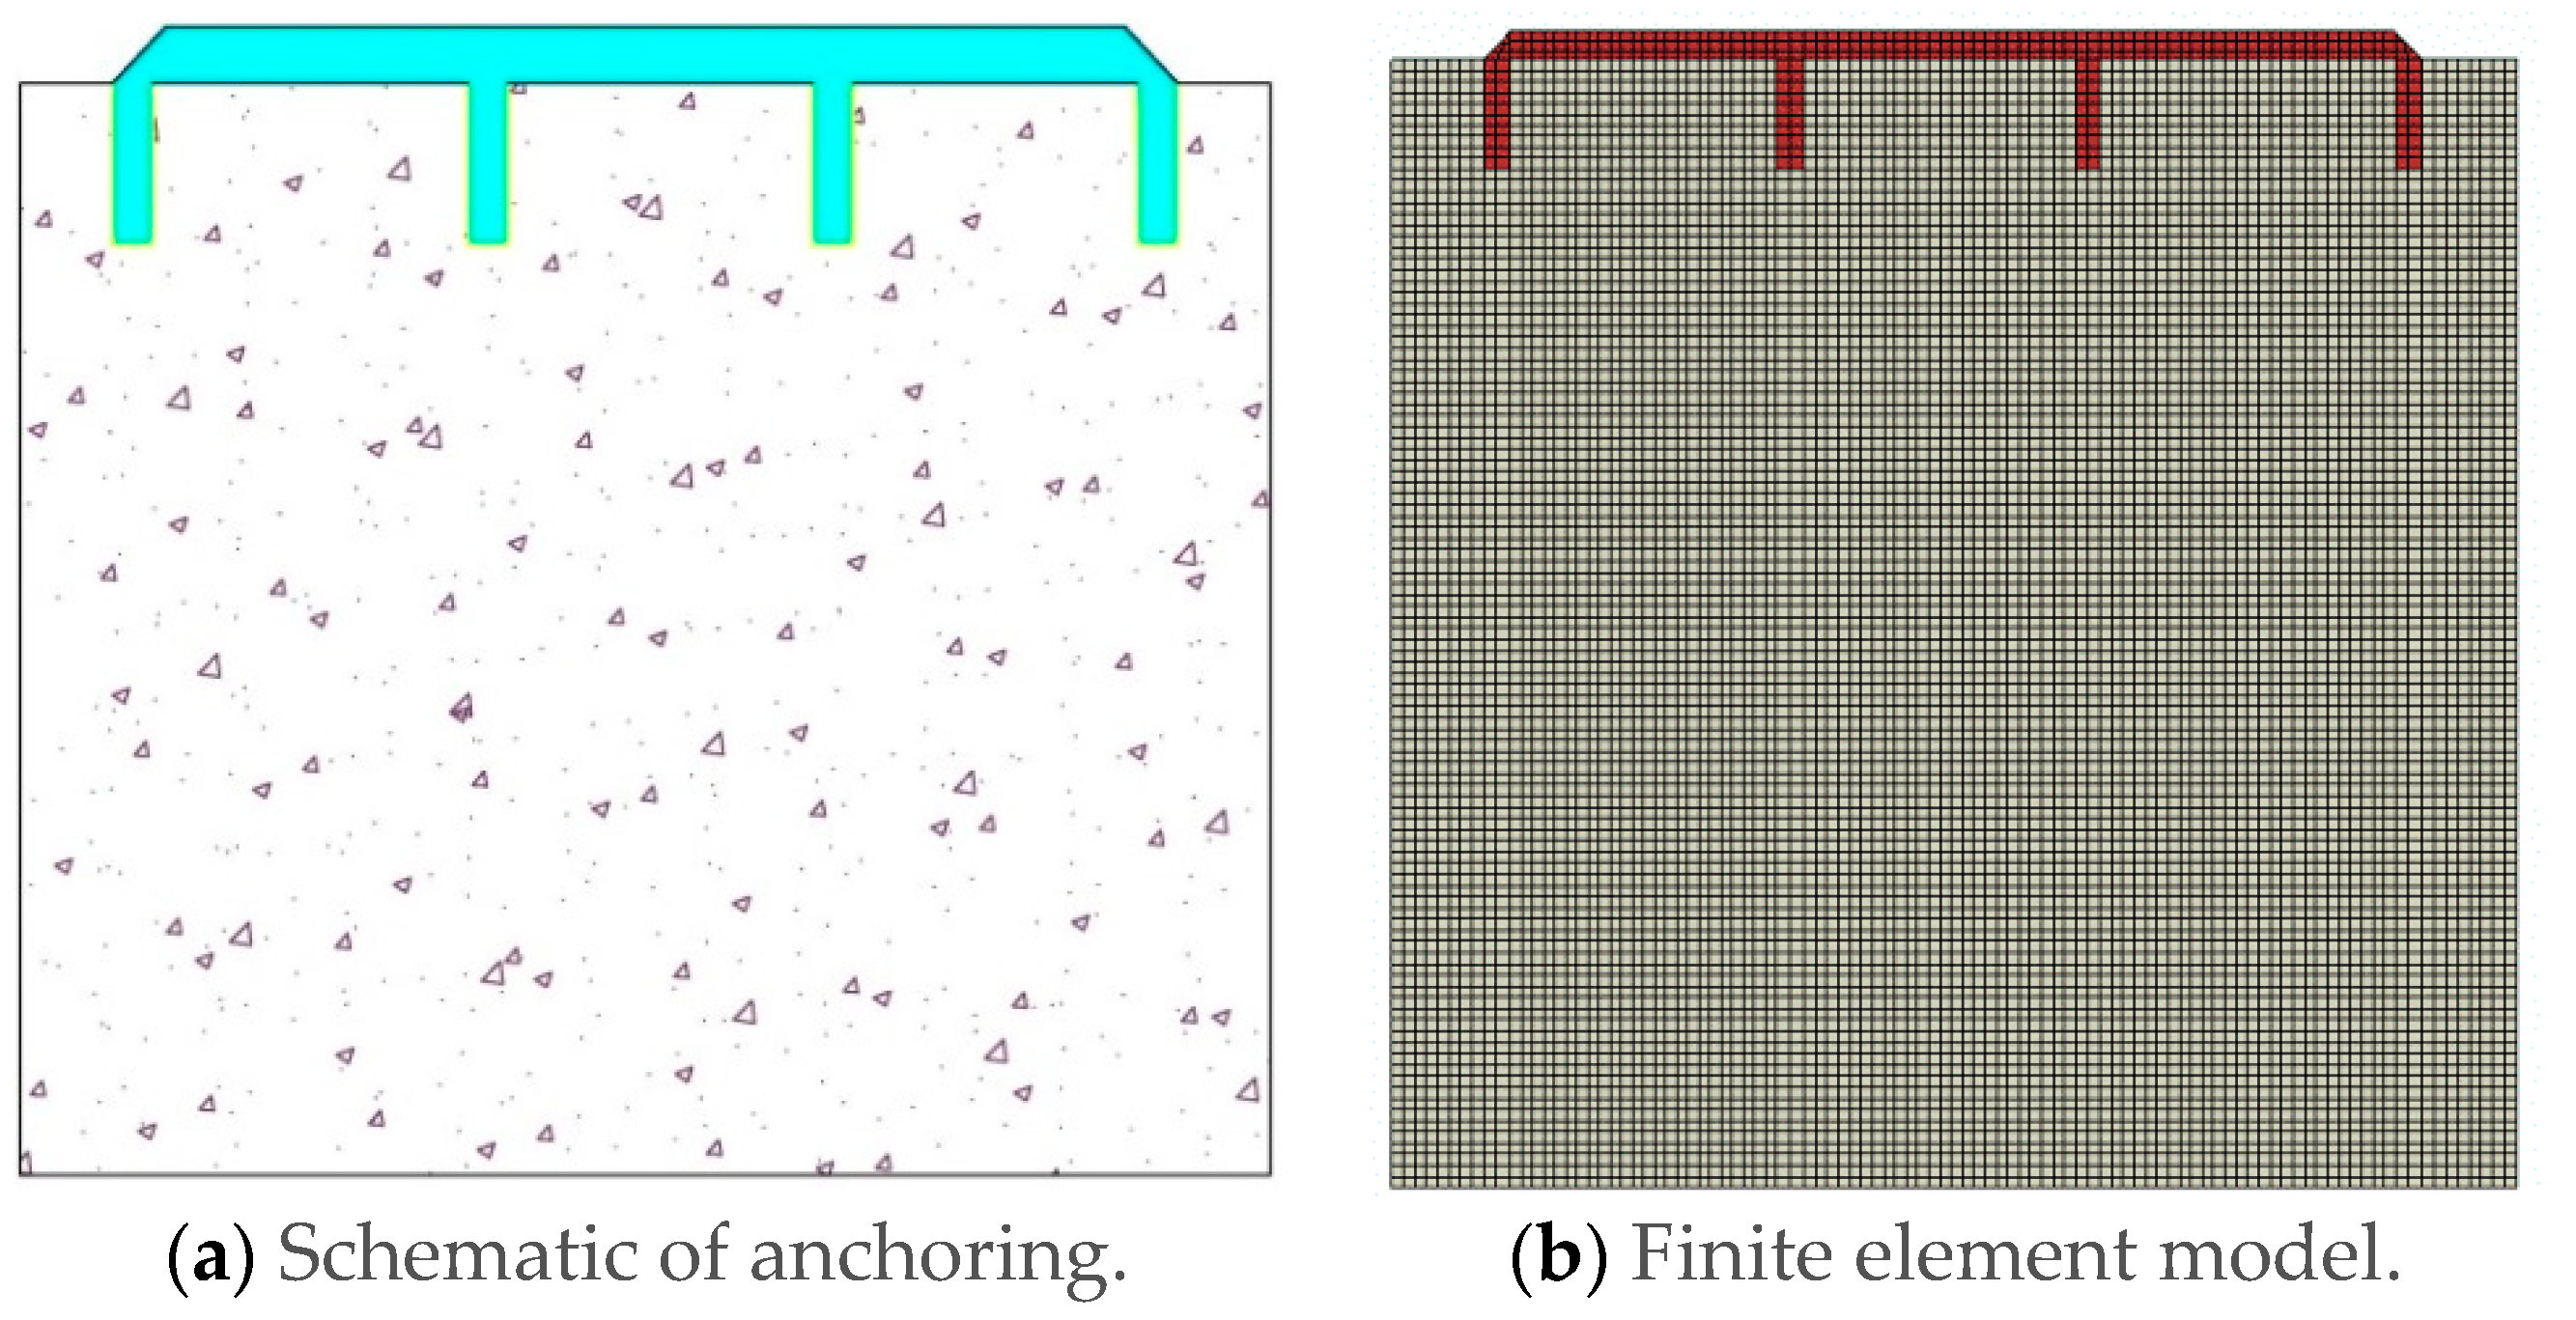
2.3. The Form of the Finite Element of the Model

The debonding failure between the polyurea-based coating and the flood-protecting infrastructure was characterized by the cohesive zone element, without thickness, and the stress element was adopted to describe the mechanical behavior of the matrix material. The finite element formal equations, constitutive relations, damage initiation and evolution principles, and contact collisions of model are all introduced next.
(1) Finite element equation
Considering the fluid‒solid coupling and cohesive zone element at the debonding joint, the finite element equation, according to the virtual work principle, is as follows [32]:
v σ : δ ε d V + S C Z T C Z · δ Δ ˙ dS = S t T · δ udS + S c S C Z P · δ Δ d S ,
where S t represents the mechanical boundary; S u represents the displacement boundary; S CZ represents the cohesive element boundary; and S c represents the crack boundary, as shown in Figure 3. σ and ε are the stress and strain vectors of the body element, respectively, T CZ is the traction force vector of the cohesive element, Δ is the relative displacement vector of the cohesive zone interface, T is the external load vector, and P is the cleavage water pressure.
According to the fluid‒solid coupling theory [33], the water pressure P can be calculated as follows:
P = 12 μ qLx h f w 0 2 w + P 0 ,
where q is the water flow rate in the debonding joint, w 0 is the width of the widest in debonding joint, h f and L are the height and length of debonding joint, respectively, P 0 is the water pressure, w is the width of the debonding joint at a location along the expansion direction of the debonding joint, and μ and ρ are the viscosity and density of water, respectively.
The Newton‒Raphson iterative method was adopted for iterative calculation. The virtual work of the cohesive element can be expressed by the following formula:
δ W c = s ( δ Δ ˙ n T n + δ Δ ˙ t T t ) 1 J dS ,
where T n and T t are the normal and tangential traction force, respectively, δ Δ n and δ Δ t are the normal and tangential opening displacements, respectively, A is the surface area of the external load, and J is the transformation matrix, before and after surface deformation.
Taking the shape function of the cohesive element into Equation (12), the discrete virtual work d δ W c of the current form can be expressed as follows:
δ W c = s ( δ Δ ˙ n T N T T n + δ Δ ˙ t N T T t ) 1 J dS ,
where N represents the shape function of the cohesive element. The first variable of virtual work, d δ W c , is given as:
d δ W c = s ( δ Δ ˙ n T N T dT n + δ Δ ˙ t T N T dT t ) 1 J dS + s ( δ Δ ˙ n T N T T n + δ Δ ˙ t T N T T t ) d ( 1 J ) dS .
The second item of Equation (14) considers the stretching of the cohesive element. For small stretching of the cohesive element, this term is negligible, and the first variation of the virtual work can be approximated as:
d δ W ¯ c s ( δ Δ ˙ n T N T dT n + δ Δ ˙ t T N T dT t ) 1 J dS .
The relationship between incremental tractions and incremental jump velocities is as follows:
{ dT n dT t } = [ C ] { d Δ ˙ n d Δ ˙ t }
[ C ] = [ T n Δ n T n Δ t T t Δ n T t Δ t ] ,
where [ C ] is the Jacobian of the cohesive element. Including Equation (16) in Equation (15), the stiffness matrix of the cohesive element can be obtained as follows:
K coh e = S [ A ] T [ C ] [ A ] 1 J dS ,
where [A] represents the shape function matrix of the cohesive element. Therefore, the total element stiffness matrix is as follows:
( K e + K coh e ) { u ˙ e } = { f e ˙ } ,
where K e is the matrix stiffness of the material, u e and f e are the matrices of the displacement and external load, respectively.
(2) Constitutive equation
The constitutive relation of the cohesive element is characterized by the traction‒separation law, and the failure mechanism can be divided into three stages: damage initiation, damage evolution, and fracture failure. When the stress or strain state of the cohesive element meets the damage initiation criterion, the cohesive element enters the stage of damage evolution, and after reaching the corresponding failure condition, the cohesive element will be removed [34].
The constitutive relationship of the cohesive element in the traction‒separation law is as follows:
t = { t n t t } = [ K nn K nt K nt K tt ] { δ n δ t } = K δ ,
where t is the traction stress vector of the cohesive element, including normal stress t n and tangential stress t t , δ is the opening displacement vector, including the normal opening displacement δ n and the tangential opening displacement δ t , K is the stiffness matrix of the cohesive element, which is composed of normal stiffness K nn , tangential stiffness K tt and shear stiffness K nt .
(3) Damage initiation law
The process of damage initiation of the cohesive element begins when the stress or strain of the cohesive element meets the damage initiation law. The second nominal stress criterion is usually adopted when the quadratic sum of the stress rates in the two directions reaches 1, and the damage evolution of cohesive element begins. The formula is expressed as:
{ t n t n 0 } 2 +   { t t t t 0 } 2 = 1 ,
where t n and t t represent the normal stress and tangential stresses, respectively; t n 0 and t t 0 are the maximum stress in the normal and tangential directions, respectively. Because the cohesive element is impossible to damage under pure pressure conditions, the MacAulay equation is introduced:
t n = { t n   t n 0   0   t n < 0   .
(4) Damage evolution law
The damage evolution law of the cohesive element describes the attenuation pattern of the element stiffness after the stress or strain satisfies the initial criterion of damage. A damage variable D, with an initial value of 0, was introduced to describe the evolution process, and it monotonously increases from 0 to 1, when the material enters the damage evolution stage. The relationship between the stress components of the cohesive element and the damage variable is as follows:
t n = { ( 1 D ) E n δ n 0   E n δ n   δ n < 0   t t = ( 1 D ) E t δ t .
(5) Contact Model
After the debonding failure between the polyurea-based coating and the concrete, the cohesive force unit will be removed, and the polyurea-based coating itself and the concrete in the separation zone will interact with each other under the action of the water flow. The contact action can be divided into normal action and tangential action, which includes the relative motion and potential friction between the contact faces.
The normal behavior of the contact surface is usually defined as the normal pressure being transmitted when the two objects are not separated [35]. Once a gap between the two contact surfaces is generated, there will be no normal pressure. This normal contact behavior is called hard contact. Contact pressure P at any point on the contact surface is a function of excessive occlusion, P = P(h). This relationship can be expressed as:
P = 0, h < 0, contact surfaces are open   
h = 0, p > 0, contact surfaces are closed.
With this normal behavior, penetration will not occur on the surface during the contact calculation.
The contact interaction in the tangential direction is based on the penalty method, which conforms to the Mohr–Coulomb criterion. When the contact stress is less than the critical stress, no relative slip between surfaces occurs. The relative slip between surfaces occurs as long as the equivalent contact stress exceeds the critical stress. Accordingly, the equivalent contact stress and critical contact stress, respectively, can be calculated by:
τ eq = τ 1 2 + τ 2 2 τ crit = μ P ,
where τ eq is the equivalent contact stress, τ 1 2 and τ 2 2 are the components of tangential stress, τ crit denotes the critical stress, μ represents the coefficient of friction, and P is the contact stress.

3. Model Verification

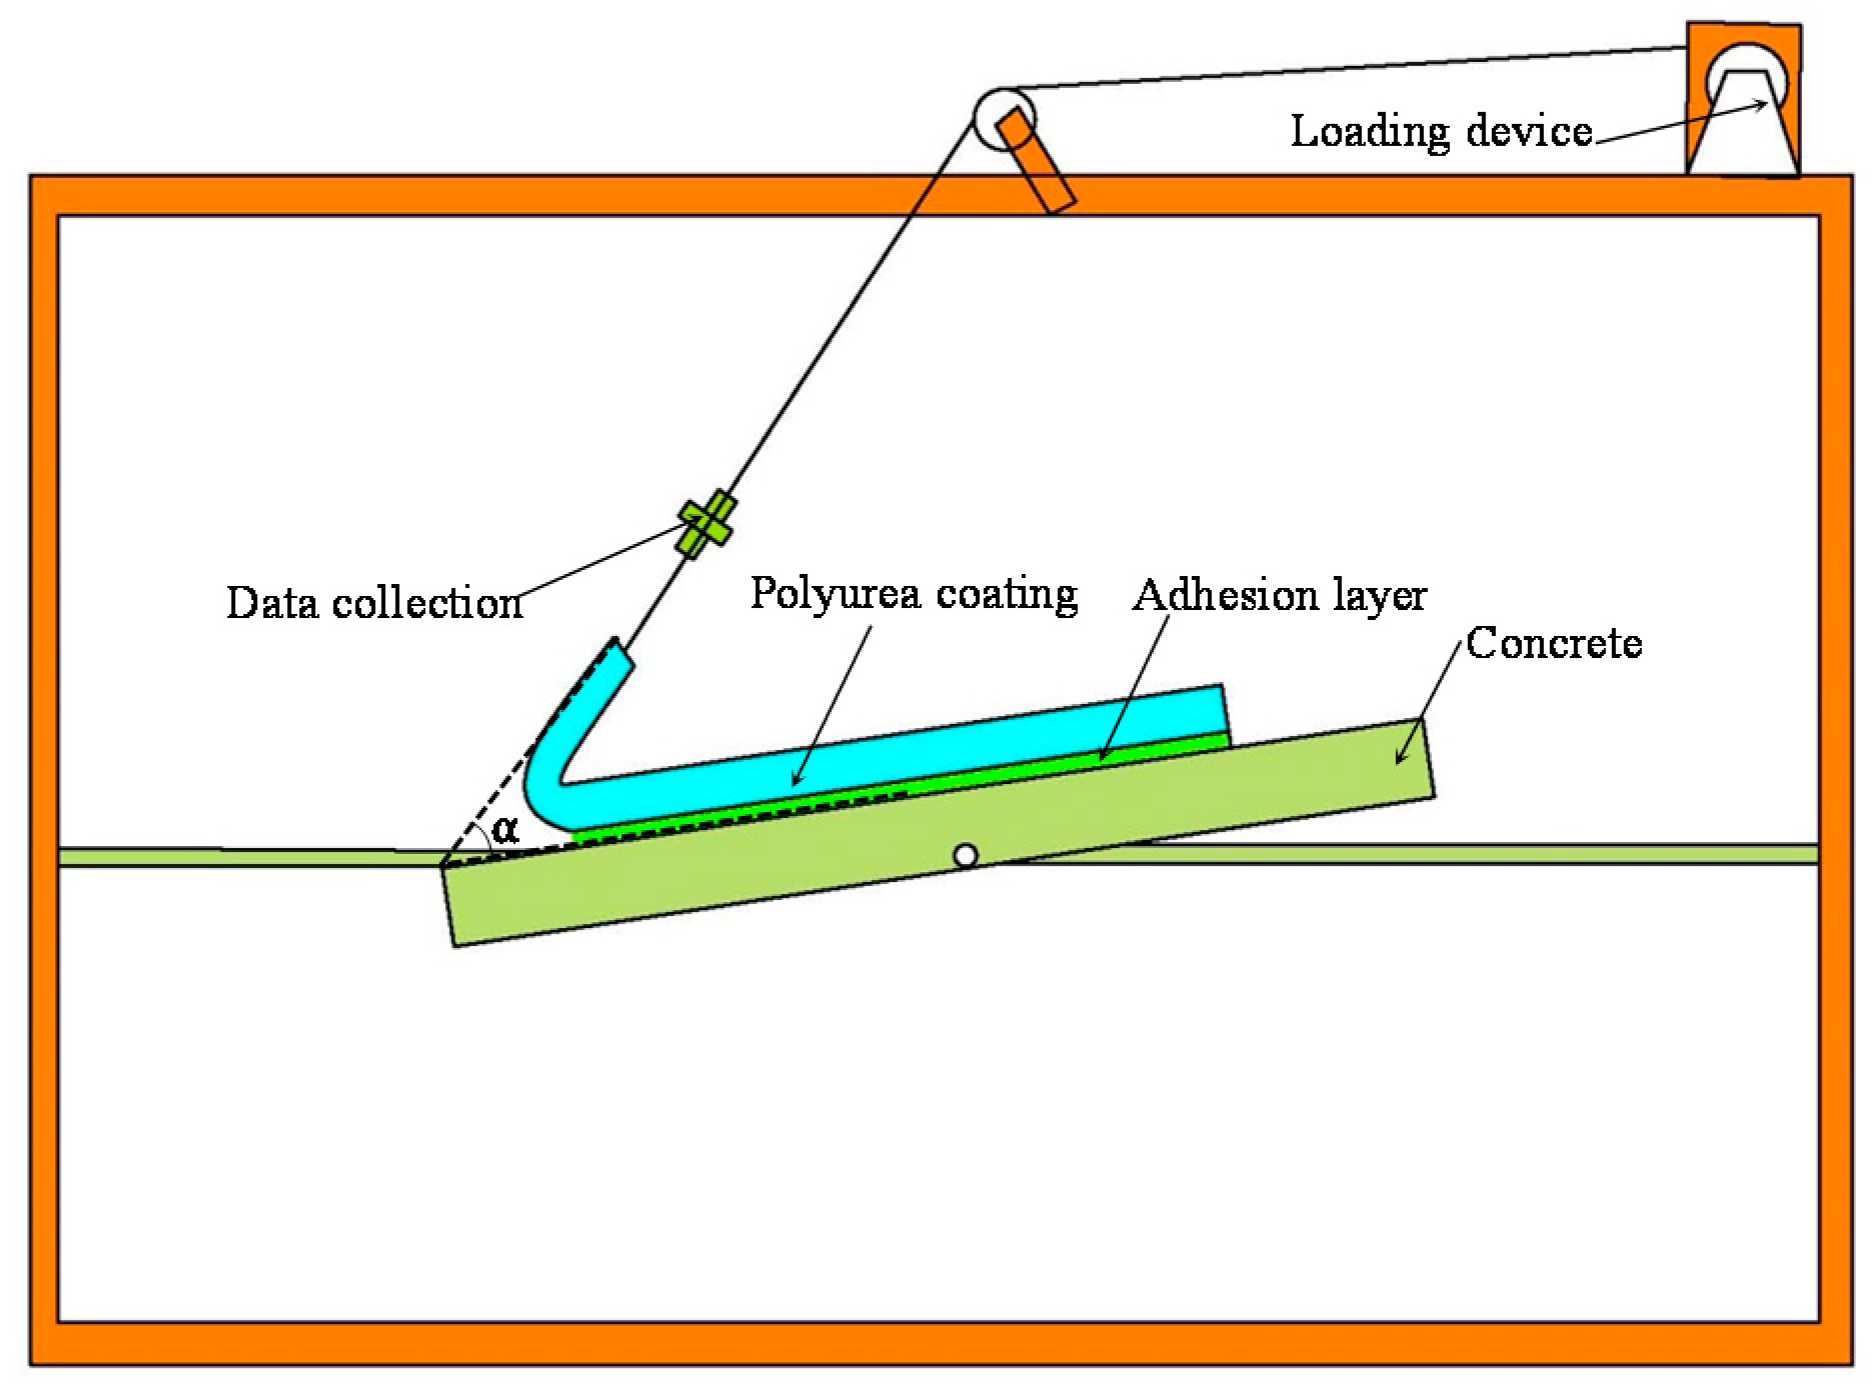
3.1. Debonding Failure Tests

3.1.1. Test Conditions
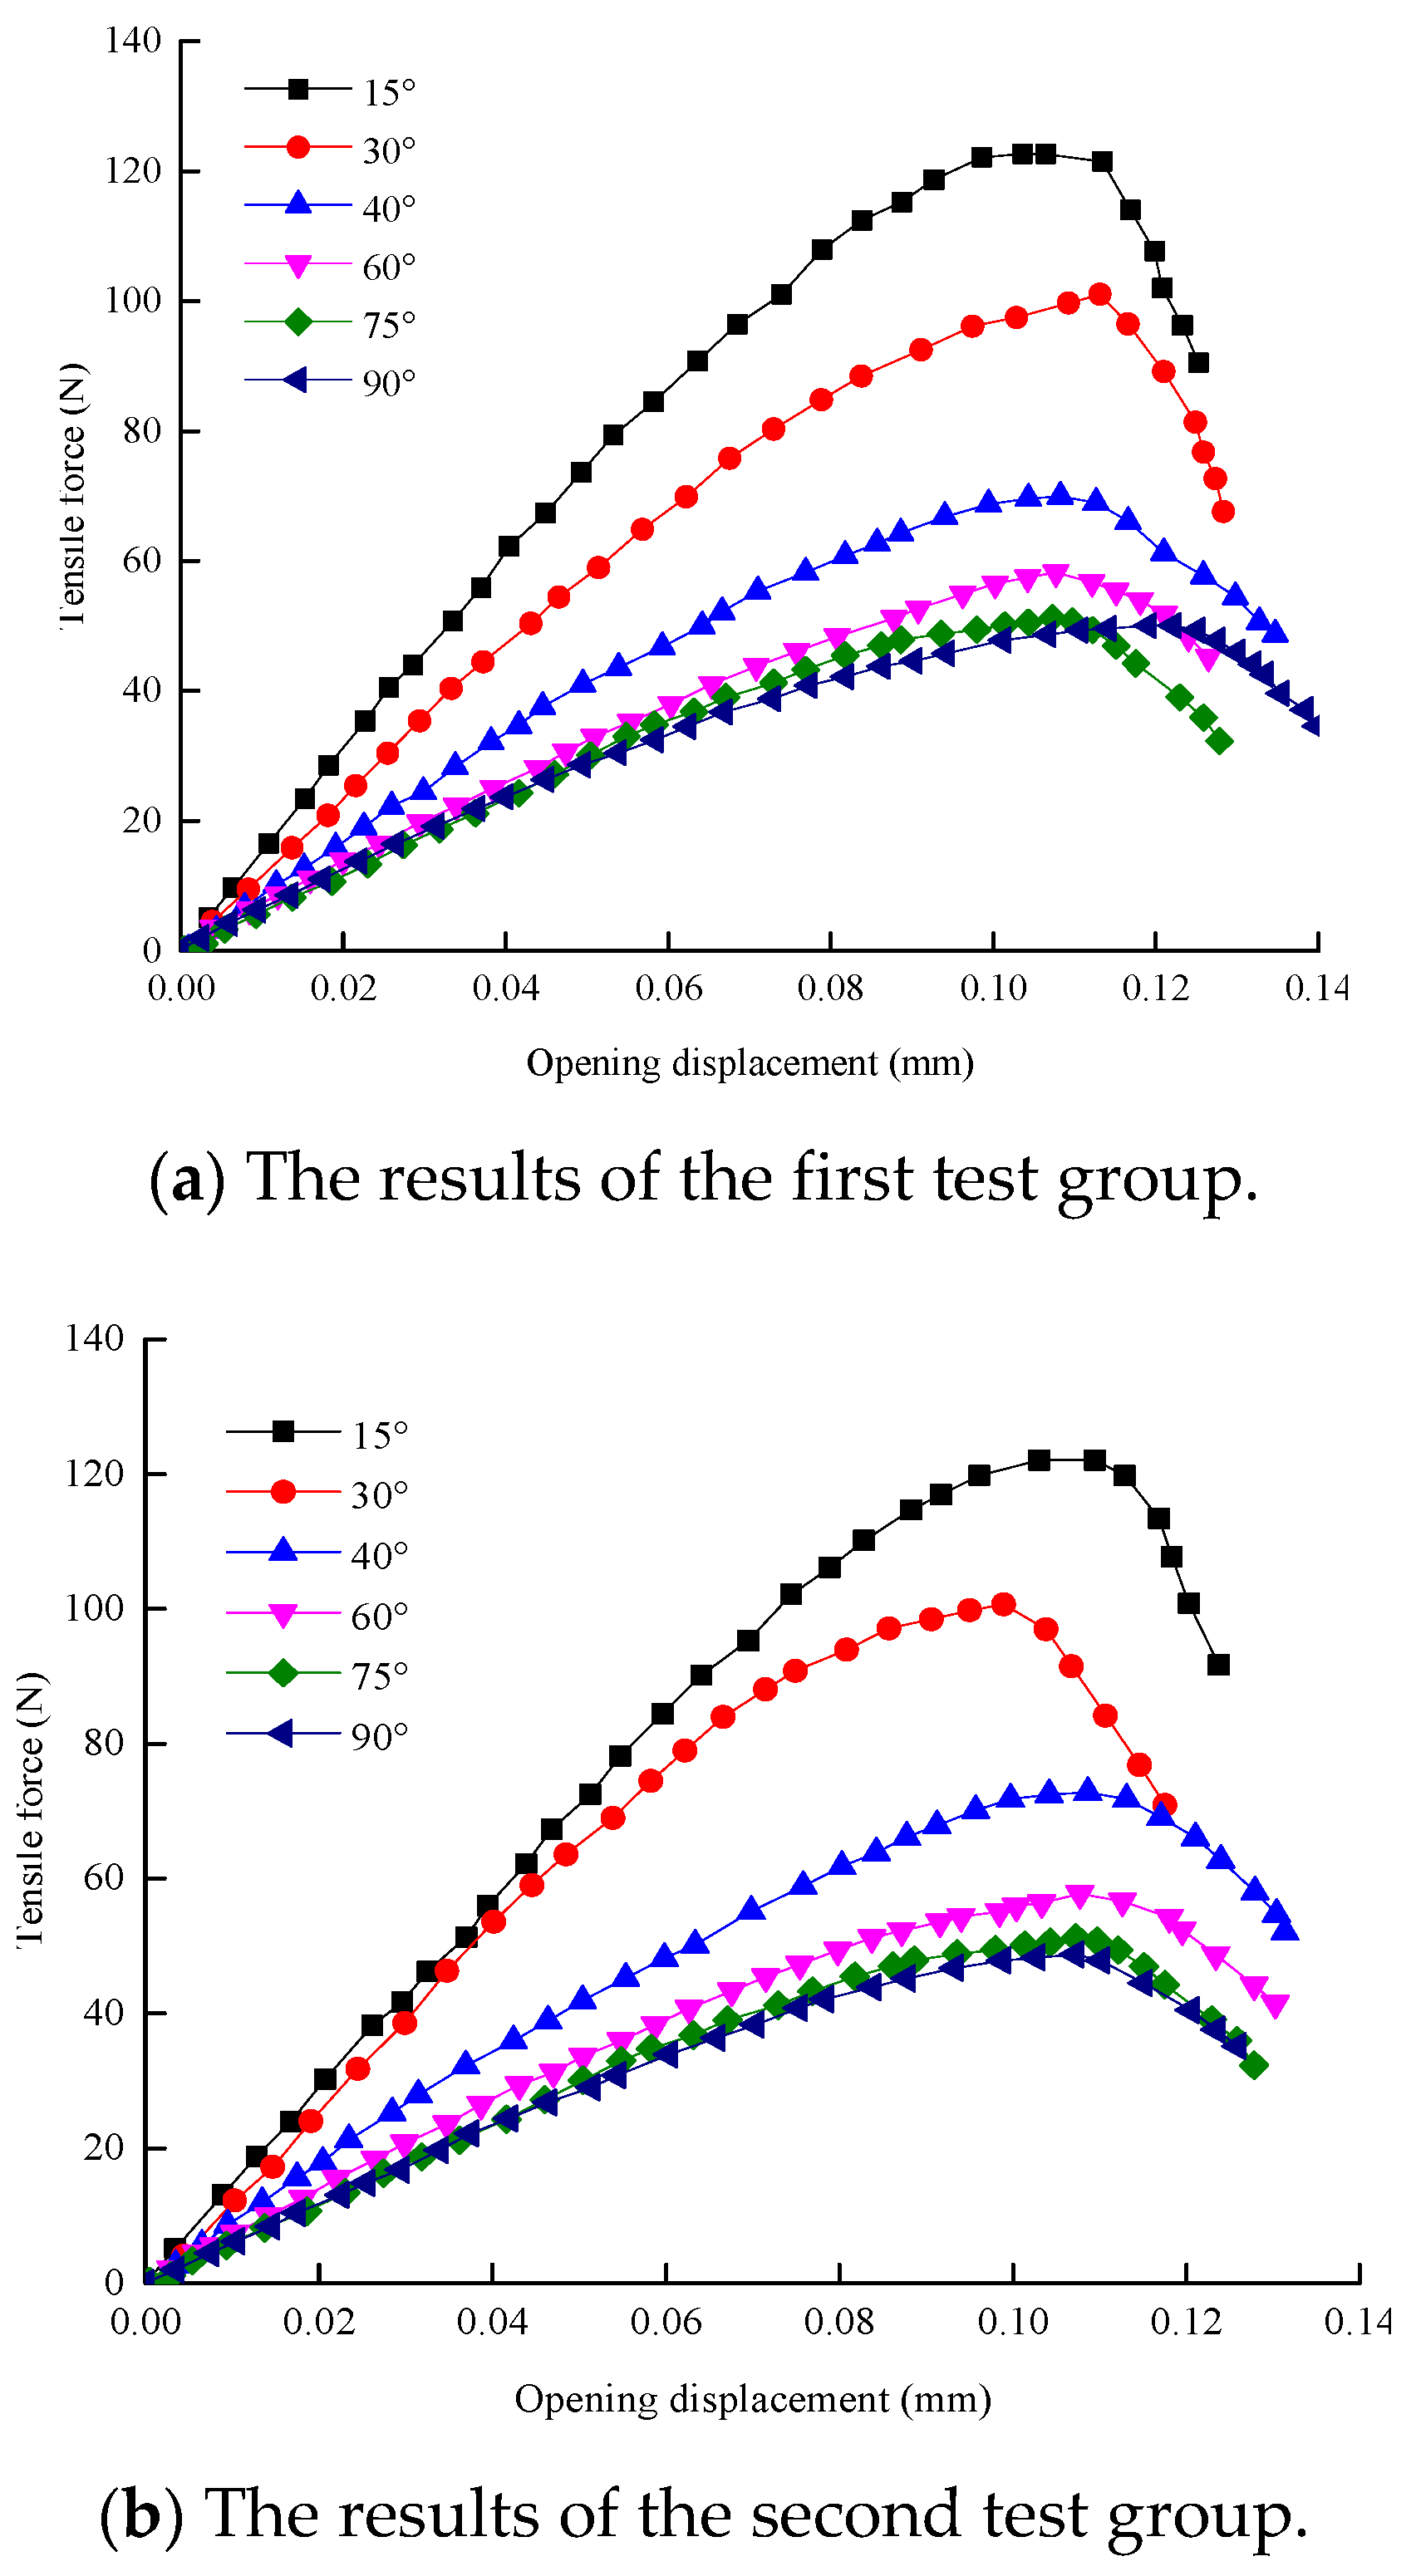
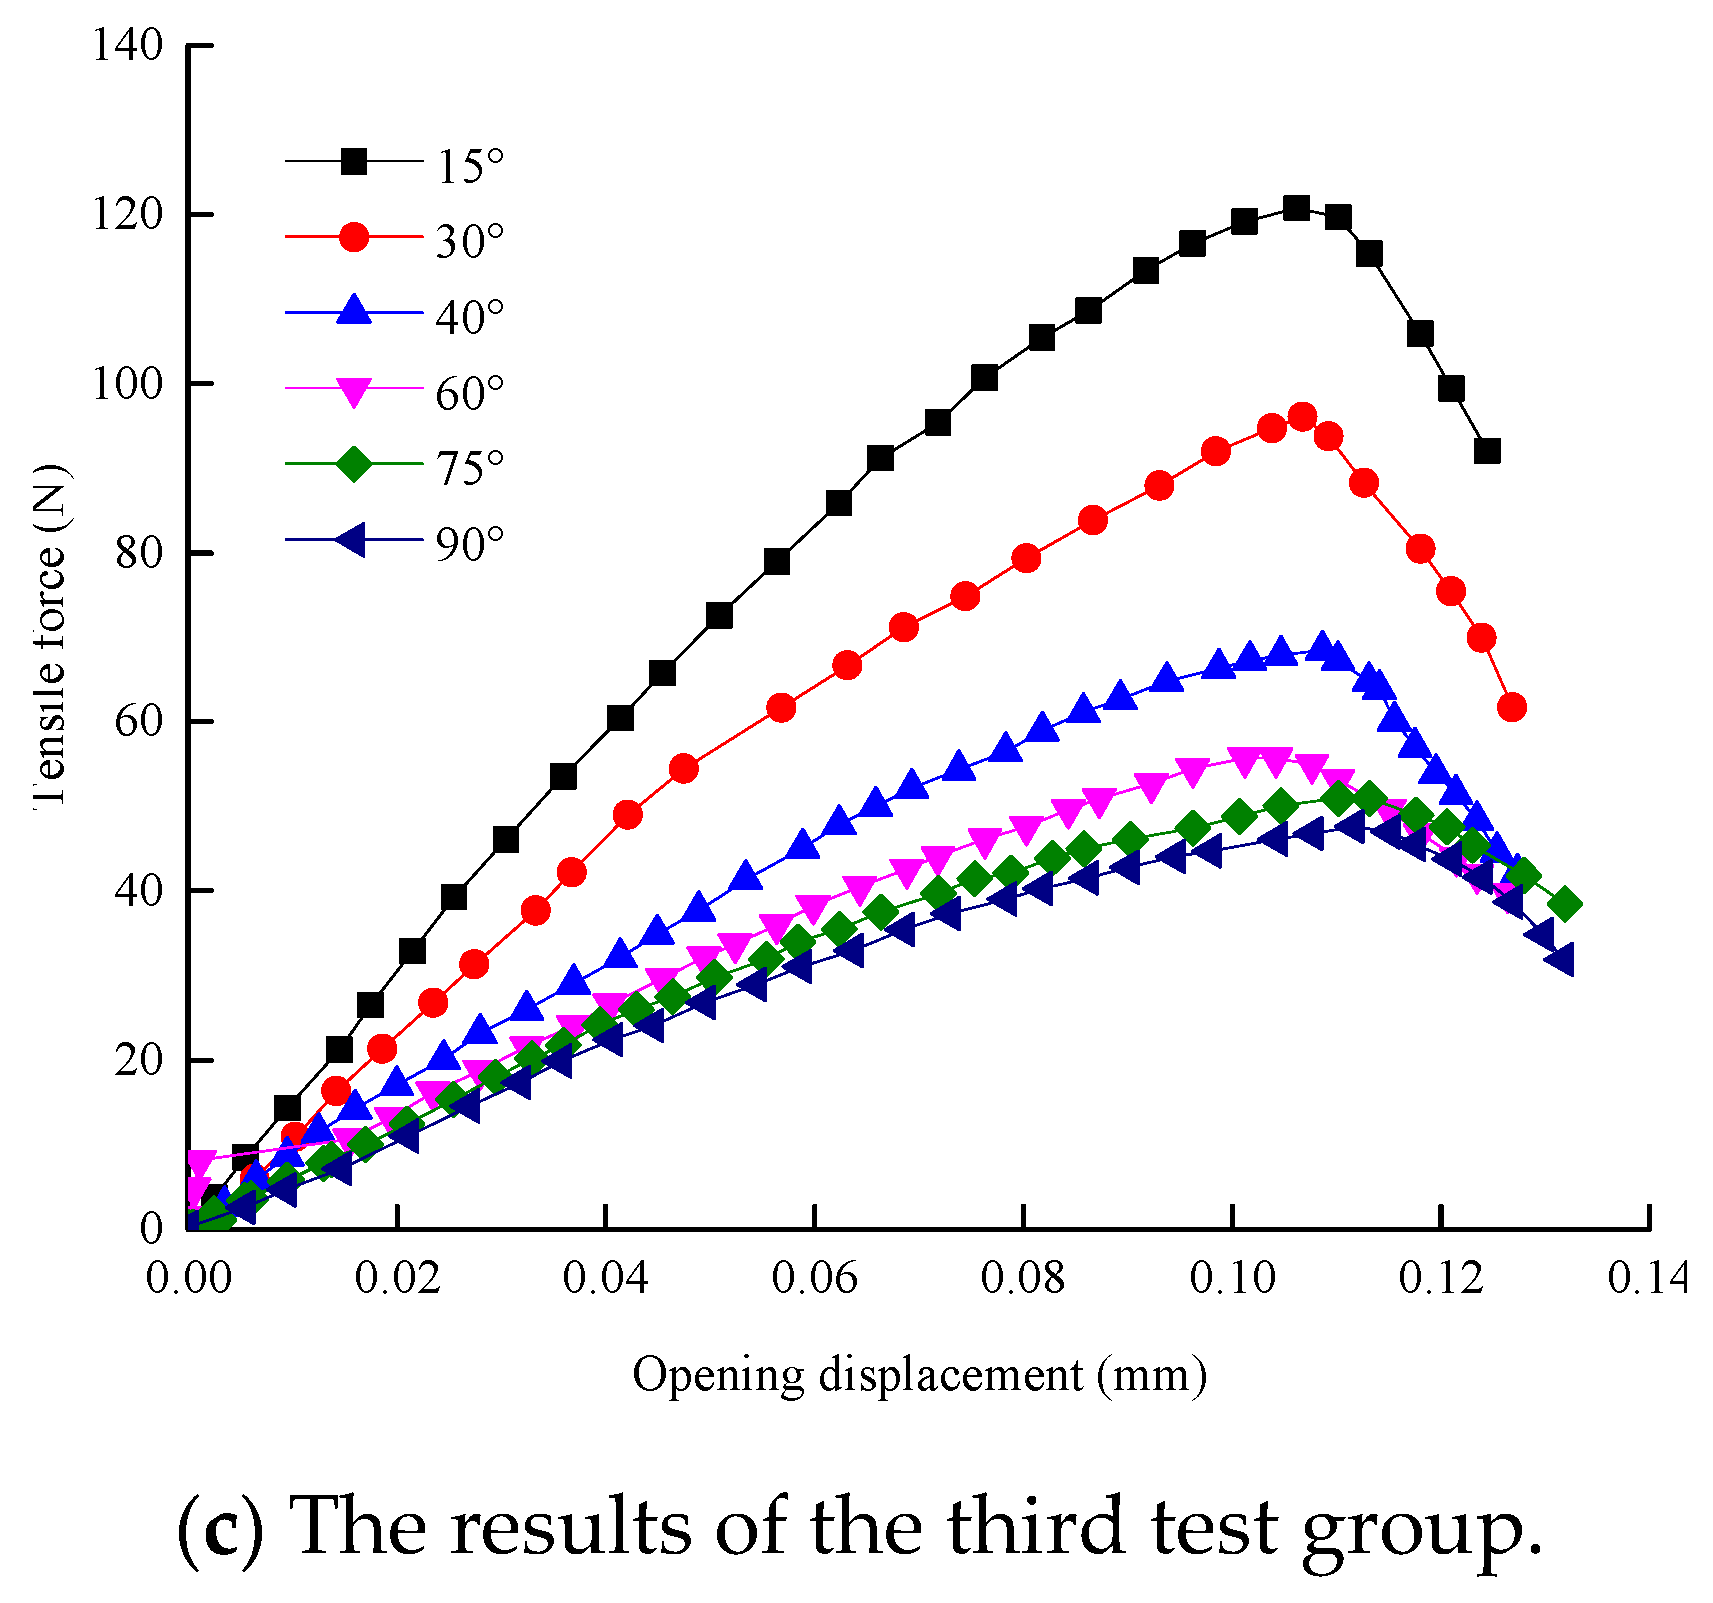
The peeling test system was used to load the interface peeling test, which includes loading equipment, data collection equipment, and test specimen fixing equipment, and the test conditions are shown in Figure 4.
The test specimens mainly consisted of polyurea-based coating and concrete, which were bonded together by a bonding layer, and their size is 80 mm × 20 mm × 2 mm. During the test, the pasted test specimen is fixed to the test frame, and the open loading system is loaded at a loading rate of 0.002 mm/s, until the interface is peeled off and destroyed. The data collection device records the load time and displacement time during the test.
In addition, the influence of the debonding angle, i.e., the angle between the interface and the horizontal plane of the debonding failure of the interface, is also discussed by adjusting the angle of the peeling interface. The test includes a total of six peeling interface angles: 15°, 30°, 45°, 60°, 75°, and 90°. Since the interface between the polyurea-based coating and concrete is artificially bonded, the interface bonding strength is discrete, so each group of tests was performed in three sets of parallel tests.

3.1.2. Test Results

The relationship between the tensile force and opening displacement of the debonding interface is shown in Figure 5. It can be found that the curves of the three sets of test results are basically the same and can be divided into three stages; first, under the action of the tensile force, the displacement of the interfacial adhesion layer begins to produce and change linearly with tensile force; subsequently, with increases of tensile force, the deformation of the bonding layer reaches a certain degree, resulting in irreversible plastic deformation, and the loading of the interface reaches a maximum at this stage; in the final stage, when the tensile force exceeds the tensile strength of the bonding layer, the polyurea-based coating is completely separated from the concrete, and a sudden drop in the tensile stress value in the curves occurs.
Under different debonding angle conditions, the opening displacements of the interface, which are completely separated between the polyurea-based coating and concrete, are basically the same, at about 0.11 mm. Since the tensile force is also small in the debonding direction of the interface when the debonding angle is small, a larger load is required to cause separated damage at the interface. When the debonding angle is between 75° and 90°, the tensile force of the debonding failure is basically the same; when the peeling angle is between 15° and 75°, the tensile force of the debonding failure decreases with the increase of the debonding angle.

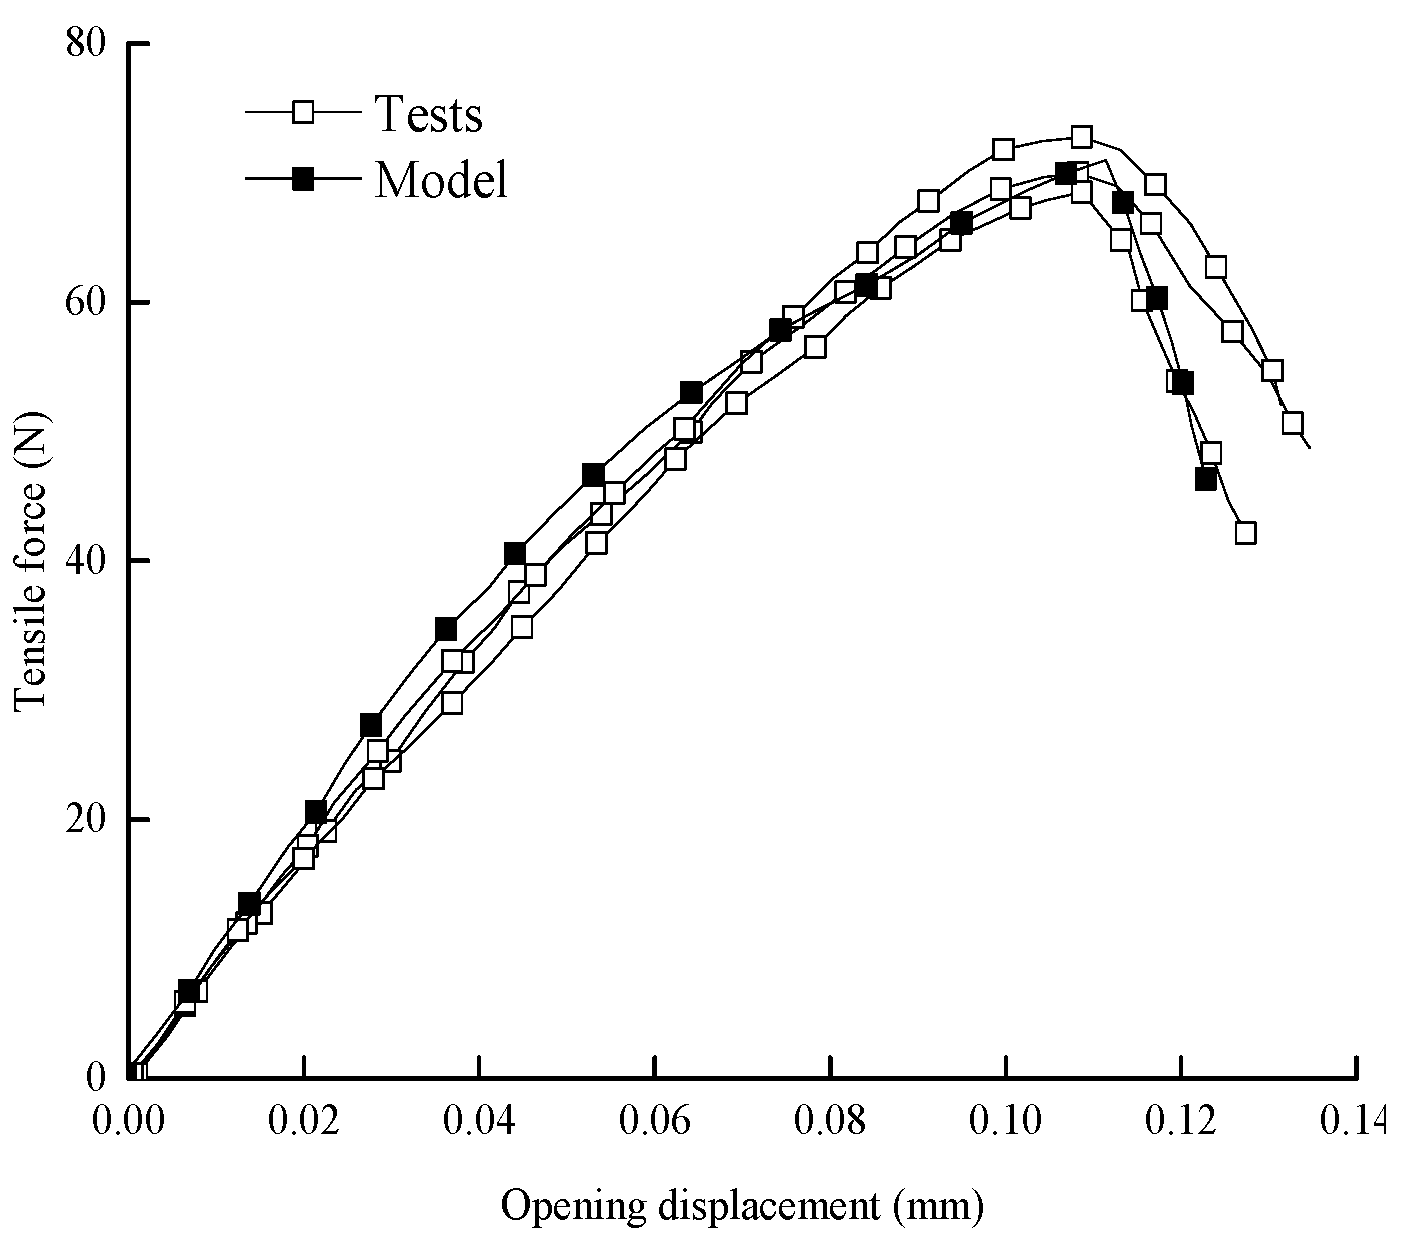
3.2. Model Verification

Under the action of a high-velocity water flow, the direction of the drag force and impact force is parallel to the polyurea-based coating, while the direction of the fluctuating pressure and lifting force is perpendicular to the polyurea-based coating. The direction of the resultant force is oblique upward, and the stress characteristics of the polyurea-based coating under the action of the high-velocity water flow are the same as those of the polyurea-based coating in the debonding test. Therefore, the established model was used to describe the debonding tests to verify the feasibility of the model.
A numerical model was established according to the experiment, which includes the concrete floor and polyurea-based coating, as shown in Figure 6. The behavior of the polyurea-based coating and concrete and the solid and cohesive elements of the debonding failure characteristics of the interface are described. In order to implement the debonding failure of the interface, the selected velocity of the flow is 30 m/s. The drag force, impact force, fluctuating pressure, and lifting force were calculated to be 40.5 kN, 30 kN, 23.23 kPa, and 36 kN, respectively, according to the formulas of each loading in Section 2.1, and the peeling angle is 40°.
The constitutive relationships of concrete and polyurea-based coating are described by the elastic deformation model, and the elastic modulus and Poisson’s ratio of them are 32.5 GPa and 0.2, 49.5 MPa, and 0.37, respectively. It can be seen from the test that, when the peeling inclination angle is 90°, the load at the interface failure is basically the strength of the bonding layer, at about 50 N, and the tensile strength of the bonding layer is calculated as follows:
τ = F A
where F is the tensile force at the time of the interface failure, A is the force area, and the length and width of the polyurea-based coating are 2 cm and 1 mm, respectively, so the tensile strength of the bonding layer τ = 50   N 2 × 10 2   m × 1 × 10 3 m = 2.5 MPa.
According to the generalized definition of fracture energy, the value is calculated to be about 125 J/m2, based on the curve of the tensile stress and opening displacement. The selected normal and tangential stiffness [36] were 1 × 10¹³ Pa/m and 1 × 10¹² Pa/m, respectively. The second nominal stress criterion and B‒K criterion were adopted as the criterion of damage initiation and evolution principles.
The vertices at the end of the polyurea-based coating in the finite element model are selected as the monitoring points of load displacement, and a comparison of the model and tests results is shown in Figure 7. The experimental and numerical calculation results are basically consistent, and the feasibility of the established model in describing the debonding failure of the interface under the action of a high-velocity water flow is verified. The model has been adopted to analyze the effect of the anchoring pattern, mechanical parameters of the polyurea-based coating, and the bonding layer on the debonding failure of the interface.

4. Numerical Calculation of the Anchored Polyurea-Based Coating under a High-Velocity Water Flow

Based on the established debonding failure model, the impact resistances under different anchoring conditions were analyzed, and the influence of the elastic modulus and Poisson’s ratio of the polyurea-based coating, and the fracture energy of the bonding layer material, on the impact were also studied, which provides a theory reference for the rational and economic impact design.

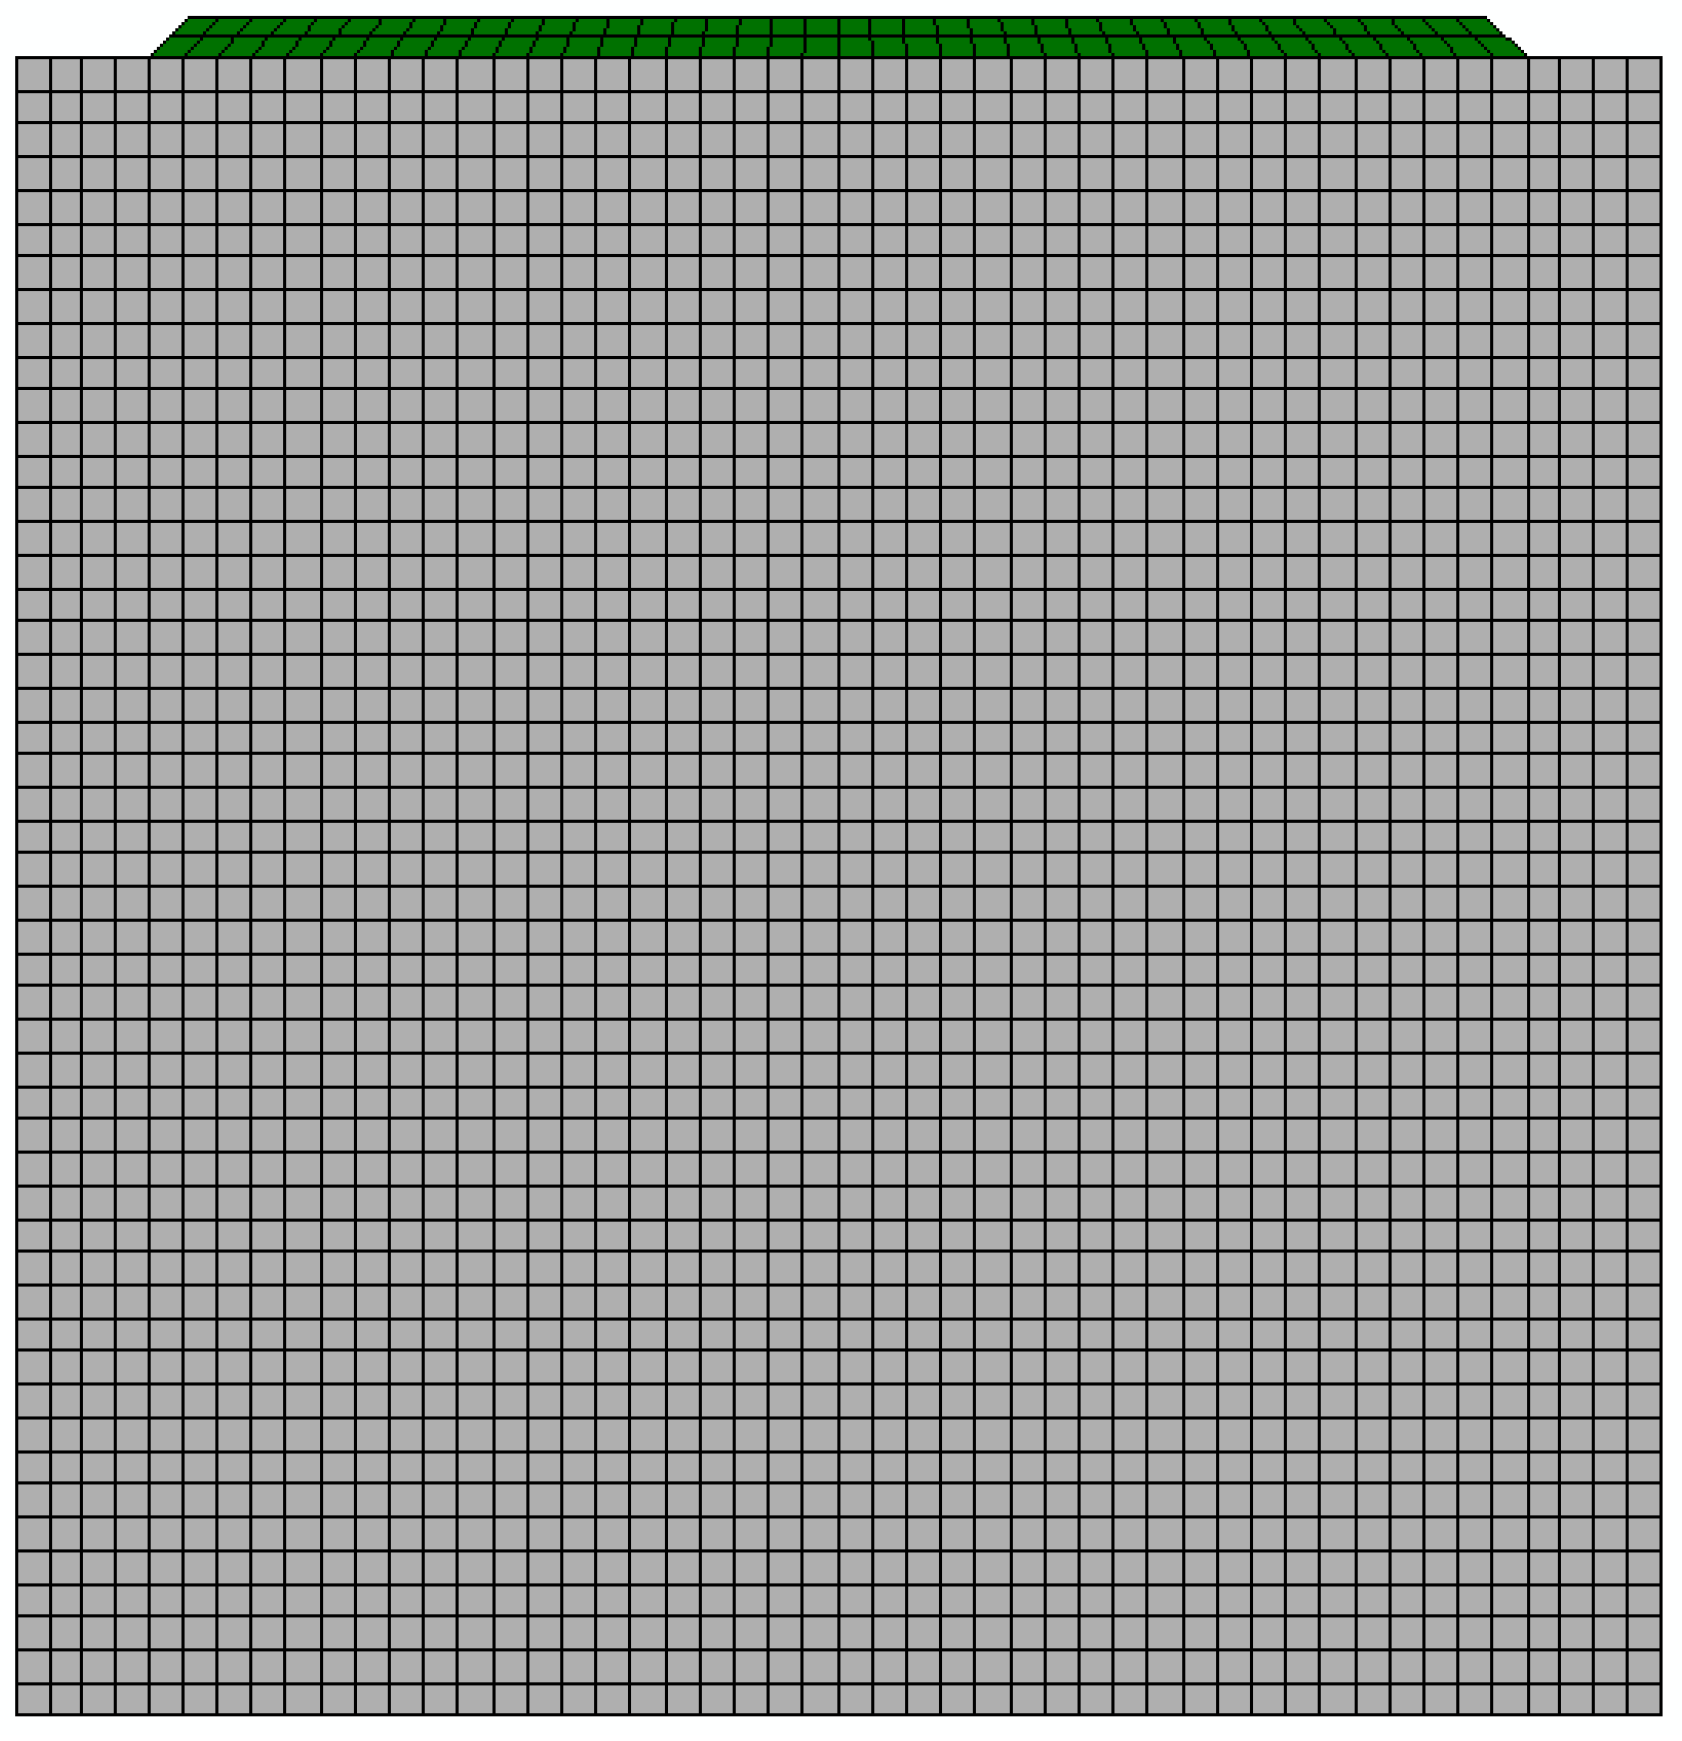
4.1. Numerical Model
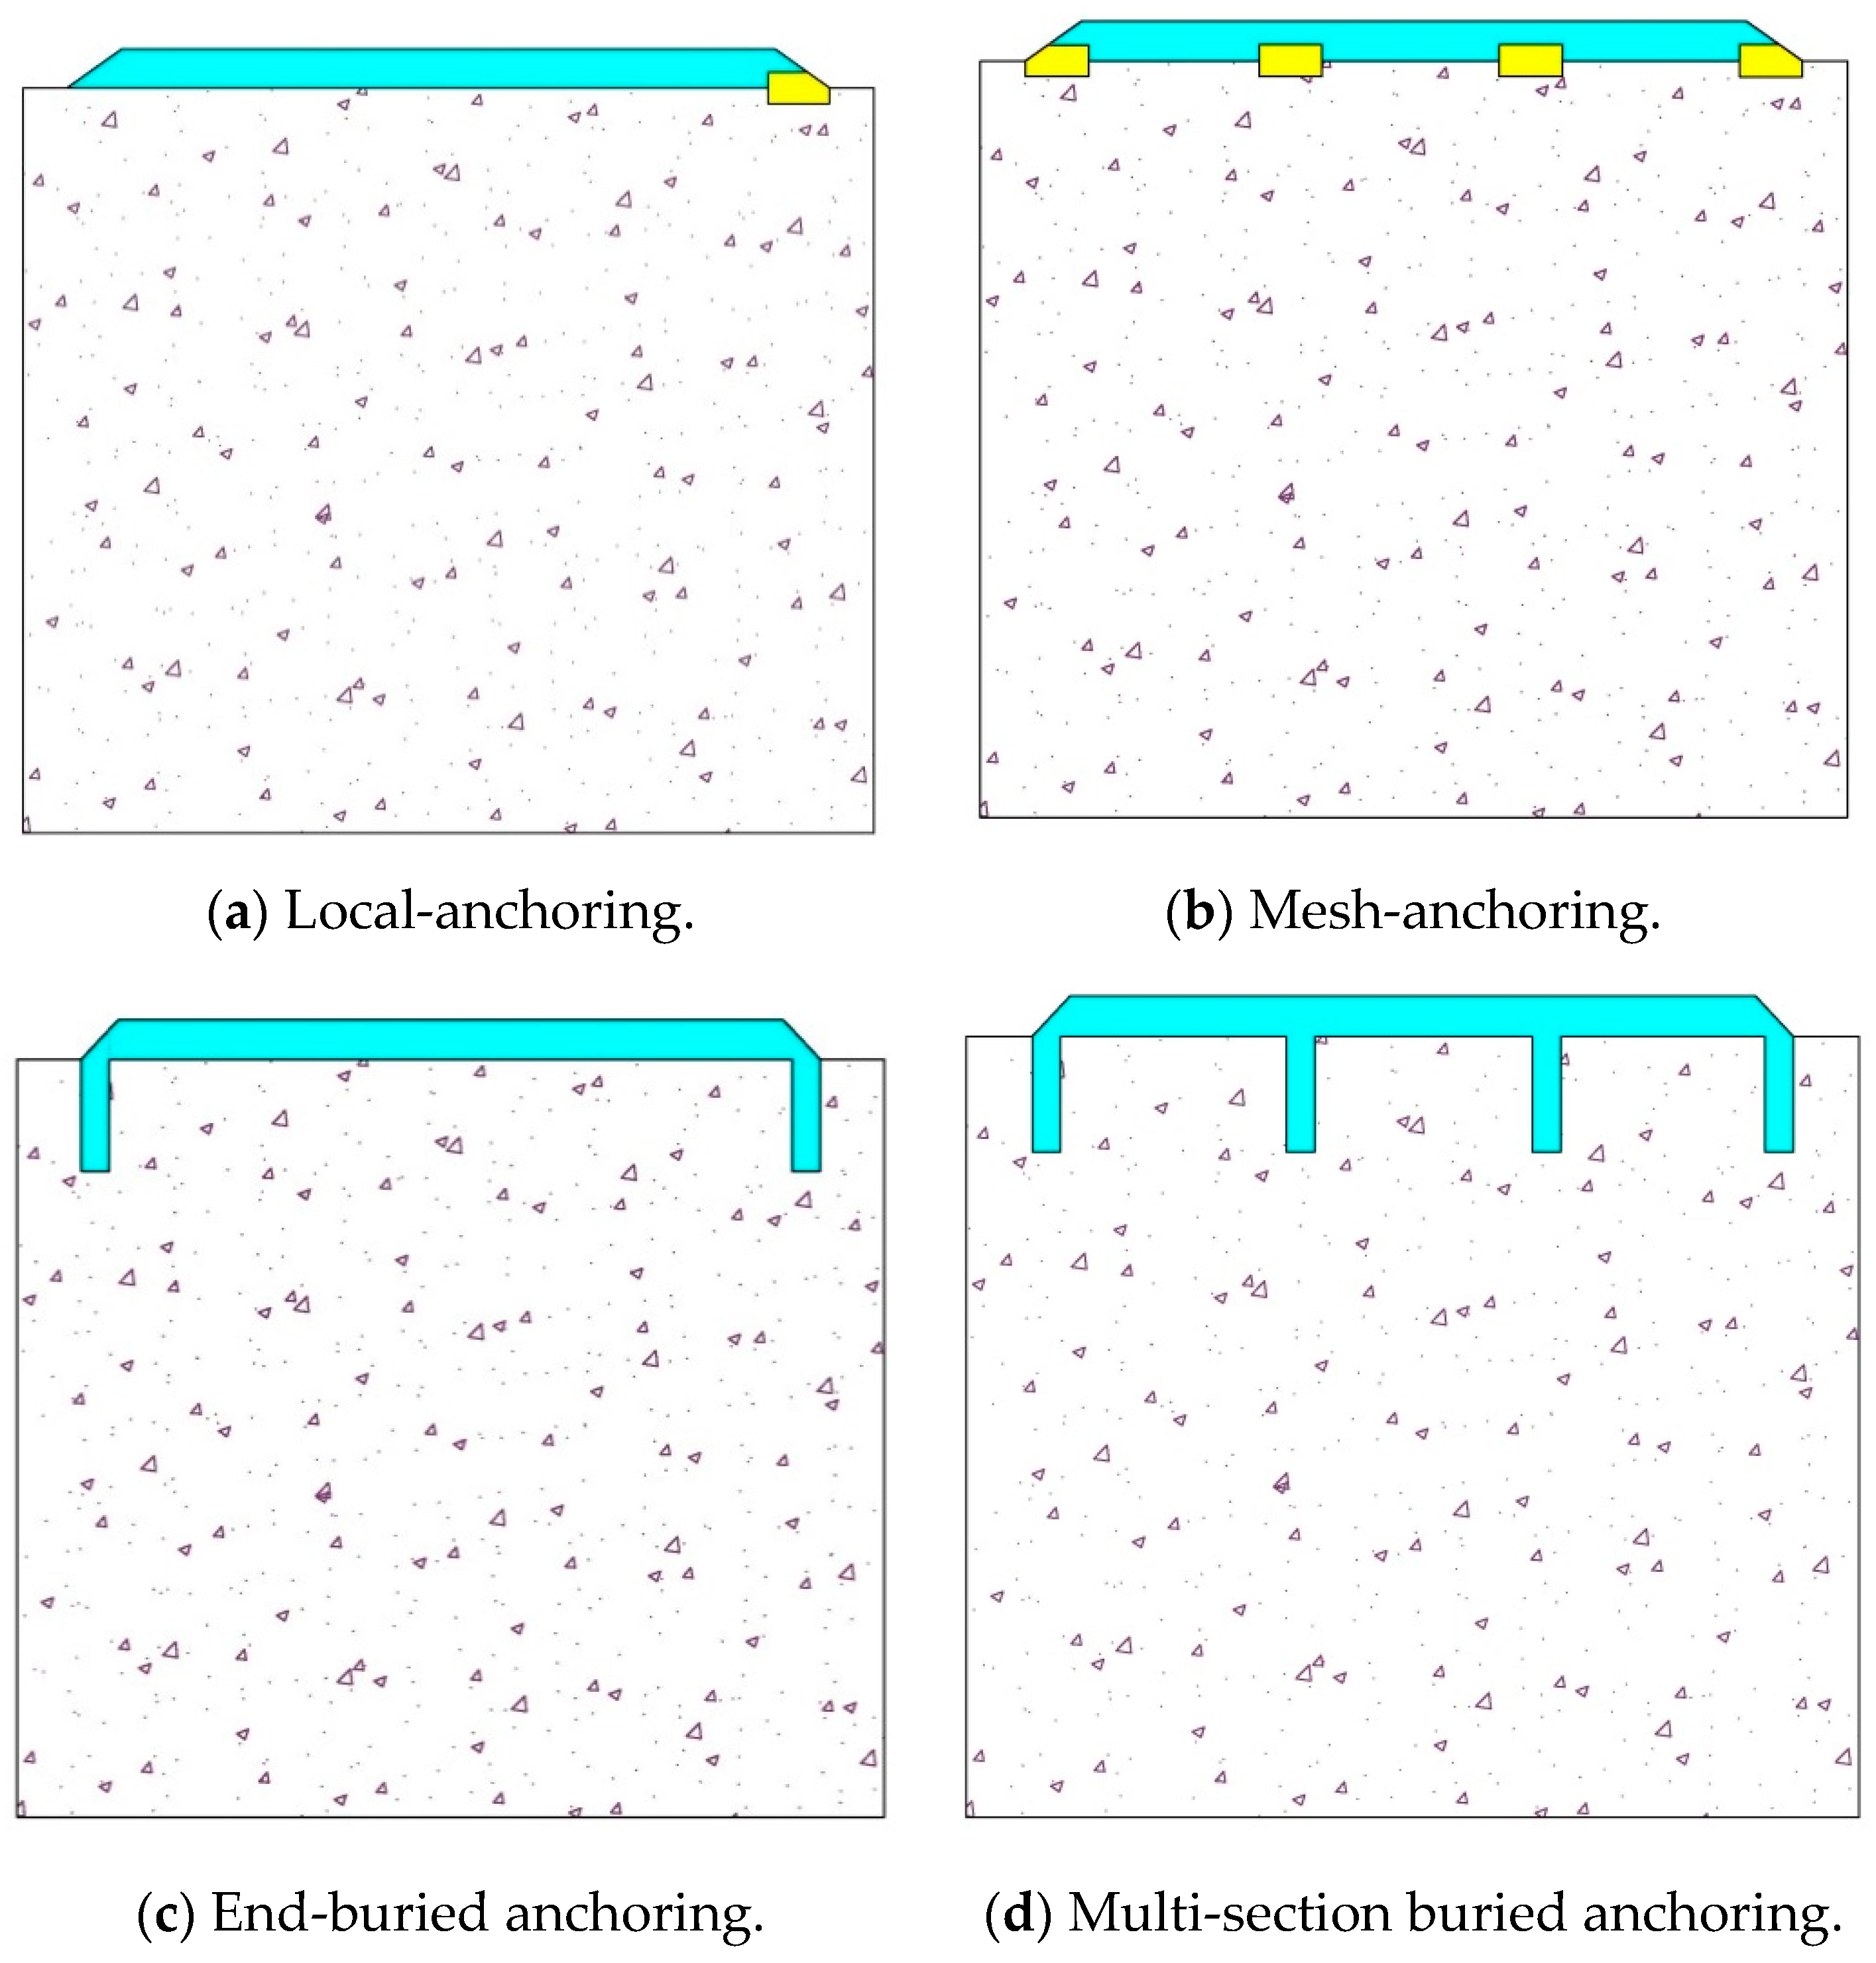
A two-dimensional simulation model was established based on the flood discharge infrastructure of Xiluodu Hydropower Station. The model consists of two parts: a concrete floor and a polyurea-based coating, as shown in Figure 8. The size of the concrete floor is 100 mm × 100 mm and 86 mm, and the thickness of the polyurea-based coating is 2 mm. The model includes 2520 solid elements and 86 COH2D4 cohesive elements, and the displacement constraints in the vertical and horizontal directions are imposed on the concrete floor.

4.2. Case Studies

Debonding failure may occur between the polyurea-based coating and the flood discharge infrastructure under the action of water flow, especially in the case of a high-velocity water flow, and the anchored measures will usually be adopted in such cases. Based on the model established above, the anti-wear properties of the anchoring types of Local-anchoring, Mesh-anchoring, End-buried anchoring, and Multi-section anchoring were studied, the details of which are as follows:
Case 1 (Local-anchoring): Partial anchoring strengthens the bonding by layering a steel mesh at the end of the polyurea-based coating to enhance the bonding strength (tensile strength: 3.5   MPa ), as shown in Figure 9a.
Case 2 (Mesh-anchoring): Mesh-anchoring layers a steel mesh at a certain interval of the polyurea-based coating to enhance the cohesive strength (tensile strength: 3.5   MPa ), as shown in Figure 9b.
Case 3 (End-buried anchoring): The polyurea-based coating at the end (about 2 cm) is embedded into concrete to improve the impact resistance of the polyurea-based coating, as shown in Figure 9c.
Case 4 (Multi-section buried anchoring): Multi-segment anchoring embeds the polyurea-based coating into the concrete at a certain distance, as shown in Figure 9d.
Although the measure of anchoring can improve the impact resistance of the polyurea-based coating, it also increases the difficulty and expenditure of construction. Since the properties of polyurea-based coating materials have significant effects on the debonding performance of the interface, the effects of the elastic modulus and Poisson’s ratio of polyurea-based coating materials was studied by the model, without anchoring. In the study of the elastic modulus, there are seven cases, and the elastic modulus of them are 1 MPa, 10 MPa, 25 MPa, 49.5 MPa, 75 MPa, 100 MPa, and 200 MPa. In the study of the Poisson’s ratio, there are nine cases, and the Poisson’s ratio is 0.15, 0.2, 0.25, 0.3, 0.35, 0.37, 0.4, 0.45, and 0.5. In addition, the mechanical properties of the coating have an important influence on the peeling of the polyurea-based coating. Therefore, the influence of the coating fracture energy parameters on the impact resistance of polyurea-based coating materials was also studied. There are eight cases, and the elastic modulus is 25 J/m2, 50 J/m2, 75 J/m2, 100 J/m2, 125 J/m2, 150 J/m2, 200 J/m2, and 275 J/m2.

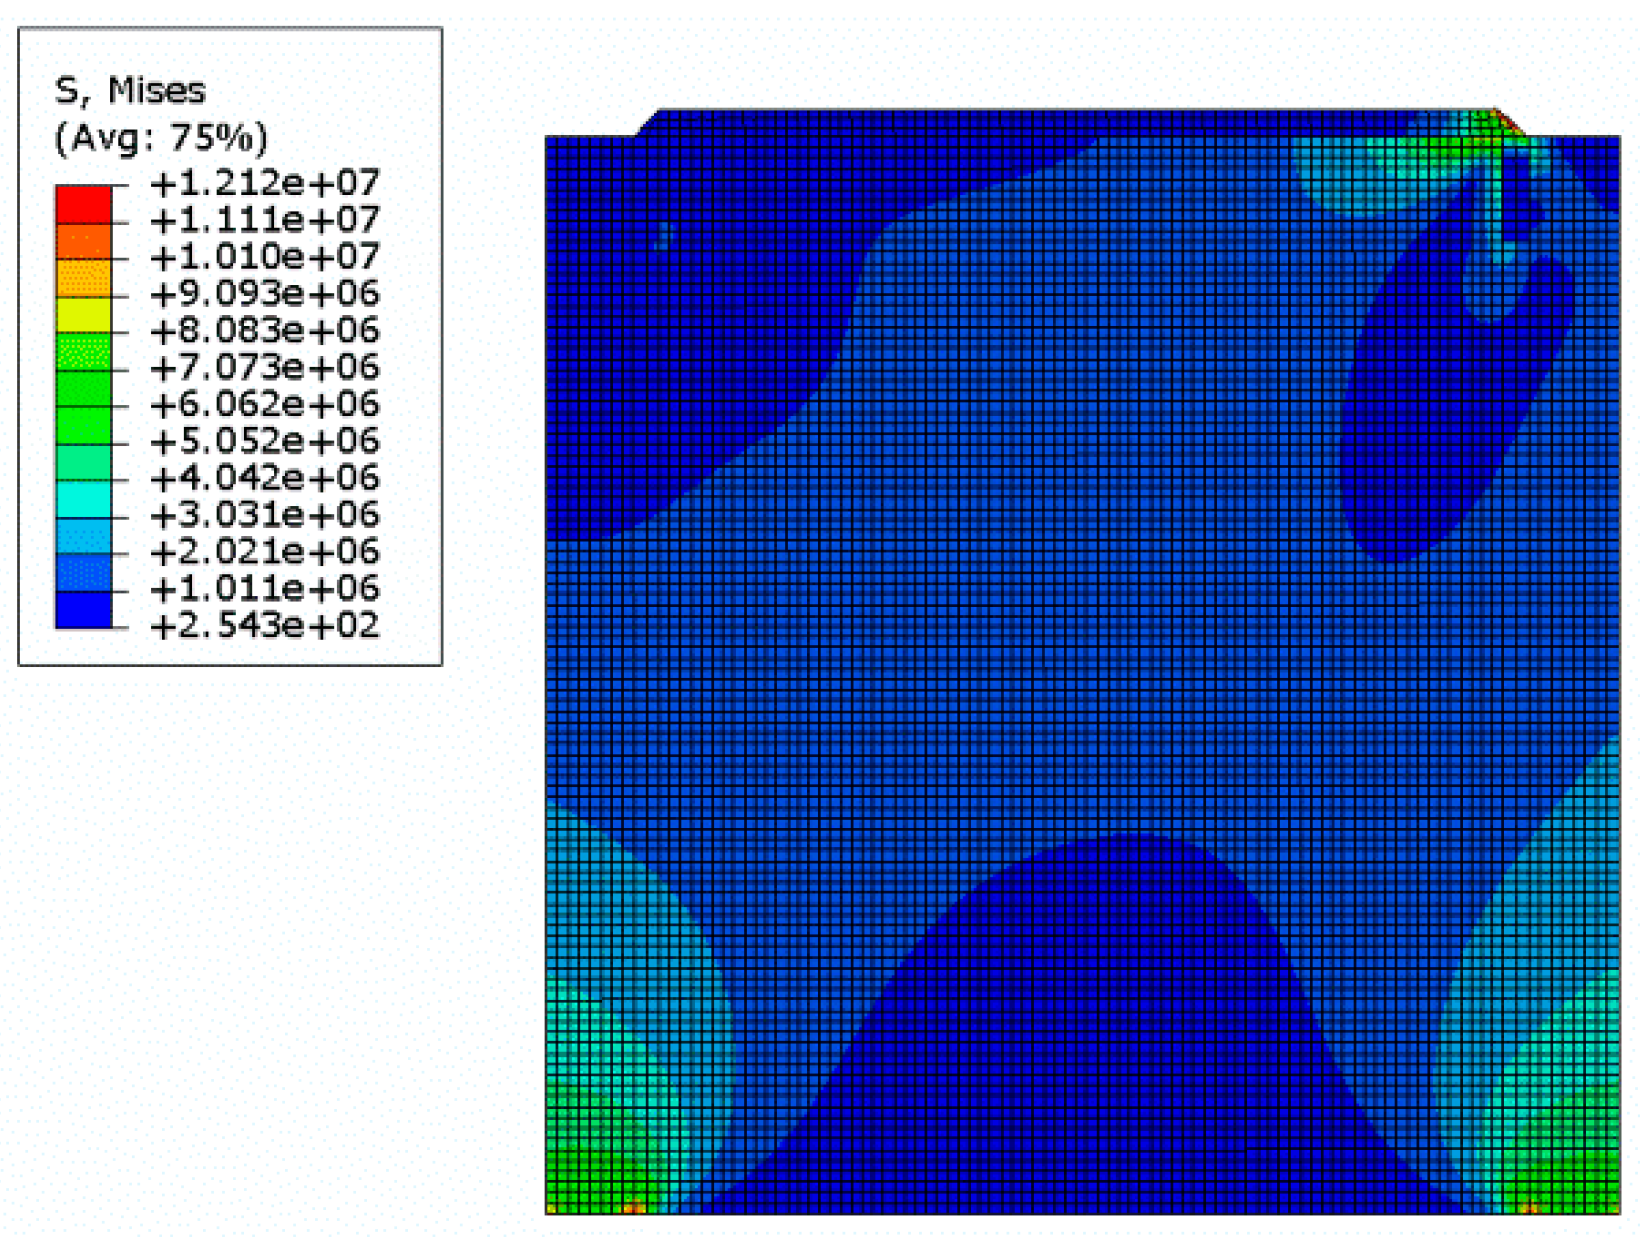
4.3. Results and Discussion

Through the high-velocity water flow debonding failure model, the impact resistances of polyurea-based coatings under different anchoring conditions were analyzed, and the sensitivity of polyurea-based material parameters and bonding material parameters were also studied. The results can provide a reference for the anti-shock and wear-resistant design of flood discharge infrastructure.

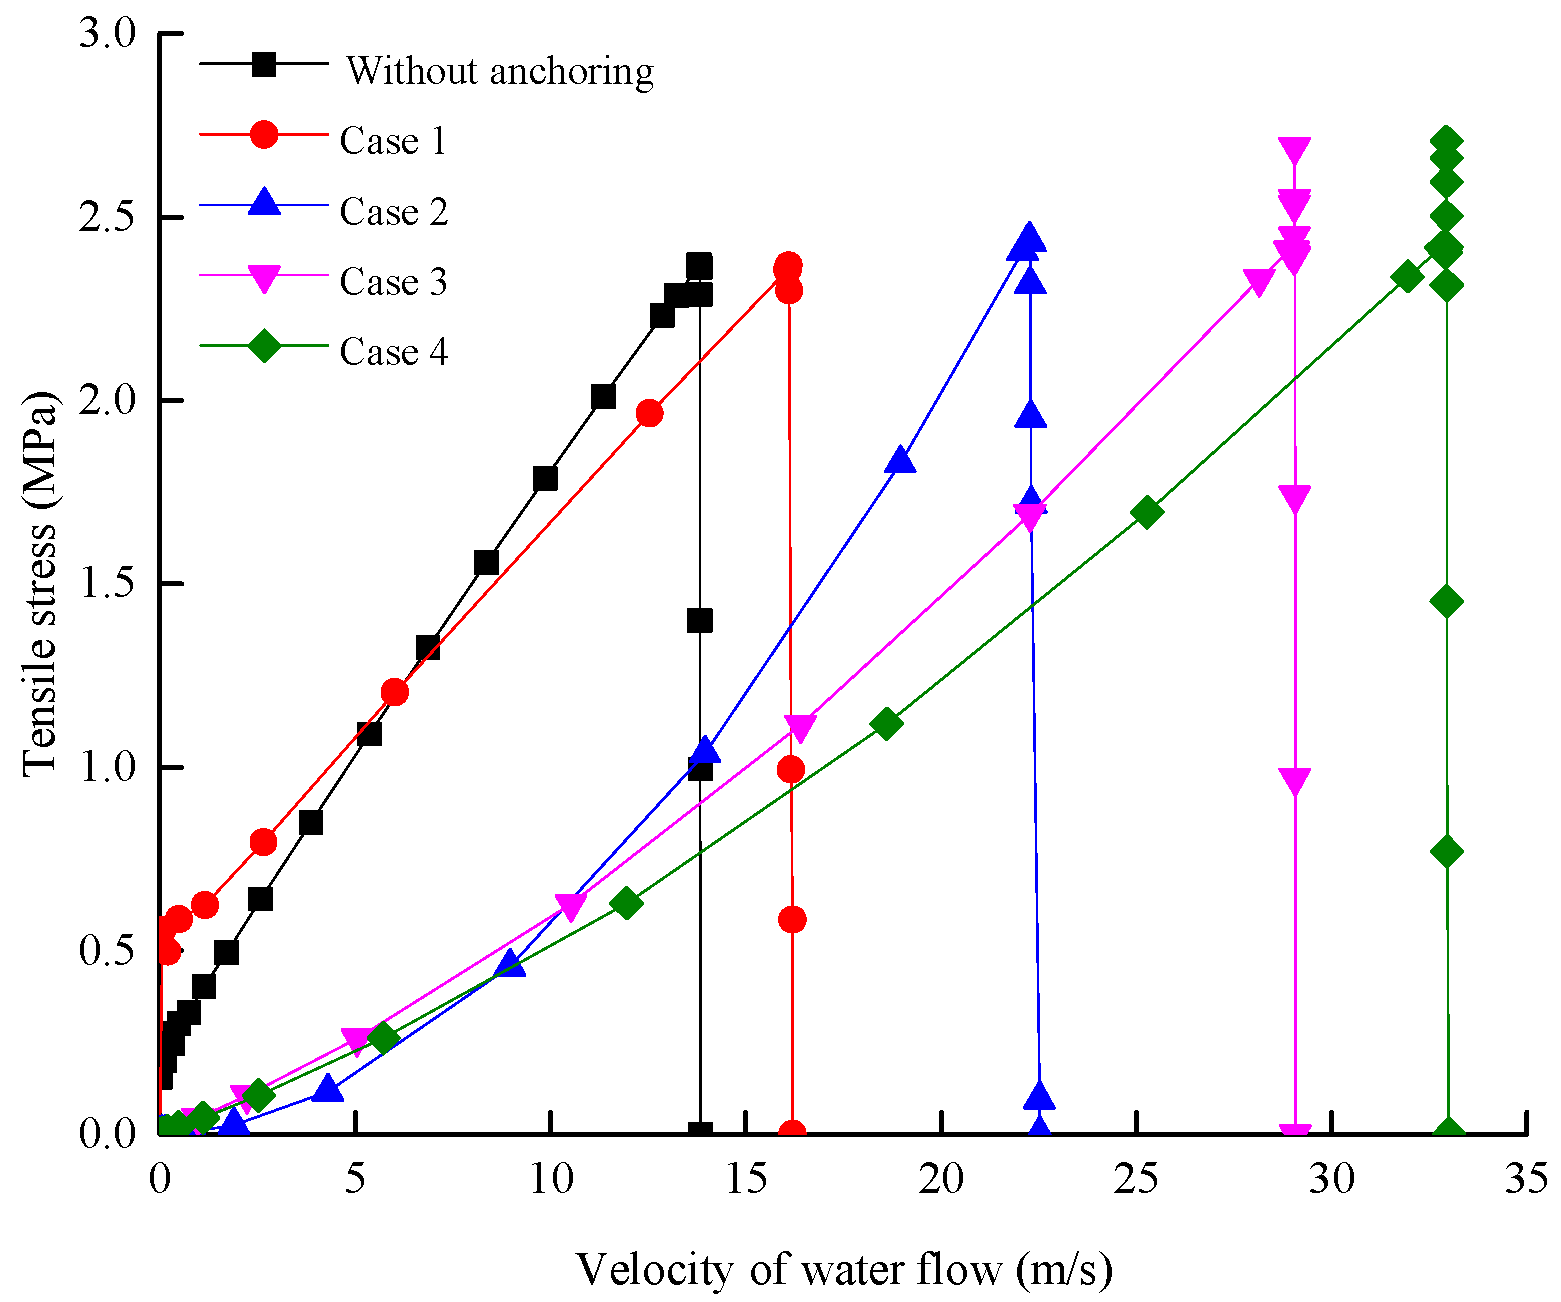
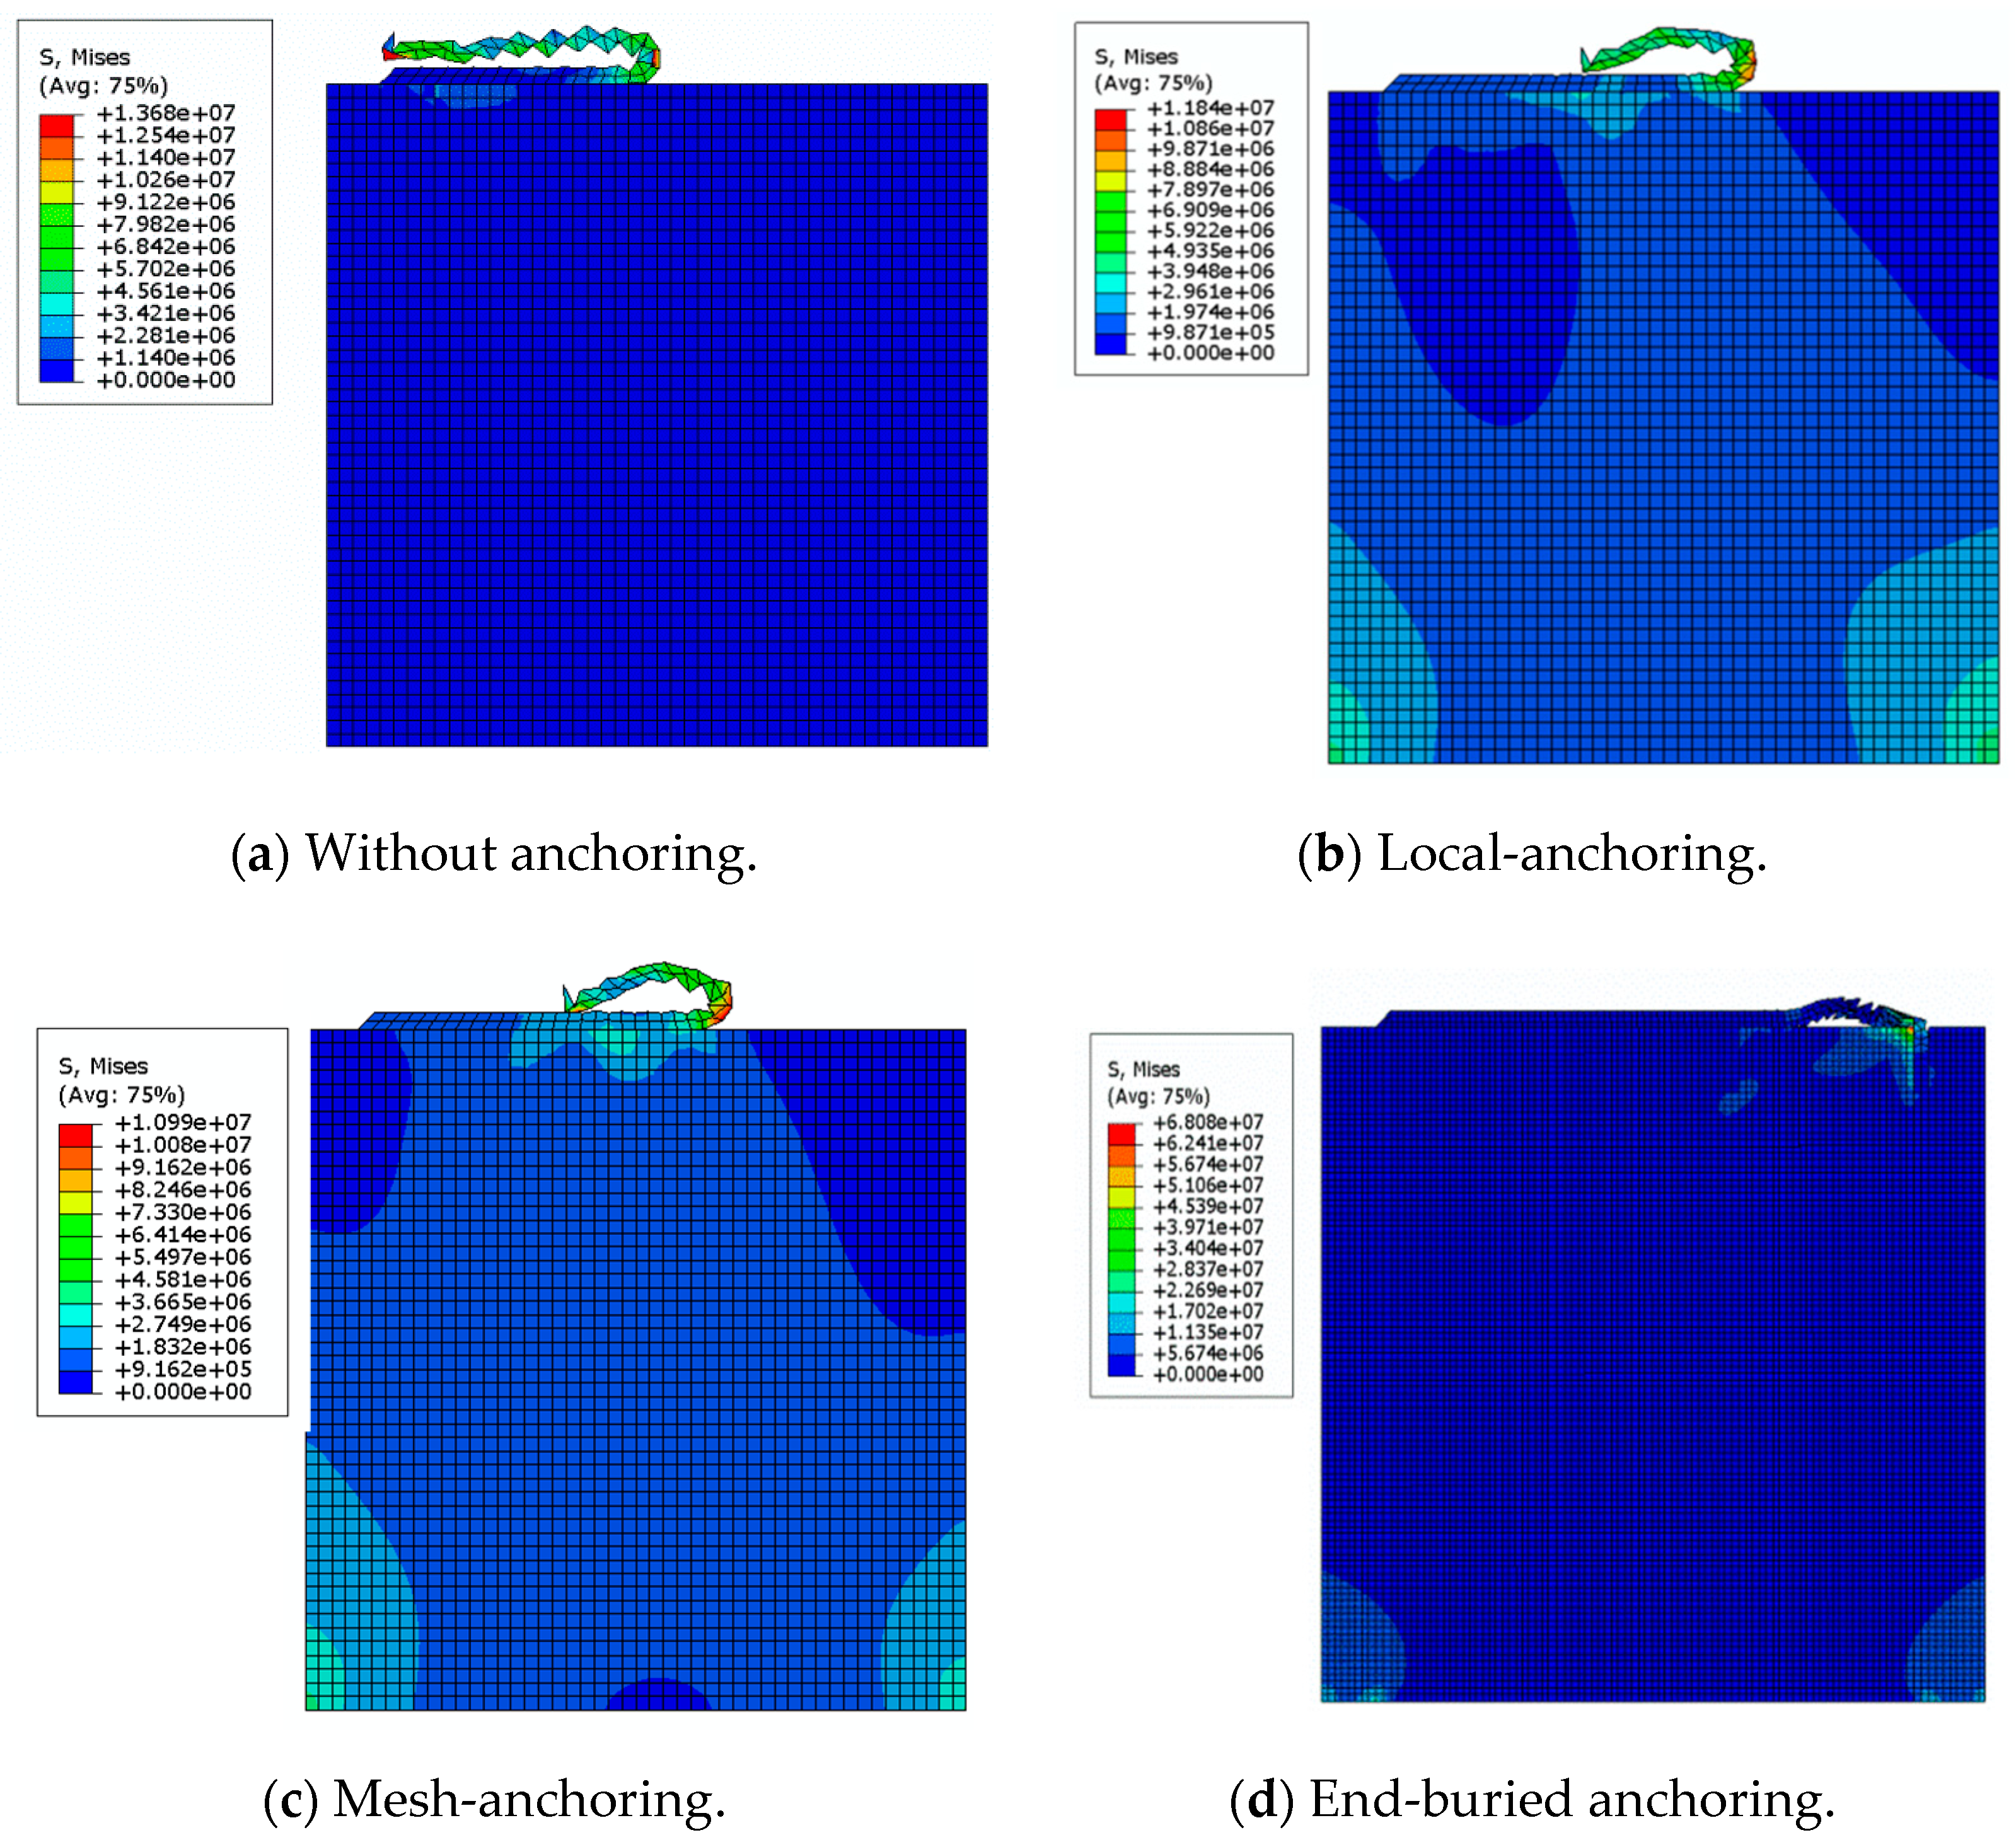
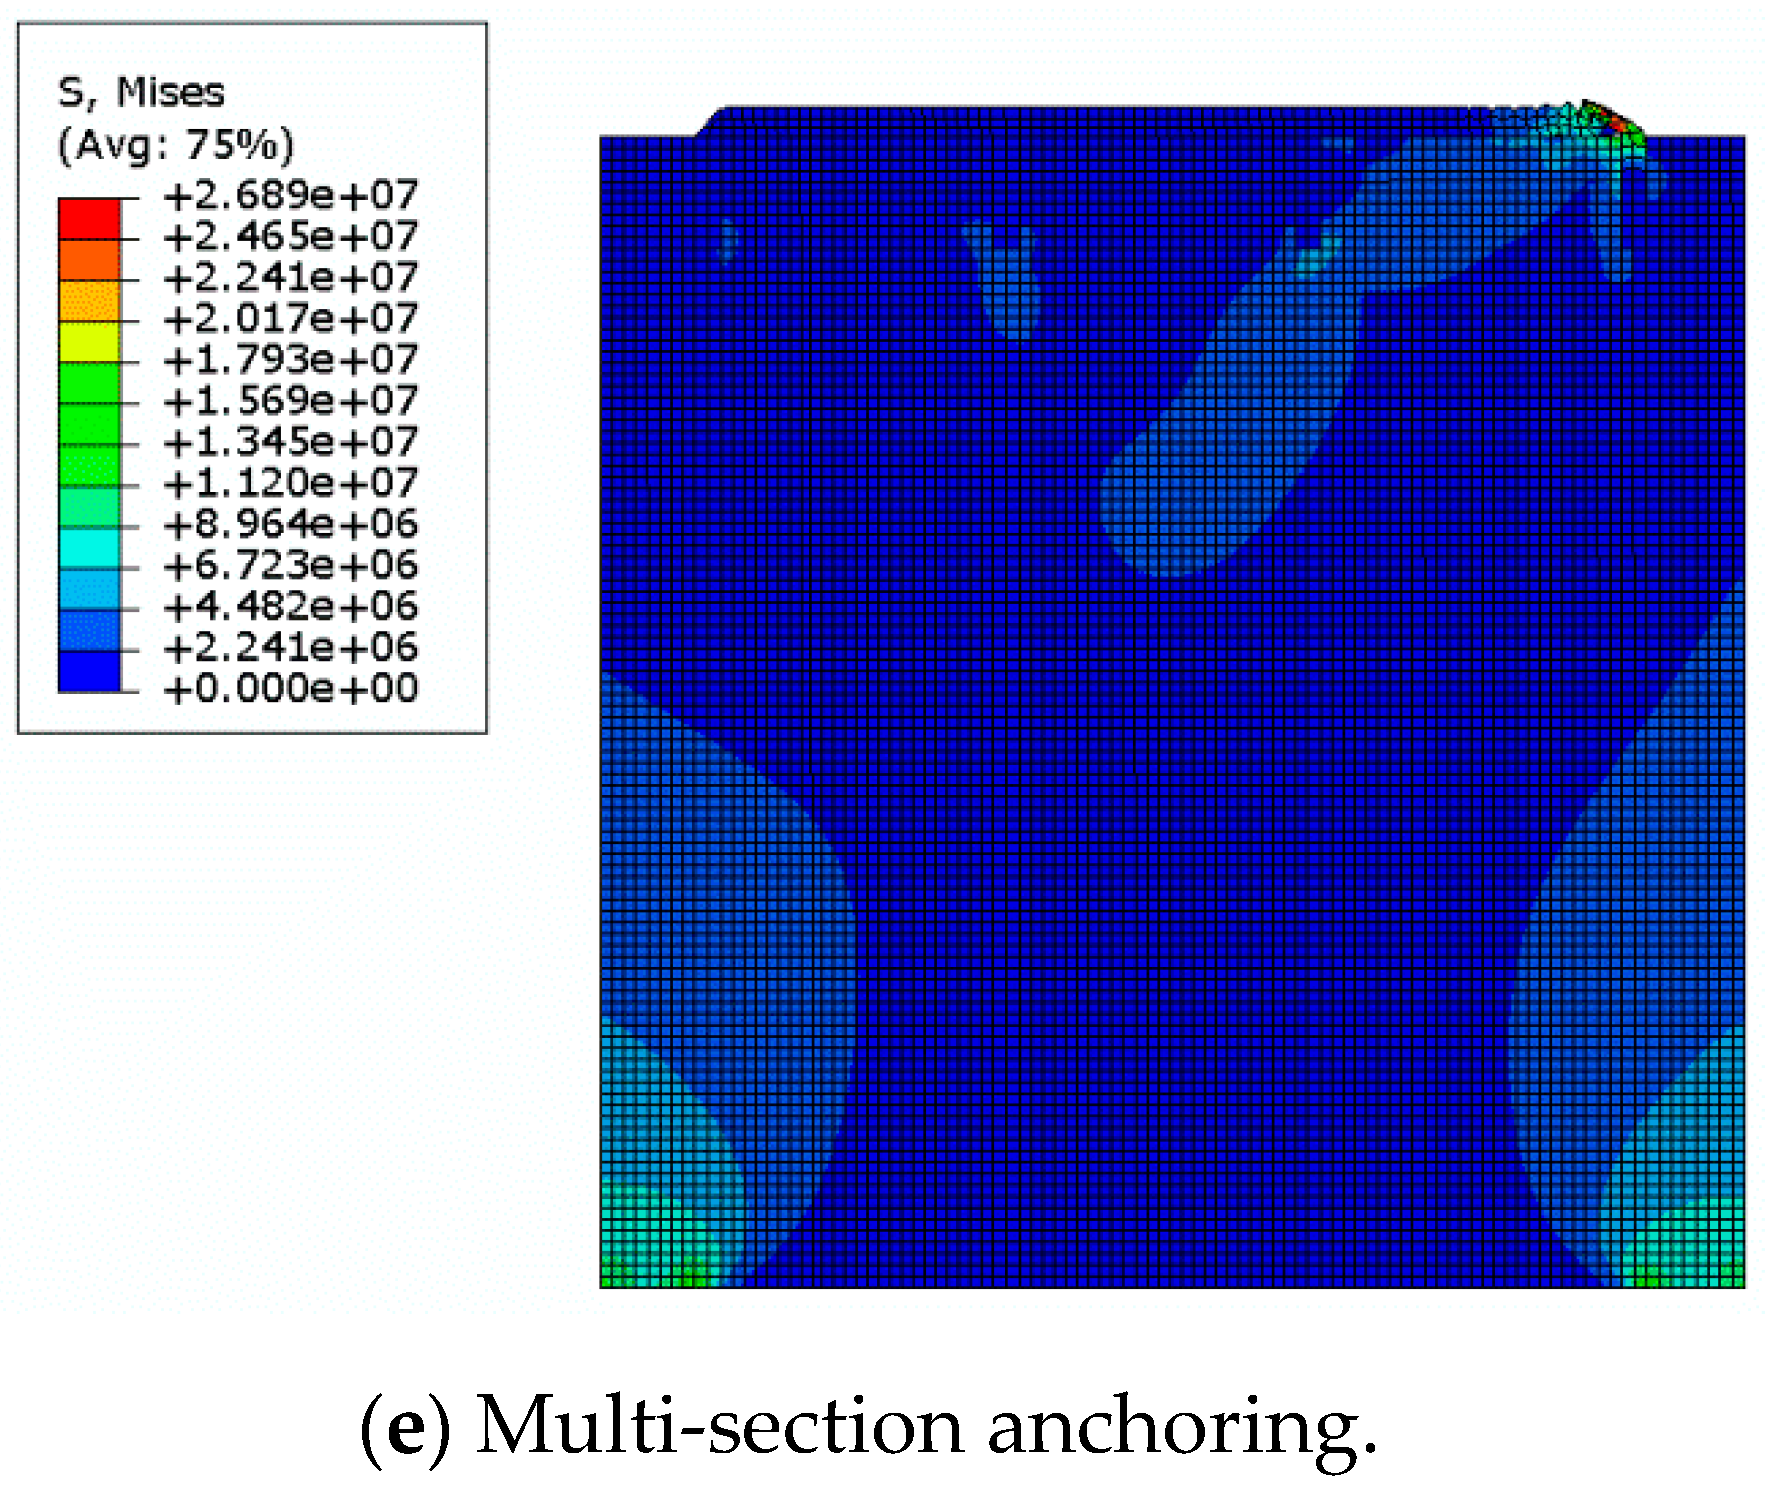
4.3.1. Impact Resistance with Different Anchoring Types

Under the action of a high-velocity water flow, when the water flow force exceeds the cohesive strength between the polyurea-based coating and the concrete (the tensile strength of the interlayer coating), the polyurea-based coating and the concrete will be peeled off. The stress of the monitoring point at the end of the polyurea-based coating is shown in Figure 10, and it can be seen that the tensile stress first increases with the increase of the velocity of the water flow. When the shearing action exceeds the cohesion between the polyurea-based coating and the flood discharge infrastructure, debonding is generated, and the expression of the relationship between the velocity of the water flow and the tensile stress is a sudden decrease of the stress value.
Comparing the different anchoring conditions, it can be found that, when the polyurea-based coating is not anchored, the flow velocity of the debonding failure is about 13.8 m/s, which is sufficient to resist the minimum velocity water flow. After the end of the polyurea-based coating is partially anchored, the impact resistance of the polyurea-based coating is improved, and the flow velocity of the debonding failure is about 16.2 m/s. When the measures of Mesh-anchoring, End-buried anchoring, and Multi-section anchoring are adopted, the impact resistance of the polyurea-based coating is significantly improved, and the flow velocity of the debonding failure is 22.5 m/s, 29.1 m/s, and 33 m/s, respectively.
In addition, when the polyurea-based coating is not anchored, Local-anchored or Mesh-anchored, once the end of the polyurea-based coating begins to peel off, the polyurea-based coating will exhibit a large area of peeling along the direction of the water flow (Figure 11a–c). When the polyurea-based coating is embedded in the concrete, the polyurea-based coating peels off at a partially edge position, but is not pulled off completely (Figure 11d–e), and the impact resistance is significantly improved. Different anchoring types can be used to improve the impact resistance so that it can meet the impact requirements in the most economical and reasonable way.

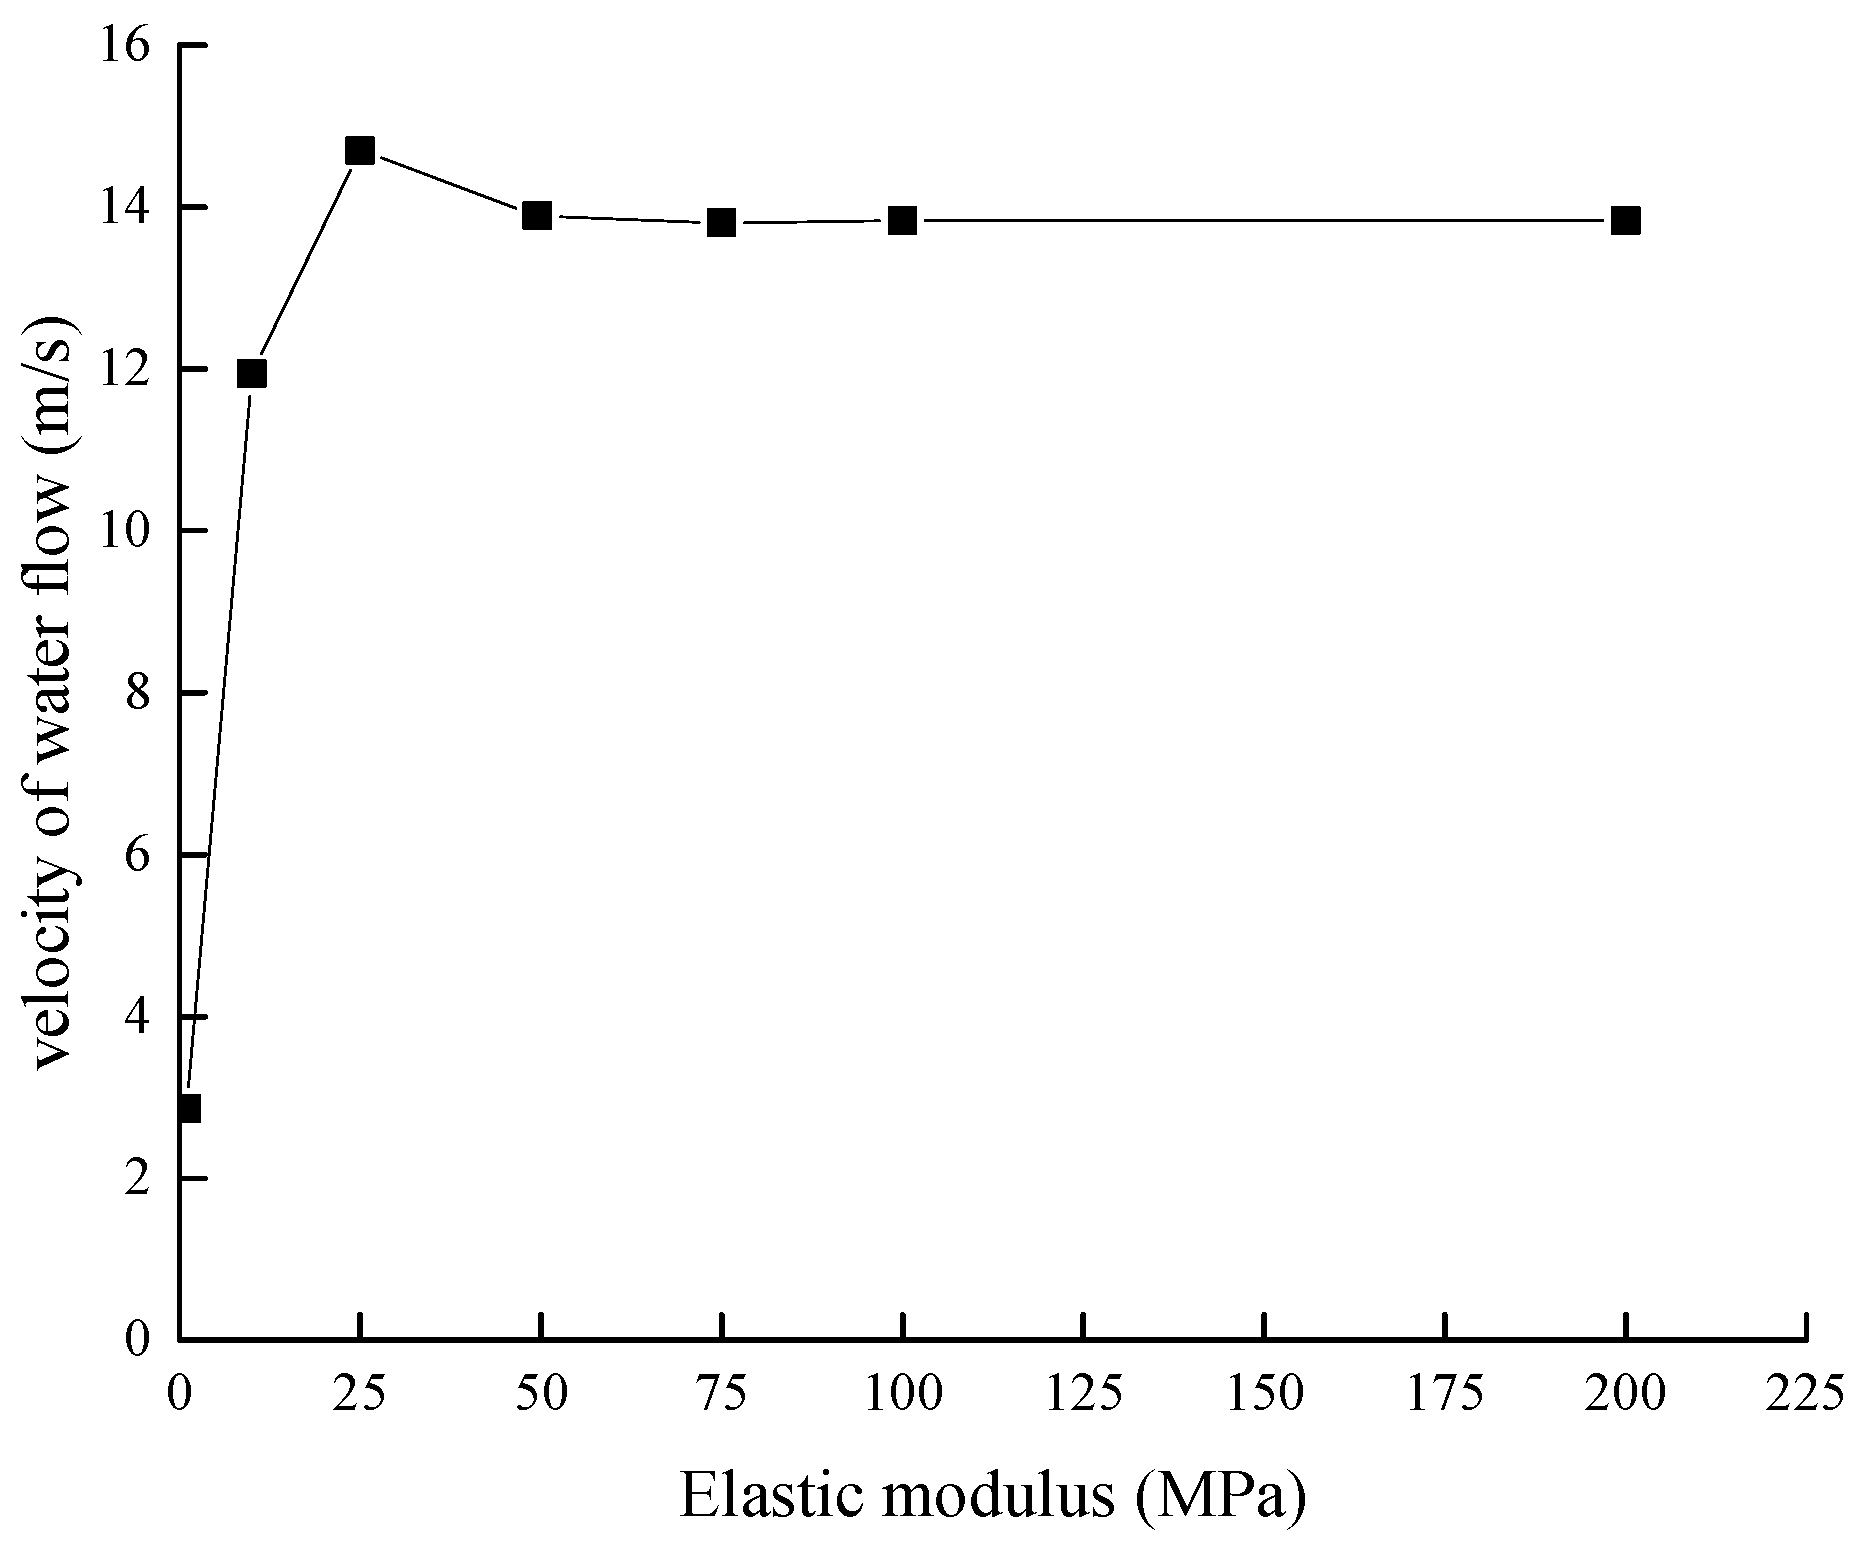
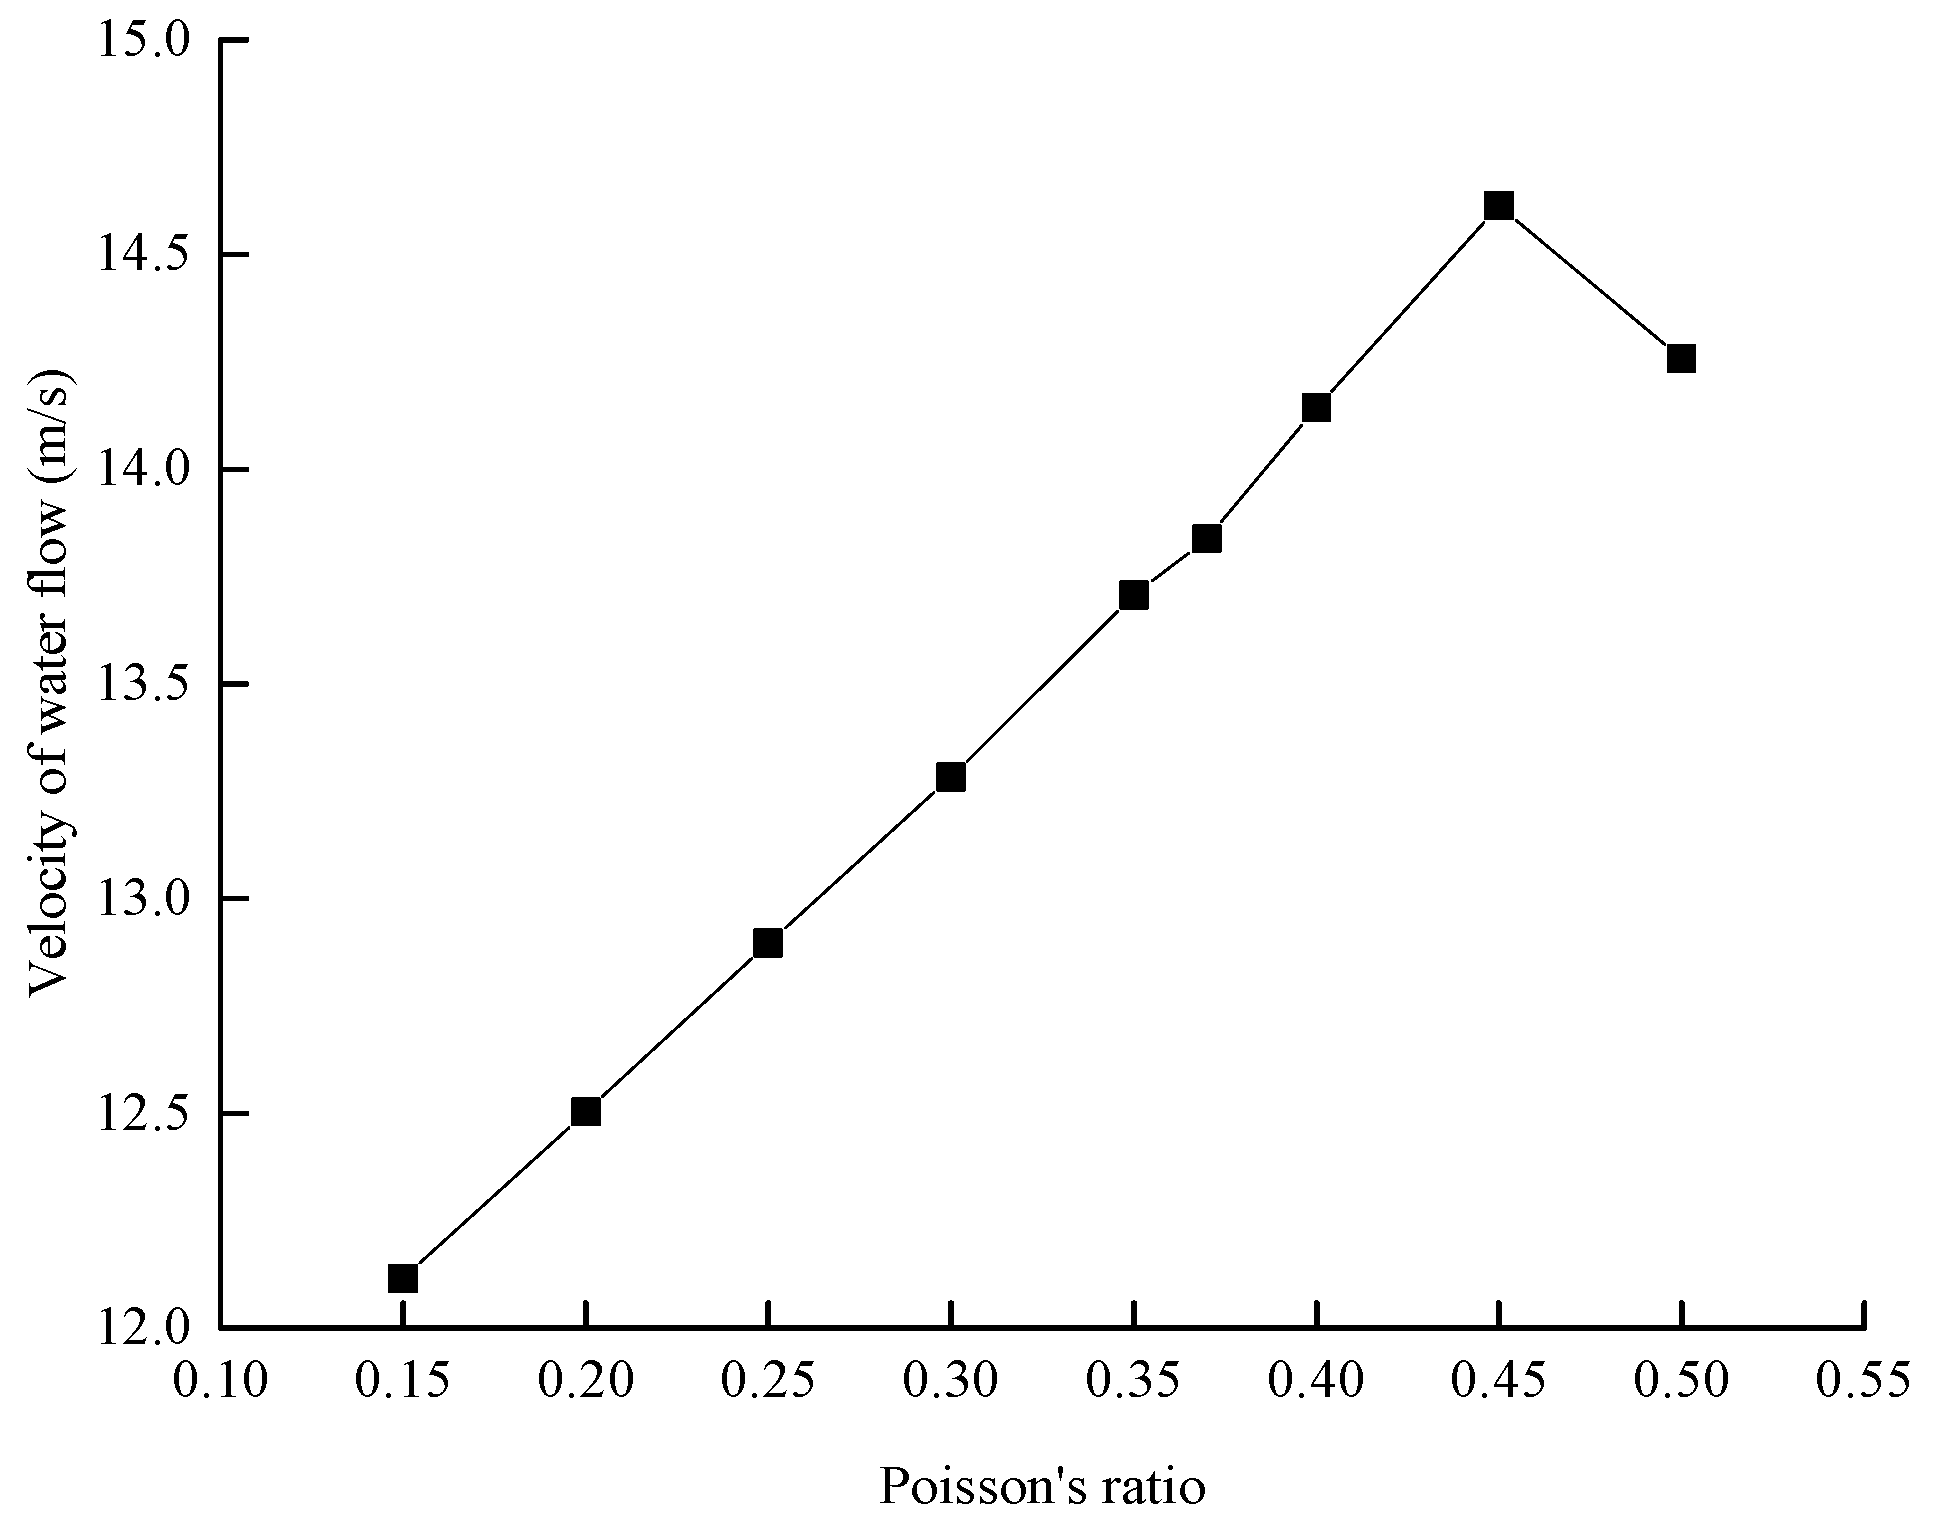
4.3.2. Sensitivity Analysis of Polyurea-Based Coating Material Parameters

The elastic modulus is an important performance parameter of materials, which is also an index to measure the ease of elastic deformation of materials and affects the impact resistance of polyurea-based coatings. The impact resistance of polyurea-based coatings, with different elastic moduli, is shown in Figure 12.
It can be seen that, when the elastic modulus of the polyurea-based material is 1 MPa, the impact resistance is the worst. As the elastic modulus increases, the impact resistance of the polyurea-based coating increases. When the elastic modulus of the polyurea-based material is 25 MPa, the impact resistance is optimal. After that, when the elastic modulus continues to increase to 49.5 MPa, the impact resistance of the coating is lessened, and the increase of the elasticity modulus has little effect on the impact resistance. Therefore, the elastic modulus of the polyurea-based material has a significant effect on the impact resistance of the polyurea-based coating. When the elastic modulus of the polyurea-based material is 25 MPa, the polyurea-based coating has the best impact resistance.
The Poisson’s ratio is the elastic constant responsive to the lateral deformation of the material, and it also affects the impact resistance of polyurea-based coatings. The impact resistances of polyurea-based coatings, with different Poisson ratios, are shown in Figure 13. It can be seen that the impact resistance of polyurea-based materials is enhanced with an increase in the Poisson’s ratio of polyurea-based coatings. When the Poisson’s ratio of polyurea-based materials is 0.45, the impact resistance is optimal. Thereafter, when the Poisson’s ratio is continuously increased to 0.5, the impact resistance of the polyurea-based coating is weakened. The Poisson’s ratio of the polyurea-based material also has a significant effect on the impact resistance of the polyurea-based coating. When the Poisson’s ratio of the polyurea-based material is 0.45, the polyurea-based coating has the best impact resistance.

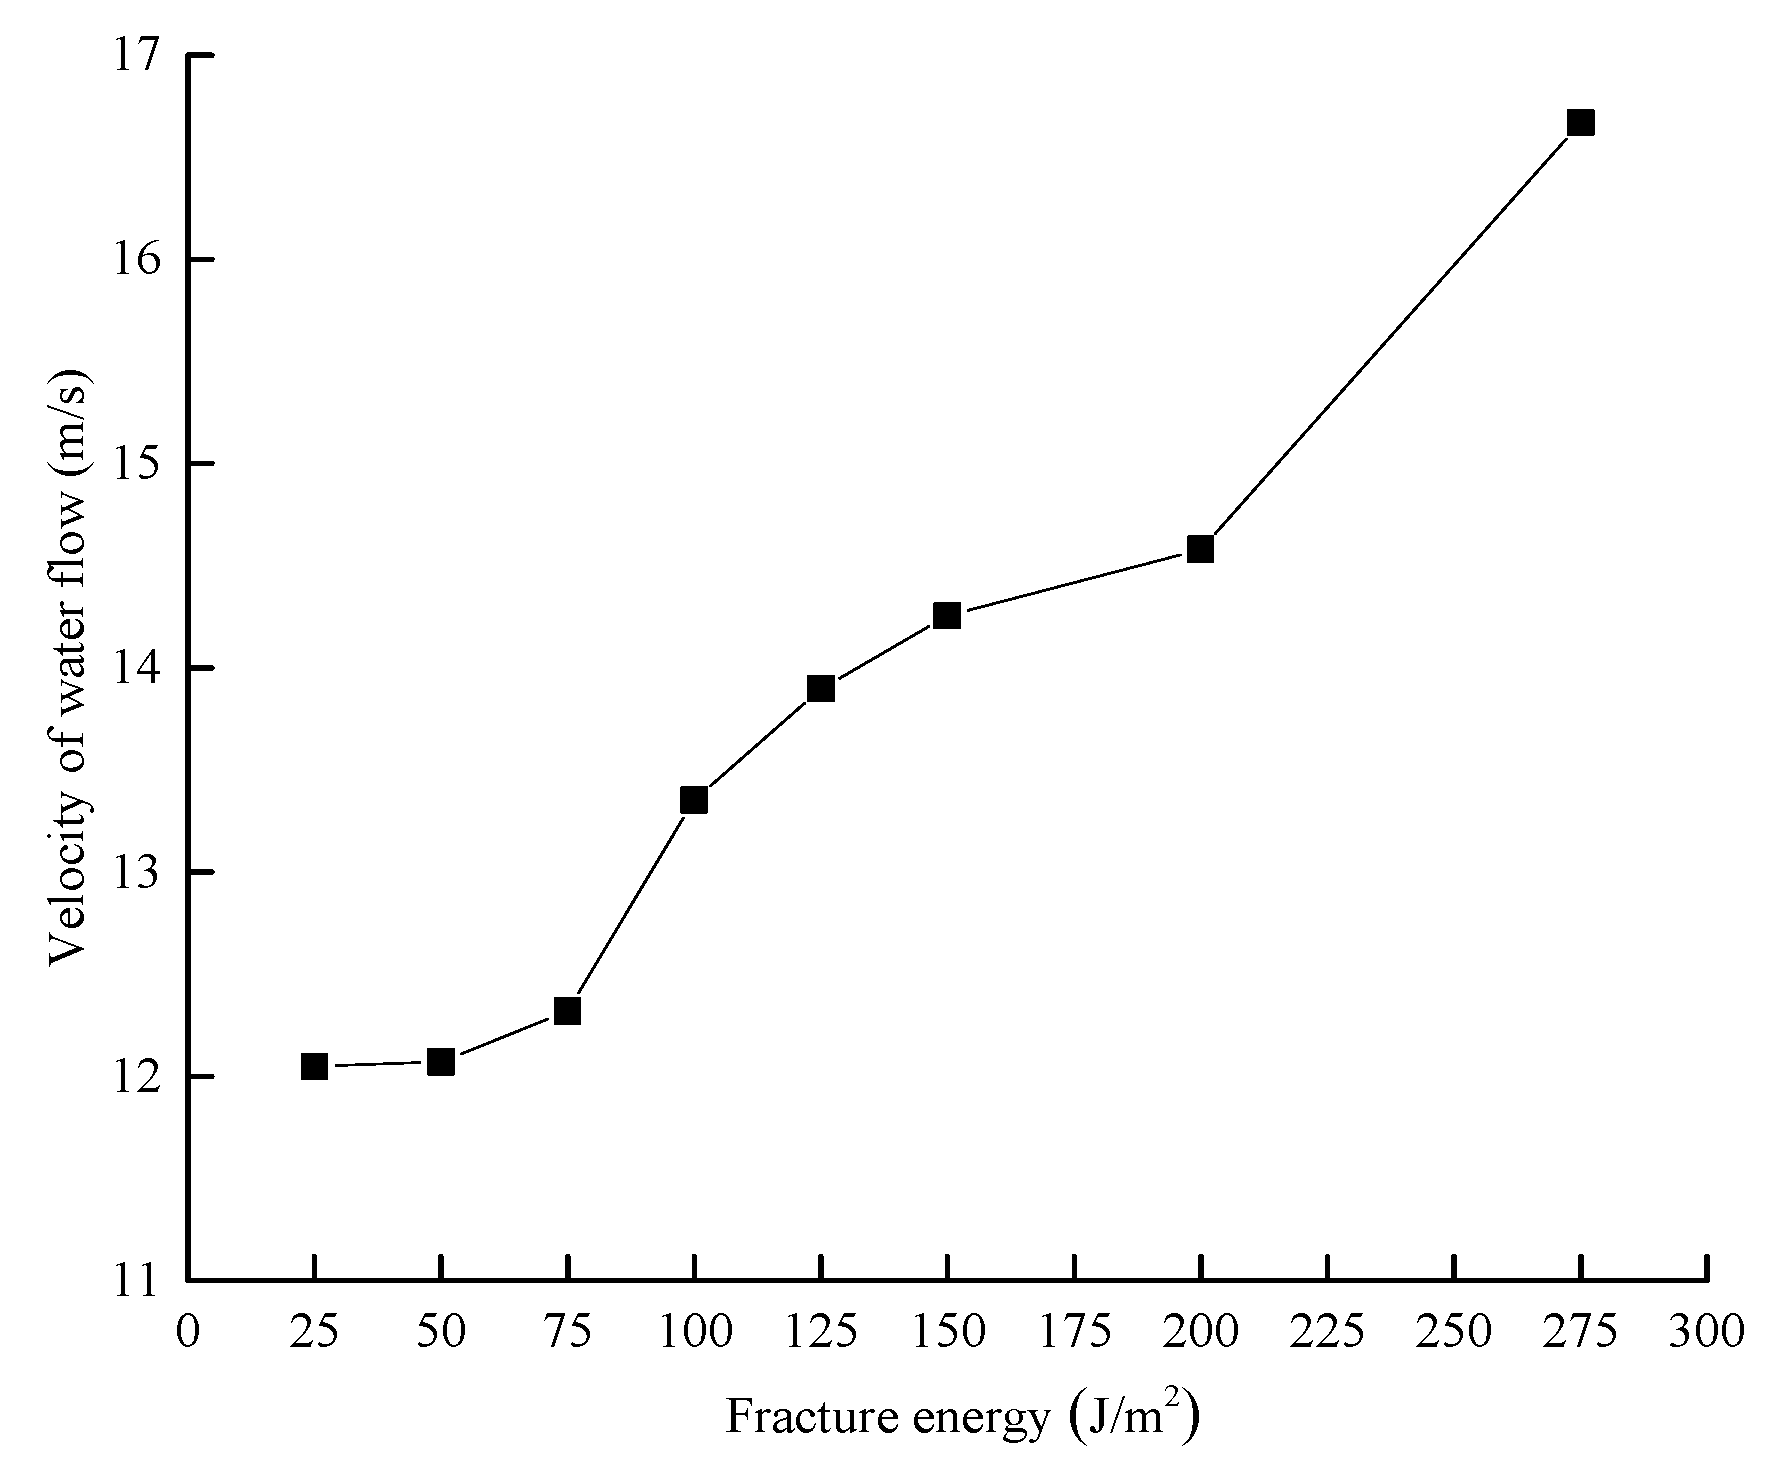
4.3.3. Sensitivity Analysis of Bonding Material Parameters

The impact resistance of the polyurea-based coating under different bonding material fracture energy conditions is shown in Figure 14. It can be seen that, when the fracture energy of the bonding material is 25 J/m2, the impact resistance is the worst. With the increase of fracture energy, the impact resistance of the polyurea-based coating is increased. Moreover, when the fracture energy of the bonding material exceeds 75 J/m2, the impact resistances of the polyurea-based coating increase. The fracture energy of the bonding material has a significant influence on the impact resistance of the polyurea-based coating, and the greater the fracture energy of the bonding material, the better the impact resistance of the polyurea-based coating.

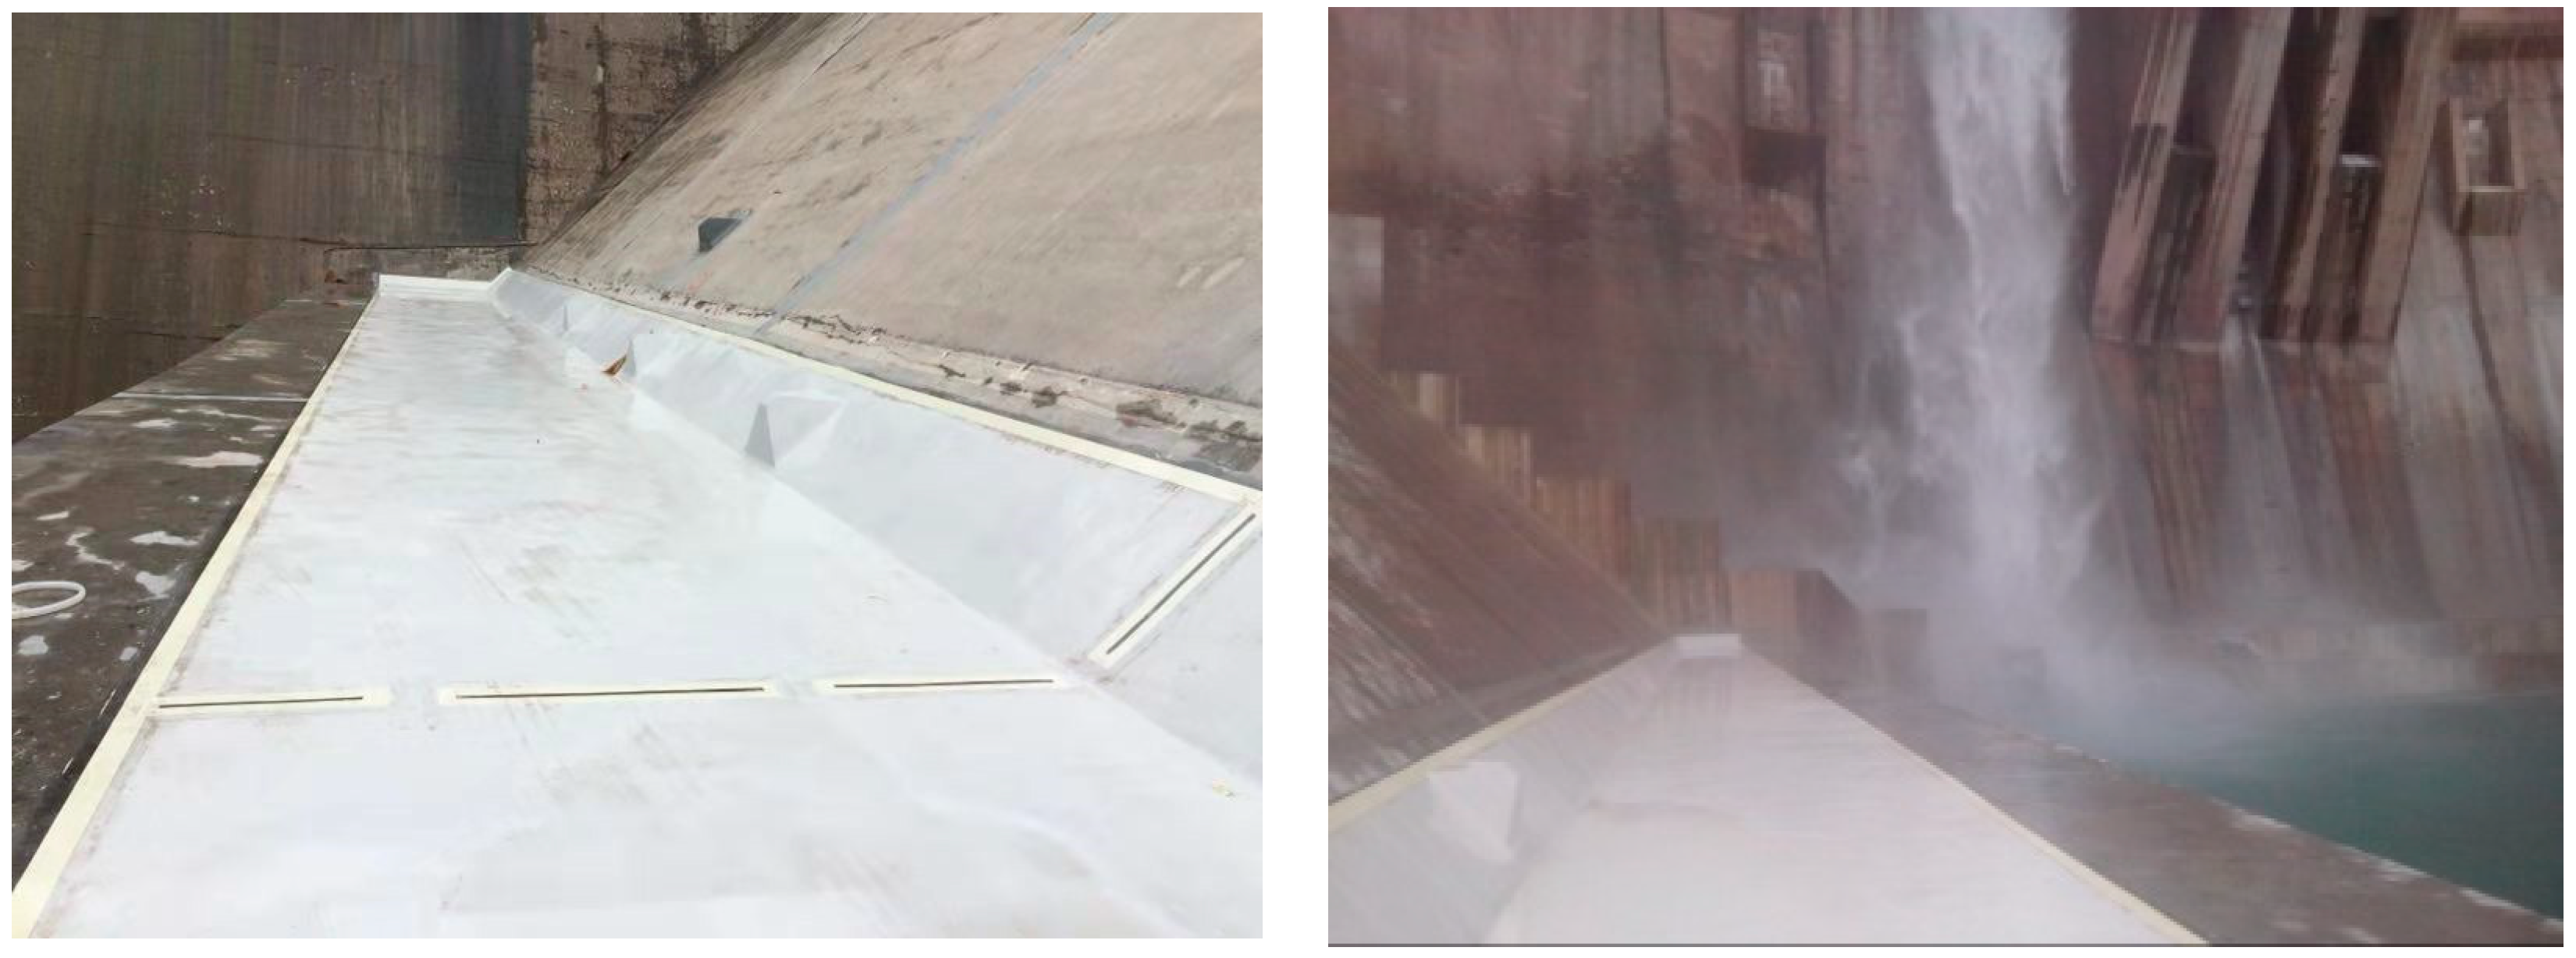
5. Engineering Applications of the Model

Based on the established debonding failure model, sensitivity studies of the anchoring type, polyurea-based coating and interlayer parameters, engineering application research on the model was carried out. An analysis of the impact resistance of flood discharge infrastructure was carried out, and the anchor design of polyurea-based coatings was given. The engineering application results show that the designed anchoring type can meet the requirements of impact resistance of flood discharge infrastructure.

5.1. Engineering Application 1

Xiluodu Hydropower Station is the second largest hydropower station in China and the third largest in the world. As the main flood-discharging and energy-dissipating infrastructure, the plunge pool, which is characterized by a high head, high flow rate, large flow, multiple sediments, and frequent flood discharge, undertakes a large flow energy dissipation and withstands the impact pressure and pulsation pressure of a strong water flow. The high velocity of the water flow may cause cavitation and erosion damage to the hydraulic structure. Therefore, a polyurea-based coating is needed to protect the building from damage.

5.1.1. Study of the Impact Resistance Design of Flood Discharge Infrastructure

According to the experience at the Xiluodu Hydropower Project, the flow velocity of the spillway is about 40 m/s. The polyurea-based coating is anchored by Multi-section buried anchoring, and steel nails are used for reinforcement at the anchoring point at the same time to improve the overall impact resistance of the polyurea-based coating.
A numerical model was established based on the structure of Xiluodu Hydropower Station, which includes 10505 nodes, 10304 planar strain elements, and 162 COH2D4 cohesive elements. The size of the concrete floor and polyurea-based coatings in the model are 100 mm × 100 mm and 86 mm × 2 mm, respectively. The polyurea-based coating was anchored in multiple sections, with an anchoring depth of 2 cm, and the embedded part is also reinforced (the yellow mesh part in Figure 15a), as shown in Figure 15. The drag force, impact force, fluctuating pressure and lifting force were calculated to be 54 kN, 40 kN, 30.98 kPa, and 48 kN, respectively, according to the formulas of each load in Section 2.1, the other material parameters and boundary conditions are adopted in the same way as in Section 3.2.

5.1.2. Analysis of Impact Resistance

Figure 16 shows the debonding failure of the polyurea-based coating, and it can be seen that, as the flow velocity of the water increases, the shearing effect between the layers gradually increases, and a stress concentration region is formed in the vicinity of the polyurea-based anchoring region. The tensile stress between the layers finally reached 2 MPa (Figure 17), which is not reached by the tensile strength of the bonding material, and no peeling occurred between the polyurea-based coating and the flood discharge infrastructure.
After the completion of the construction according to this anchoring method, a debonding failure in the spillway polyurea-based coating and the flood discharge infrastructure did not arise (Figure 18). Therefore, this design meets the requirements concerning the impact resistance of the Xiluodu flood discharge infrastructure.

5.2. Engineering Application 2

Daotang Reservoir is a comprehensive utilization water conservation project, integrating irrigation, water supply, aquaculture, and tourism. In the main flood season, the safe operation of the flood discharge tunnel is related to the safety of people and the major buildings. In order to improve the security of the spillway tunnel of the Daotang Reservoir, a polyurea-based coating is adopted at the outlet section of the discharge tunnel to improve the impact resistance.

5.2.1. Research on the Impact Resistance Design of the Flood Discharge Tunnel

According to the engineering operation experience and the flow analysis of the Daotang Reservoir flood discharge tunnel, the discharge velocity is about 26 m/s, and the End-buried anchoring measure was adopted to enhance the impact resistance of the polyurea-based coating.
A numerical simulation model, which includes 10,571 nodes, 10,369 plane strain elements, and 123 COH2D4 cohesive elements, was established based on the structure of the spillway tunnel of the Daotang Reservoir. The size of the concrete floor and polyurea-based coatings are also 100 mm × 100 mm and 86 mm and 2 mm, respectively. The polyurea-based coating was anchored at an end, with an anchoring depth of 2 cm. The numerical model is shown in Figure 19. The drag force, impact force, fluctuating pressure and lifting force were calculated to be 35.1 kN, 26 kN, 20.14 kPa, and 31.2 kN, respectively, according to the formulas of each load in Section 2.1, and the other material parameters and boundary conditions are as in Section 3.2.

5.2.2. Analysis of Impact Resistance

The debonding failure of the polyurea-based coating, at a water flow rate of 26 m/s, is shown in Figure 20. Under the action of the water flow, no peeling occurs between the polyurea-based coating and the flood discharge infrastructure, and only a stress concentration zone is formed at the end. Similarly, the tensile stress at the section did not exceed the tensile strength of the cohesive layer (Figure 21). Therefore, this design meets the requirements concerning impact resistance of the Daotang Reservoir flood discharge infrastructure.
In addition, after nearly three years of flood discharge (velocity of water flow: 26 m/s), the polyurea-based coating has a good effect on protecting the spillway tunnel of the Daotang Reservoir from impact resistance (Figure 22), which proved that the anchored type meets the impact resistance requirements and ensures the safe operation of the Daotang Reservoir.

6. Conclusions

In this paper, the debonding failure model was established to describe the debonding behavior between the polyurea-based coating and flood discharge infrastructure. A peeling test was implemented to study the debonding failure between polyurea-based coatings and concrete with different peeling angles. Parameters of the interface in the peeling failure model were obtained, and the model was verified. On the basis of this model, the effects of different anchoring patterns of polyurea-based coatings, polyurea-based and bonding materials on the impact properties were analyzed, and the engineering application of the model was also carried out. According to the above research, the main conclusions are as follows:
A debonding failure model of flood discharge infrastructure with a high-velocity flood discharge is established based on the cohesive force model. The parameters of the interface for the debonding failure model were obtained by the peeling failure test, and the model was verified. The results obtained from the model were basically consistent with the test results.
The impact resistance of the polyurea-based coating under different anchoring conditions was studied using the established model. For the polyurea-based coating under the without-anchoring, Local-anchoring, Mesh-anchoring, End-buried anchoring, and Multi-section buried anchoring conditions, the impact resistance is enhanced. The velocity of the water flow caused by the polyurea-based coating under different anchoring conditions was obtained, which provides theoretical support for the design of the anchoring type under different water flow conditions.
The elastic modulus and Poisson’s ratio of polyurea-based materials, and the fracture energy of bonding materials, have significant effects on the impact resistance of polyurea-based coatings, and the influence of material parameters on the impact resistance of polyurea-based coatings was obtained. When the elastic modulus and Poisson’s ratio of polyurea material are 25 MPa and 0.45, respectively, the polyurea coating achieves the optimum impact resistance. The greater the fracture energy of the interlayer, the better the impact resistance of the polyurea-based coating.
The engineering design for the impact resistance of the Xiluodu hydropower flood discharging building and Daotang Reservoir flood discharge tunnel has been implemented using the established model, and the engineering results show that the seepage prevention and anti-wear characteristic of the flood discharge infrastructure meet the engineering requirements, which ensures the healthy and sustainable operation of hydropower stations.

Author Contributions

All authors contributed equally to this paper. B.L. designed the study and established the model, Z.Z. verified the model and carried out numerical calculations, X.W. analyzed the numerical results, and X.L. wrote the manuscript.

Funding

This research received no external funding.

Conflicts of Interest

The authors declare no conflict of interest.

References

  1. Urgessa, G.S.; Esfandiari, M. Review of Polymer Coatings Used for Blast Strengthening of Reinforced Concrete and Masonry Structures. In Proceedings of the International Congress on Polymers in Concrete; Springer: Cham, Switzerland, 2018; pp. 713–719. [Google Scholar]
  2. Buchan, P.A.; Chen, J.F. Blast resistance of FRP composites and polymer strengthened concrete and masonry structures. Compos. Part B Eng. 2007, 38, 509–522. [Google Scholar] [CrossRef]
  3. McCall, R.T.; Masselink, G.; Poate, T.G.; Roelvink, J.A.; Almeida, L.P.; Davidson, M.; Russell, P.E. Modelling storm hydrodynamics on gravel beaches with XBeach-G. Coast. Eng. 2014, 91, 231–250. [Google Scholar] [CrossRef] [Green Version]
  4. Buckley, M.L.; Wei, Y.; Jaffe, B.E.; Watt, S.G. Inverse modeling of velocities and inferred cause of overwash that emplaced inland fields of boulders at Anegada, British Virgin Islands. Nat. Hazards 2012, 63, 133–149. [Google Scholar] [CrossRef]
  5. Chanson, H. Embankment overtopping protection systems. Acta Geotech. 2015, 10, 305–318. [Google Scholar] [CrossRef]
  6. Chiganne, F.; Marche, C.; Mahdi, T.F. Evaluation of the overflow failure scenario and hydrograph of an embankment dam with a concrete upstream slope protection. Nat. Hazards 2014, 71, 21–39. [Google Scholar] [CrossRef]
  7. Schüttrumpf, H.; Oumeraci, H. Layer thicknesses and velocities of wave overtopping flow at seadikes. Coast. Eng. 2005, 52, 473–495. [Google Scholar] [CrossRef]
  8. Matsushima, K.; Mohri, Y.; Yamazaki, S.; Hori, T.; Ariyoshi, M.; Tatsuoka, F. Design of earth dams allowing temporary overtopping based on hydraulic failure experiments and flood analysis. In Geosynthetics in Civil and Environmental Engineering; Springer: Berlin/Heidelberg, Germany, 2008; pp. 757–762. [Google Scholar]
  9. Bomers, A.; Lopez, J.A.; Warmink, J.J.; Hulscher, S.J. Modelling effects of an asphalt road at a dike crest on dike cover erosion onset during wave overtopping. Nat. Hazards J. Int. Soc. Prev. Mitig. Nat. Hazards 2018, 93, 1–30. [Google Scholar] [Green Version]
  10. Quang, T.T.; Oumeraci, H. Numerical modelling of wave overtopping-induced erosion of grassed inner sea-dike slopes. Nat. Hazards 2012, 63, 417–447. [Google Scholar] [CrossRef]
  11. Alkhader, M.; Knauss, W.G.; Ravichandran, G. The influence of pressure on the large deformation shear response of a Polyurea. Time Depend. Const. Behav. Fract. Fail. Process. 2011, 3, 287–295. [Google Scholar]
  12. Ng, P.L.; Kwan, A.K.H. Improving concrete durability for sewerage applications. In Engineering Asset Management-Systems, Professional Practices and Certification; Springer: Cham, Switzerland, 2015; pp. 1043–1053. [Google Scholar]
  13. Raman, S.N.; Ngo TLu, J.; Mendis, P. Experimental investigation on the tensile behaviour of polyurea at high strain rates. Mater. Des. 2013, 50, 124–129. [Google Scholar] [CrossRef]
  14. Mohotti, D.; Ali, M.; Ngo, T.; Lu, J.; Mendis, P. Strain rate dependent constitutive model for predicting the material behaviour of polyurea under high strain rate tensile loading. Mater. Des. 2014, 53, 830–837. [Google Scholar] [CrossRef]
  15. Dugdale, D.S. Yielding of steel sheets containing slits. J. Mech. Phys. Solids 1960, 8, 100–104. [Google Scholar] [CrossRef]
  16. Barenblatt, G.I. The formation of equilibrium cracks during brittle fracture. General ideas and hypotheses. Axially-symmetric cracks. J. Appl. Math. Mech. 1959, 23, 622–636. [Google Scholar] [CrossRef]
  17. Zhang, Z.; Paulino, G.H. Cohesive zone modeling of dynamic failure in homogeneous and functionally graded materials. Int. J. Plast. 2005, 21, 1195–1254. [Google Scholar] [CrossRef]
  18. Paulino, G.H. Dynamic Fracture of Functionally Graded Composites Using an Intrinsic Cohesive Zone Model. Mater. Sci. Forum 2005, 492–493, 447–452. [Google Scholar] [CrossRef]
  19. Heshmati, M.; Haghani, R.; Al-Emrani, M.; André, A. On the strength prediction of adhesively bonded FRP-steel joints using cohesive zone modelling. Theor. Appl. Fract. Mech. 2018, 93, 64–78. [Google Scholar] [CrossRef]
  20. Mohammed, I.K.; Kinloch, A.J.; Charalambides, M.N. Modelling the Peeling Behavior of Soft Adhesives. Procedia Struct. Integr. 2016, 2, 326–333. [Google Scholar] [CrossRef] [Green Version]
  21. Migliavacca, F. Modeling and Experimental Studies of Peeling of Polymer Coating for Biodegradable Magnesium Alloy Stents. Rare Met. Mater. Eng. 2014, 43, 2877–2882. [Google Scholar]
  22. Rahulkumar, P.; Jagota, A.; Bennison, S.J.; Saigal, S. Cohesive element modeling of viscoelastic fracture: Application to peel testing of polymers. Int. J. Solids Struct. 2000, 37, 1873–1897. [Google Scholar] [CrossRef]
  23. Hillerborg, A.; Modéer, M.; Petersson, P.E. Analysis of crack formation and crack growth in concrete by means of fracture mechanics and finite elements. Cem. Concr. Res. 1976, 6, 773–781. [Google Scholar] [CrossRef]
  24. Petersson, P.E. Crack Growth and Development of Fracture Zones in Plain Concrete and Similar Materials; Report No. TVBM-1006; Division of Building Materials, Lund Institute of Technology: Lund, Sweden, 1981. [Google Scholar]
  25. Ortiz, M.; Pandolfi, A. Finite-deformation irreversible cohesive elements for three-dimensional crack-propagation analysis. Int. J. Numer. Methods Eng. 1999, 44, 1267–1282. [Google Scholar] [CrossRef] [Green Version]
  26. Ruiz, G.; Pandolfi, A.; Ortiz, M. Three-dimensional cohesive modeling of dynamic mixed-mode fracture. Int. J. Numer. Methods Eng. 2001, 52, 97–120. [Google Scholar] [CrossRef]
  27. Schoneboom, T.; Aberle, J.; Dittrich, A. Spatial Variability, Mean Drag Forces, and Drag Coefficients in an Array of Rigid Cylinders. In Experimental Methods in Hydraulic Research; Springer: Berlin/Heidelberg, Germany, 2011. [Google Scholar]
  28. Lopardo, R.A.; Romagnoli, M. Pressure and Velocity Fluctuations in Stilling Basins. In Advances in Water Resources & Hydraulic Engineering; Springer: Berlin/Heidelberg, Germany, 2008. [Google Scholar]
  29. Batchelor, G.K. Pressure fluctuations in isotropic turbulence. In Mathematical Proceedings of the Cambridge Philosophical Society; Cambridge University Press: Cambridge, UK, 1951; Volume 47, pp. 359–374. [Google Scholar]
  30. Anderson, J.D. Introduction to Flight, 7th ed.; McGraw-Hill Education: NewYork, NY, USA, 2004. [Google Scholar]
  31. Pike, J. Lift, drag and thrust at high flight Mach number. Philos. Trans. Math. Phys. Eng. Sci. 1999, 357, 2141–2149. [Google Scholar] [CrossRef]
  32. Zienkiewicz, O.C.; Taylor, R.L.; Zhu, J.Z. The Finite Element Method; Elsevier: Kidlington, UK, 2008. [Google Scholar]
  33. Steinhauser, M.O. Computational Mutiscale Modeling of Fluids and Solids: Theory and Applications; Springer: Berlin/Heidelberg, Germany, 2008. [Google Scholar]
  34. Abaqus Analysis User’s Guide 6.14; Dassilt Simulia: Paris, France, 2014; pp. 827–915.
  35. Munjiza, A. The Combined Finite-Discrete Element Method; Wiley: Chichester, UK, 2004; pp. 35–129. [Google Scholar]
  36. Li, B.Q.; Zhang, Y.C.; Liu, X.N.; Li, Z.Y. Study on the polyurea-coat debonding failure of impervious structurein contraction joints. Shui Li Xue Bao 2017, 48, 70–77. (In Chinese) [Google Scholar]
Figure 1. Schematic diagram of the debonding failure model.
Sustainability 11 01261 g001
Figure 2. Schematic diagram of the cohesive zone.
Sustainability 11 01261 g002
Figure 3. Schematic diagram of the crack boundary conditions.
Sustainability 11 01261 g003
Figure 4. Schematic diagram of the debonding failure test system.
Sustainability 11 01261 g004
Figure 5. The relationship between the tensile force and opening displacement of the debonding interface.
Sustainability 11 01261 g005aSustainability 11 01261 g005b
Figure 6. The finite element model of tests.
Sustainability 11 01261 g006
Figure 7. Comparison of the test and model results.
Sustainability 11 01261 g007
Figure 8. Numerical model of flood discharge infrastructure with polyurea-based coating.
Sustainability 11 01261 g008
Figure 9. Schematic diagram of different anchoring patterns.
Sustainability 11 01261 g009
Figure 10. Curves of the tensile stress and the velocity of the water flow in different anchoring cases.
Sustainability 11 01261 g010
Figure 11. The debonding failure of the polyurea-based coating with different anchoring types.
Sustainability 11 01261 g011aSustainability 11 01261 g011b
Figure 12. Impact resistance of polyurea-based coatings under different elastic moduli conditions.
Sustainability 11 01261 g012
Figure 13. Impact resistance of polyurea-based coatings under different Poisson’s ratio conditions.
Sustainability 11 01261 g013
Figure 14. Impact resistance of the polyurea-based coatings under different fracture energy conditions.
Sustainability 11 01261 g014
Figure 15. Diagram of the anchoring design and numerical model of flood discharge infrastructure.
Sustainability 11 01261 g015
Figure 16. The debonding failure of the polyurea-based coating.
Sustainability 11 01261 g016
Figure 17. Curve of the tensile stress and velocity of the water flow.
Sustainability 11 01261 g017
Figure 18. Engineering application diagram of the polyurea-based coating in the Xiluodu flood discharge infrastructure.
Sustainability 11 01261 g018
Figure 19. The numerical model of flood discharge infrastructure, with end-buried anchoring.
Sustainability 11 01261 g019
Figure 20. The debonding failure of the polyurea-based coating, with end-buried anchoring.
Sustainability 11 01261 g020
Figure 21. Curve of the tensile stress and velocity of the water flow.
Sustainability 11 01261 g021
Figure 22. Engineering application of the polyurea-based coating for the flood discharge tunnel of the Daotang Reservoir.
Sustainability 11 01261 g022

