Article

Service-Oriented Load Balancing Approach to Alleviating Peak-Hour Congestion in a Metro Network Based on Multi-Path Accessibility

1
Key Laboratory of Road and Traffic Engineering of the Ministry of Education, College of Transportation Engineering, Tongji University, Shanghai 201804, China
2
USDOT Center for Advanced Multimodal Mobility Solutions and Education, Department of Civil and Environmental Engineering, University of North Carolina at Charlotte, Charlotte, NC 28223, USA
3
Technology Center of Shanghai Shentong Metro Group Co. Ltd., Shanghai 201103, China
*
Authors to whom correspondence should be addressed.
Sustainability 2019, 11(5), 1293; https://0-doi-org.brum.beds.ac.uk/10.3390/su11051293
Submission received: 13 January 2019 / Revised: 22 February 2019 / Accepted: 26 February 2019 / Published: 1 March 2019
(This article belongs to the Collection Sustainable Rail and Metro Systems)

Abstract

:
To further improve the service quality and reduce safety risks in current congested metro systems during peak hours, this paper presents a load balancing (LB) approach so that available capacity can be utilized more effectively in order to alleviate peak hour congestion. A set of under-utilized yet effective alternative routes were searched using a deletion algorithm (DA) in order to share the passenger loads on overcrowded metro line segments. An optimization model was constructed based on an improved route generalized time utility function considering the penalties of both in-vehicle congestion and transfers. A detailed load balancing solution was generated based on the proposed algorithm. A real-world example of three overloaded metro line segments in the Shanghai metro network were selected and used to verify the feasibility and validity of the developed load balancing method. The results show that the load balancing method can effectively reduce the overcrowding situation to a great extent. Finally, two prospective inducing schemes are discussed to help implement the load balancing solution in the actual metro system in an efficient and effective manner.

1. Introduction

The metro system has been built as the backbone of urban public transportation in many large and medium-sized cities around the world due to its advantages of speed, capacity, punctuality, safety, lower-emission, etc. This is particularly the case in China, where there were 31 metro systems running in Mainland China with a total combined length of 3881.8 kilometers at the end of 2017. Today, China operates the world’s longest, second, and fourth longest metro systems in its cities. In addition, four of the top ten busiest metro systems in the world are in China. In those busiest systems, many metro planning and operational problems arise accordingly. The most remarkable one is perhaps the significant recurrent congestion that many travelers have to experience during peak hours on a daily basis.
Congestion not only results in significant time delays and impose high safety risks, but also makes passengers perceive some other types of disutility which include, but are not limited to seat unavailability, undesirable but frequent physical contact with people, inability to read or use a smart phones when necessary, and/or legitimate concerns about sexual harassment [1]. Peak-period extreme crowding occurs on some metro line segments and at some stations when travel demands exceed the existing metro system capacity. For commuters, they prefer to use the route(s) with the shortest time and/or involving the least number of transfers. It is common that certain segments of a given transportation facility experience extreme congestion conditions during certain hours of the day while on other segments and during other hours the same facility may have very low rates of utilization [2]. Under extreme conditions, however, even if the headways of some lines are shortened to be 2 minutes during rush hours, the physical capacity may still not be able to meet the great peak hour travel demands correspondingly. As such, in the encouragement of “reasonable supply and controlled demand”, active demand management (ADM) has been attracting more and more attention among many transportation researchers and practitioners. Along that line, the crowding could be effectively alleviated by managing passenger flow distribution in the network. In a complex network like the Shanghai metro system, trips between each of these large number of origin-destination (OD) pairs can be made by using two or more alternative routes. There may be a feasible way to divert passengers from the overcrowded metro line segments to other less heavily utilized routes. In this paper, the overcrowded line segment is defined as an overloaded segment, which can be quantified using a variable: mean occupancy (i.e., the ratio of the passenger loads to train capacity in peak period). By definition the rate can vary between 0 (trains travelling empty) and 1 (trains travelling fully loaded during the period). An overloaded segment can be declared when the occupancy of trains along it reaches a threshold of 85%. Note that, the threshold can be different from city to city. It is 70% on the London Underground while on the Santiago Metro the value is 85%, according to Reference [3,4]. Here, 85% is selected and deemed suitable for use in the metro systems in China. As one can imagine, when the occupancy is greater than or equal to 85%, the level of comfort can be greatly reduced due to the high passenger density. In addition, there is a chance that users may not even be able to board the first train which they would like to and have to wait for the next train. In this paper, it was assumed that the OD pairs and relevant ridership (that fundamentally causes the presence of overloaded segments and their corresponding congestion during the peak period) are known. The purpose of this research is to develop an efficient and effective method to find a set of under-utilized alternative routes for use so that the heavy passenger loads on those overloaded segments can be shared and balanced. As a by-product, the ridership being diverted will be made known as well.
The rest of this paper is organized as follows. In Section 2, previous studies on the methods to manage peak hour congestion are reviewed. Section 3 describes the problem to be solved in this paper. Section 4 constructs an optimization model based on an improved route generalized time utility function and develops a load balancing algorithm to calculate the OD ridership for diverting. In Section 5, the Shanghai metro system is used as a real case study to test the methodologies presented in this paper. In Section 6, some feasible inducing schemes that can be applied to actual active demand management in metro systems are discussed. Finally, conclusions are made and some future research directions are also presented in Section 7.

2. Literature Review

Restricted by the ability of infrastructure, equipment, and right-of-way, train capacity in metro system is reaching its limits. More and more transportation researchers and decision makers have begun to consider the optimal control of passenger flows from the “demand side” to reduce the peak hour congestion. In general, there are two strategies that can be used to manage the peak hour congestion: inflow control at stations and route guidance. Inflow control at stations is one of the most effective control means to ensure operational safety at stations. The theory of inflow control has been developed from inflow control at a single station, combined inflow control at multiple stations, to coordinated inflow control in the network. Zhao et al. [5] and Yao et al. [6] established a coordinated passenger inflow control model at the network level based on mathematical programming to minimize the number of delayed passengers and to provide quantitative basis for selecting control stations and determining control time and inflow rates. To reduce overloaded passengers on platforms and improve the service quality, Li et al. [7] and Shi et al. [8] integrated an optimal train timetable with passenger flow control strategy on an oversaturated metro line. Xu et al. [9] studied the passenger flow organization problem at subway stations under uncertain demand and developed a unified simulation-based algorithm to solve it. Jiang et al. [10] developed a new reinforcement learning-based method to optimize the inflow volume during a certain period of time at crowded metro stations. In principle, the studies mentioned above aimed to relieve the passenger congestion at stations. However, through our field investigation, inflow control at metro stations was not effective in mitigating the overcrowding situations in packed trains. In order to relieve the in-vehicle congestion, route guidance for passengers is a potentially very effective measure that can be used based on dynamic path planning and effective information release to induce passengers to choose a more reasonable route. Relevant research efforts are often made to reassign the passenger flows based on the degree of congestion on such efficient routes. For example, Si et al. [11] presented an urban transit assignment model based on augmented network with both the in-vehicle congestion and transfer congestion and developed an improved shortest path-based algorithm to solve it. Zhu et al. [12] presented a modified stochastic user-equilibrium assignment algorithm to calculate the passenger flow distribution for network operations. Though the impacts of in-vehicle congestion on passengers began to be considered, how to mitigate in-vehicle congestion is not the focus of these studies. Abadi et al. [13] developed a coordinated multimodal dynamic freight load balancing (MDFLB) system to balance freight loads across both the rail and road networks. The research idea is very important since load balancing improves the distribution of loads in the network and aims to optimize the use of resource and avoid overload in partial network.
In summary, to effectively manage the increasingly high travel demands in peak hours, passenger flow control methods are becoming more and more important and valued both in theory and practice. Although the negative effects in metro systems caused by in-vehicle congestion seems as serious as crowding on platforms, research on in-vehicle congestion-mitigation are not perfect and systematic. Based on recent studies, the main purpose of this paper is how to alleviate peak-hour in-vehicle congestion in metro systems in a proactive, targeted, and humanized way.

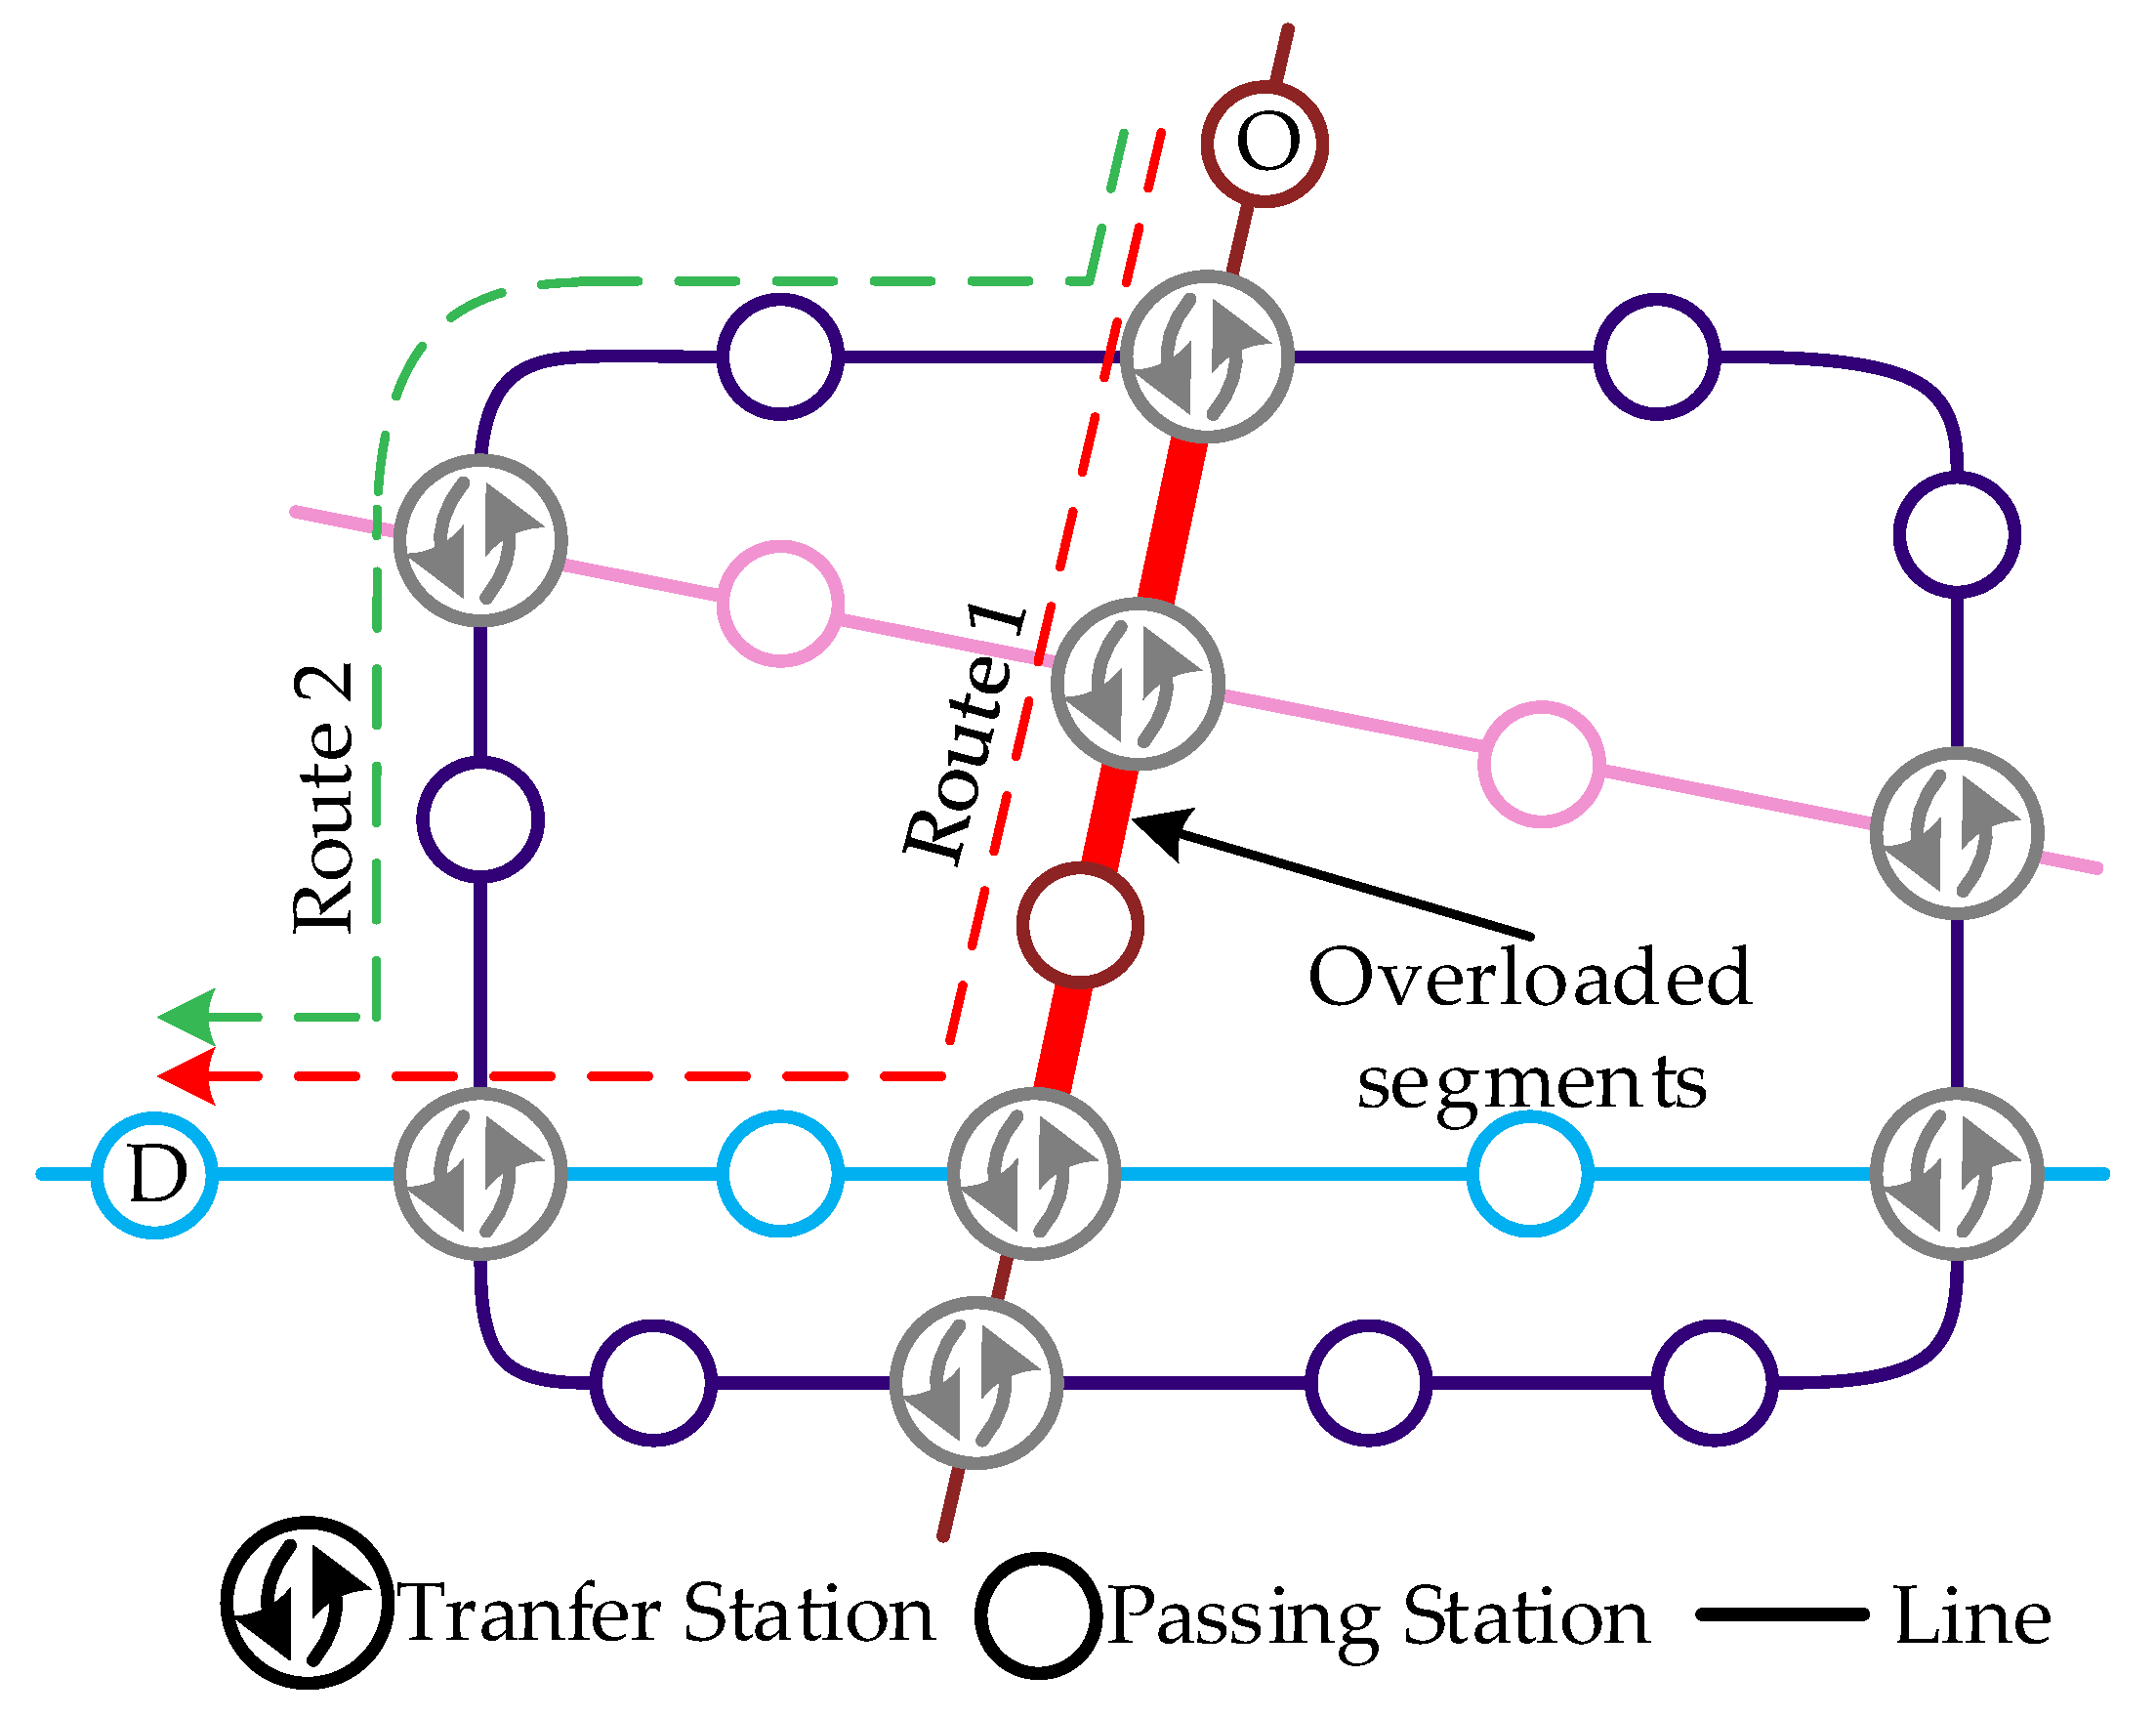
3. Problem Description

A metro system is an extremely complicated double-load network that is composed of three layers: static physical topology with stations and connections, dynamic network with running trains, and trip network with passengers (see Figure 1). Due to the drastic increase of travel demands, the current passenger flow loading in the network is becoming more and more unbalanced, particularly during peak hours, which can result in several adverse effects as mentioned above.
The travel demands of passengers often have a specific requirement on the use of certain routes particularly during peak hours. However, restricted by the ability of the infrastructure, equipment and right-of-way, train capacity cannot adequately match the peak hour excessive travel demands along those routes or segments because increasing the capacity is simply not always a feasible solution. Fortunately, with the development of the metro system, the network accessibility has been greatly enhanced. Passengers may have several routes to select from for each OD pair so as to complete their trips. As such, this paper intends to alleviate the peak hour congestion from the demand side using a service-oriented load balancing approach. By optimizing the passenger flow distribution in the metro network, the oversaturated situations may be gradually reduced. For example, Figure 2 shows a simple metro network. Route 1 is the shortest route in travel time from station O to D, which will be chosen by most passengers travelling in the peak hours. However, with the heavy passenger loads on it, Route 1 may be extremely crowded on some segments (which are shown as overloaded segments in Figure 2), and therefore at some stations, passengers may find it extremely hard to board the first train. The overcrowding will have an enormous impact on passengers under such scenarios. Some studies have been investigated that crowding affects the route choice of metro passengers and people will reroute or even have a willingness to pay (WTP) to avoid the in-vehicle crowding [1,14,15]. All the studies that have been reviewed indicate that crowding will increase the value of generalized travel time. Based on this inner motivation of passengers, to mitigate the severe congestion on overloaded segments of Route 1, an alternative Route 2 with surplus capacity can be effectively leveraged to share the large passenger loads on Route 1.
The load balancing approach proposed in this paper aims at providing passengers a comfortable trip and reducing or preventing relevant safety risks caused by congestion. More specifically, this paper intends to develop an efficient method to find effective alternative routes in order to share the heavy passenger loads on overloaded segment(s) and decide how many passengers to divert is reasonable without new overloaded segment(s) appearing. The implementation of the load balancing method based on multi-path accessibility can be evaluated using both the occupancy of trains along related segments and load balancing indicators. Some assumptions need to be made before the presentation of the methodologies: (1) No delays and disruptions during the daily operations; (2) The average interval between departures in the timetable is fixed; (3) The slight difference between planned train timetables and actual train operation is ignored.

4. Methodologies

4.1. Notations

The following notations are defined and used to formulate the optimization model. Relevant sets, parameters, and variables are listed in Table 1.

4.2 Set of Effective Alternative Routes

Metro systems in many large cities in China are in the process of being extended to a multilayer dynamic complex network from a single static network, with continuous narrowing headways to better serve growing users. The detailed information of the two busiest metro systems in China is presented in Table 2. As is evidently shown in Table 2, even if the minimum headway is shortened to be nearly 2 minutes in peak hours, the physical capacity may still not be able to meet the great peak hour travel demands. Therefore, increasing the capacity to satisfy booming demands is a straightforward but not always feasible in practice due to potential long construction time periods, budget limitations, right-of-way constraints, etc. [10].
The physical metro topology presents the characteristics of both small world and the power-law distribution of distance between stations [16]. Dynamic accessibility is greatly enhanced in a complex network in which more routes are generally available for passengers to select, see Figure 3. Route choice modelling is normally based on time variables such as the in-vehicle time, transfer time and dwell time. However, passengers’ perceptions of available alternative routes are such that they do not always choose what the modeler would consider as the “lowest cost” option [13]. Passengers are becoming more and more focused on the in-vehicle and on-platform crowding instead of focusing on such traditional time variables only. The exceedingly overcrowding not only brings a high degree of discomfort to users, but also impinges directly on the performance of the metro system, leading to significant train delays and a high likelihood of passengers being left behind. In comparison, the demand elasticities in association with route choice should be larger if the trip maker is presented with alternative routes that are similar in terms of comfort, punctuality and other travel attributes [17]. Assume that the set of OD ridership loaded on overloaded segment(s) during peak period [ T 0 , T 1 ] is V s e c = { V 1 , V 2 , , V i , , V I } . And I is the total number of V i . For each V i , a set of effective routes are defined as R i = { r i , 0 , r i , 1 , r i , 2 , , r i , k , , r i , K } . r i , 0 is defined as the route of V i with overloaded segment(s). r i , k ( k = 1 , 2 , , K ) is the effective alternative route of r i , 0 . Commonly, both the K-shortest algorithm and Dial algorithm can be used to find routes for all OD pairs based on the route generalized cost function given by Bai, et al. [18]. However, the K-shortest route approach only adapts well to the condition of K ≤ 3 due to the repeated iterations, and Dial algorithm would skip over some routes when the metro system has a loop [11,18,19]. Hence, a deletion algorithm (DA) based on the depth-first traversal (DFT) method is used to find the set of effective routes for any given OD pair, as applied in [12,19]. The core feature of DA is to find the next alternative shortest route by deleting a link on the existing shortest route in the directed graph and searching for a replacement link. The DA is actually implemented by adding additional nodes and corresponding links in the directed graph.
However, not all the routes between an OD pair can be used as an efficient alternative to r i , 0 . The effective alternative routes must satisfy two requirements as follows:
(1) The difference of generalized time utility cannot exceed a threshold between the alternatives and the shortest route. The threshold Δ U can be calculated by using Equatioin (1)
Δ U = min { θ U min , T }
where U min is the generalized time utility of the shortest route for an OD pair. θ denotes a coefficient of proportionality. T represents the maximum time that passengers can tolerate beyond U min . θ and T are 0.6, 10min respectively which are calibrated based on the results of travel surveys [12].
(2) Furthermore, all routes not only are accessible in the physical topology, but also need to meet the constraint of lines’ service time. A route is invalid if some connections occur beyond the service time and thus will be excluded from the candidate set.

4.3 Mathematical Model

The load balancing (LB) approach developed in this paper aims at providing passengers a comfortable trip by relieving the in-vehicle congestion and achieving the best match between transportation capacity supply and travel demands during the peak period [ T 0 , T 1 ] . During the loading process, the loading will change the distribution states of passenger flow. The generalized time utility U k , q of a route k which an involved passenger q chooses will be continually changing. The approach presented in this paper is based on the generation of the segment ridership which is then used to calculate the utilities of the routes in the optimization procedure. The best load balancing solution will be the output when all of the involved passengers have the minimum total travel time utility with no new overloaded segment(s) emerging. Therefore, an optimization model for the load balancing problem during peak hours can be formulated as follows.
min U ( n ) = k K q Q U k , q
subject to
U k , q = a A k ( 1 + α k , a ) t k , a in - vehicle + s S k t k , s dwell + l L k β k , l t k , l transfer + δ k
t k , l transfer = t k , l walk + t k , l wait
t k , l wait = H k / π
β k , l 1
α k , a = { 0 φ k , a 0.85 γ ( φ k , a 0.85 ) 0.85 < φ k , a < 1 φ k , a 1
φ k , a = V k , a ( n + 1 ) C k
C k = T 1 T 0 H k · m k · P k
V k , a ( n + 1 ) = V k , a ( n ) + ε f ( V i , η ( n ) )
ε = { 1 if   route   k   is   the   effective   alternative   route 1 if   route   k   is   the   congested   route
given
V s e c = { V 1 , V 2 , , V i , , V I }
R i = { r i , 0 , r i , 1 , r i , 2 , , r i , k , , r i , K }
where the objective function (2) aims at minimizing the total utility of all involved passengers. Equation (3) defines U k , q , the improved generalized time utility of route k which an involved passenger q chooses, and relates it to all the time elements with penalties levied on in-vehicle congestion and transfer(s) that a traveler spends for a trip in metro systems. U k , q is calculated using t k , a in - vehicle , t k , s dwell , t k , l transfer and other parameters, where t k , a in - vehicle is the rail-ride time along segment a , a A k ; t k , s dwell is the dwell time at passing station s , s S k ; and t k , l transfer denotes the transfer time at transfer station l , l L k . δ k is a constant term introduced to represent omitted factors other than t k , a in - vehicle , t k , s dwell and t k , l transfer , if any. Equations (4)–(5) indicate the transfer time at the transfer station l of route k which contains two parts: Average walking time for transferring t k , l walk and average waiting time t k , l wait at transfer station. β k , l in Constraint (6) is a penalty coefficient of transfer crowding and the undesirable walking at transfer stations which can be estimated from the travel surveys. Constraints (7)–(11) denote different load states on each segment, corresponding to the occupancy φ k , a of trains along segments which are determined by V k , a ( n + 1 ) and C k . The threshold values of 0.85 and 1 in Constraint (7) are set according to both the General Technical Specifications for Metro Vehicles (GB/T 7928-2003) [20] and the literature [3,4]. The ridership of segment(s) V k , a ( n + 1 ) is determined by constraint (10), in which f ( V i , η ( n ) ) is a nonlinear function of the segment ridership on the route with overloaded segment(s) denoted by η ( n ) . The specific form of function f is unknown. Two approaches can be used to determine the function f according to Abadi et al. [13]. One is to identify the non-linear terms of function f in a closed form which is very complicated and lack of effective identification schemes. Another is using simulation to estimate the segment ridership by processing available historical/real time ridership data which is computationally feasible and provide a much better accuracy. η ( n ) is a setting proportion for every loading and n is the number of iterations. Constraint (11) shows how the ridership should change between the route with overloaded segment(s) and effective alternative routes. Generally, t k , a in - vehicle , t k , s dwell , H k , m k , and P k are given by train timetables. t k , l walk is decided by the layout of the transfer station. If the arriving of passengers is uniform and the interval of train departure is fixed, t k , l wait often takes half the headway H k , i.e., π value for 2 [21]. V s e c in Equation (12) is a known quantity given by Huang et al. [22], and R i in Equation (13) is obtained using the method as mentioned above.
In order to evaluate the performance of the LB method, two indicators are defined to reflect the matching between train capacity and travel demands over all involved segments, including the penalty for crowding z 1 and the penalty for wasted capacity z 2 . During peak hours, (50%, 85%) is the reasonable range of the mean occupancy. When the mean occupancy exceeds the threshold of 85%, the train will become overcrowded, reducing the level of service. In addition, if the mean occupancy is less than 50%, it means that transportation capacity is surplus. To evaluate the train load balancing level, the two penalty terms can be calculated as follows.
z 1 = ω 1 k K a A max { 0 , V k , a C k × 85 % }
z 2 = ω 2 k K a A max { 0 , C k × 50 % V k , a }
where ω 1 is the penalty coefficient for crowding, and ω 2 means the penalty coefficient for the wasted capacity.

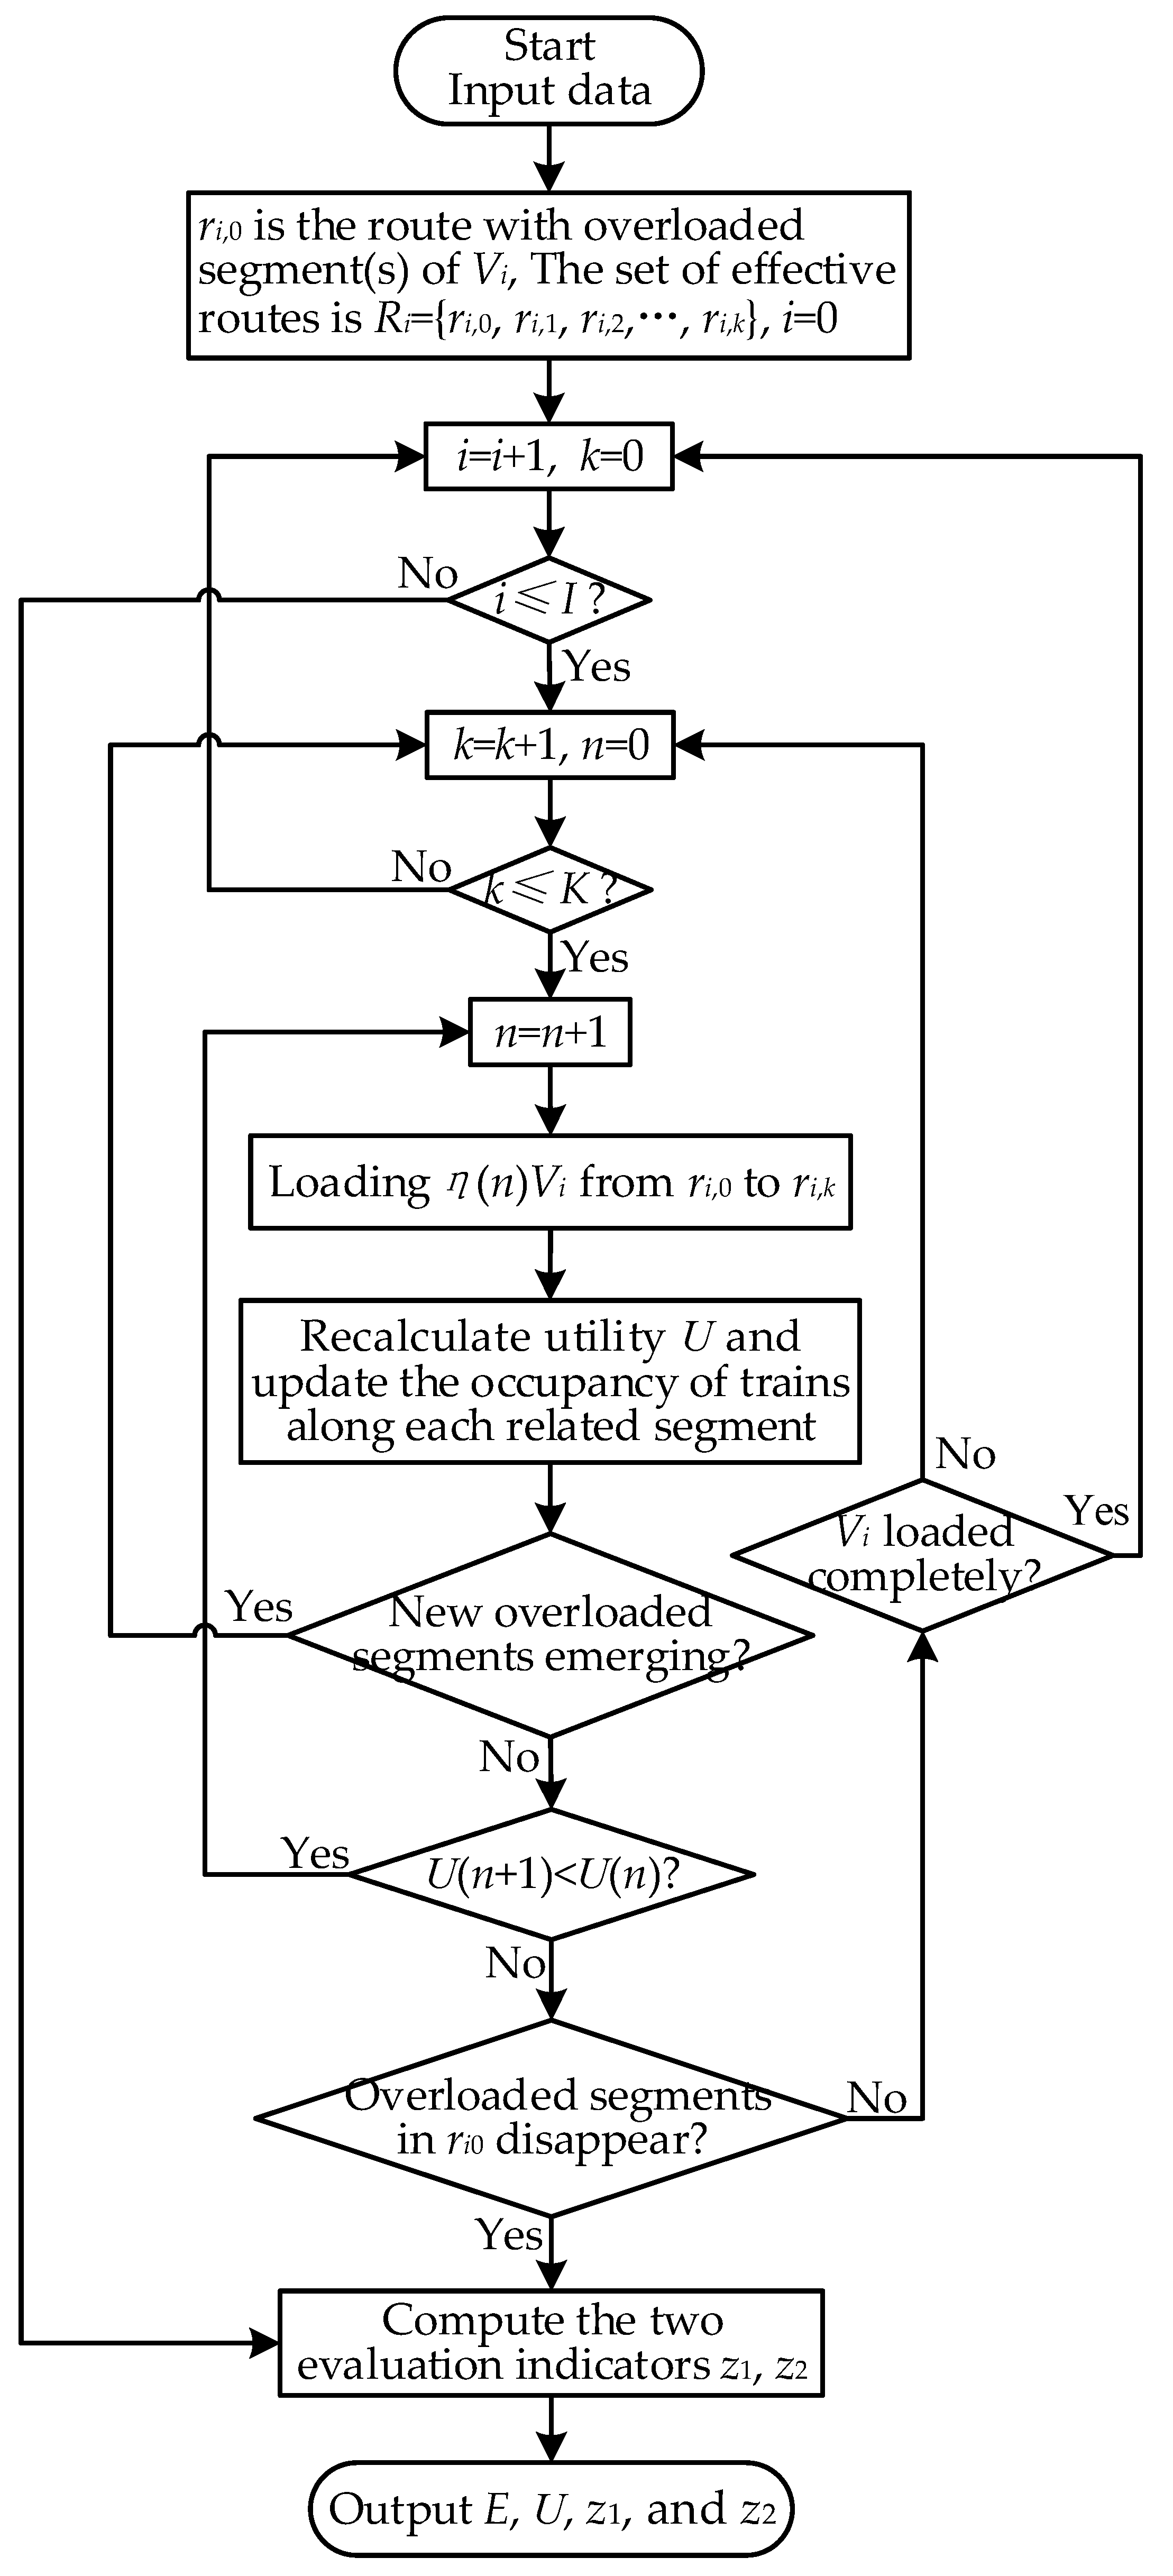
4.4 Algorithm of Load Balancing

In this section, a load balancing algorithm is presented to utilize available capacity more effectively to alleviate peak hour congestion in the metro network. The essence of the method is to search under-utilized alternative routes to share passenger loads on overloaded segment(s) with no new overloaded segment(s) emerging. The load balancing algorithm procedure is presented as follows.
Input data: (1) Train timetable data: t k , a in - vehicle , t k , s dwell , H k , m k , P k ; (2) Given data: T 0 , T 1 , V s e c , R i , π ; (3) Estimated data: t k , l walk , β k , l .
Output: load balancing solution E , the total travel utility U and two evaluation indicators z 1 , z 2 .
STEP 1: Input data, initialize i = 0 ;
STEP 2: i = i + 1 , if i I , initialize k = 0 , go to Step 3; Else, end;
STEP 3: k = k + 1 , if k K , initialize n = 0 , go to Step 4; Else, go to Step 2;
STEP 4: n = n + 1 ;
STEP 5: V i will be shifted from the route r i , 0 with overloaded segment(s) to an effective alternative route r i , k iteratively.
STEP 6: Since the loading will change the states of the network, the occupancy of trains along each relevant segment and the total travel time utility of involved passengers will be recalculated and updated after every loading.
STEP 7: During the loading process, if new overloaded segment(s) appears on r i , k , then the algorithm ends and goes back to Step 3; Else if no overloaded segment(s) appears on r i , k and the total travel time utility U ( n + 1 ) < U ( n ) , then the algorithm goes back to Step 4; Till up to U ( n + 1 ) U ( n ) , and if the overloaded segment(s) on r i , 0 disappears, then the algorithm ends and two evaluation indicators will be computed. Return with the load balancing solution E , U , z 1 , and z 2 .
STEP 8: If one loading finished, no new overloaded segment(s) arises and the overloaded segment(s) on r i , 0 still exists, once V i is loaded completely, the algorithm goes back to Step 2; else, the algorithm will go back to Step 3.
Figure 4 illustrates the process of the load balancing.

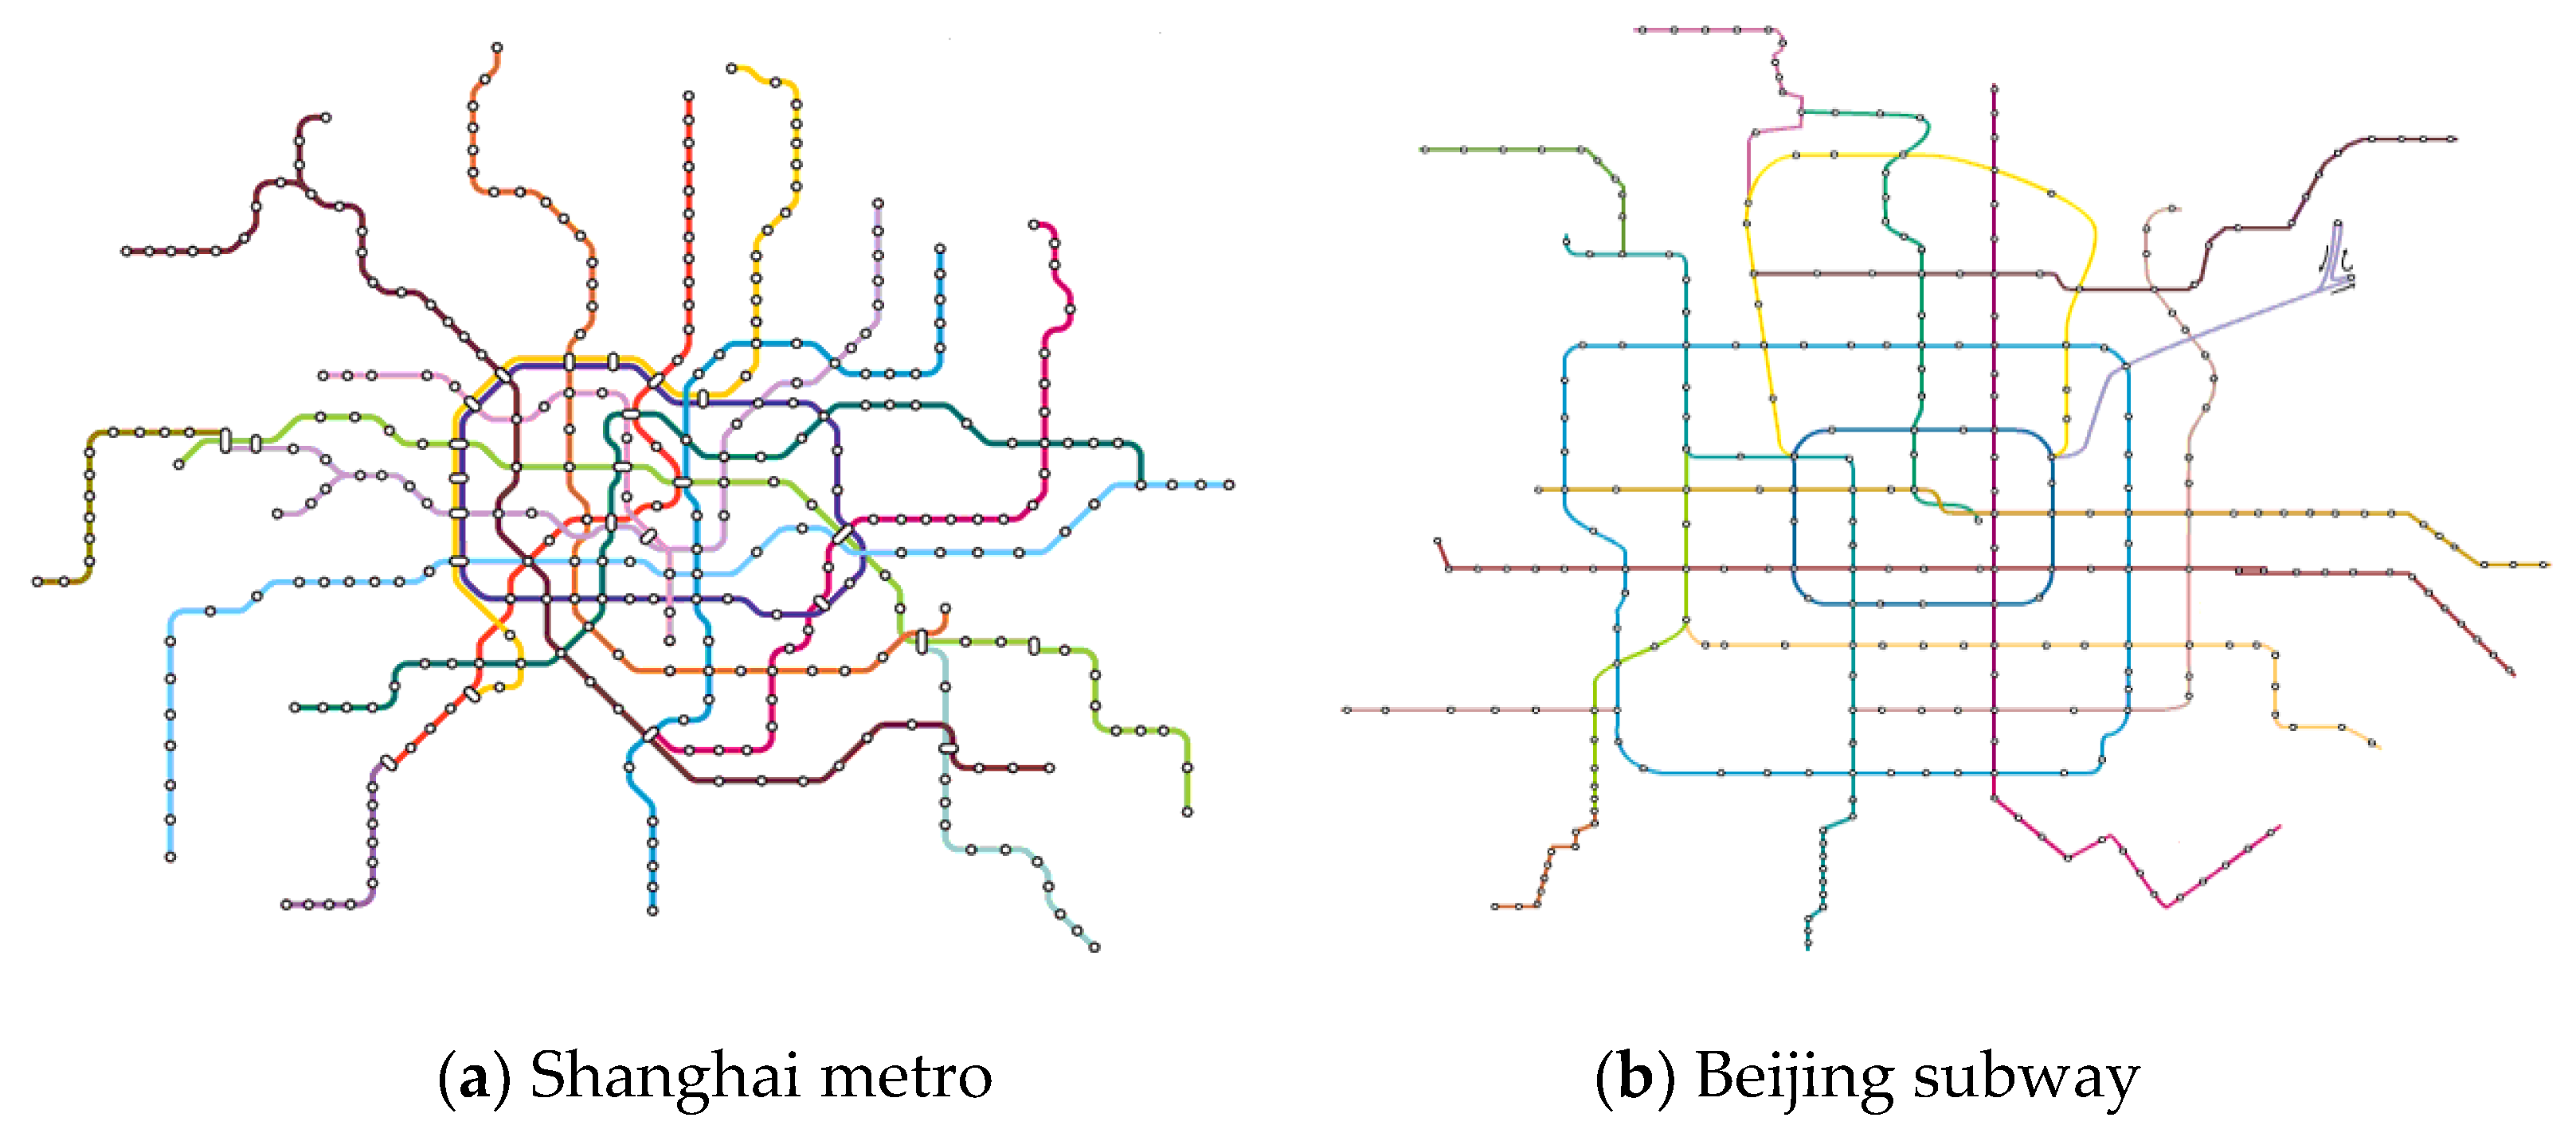
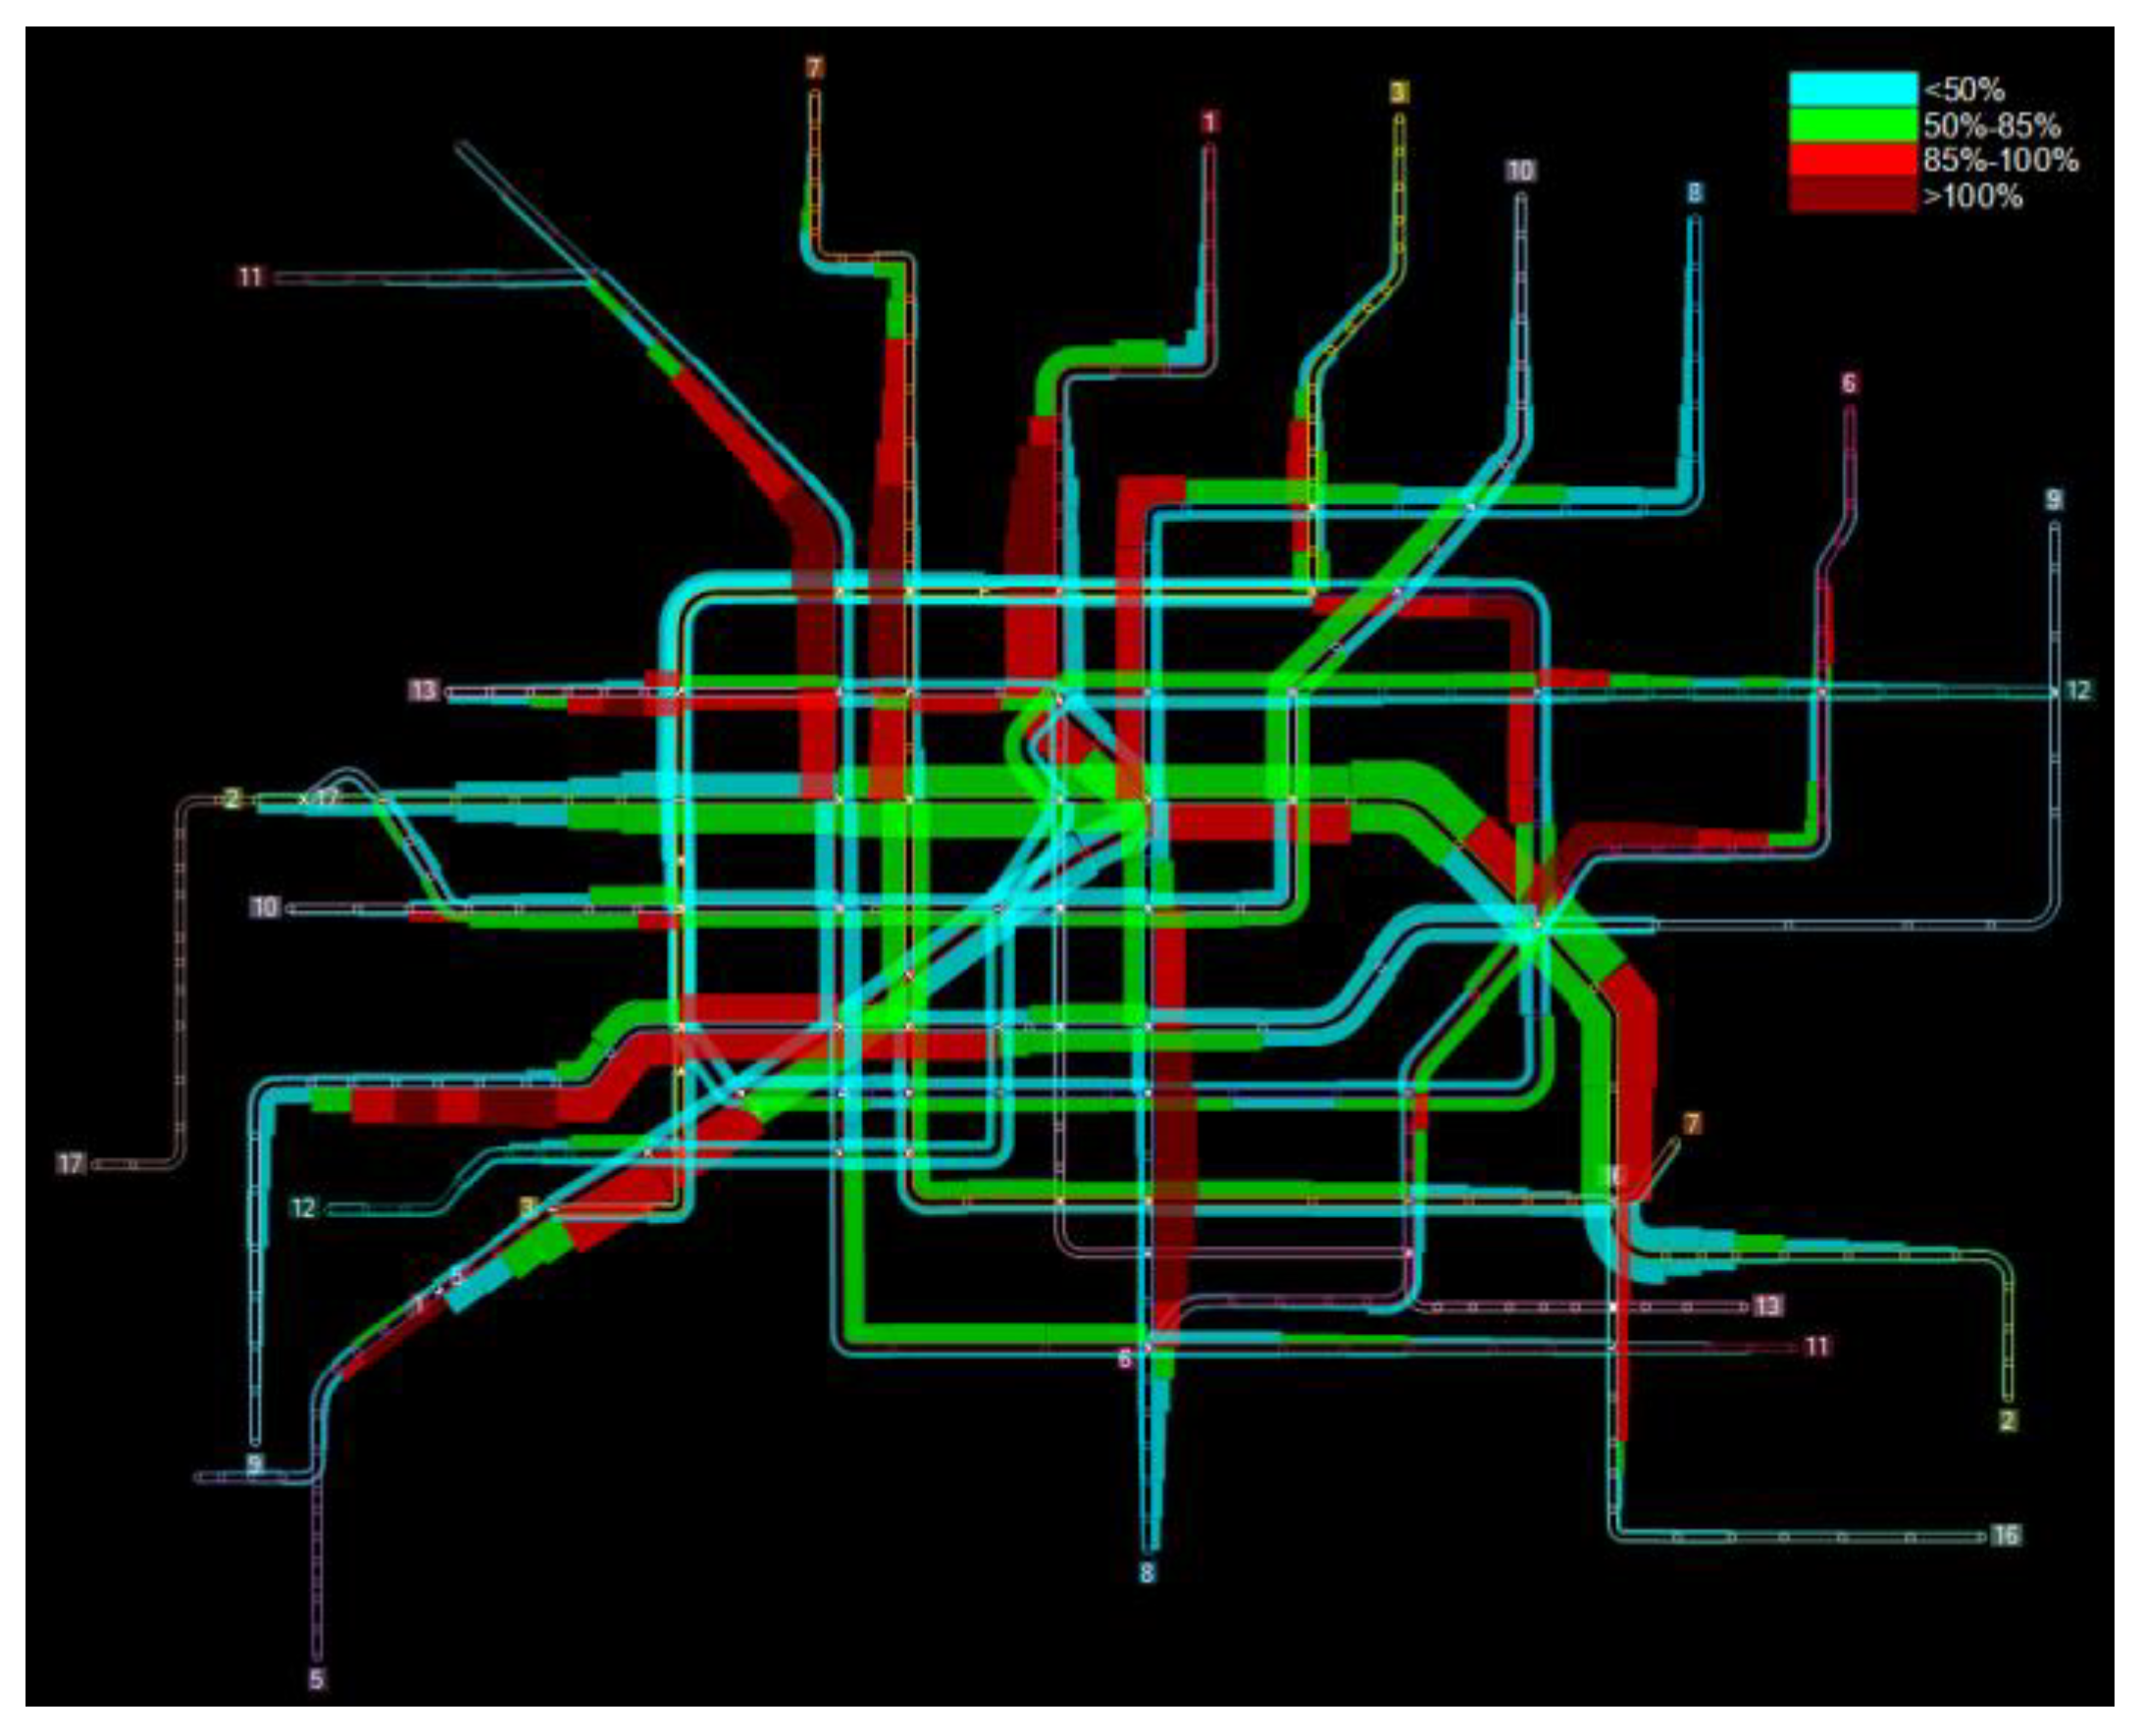
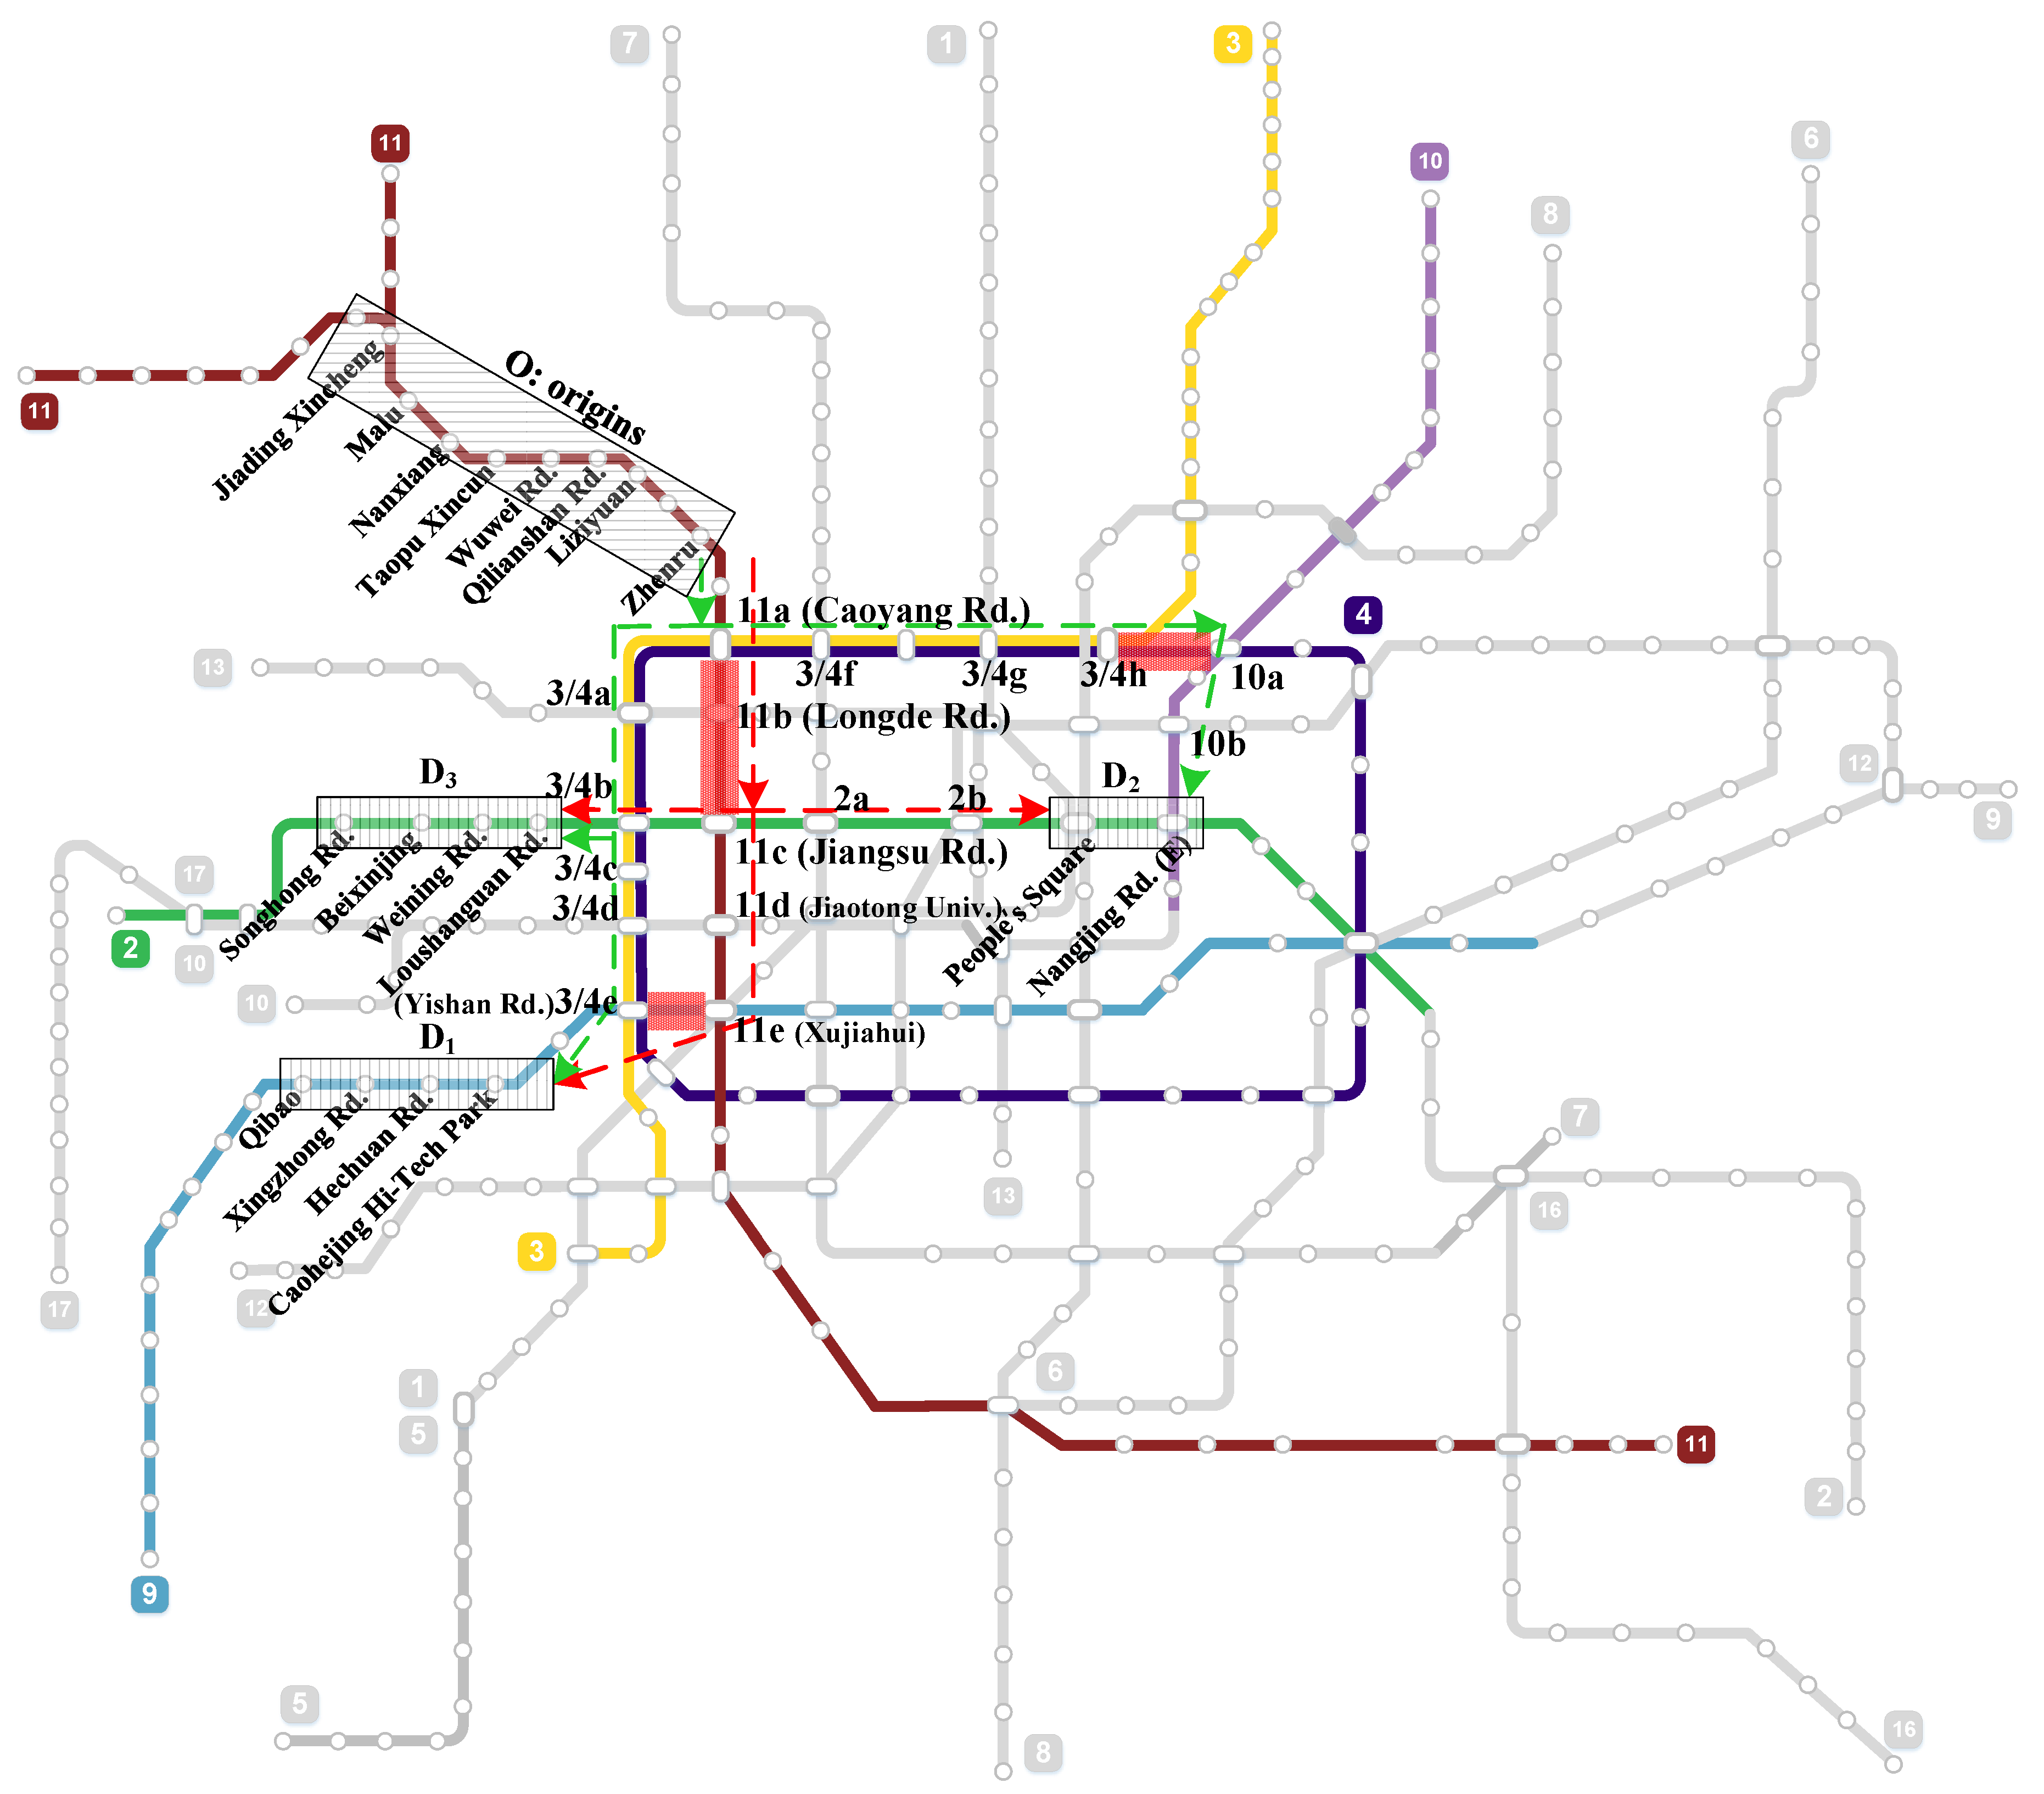
5. Case Study and Discussions

The LB approach as presented in this paper was evaluated and illustrated using a real-world case based on the Shanghai metro system. At the end of 2017, the Shanghai metro system consisted of 16 lines with 389 stations (see Table 2 and Figure 6). Due to huge travel demands of commuters, the Shanghai metro system had been exhibiting high occupancies during peak hours over many line segments of the metro network, as shown in Figure 5.
On 3 March 2016, during the morning peak period of 08:30–09:00, the mean occupancies of trains along segments Caoyang Rd.–Longde Rd.–Jiangsu Rd. (in the direction from Caoyang Rd. to Jiangsu Rd.) and Xujiahui–Yishan Rd. (from Xujiahui to Yishan Rd.) are 95.63%, 94.92%, and 97.64% respectively. Such occupancies far exceed the threshold of 85%. Hence, Caoyang Rd.–Longde Rd.–Jiangsu Rd., and Xujiahui–Yishan Rd. can be declared as overloaded segments. In Figure 6, all of the involved lines are colored, and all of the related stations are presented by numbers and letters (e.g., 11a). The overloaded segments 11a–11b–11c on Line 11 and 11e–3/4e on Line 9 are marked in red shadow boxes. The OD pairs and ridership causing the congestion on overloaded segments 11a–11b–11c in peak period of 08:30–9:00 have been acquired [22]. Among them, three clusters of OD pairs (OD1, OD2, OD3) and 41.07% of total ridership, have effective alternative routes and are shown in Figure 6, where red dotted lines represent the routes with overloaded segments and green dotted lines denote under-utilized alternative routes. The OD pairs, ridership and the set of effective alternative routes for testing the performance of load balancing method are provided in Table 3. Note that, the effective alternative route r 2 , 1 had an overloaded segment Baoshan Rd. (3/4h)–Hailun Rd. (10a) with an occupancy of 97.37%, so r 1 , 1 and r 3 , 1 are the preferential effective alternative routes used in the loading process.
Basic raw data about train operation are obtained from the train scheduled timetables used on 3 March 2016 which are provided by Operation Center of Shanghai Metro. The passenger travel data of the records of rail journeys are acquired from the Automatic Fare Collection Cleaning Centre (ACC) of Shanghai Metro. π value for 2 [21]. The waking time t k , l walk for transferring and β k , l adopted in the given model should be estimated in advance though the results of travel surveys conducted in the Shanghai metro system in peak periods on weekdays. Table 4 and Table 5 presents the values of parameters used in the model solution process, and values of the penalty coefficients for compute z 1 and z 2 are ω 1 =2 and ω 2 =1.
By applying the proposed LB approach, a load balancing block is developed in the prototype system using VB.net language to calculate the process of passenger flow load balancing. The load balancing block has to balance the relevant utilization by shifting passenger loads from oversaturated segments to less utilized alternatives. Once the stopping criterion is satisfied, the final load balancing solution is returned. A portion of the numerical calculation of simulation is shown in Table 6.
As one can see in Table 7, the load balancing solution is presented. Afterwards, to verify the validity of the methodologies, a comparative analysis before and after the LB was also conducted, where the values of the total travel generalized time, penalty for crowdedness, and penalty for wasted capacity are listed in Table 8. Additionally, the benefits of the solution obtained by optimization method were presented via the relative deviations of the optimal results from the no balancing results. The occupancy of trains along all involved segments are shown in Figure 7. As can be clearly seen, with load balancing, the total travel generalized time of involved passengers was reduced by 0.6%, which is a slight decrease. The penalty for crowdedness was reduced by 71.54%, so it can prove that the LB method presented in this paper can effectively alleviate the overcrowding situation. However, the penalty for wasted capacity increases by 8.79%, but this loss can easily be compensated by other benefits. For the overloaded segments marked in circles in Figure 7, their occupancies effectively drop to 85%. In other words, the overcrowding on segments between Caoyang Rd.–Longde Rd.–Jiangsu Rd. and Xuijiahui–Yishan Rd. were effectively alleviated to a great extent.

6. Perspectives in the Smart Metro Systems

Nowadays, in the Shanghai metro system, Beijing subway or other metro systems in China, mobile internet technology, artificial intelligence (AI), and other advanced technologies have been widely used to help trips in the metro system to be made in a more and more intelligent way. Some metro lines are even automatic without drivers. One can pay online using a smartphone when passing the gates. Wi-Fi is available at every corner of the station, even when the trains are running underground. With tracks being obtained from the available data of cellphone signals and the Wi-Fi being used, every user’s trip can be accurately estimated and the distribution of the demands in the network can also be reliably forecasted throughout the day.
From the methodologies developed and numerical examples presented in this paper, it is possible to disperse travel demands to reduce the peak hour congestion. For the final load balancing solution to be effectively used and applied to the actual active demand management in the real world, some proactive inducing schemes are discussed in this section.
  • An Application (APP) downloaded onto the smartphone will be helpful. For passengers, when overcrowded stations and segments are made available and shown, it can greatly help inform users to take an under-utilized route among all effective ones and allow passengers to reserve their trips ahead of time to avoid congested segments. For metro operation and management related enterprises, it is a real-time information broadcasting platform which can be effectively leveraged and developed to directly deliver important messages to passengers.
  • A route pricing strategy can be another novel scheme to balance the travel demands in a metro system. A stated preference survey has been conducted in morning peak hours in the Shanghai metro system. Preliminary analysis of the results shows that more than 40% of commuters would choose a slightly longer but less crowded route [23]. If passengers shift their travels to a less heavily utilized routes in peak hours, they should be incentivized and rewarded (e.g., free of charge). It should be noted that, the incentives will need to be dynamically adjusted to the level of congestion on the segments in the metro network.
Peak hour congestion is a collective issue created by individual behavior. Such proactive inducing schemes, other than coercive measures at the cost of users’ satisfaction, can be positively leveraged to mitigate the congestion on those overloaded segments by influencing personal travel behavior decisions.

7. Conclusion

Congestion in the metro systems is an issue of imbalance between the supply and demand in principle due to a large number of passengers demanding for a limited amount of capacity in peak hours. The passenger flow distribution in the metro network from the demand-side should be effectively managed. Aimed at improving service quality to passengers traveling in rush hours, this paper presents an LB method to shift loads from oversaturated segment(s) to under-utilized effective alternative routes. Based on the multi-path accessibility of a complex metro system, a set of effective alternative routes are searched using the deletion algorithm. Then, a load balancing solution is obtained when the iterative process satisfies the stopping criterion. A numerical experiment based on a real-world example of the Shanghai metro system is conducted to demonstrate the flexibility and validity of the proposed approach. The results are verified in that the LB method can effectively reduce penalty for crowdedness and the occupancy of trains along overloaded segment(s) in peak hours, leading to improved safety and comfort of the metro system. For the final load balancing solution to be effectively applied in practice, two practical inducing schemes are also discussed.
As the line of research matures, further research will focus on how to reduce congestion on the overloaded segment(s) without effective alternative routes. The method proposed cannot be applied to the overloaded segment(s) in which the passenger flow is mostly composed of traveling only on one line since there are no effective alternative routes. Therefore, to mitigate the network congestion completely, some supplemental methods and measures are necessary in future research. Furthermore, more accurate ridership data should be applied to verify the presented approach since the AFC data may have some drawbacks in estimating the ridership on segments.

Author Contributions

Conceptualization, R.X., Z.H. and F.Z.; Methodology, Z.H.; Software, F.Z.; Formal analysis, Z.H.; Investigation, Z.H.; Data curation, W.L.; Project administration, R.X.; Supervision, R.X.; Funding acquisition, R.X.; Writing—original draft preparation, Z.H.; Writing—review and editing, W.F.

Funding

This research was funded by the Research Project of Shanghai Science and Technology Commission, grant number 16DZ1203802; and International Exchange Program for Graduate Students, Tongji University, grant number 2018020027.

Acknowledgments

The acquisition of data in the paper is supported by the Shanghai Shentong Metro Group Co., Ltd. The authors are very grateful for this support. Special thanks to all anonymous reviewers for their helpful comments.

Conflicts of Interest

The authors declare no conflict of interest.

References

  1. Kim, K.M.; Hong, S.-P.; Ko, S.J.; Kim, D. Does crowding affect the path choice of metro passengers? Transp. Res. Part A: Policy Pract. 2015, 77, 292–304. [Google Scholar] [CrossRef]
  2. Li, S.M.; Wong, F.C.L. The effectiveness of differential pricing on route choice: the case of the mass transit railway of Hong Kong. Transportation 1994, 21, 307–324. [Google Scholar] [CrossRef]
  3. Raveau, S.; Munoz, J.C.; Grange, L.D. A topological route choice model for metro. Transp. Res. Part A: Policy Pract. 2011, 45, 138–147. [Google Scholar] [CrossRef]
  4. Raveau, S.; Guo, Z.; Muñoz, J.C.; Wilson, H.M.N. A behavioural comparison of route choice on metro networks: Time, transfers, crowding, topology and socio-demographics. Transport. Res. Part A: Policy Pract. 2014, 66, 185–195. [Google Scholar] [CrossRef]
  5. Zhao, P.; Yao, X.M.; Yu, D.D. Cooperative passenger inflow control of urban mass transit in peak hours. J. Tongji Univ. (nat. sci.) 2014, 42, 1340–1346. [Google Scholar]
  6. Yao, X.M.; Zhao, P.; Qiao, K.; Yu, D.D. Modeling on coordinated passenger inflow control for urban rail transit network. J. Cent. South Univ. (Sci. Technol.) 2015, 46, 342–350. [Google Scholar]
  7. Li, S.K.; Dessouky, M.M.; Yang, L.X.; Gao, Z.Y. Joint optimal train regulation and passenger flow control strategy for high-frequency metro lines. Transp. Res. Part B: Method. 2017, 99, 113–137. [Google Scholar] [CrossRef]
  8. Shi, J.G.; Yang, L.X.; Yang, J.; Gao, Z.Y. Service-oriented train timetabling with collaborative passenger flow control on an oversaturated metro line: An integer linear optimization approach. Transp. Res. Part B: Method. 2018, 110, 26–59. [Google Scholar] [CrossRef]
  9. Xu, X.Y.; Liu, J.; Li, H.Y.; Jiang, M. Capacity-oriented passenger flow control under uncertain demand: Algorithm development and real-world case study. Transp. Res. Part E: L. Transp. Rev. 2016, 87, 130–148. [Google Scholar] [CrossRef]
  10. Jiang, Z.B.; Fan, W.; Liu, W.; Zhu, B.Q.; Gu, J.J. Reinforcement learning approach for coordinated passenger inflow control of urban rail transit in peak hours. Transp. Res. Part C: Emerging Technol. 2018, 88, 1–16. [Google Scholar] [CrossRef]
  11. Si, B.F.; Mao, B.H.; Liu, Z.L. Passenger flow assignment model and algorithm for urban railway traffic network under the condition of seamless transfer. J. Ch. Railw. Soc. 2007, 29, 12–18. [Google Scholar]
  12. Zhu, W.; Hu, H.; Xu, R.H.; Hong, L. Modified stochastic user-equilibrium assignment algorithm for urban rail transit under network operation. J. Cent. South Univ. Engl. Ed. 2013, 20, 2897–2904. [Google Scholar] [CrossRef]
  13. Abadi, A.; Ioannou, P.A.; Dessouky, M.M. Multimodal dynamic freight load balancing. IEEE Transactions Intelli. Transp. Syst. 2016, 17, 356–366. [Google Scholar] [CrossRef]
  14. Whelan, G.; Jon, C. An investigation of the willingness to pay to reduce rail overcrowding. In Proceedings of the first International Conference on Choice Modelling, Harrogate, England, 30 March–1 April 2009. [Google Scholar]
  15. Li, Z.; Hensher, D.A. Crowding and public transport: A review of willingness to pay evidence and its relevance in project appraisal. Transp. Policy 2011, 18, 880–887. [Google Scholar] [CrossRef]
  16. Feng, J.; Xu, Q.; Li, X.M.; Yang, Y.Z. Complex network study on urban rail transit systems. J. Transp. Syst. Eng. Inf. Technol. 2017, 17, 242–247. [Google Scholar]
  17. Rosenbloom, S. Peak-period traffic congestion: A state-of-the-art analysis and evaluation of effective solutions. Transportation 1978, 7, 167–191. [Google Scholar] [CrossRef]
  18. Bai, Y.; Liu, J.F.; Sun, Z.Z.; Mao, B.H. Analysis on route choice behavior in seamless transfer urban rail transit network. In Proceedings of the IEEE International Workshop on Modelling, Simulation and Optimization, Hong Kong, China, 27–28 December 2008; pp. 264–267. [Google Scholar]
  19. Xu, R.H.; Luo, Q.; Gao, P. Passenger flow distribution model and algorithm for urban rail transit network based on multi-route choice. J. Ch. Railw. Soc. 2009, 31, 110–114. [Google Scholar]
  20. National Standardization Administration of China. General technical specification for metro vehicles. 2003. Available online: http://www.gb688.cn/bzgk/gb/newGbInfo?hcno=657AECE6BFA031382A2645D61363896C (accessed on 5 December 2003).
  21. Cea, J.D.; Fernández, E. Transit assignment for congested public transport systems: An equilibrium model. Transp. Sci. 1993, 27, 133–147. [Google Scholar] [CrossRef]
  22. Huang, Z.Y.; Xu, R.H.; Zhou, F.; Xu, T.J. Estimation method of section passenger flow composition for metro network with constraints of time and route. J. Tongji Univ. (nat. sci.) 2018, 46, 920–925. [Google Scholar]
  23. Xu, R.H.; Huang, Z.Y.; Zhou, F.; Li, C.F. Does differential pricing affect route choice of the peak hour metro passengers? A case study in Shanghai metro system. In Proceedings of the IEEE International Conference on Intelligent Rail Transportation, Singapore, 12–14 December 2018; pp. 1–5. [Google Scholar]
Figure 1. Double-load network illustration of the Shanghai metro system.
Sustainability 11 01293 g001
Figure 2. Overview of the load balancing approach.
Sustainability 11 01293 g002
Figure 3. Physical topology of Shanghai metro (a) and Beijing subway (b).
Sustainability 11 01293 g003
Figure 4. The algorithmic procedure to generate the load balancing solution.
Sustainability 11 01293 g004
Figure 5. Occupancy of trains on all segments in Shanghai Metro system in morning peak.
Sustainability 11 01293 g005
Figure 6. Origin-Destination (OD) pairs and effective routes in network topology of the Shanghai metro system.
Sustainability 11 01293 g006
Figure 7. Changes of occupancy before and after LB.
Sustainability 11 01293 g007
Table 1. Relevant sets, parameters, and variables.
SymbolsDefinition
V sec Set of OD ridership loaded on overloaded segment(s);
V i Ridership of OD pair i , V i V sec ;
R i Set of efficient routes between OD pair i indexed by k ;
r i , k Efficient route between OD pair i , r i , k R i ; If k = 0 , r i , 0 is the route of V i which includes overloaded segment(s), otherwise, r i , k is the effective alternative route of r i , 0 ;
[ T 0 , T 1 ] Study peak period;
Q Set of involved passengers indexed by q ;
U k , q Generalized time utility of route k chosen by passenger q ;
V k , a Ridership loading on segment a on route k ;
t k , a in - vehicle In-vehicle-movement time along segment a on route k ;
t k , s dwell Dwell time at passing station s on route k ;
t k , l transfer Transfer time at transfer station l on route k , t k , l = t k , l walk + t k , l wait ;
t k , l walk Walking time at transfer station l on route k ;
t k , l wait Waiting time at transfer station l on route k ;
C k Train capacity of route k ;
H k Headway between trains on route k ;
P k Rated passenger capacity of per train car on route k ;
m k Number of trains marshalling on route k ;
β k , l Penalty coefficient of transfer crowding and the undesirable walking at transfer station l on route k ;
φ k , a Occupancy of trains along segment a on route k;
αk,aPenalty coefficient of in-vehicle crowding on segment a on route k;
εBinary variable; If route k is the route with overloaded segment(s), then ε = −1; otherwise, ε = 1.
Table 2. An overview of two metro systems in China.
SystemShanghai MetroBeijing Subway
Lines1622
Stations389370
Transfers5253
Length (km)666608
Maximum daily ridership (million)12.35510.52
Minimum headway in peak hours75s70s
Note: As of 3/16/2018.
Table 3. Input data for load balancing (LB).
OD Pair(s)RidershipRoute with Overloaded SegmentsEffective Alternative Route
OD1 V 1 = 3169 r 1 , 0 : O→11a→11c→11e→D1 r 1 , 1 : O→11a→3/4a→3/4e→D1
OD2 V 2 = 2874 r 2 , 0 : O→11a→11c→D2 r 2 , 1 : O→11a→3/4h→10a→D2
OD3 V 3 = 1500 r 3 , 0 : O→11a→11c→3/4b→D3 r 3 , 1 : O→11a→3/4a→3/4b→D3
Table 4. Parameters of train operation during the morning peak period of 08:30–09:00.
LineNumber of Trains Marshalling m k Rated Capacity P k (Passengers/Car) Headway H k (s) Correction Factor π
Line 283101802
Line 3–463101502
Line 463103002
Line 963102252
Line 1063102002
Line 1163101802
Table 5. Parameters of involved transfer stations.
Involved TransfersTransfer DirectionWalking Time for Transferring t k , l walk (s) Penalty Coefficient β k , l
Caoyang Rd. (11a)From Line 11 to Line 3/42061.67
Jiangsu Rd. (11c)From Line 11 to Line 22202.95
Xujiahui (11e)From Line 11 to Line 92201.86
Zhongshan Park (3/4b)From Line 3/4 to Line 22712.13
Yishan Rd. (3/4d)From Line 3/4 to Line 93542.19
Hailun Rd. (10a)From Line 4 to Line 101501.50
Table 6. Numerical calculation of the LB process.
IterationRoute with Overloaded SegmentsEffective Alternative Route
The Occupancy of Trains Along Involved Segments (%)
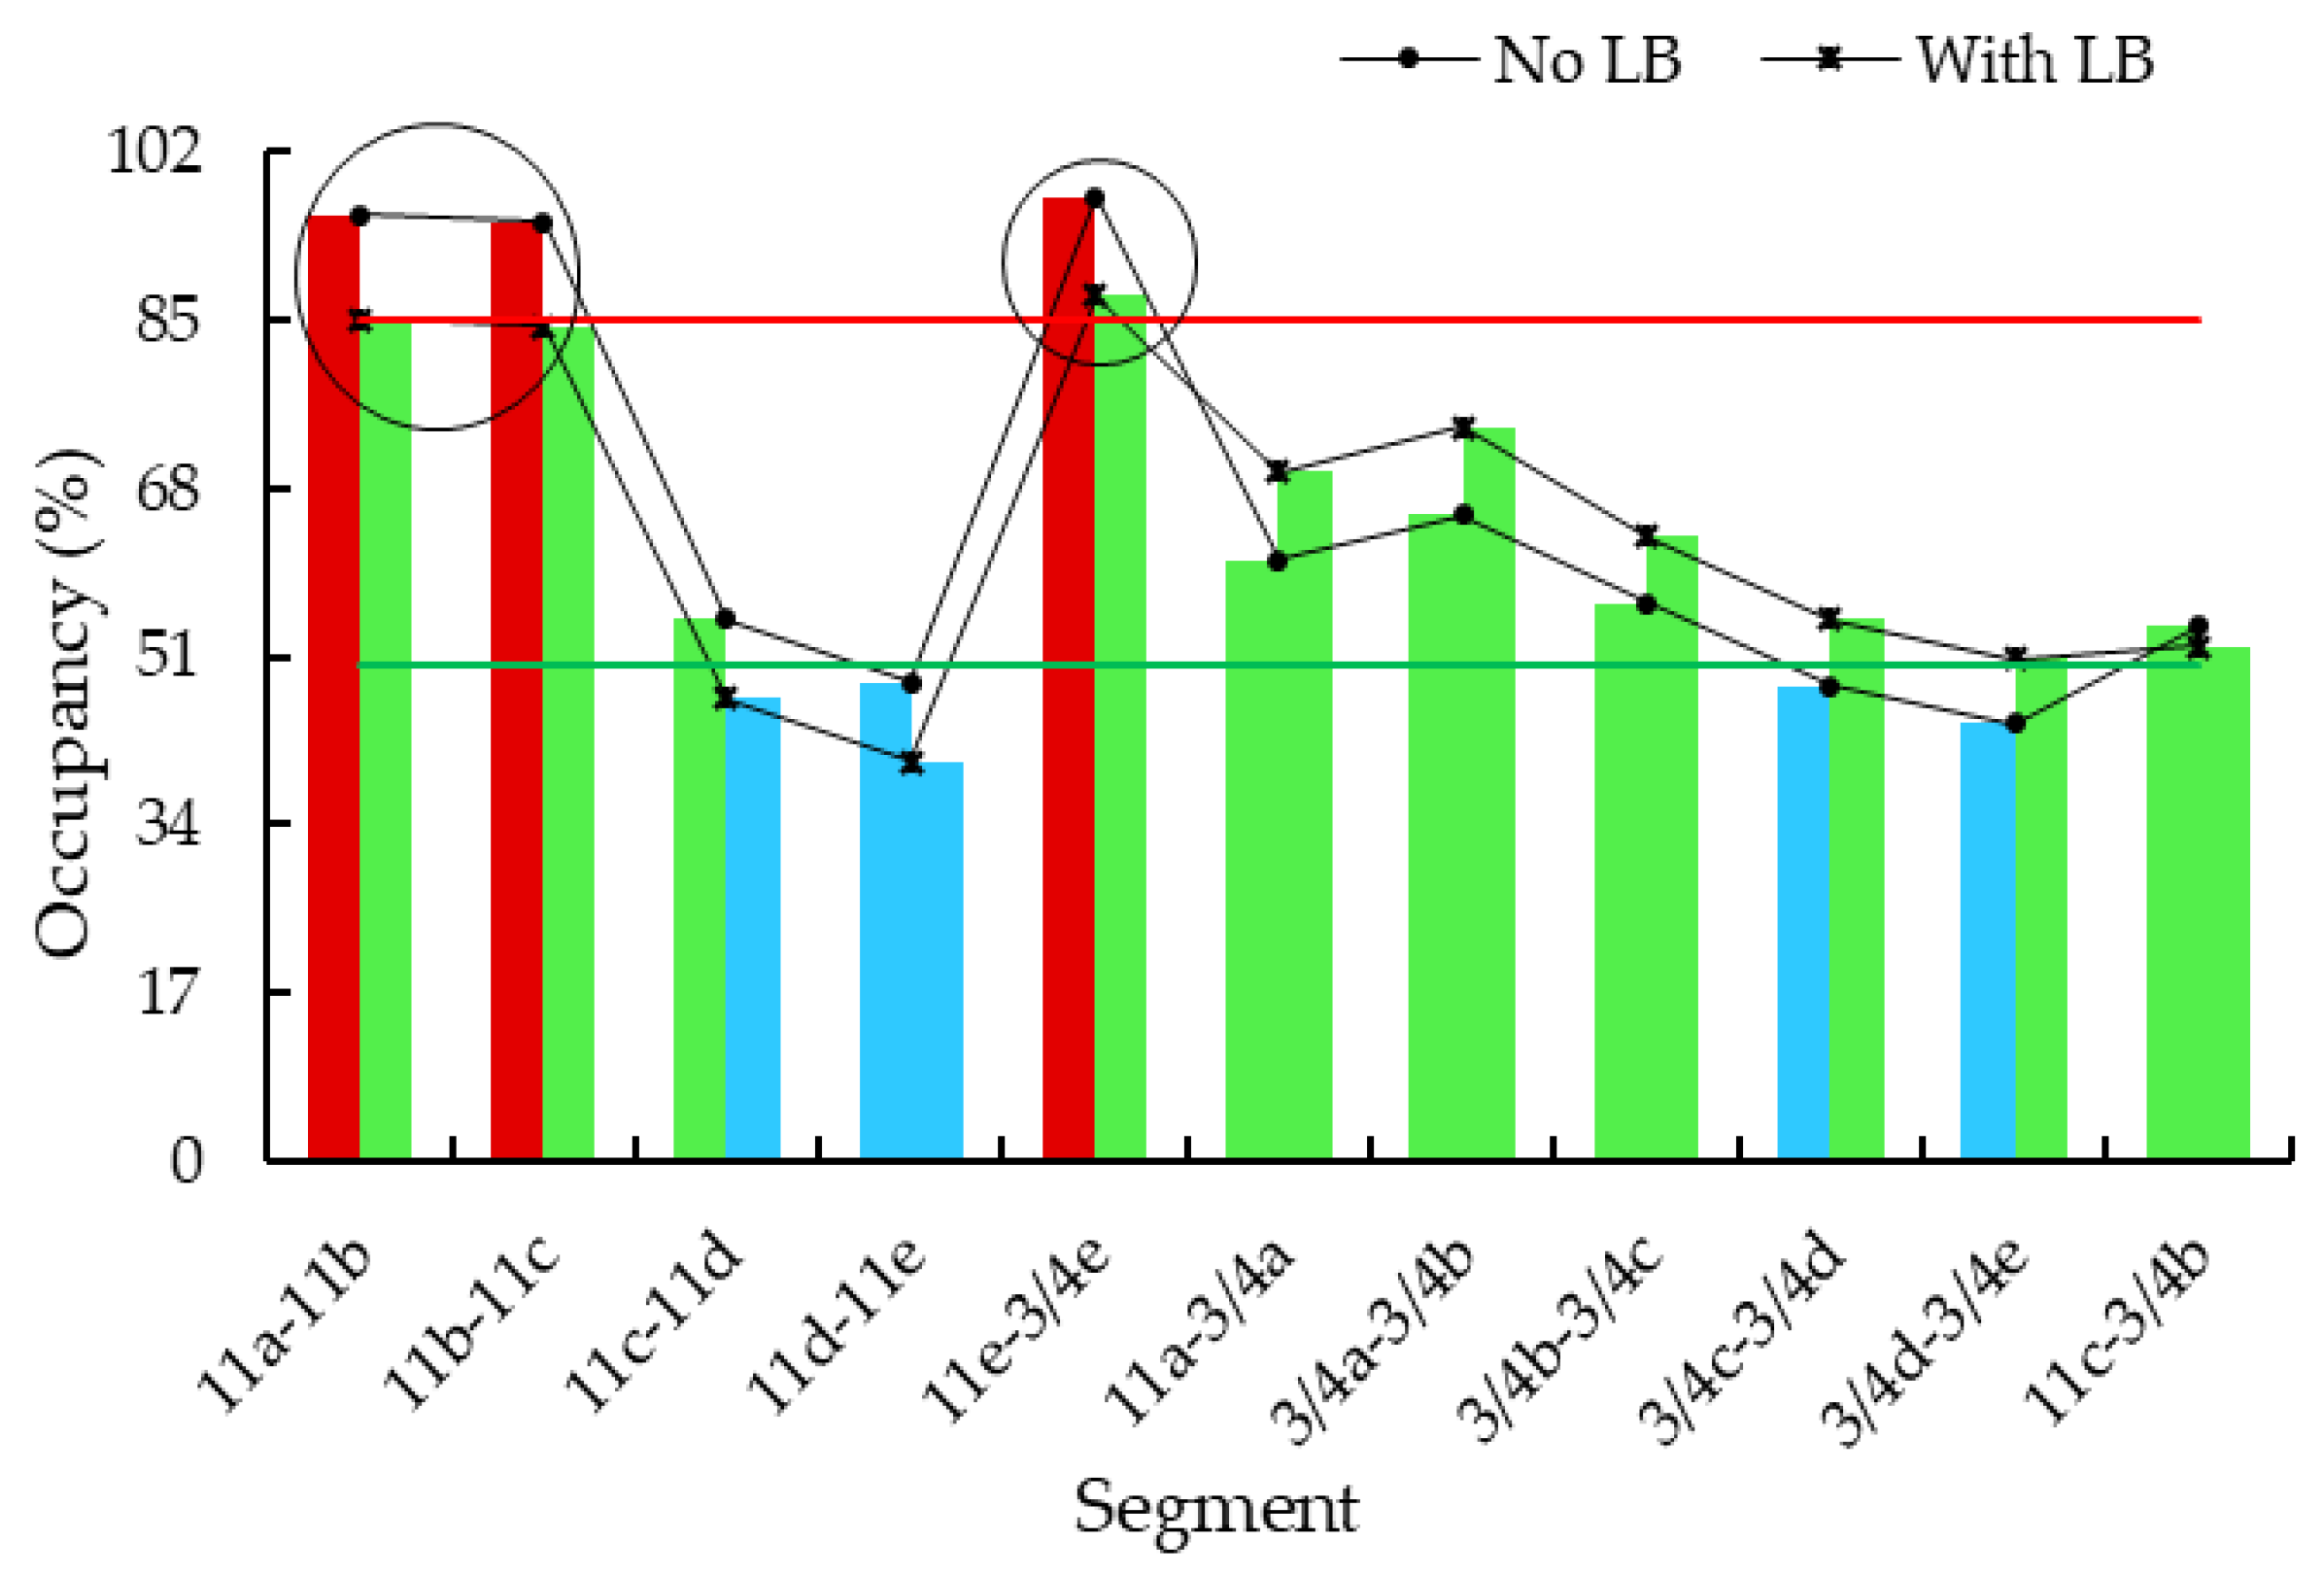
Load V1 from V1,0 to the under-utilized route V1,1
n11a–11b11b–11c11c–11d11d–11e11e–3/4e11a–3/4a3/4a–3/4b3/4b–3/4c3/4c–3/4d3/4d–3/4e
095.6394.9154.7248.3497.4660.7065.3656.4548.0644.17
194.5593.8453.6447.2696.1261.6066.2557.3448.9745.06
291.3390.6150.4144.0492.0864.2968.9460.0351.6547.75
2089.1888.4648.2641.8989.4066.0870.7361.8253.4549.54
4088.1087.3947.1940.8188.0566.9871.6362.7254.3450.44
4187.8387.1246.9240.5487.7267.2071.8562.9454.5750.66
4287.6386.9246.7240.3487.4767.3772.0263.1154.7350.83
The total travel time utility reaches the minimum and r 1 , 0 only has one effective alternative route. Therefore, the loading of V 1 ends.
Continue to load V 3 from r 3 , 0 to the under-utilized route r 3 , 1
n11a–11b11b–11c11c–3/4b11a–3/4a3/4a–3/4b
087.6386.9254.0167.3772.02
187.1086.3853.6067.8172.46
286.0285.3152.8068.7173.36
1085.4884.7752.4069.1673.81
2485.3584.6352.2969.2773.92
2585.2284.5052.1969.3874.03
2685.0184.2952.0469.5674.21
The total travel time utility reaches the minimum. The overloaded segments disappear without new overloaded segments emerging. As such, the load balancing solution is returned.
Table 7. Load balancing solution.
Ridership for LoadingRoutes for Balancing
1487From r1,0 to r1,1
489From r3,0 to r3,1
Table 8. Performance comparison before and after LB.
IndictorNo LBWith LBVariations
Total travel generalized time (h)4070.82664046.5331−0.60%
Penalty for crowdedness14,8364222−71.54%
Penalty for wasted capacity41394503+8.79%

