Debt Risk Evaluation of Toll Freeways in Mainland China Using the Grey Approach

1
School of Economics and Management, Chang’an University, Xi’an 710064, China
2
Department of Civil and Environmental Engineering, University of Waterloo, Waterloo, ON N2L 3G1, Canada
3
Transport Planning and Research Institute, Ministry of Transport, Beijing 100028, China
4
China Merchants Expressway Network & Technology Holdings Co., Ltd., Beijing 100022, China
*
Author to whom correspondence should be addressed.
Sustainability 2019, 11(5), 1430; https://0-doi-org.brum.beds.ac.uk/10.3390/su11051430
Submission received: 3 February 2019
/
Revised: 21 February 2019
/
Accepted: 4 March 2019
/
Published: 7 March 2019
(This article belongs to the Special Issue Developments in Risk Measurement, with Applications in Climate Change Finance and Economics)
Abstract
:With a proactive loan policy to raise construction funds, a large number of toll freeways have been built in Mainland China in the past three decades. However, it brought about a long-term heavy debt burden for most provincial governments. To ensure financial sustainability of toll freeways, an accurate and appropriate debt risk evaluation has become necessary. This research aims to explore debt risk factors and calculate the overall debt risk levels of toll freeways using the grey approach. Debt risk factors were identified as belonging to five categories—debt scale, debt structure, debt management, external environment, and solvency—and three new debt risk factors were added for specific concern of toll freeways—toll revenue, free cash flow, and earnings before interest, tax, depreciation, and amortization (EBITDA) margin. Debt risk levels of toll freeways in 29 provinces in Mainland China were evaluated by the proposed method and classified into three groups–low debt risk, medium debt risk, and high debt risk according to grey possibility degree ranges. Calculation results show that six provinces have low debt risk, 10 provinces have medium debt risk, and 13 provinces have high debt risk. Additionally, some specific policies to reduce toll freeway debt risk were provided based on the evaluation findings.
1. Introduction
Toll freeways in Mainland China have attracted widespread attention, especially the financial issue [1]. Due to the support of the Chinese government, toll freeway networks in Mainland China had a rapid expansion, boosting economic development greatly in the past three decades. A toll freeway network scale of almost 133,000 kilometers had been built by the end of 2017, ranking first in the world. As a large public infrastructure, the construction of freeways needs a large amount of capital invested by the government; however, local government finance usually cannot afford such huge expenditures. To solve the problem of insufficient financial funds, the Chinese government has adopted a proactive loan policy, which allows provincial governments to obtain loans from banks to raise funds for the construction of toll freeways, and the permitted debt ratio of total construction investment for a single freeway project can be a maximum of 65%. The proactive loan policy relieves financial pressure effectively in the short-term but brings about a long-term heavy debt burden for most provincial governments. Actually, as much as 63% of the total freeway investment relies on short- and long-term loans from banks, and the total debt of toll freeways in Mainland China that needs to be repaid is more than US$ 700 billion so far.
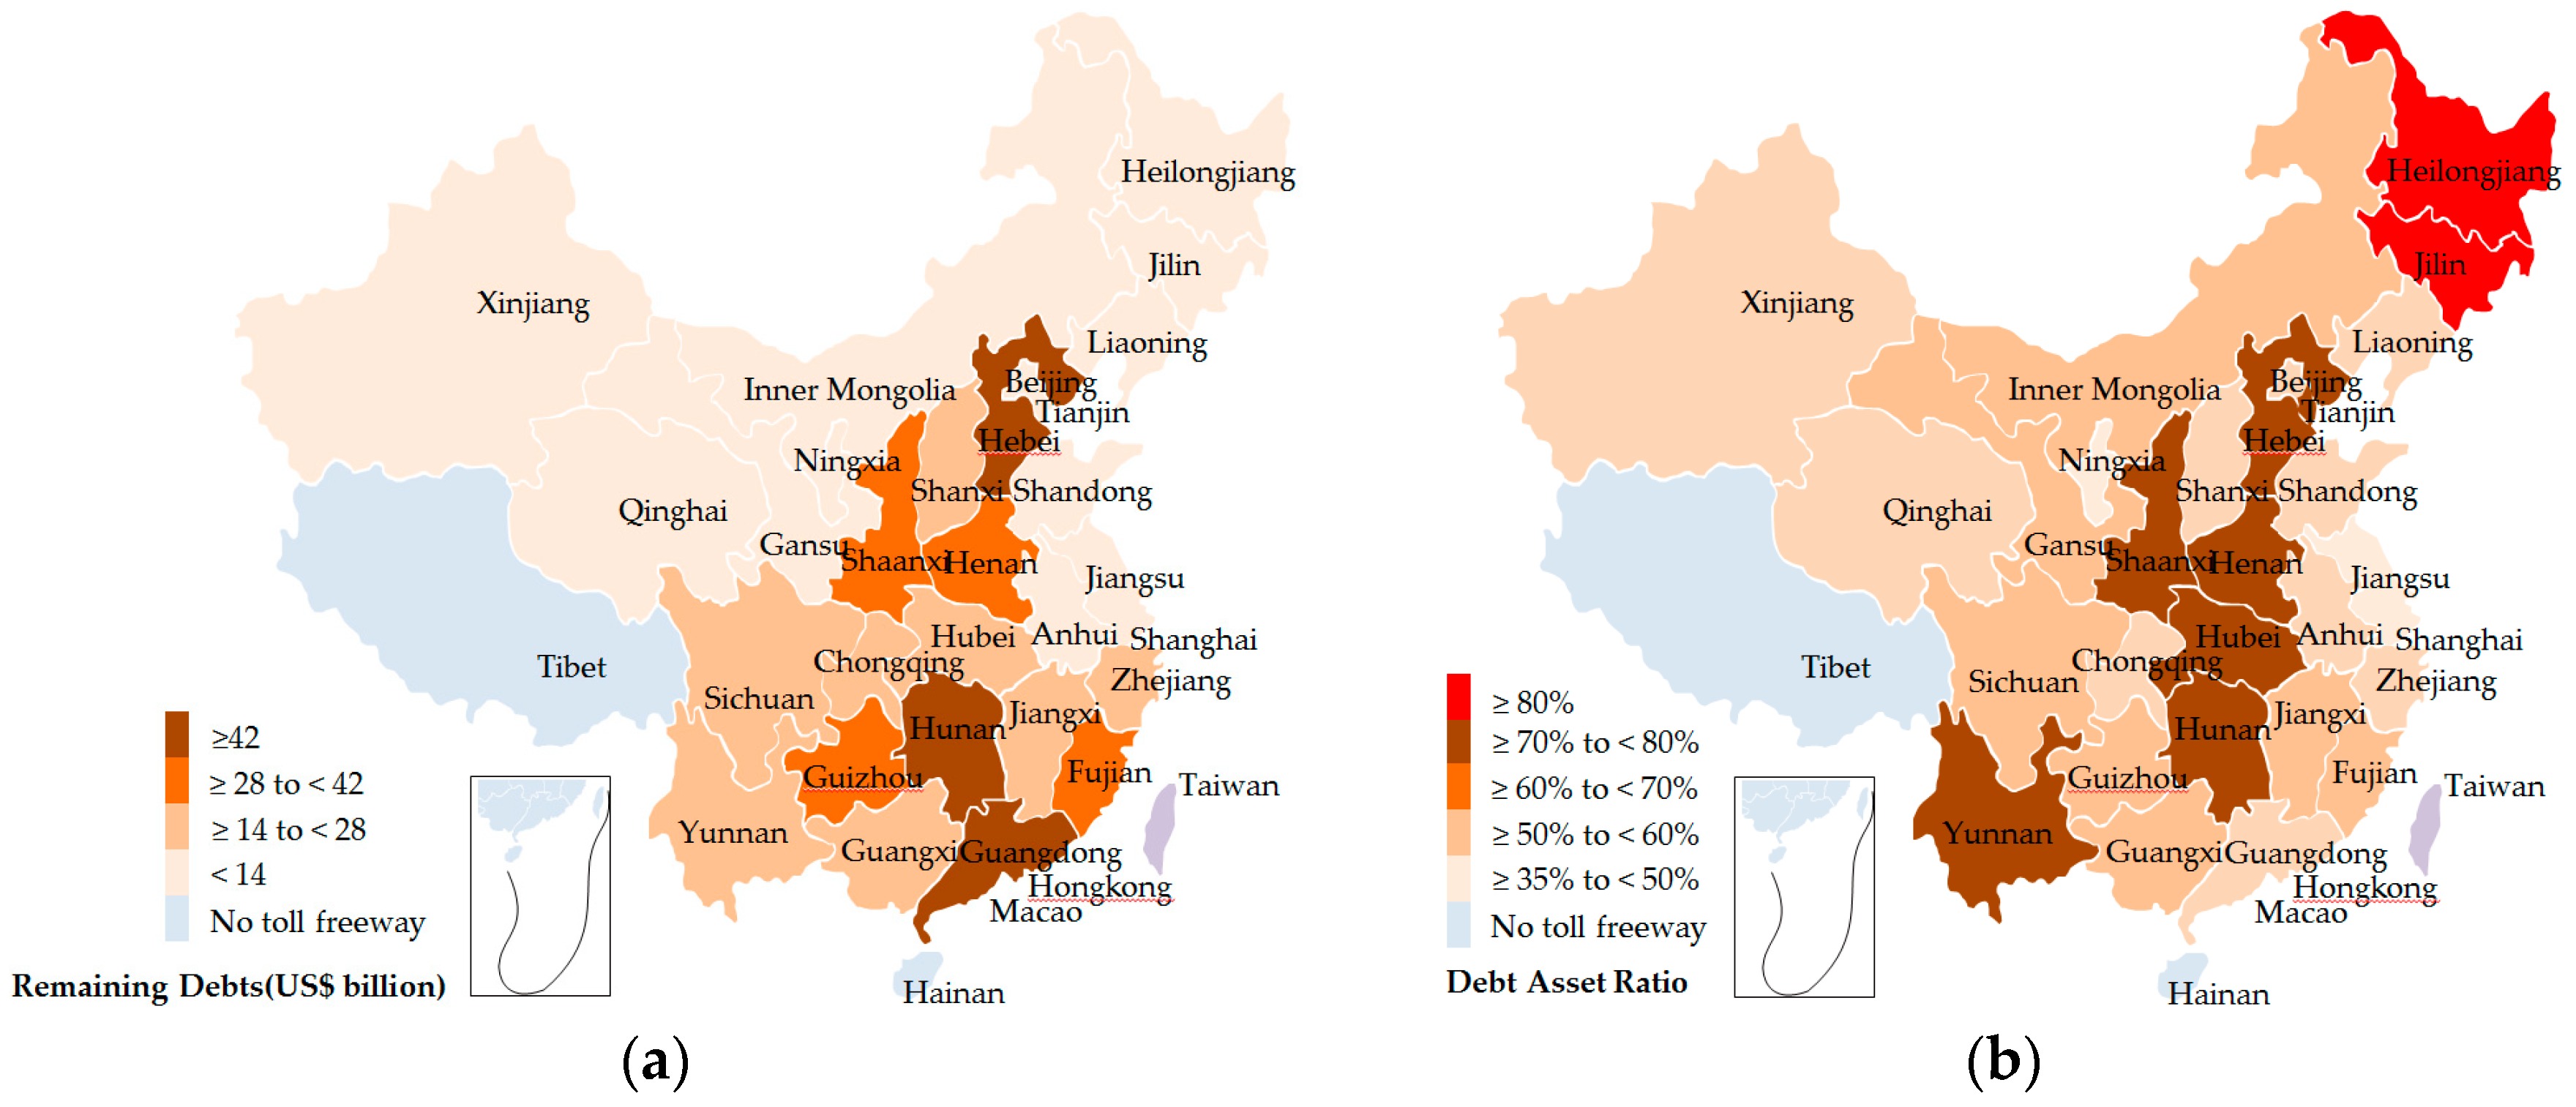
Statistics from the Ministry of Transport (MOT) in China shown in Figure 1 reveal that, except for Tibet and Hainan (two provinces that have no toll freeways), all the other provinces have an average debt–asset ratio of 63.2% and an average remaining debt of US$20.8 billion in toll freeway; even more seriously, Jilin province has a debt–asset ratio as high as 83.7% and Hunan province has a remaining debt as much as US$ 43.6 billion [2], which indicates that toll freeways in Mainland China are facing a high debt risk. In order to prevent a debt crisis and adopt effective measures to ensure the sustainable development of toll freeways in China, debt risk factors and risk levels should be identified.
There are two kinds of research streams concentrating on the financial issue of toll freeways in Mainland China. The first stream studies feasible pricing strategies to increase toll revenue, such as the system dynamics-based concession pricing model [3], the logit-based pricing model [4], and the congestion pricing model [5], etc. The second stream focuses on promoting Public–Private Partnership (PPP) project and Build–Operate–Transfer (BOT) projects, etc., to diversify funding sources, attract social capital, and reduce financial burden [6,7,8]. However, they failed to identify debt risk factors and determine the debt risk level. Comprehensive debt risk evaluation and comparison of toll freeways in Mainland China from the perspective of provincial governments have not been completely investigated.
To fill this gap, we will discuss risk factors influencing the debt of toll freeways and investigate the debt risk level of toll freeways of each provincial government in Mainland China using the grey approach. As a charging infrastructure mainly invested in by government, its debt risk can be affected by numerous potential factors, such as revenue streams [9], debt capacity [10], total liabilities [11], and so on, which make the debt risk evaluation a multi-criteria decision making (MCDM) problem with uncertainty and complexity [12]. In addition, the grey approach is an effective method, which is widely used in performance and risk evaluation with uncertain information. For better identification of risk factors and evaluation of debt risk level, this research extends the approach from three aspects, namely, (i) selecting risk factors through literature review, (ii) determining the criteria weight, and (iii) applying the grey approach to evaluate risk levels of toll freeways of each provincial government.
This research makes the following two contributions. Firstly, we precisely and comprehensively identify risk factors affecting the debt risk of toll freeways in Mainland China. Secondly, we propose a framework to evaluate and compare the debt risk level of toll freeways from the perspective of provincial governments using the grey approach.
The remainder of this paper is organized as follows. Section 2 reviews debt risk factors of highways and the application of the grey approach. Section 3 determines the evaluation criteria and introduces a methodology in detail used in this research. In Section 4, the proposed approach is applied in the debt risk evaluation problem of toll freeways in Mainland China. Section 5 presents the calculation results. Section 6 analyzes and discusses the results. Section 7 provides some important policy implications, and the conclusions are drawn in Section 8.
2. Literature Review
2.1. Debt Risk Factors of Highways
Identification of appropriate risk factors is important and necessary to carry out debt risk evaluation for highways. From the literature analysis, different debt risk factors of highways have been identified through wide-ranging literature resources, which can be classified into four categories, i.e., debt scale risk, debt structure risk, debt management risk, and external environment risk, shown in Table 1.
To our knowledge, the literature mentioned above shows that researchers have concentrated on the debt risk factors from the perspective of a single highway project instead of the entire highway system. In addition, compared to regular highways, toll freeways have the ability to generate cash flows by the toll charging of vehicles or vehicle users, which is an important capital source for debt repayment. Another limitation of the risk factors listed above is that it is rare to consider solvency risk. In view of this, this research will conduct an in-depth debt risk analysis and establish a more comprehensive debt risk factor system. Only in this way can debt risk of toll freeways be assessed and compared accurately.
2.2. Application of the Grey Approach
The Grey approach is an effective method that can be used to evaluate the performance of alternatives and assist decision-making based on grey relationship analysis in an uncertain and inconsistent environment [36]. It has been widely used as an effective mathematical analysis of systems with uncertain information in recent years. For example, Baskaran et al. adopted the grey approach to evaluate Indian textile suppliers’ sustainability and identify the best supplier based on subjective criteria [37]. Chithambaranathan et al. employed a grey-based hybrid framework for evaluating the environmental performance of service supply chains [38]. Zhang et al. solved the investment allocation problem of the whole network for the objective of energy saving using a grey theory-based energy-saving potential evaluation [39]. Wu et al. analyzed barriers to offshore wind power development using a grey-based approach [40].
Despite the wide range of applications of the grey approach, it is rare in literature to assess the debt risk level of toll freeways in Mainland China under uncertain conditions. This research chooses the grey approach as an effective method to make debt risk evaluations of toll freeways considering the following several advantages over other techniques: (i) It has a general applicability in dealing with the fuzziness situation flexibly with no strict requirements for sample size [41]; (ii) it does not need the sample to obey any statistical distribution [42]; and (iii) it can handle both quantitative and qualitative data with efficient and simple calculation [43]. Furthermore, since the impact of the criteria on debt risk of toll freeways is uncertain and a part of the evaluation criteria are qualitative, the grey approach is a suitable method to solve the problem in this research.
3. Materials and Methods
3.1. Data Collection
Since Tibet and Hainan Provinces have no toll freeways, debt risk of toll freeways in the other 29 provinces was evaluated, and their data were collected. Data adopted in this research were collected from official statistics and expert knowledge.
(i) Data on quantitative risk factors were extracted from the China Toll Freeway Statistical Yearbook published by MOT in China every year, in which data of toll freeways in each province such as toll revenue, operating cost, maintenance cost, repayment of principal and interest, taxes and dues, remaining debts, total investment, etc., are revealed. The statistical data from 2017 was used in this research.
(ii) A committee of 20 experts was formed including 7 professors from universities, who have a long-term and in-depth study of toll freeways in Mainland China, 7 officials working for MOT, who have rich experience in toll freeway management, and 6 chief financial officers from toll freeway enterprises, who have been engaged in the financial management of toll freeways for a long time. Experts were invited to judge the scores of occurrence probabilities (OPs), magnitudes of impacts (MIs), and integrated risk impacts (IRIs) for each risk factor and assess the evaluation criteria weights. The data of qualitative criteria are determined by linguistic variables.
3.2. Risk Factor Identification
Identification of appropriate risk factors is an important step to carry out debt risk evaluation and risk control [44]. To improve the risk factor system, three solvency risk factors including (i) toll revenue, (ii) free cash flow, and (iii) earnings before interest, tax, depreciation, and amortization (EBITDA) margin were newly added into the risk factors listed in Table 1.
Toll revenue is the amount of money that toll freeways actually receive from different types of vehicles during a specific period. It is the top line or gross income figure from which costs are subtracted to determine net income. Toll revenue is calculated by multiplying the toll rates of different types of vehicles by their driving mileage [45,46,47,48].
Free cash flow is the cash toll freeways generate after cash outflows to support operations and maintain its capital asset. It is a measure of profitability that excludes the non-cash expenses of the income statement and includes spending on equipment and assets as well as changes in working capital [49,50,51,52].
Free cash flow is calculated by Equation (1) as in Reference [53].
where FCF is free cash flow; TR is toll revenue; OC is operating cost; MC is maintenance cost; I is interest; TD is taxes and dues.
FCF = TR − OC − MC − I − TD
EBITDA margin is an assessment of operating profitability of toll freeways as a percentage of their total revenue. It is equal to earnings before interest, tax, depreciation and, amortization divided by total revenue. Because EBITDA excludes interest, depreciation, amortization, and taxes, EBITDA margin can provide a clear view of toll freeways’ operating profitability [54,55,56,57].
EBITDA margin is calculated by Equation (2) as in Reference [58].
3.3. Risk Factor Ranking and Criteria Determination
Mean score ranking analysis was used to calculate the relative importance between risk factors described as OPs, Mis, [59] and IRIs. IRI is defined as IRI = [60]. To obtain the values of OPs and MIs, a group of 20 experts were invited to give scores to OPs and MIs of each risk factor with a 5-point system (1 = very low, 2 = low, 3 = moderate, 4 = good, and 5 = very good). Scores of OPs, Mis, and IRIs were collected and their mean scores for each debt risk factor were calculated. Risk factors were ranked by IRI values in descending order, as shown in Table 2.
To determine the evaluation criteria, normalized corresponding IRIs were calculated using Equation (3)
where Yi is the normalized corresponding IRI value of ith debt risk factor; IRIi is the mean score of ith debt risk factor’s IRI; IRImax and IRImin are the maximum and minimum of IRI of each risk factor, respectively.
Critical risk factors were selected if their normalized values of IRI ≥0.5. As a result, 15 critical risk factors were chosen as evaluation criteria, as shown in Table 2.
3.4. The Grey Approach
This section describes the grey approach used to evaluate toll freeway debt risk based on risk criteria in detail. This method is appropriate to solve the evaluation problem in an uncertain environment.
It assumes that S is a discrete set of m alternatives. A is a set of n criteria of alternatives, which are additively independent. is the vector of criteria weights. This research considers the criteria weights and qualitative criteria ratings value as linguistic variables [61]. Table 3 shows the linguistic criteria weights Θw and the qualitative criteria ratings value ΘG in grey numbers [62].
The procedure of the grey approach is summarized in detail as follows.
Step 1: Form a committee of decision makers
Form a committee of decision makers who are experts with good expertise and experience in the research field. The decision group is invited to assess the criteria weights.
Step 2: Identify criteria weights
It assumes that the decision group has K decision makers, then the weight of criteria Aj can be calculated using
where Θwj, j is the weight of criteria Aj; is the weight of criteria Aj assessed by Kth decision maker, which can be described by grey number .
Step 3: Establish the decision matrix
The decision matrix can be formulated as
where ΘGij (; ) is the value of alternative Si against criteria Aj. ΘGij can be either a linguistic variable based on grey number or a constant variable.
Step 4: Normalize the decision matrix
Normalization depends on either minimization (cost) or maximization (benefit) of criteria considered in this study.
For maximization (benefit) criteria, denote
where , ; .
For minimization (cost) criteria, denote
where , ; .
Then the normalized decision matrix can be expressed as
The normalization method mentioned above is to preserve the property that the ranges of the normalized belong to [0,1].
Step 5: Establish the weighted normalized grey decision matrix
The weighted normalized grey decision matrix is calculated by multiplying the normalized decision matrix by the criteria weight vector, V = D* × Θw. Considering the different weights of each criterion, the weighted normalized grey decision matrix can be established as
where .
Step 6: Set the ideal referential alternative
For m possible alternatives S , the ideal referential alternative is defined as , which can be calculated as
Step 7: Calculate the grey possibility degree value
The grey possibility degree value between alternatives S and the ideal referential alternative can be calculated as
where = , , .
Step 8: Rank the order of alternatives
When P is smaller, the ranking order of Si is better. Otherwise the ranking order is worse.
4. Application of the Grey Approach
In this section, we apply the proposed grey approach to assess the toll freeway debt risk level of each province in Mainland China.
Since the Tibet and Hainan Provinces have no toll freeways, we take the other 29 provinces in Mainland China as alternatives Si (i = 1, 2, ⋯, 29) against 15 evaluation criteria Aj (j = 1, 2, ⋯, 15) in this research, shown in Table 4. Criteria A6, A7, A8, A12, A13, A14, and A15 were maximization (benefit) criteria, with the greater values being better. Criteria A1, A2, A3, A4, A5, A9, A10, and A11 were minimization (cost) criteria, with the smaller values being better. The detailed evaluation procedure is as follows.
Step 1: Form a committee of decision makers
A committee of 20 experts was informed as presented in Section 3.1. The values of criteria weights were evaluated by the 20 experts.
Step 2: Identify criteria weights
Table 4 summarizes the results of criteria weights Θwj calculated by Equation (4) according to the judgment of 20 experts.
Step 3: Establish the decision matrix
The decision matrix was established using Equation (5). The value of ΘGij is presented in Appendix A, Table A1.
Step 4: Normalize the decision matrix
For maximization (benefit) criteria, ΘGij (i = 1, 2, ⋯, 29; j = 6, 7, 8, 12, 13, 14, 15) are normalized by Equation (6), and for minimization (cost) criteria, ΘGij (i = 1, 2, ⋯, 29; j = 1, 2, 3, 4, 5, 9, 10, 11) are normalized by Equation (7). According to Equation (8), the normalized decision matrix is presented in Appendix A, Table A2.
Step 5: Establish the weighted normalized grey decision matrix
The weighted normalized grey decision matrix is the product of normalized decision matrix and criteria weights vector V = D* × Θw. According to Equation (9), the weighted normalized grey decision matrix is shown in Appendix A, Table A3.
Step 6: Identify the ideal referential alternative
Using Equation (10), the ideal referential alternative can be obtained as Equation (13).
Smax = {[0.66,0.84],[0.71,0.90],[0.57,0.76],[0.49,0.64],[0.59,0.77],[0.67,0.94],[0.42,0.63],[0.51,0.72],
[0.48,0.68],[0.38,0.54],[0.47,0.64],[0.68,0.86],[0.44,0.62],[0.44,0.74],[0.57,0.82]}
[0.48,0.68],[0.38,0.54],[0.47,0.64],[0.68,0.86],[0.44,0.62],[0.44,0.74],[0.57,0.82]}
Step 7: Calculate the grey possibility degree value
According to Equations (11) and (12), the grey possibility degree values between the 29 alternatives Si (i = 1, 2, ⋯, 29) and the ideal referential alternative Smax are calculated and shown as follows.
P{S1 ≤ Smax} = 0.241, P{S2 ≤ Smax} = 0.567, P{S3 ≤ Smax} = 0.674, P{S4 ≤ Smax} = 0.686,
P{S5 ≤ Smax} = 0.523, P{S6 ≤ Smax} = 0.511, P{S7 ≤ Smax} = 0.643, P{S8 ≤ Smax} = 0.552,
P{S9 ≤ Smax} = 0.546, P{S10 ≤ Smax} = 0.579, P{S11 ≤ Smax} = 0.618, P{S12 ≤ Smax} = 0.605,
P{S13 ≤ Smax} = 0.493, P{S14 ≤ Smax} = 0.391, P{S15 ≤ Smax} = 0.489, P{S16 ≤ Smax} = 0.424,
P{S17 ≤ Smax} = 0.343, P{S18 ≤ Smax} = 0.273, P{S19 ≤ Smax} = 0.253, P{S20 ≤ Smax} = 0.364,
P{S21 ≤ Smax} = 0.632, P{S22 ≤ Smax} = 0.324, P{S23 ≤ Smax} = 0.360, P{S24 ≤ Smax} = 0.458,
P{S25 ≤ Smax} = 0.232, P{S26 ≤ Smax} = 0.258, P{S27 ≤ Smax} = 0.375, P{S28 ≤ Smax} = 0.588,
P{S29 ≤ Smax} = 0.289
Step 8: Rank the order of alternatives
Rank the order of 29 alternatives based on grey possibility degree value. The results are shown as follows.
S25 > S1 > S19 > S26 > S18 > S29 > S22 > S17 > S23 > S20 > S27 > S14 > S16 > S24 > S15 > S13 > S6 >
S5 > S9 > S8 > S2 > S10 > S28 > S12 > S11 > S21 > S7 > S3 > S4
S5 > S9 > S8 > S2 > S10 > S28 > S12 > S11 > S21 > S7 > S3 > S4
5. Results
In this section, we analyze the grey possibility degree values of the 29 provinces. In order to compare debt risk levels of toll freeways, we classify the 29 provinces into three groups, i.e., “low debt risk”, “medium debt risk”, and “high debt risk” based on their grey possibility degree values, shown in Table 5. The first group had a grey possibility degree value ranging between >0.2 and ≤0.3, while the grey possibility degree values of the second group ranged between >0.3 and ≤0.5 and the third group ranged between >0.5 and ≤0.7, respectively. If grey possibility degree values are in the first group, the provinces fall in the category of low debt risk, which means that these provinces adhere to norms in most of the 15 criteria. If the possibility degree values belong to the second category, these provinces are medium debt risk and have to improve some aspects of the criteria. If provinces are in the category of high debt risk, they have to improve most of the criteria. The grouping can identify the important aspects, which need more attention by provincial governments to reduce debt risk levels of toll freeways.
The analysis indicates that only 6 provinces fell in the category of low debt risk, 10 provinces belonged to the category of medium debt risk and 13 provinces were in the category of high debt risk. Interestingly, there was no significant correlation between debt risk level of toll freeways and GDP level for provincial governments.
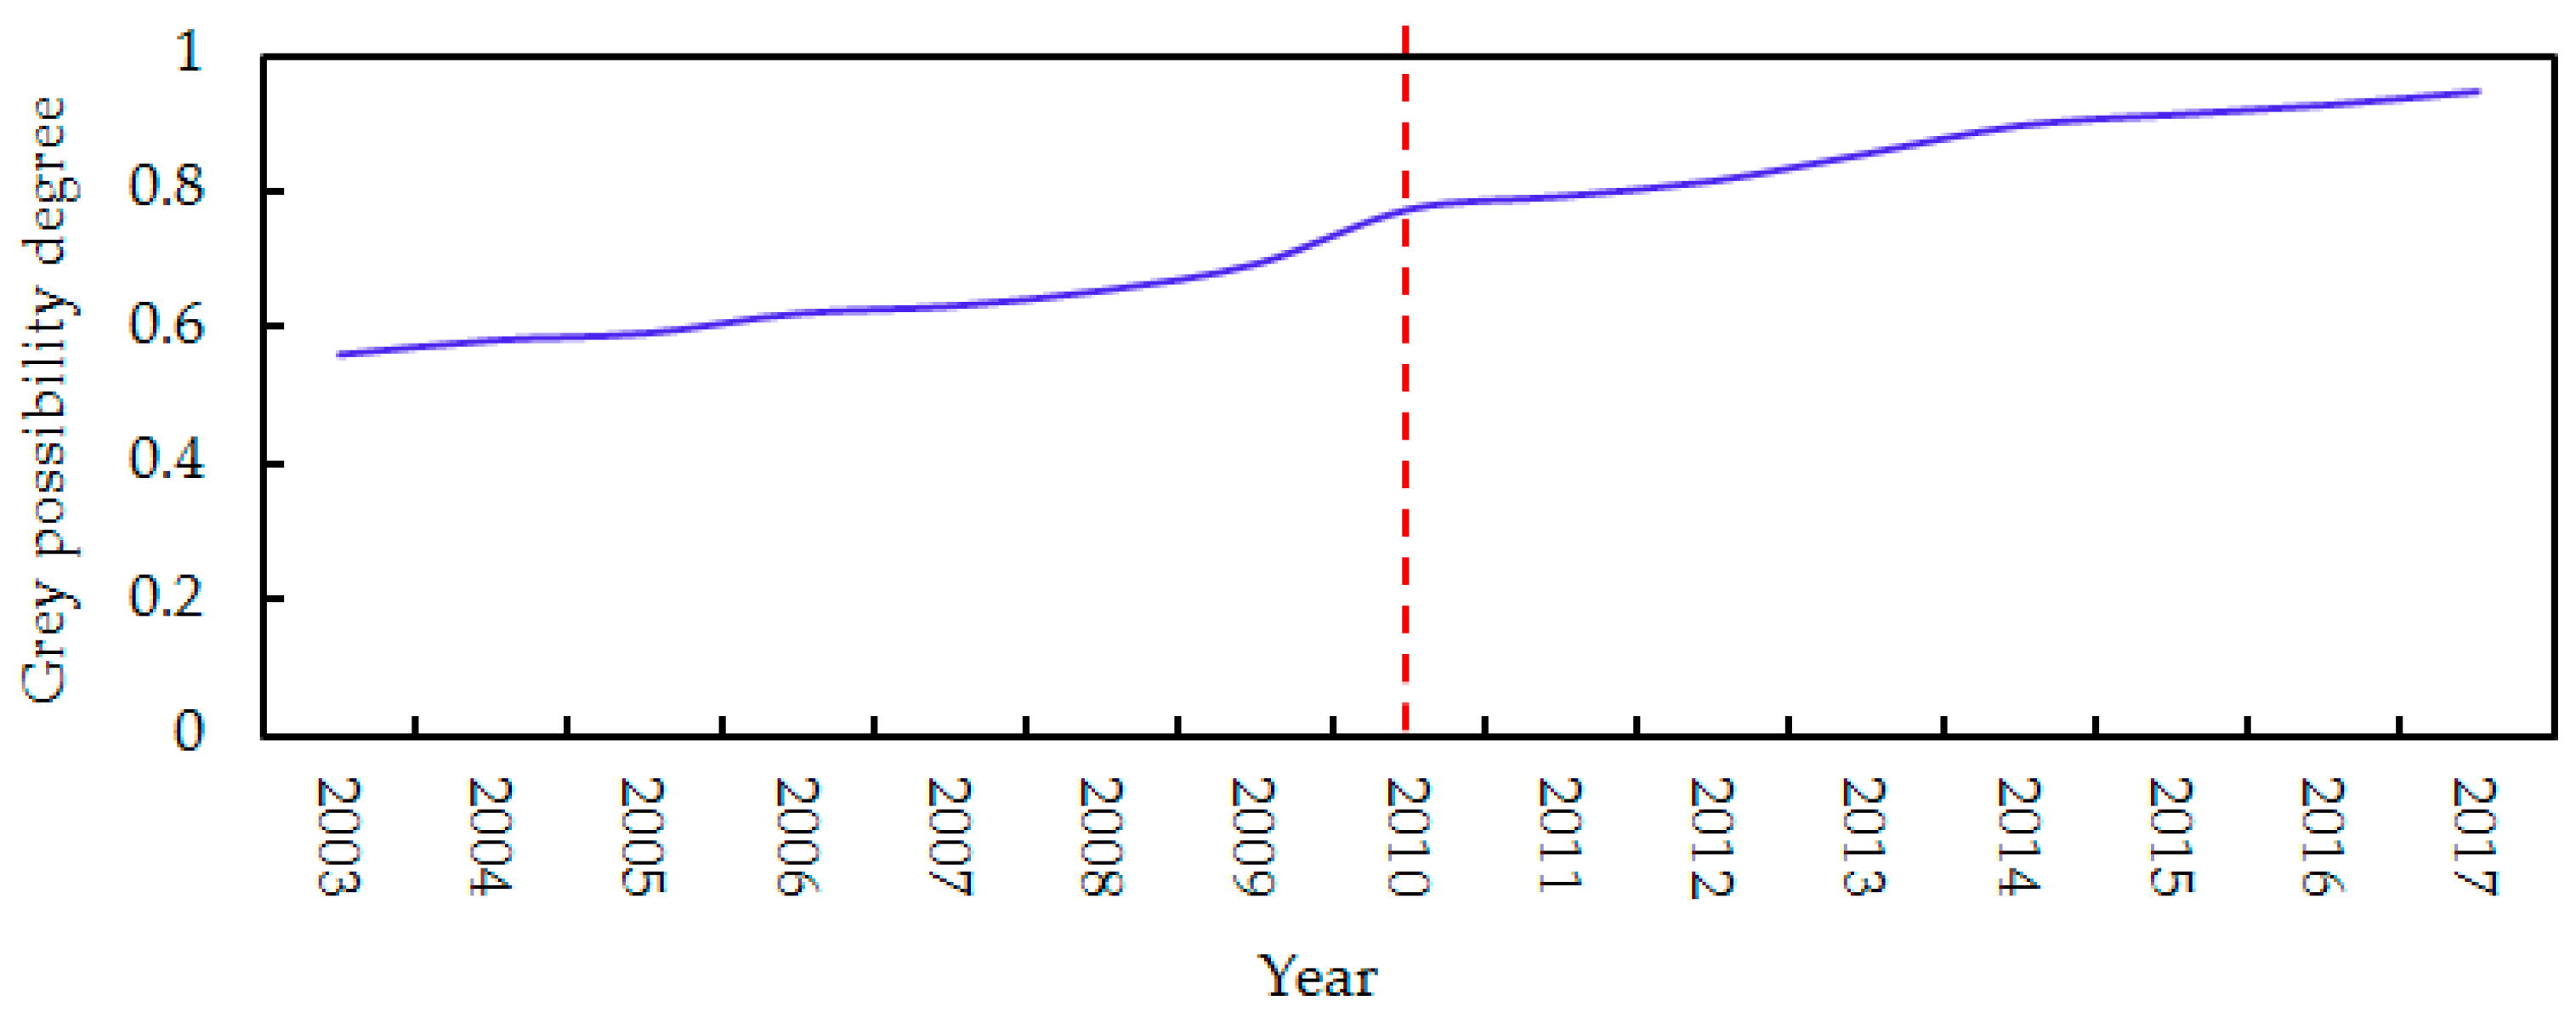
For the whole Mainland China, the grey possibility degree values over the past 15 years were calculated using the proposed grey approach. From Figure 2, we know that the grey possibility value has had a continuous increase in the past 15 years, namely, the debt risk of toll freeways in Mainland China is getting higher and higher, especially since 2010. So, we can conclude that toll freeway debt has become a great challenge and caused a high probability of debt crisis for the Chinese government.
6. Discussion
This research explores risk factors affecting the debt risk of toll freeways and evaluates debt risk levels of toll freeways in each province in Mainland China to determine their debt risk state. We discuss our key findings as follows.
- From the IRI ranking results in Table 2, debt–asset ratio, remaining debts, investment from the government finance, proportion of short-term loans, repayment of principal and interest, commercial loan ratio, debt management system, policy, debt managers’ skill, interest rate, exchange-rate fluctuation, and inflation-rate fluctuation are determined as key risk factors affecting toll freeways debt. These factors were also identified as financial risk factors of highway projects by previous studies [9,13,18,26,28,30]. However, from the existing literature, we newly added solvency risk factors to improve the risk factor system, namely, free cash flow, toll revenue, and EBITDA margin. These factors can significantly measure the profitability and solvency of toll freeways [45,49,54].
- It was found that there was no significant correlation between debt risk level of toll freeways and GDP level of provincial governments, which is in line with several previous studies [63,64]. Additionally, the whole of Mainland China had an increasing debt risk of toll freeways in the past 15 years. To our knowledge, it is because the construction of toll freeways in the whole of Mainland China has been in a rapid development period since 2010, with an average of more than 7 km new toll freeways built per year, which brought about a large scale of debt by bank loans.
7. Policy Implications
Based on risk factors and the calculation results, specific policies need to be considered to reduce debt risk. Policies are provided from debt scale, debt structure, debt management, external environment, and solvency aspects.
7.1. Debt Scale Aspect
Debt scale risk mainly comes from debt–asset ratio and remaining debts. For this concern, provincial governments should: (i) Encourage more private capital and foreign capital to invest in toll freeways, for example, governments should launch more PPP projects for newly built toll freeways, which is an effective way to save capital investment for provincial governments [65]; (ii) make a blueprint of reasonable expansion of the toll freeway network and create a level playing field for private and foreign capital investment in toll freeways [66]; (iii) for the provinces with much higher debt risks in toll freeways, like Hubei, Yunnan, Shaanxi, Henan, and Hebei, policies such as debt restructuring, debt-to-equity swap, mergers, and asset sale can also be considered to reduce the present remaining debts.
7.2. Debt Structure Aspect
Debt structure risks mainly include unreasonable commercial loan ratio and proportion of short-term loans, which usually have a higher interest rate. As a response, (i) diverse financing sources should be considered, for example, absorbing investments from creditors like insurance funds, industry foundation, etc.; (ii) transferring equity interest of toll freeways in operation is also feasible, with which construction cost can be recovered in advance, and high capital premium can even be realized.
7.3. Debt Management Aspect
Debt management system and debt managers’ skill affect the level of debt management. (i) Governments should introduce a stiff loan approval system to prevent non-performing loans, and establish a scientific debt risk assessment and early warning system; (ii) managers with high debt management skills should be preferred, and training to improve debt management skills for financial staff should be conducted.
7.4. External Environment Aspect
External political and economic risk factors should be paid attention to. It is advisable to (i) be detailed with the policy change in determining concession period, and toll pricing revised by the central government; (ii) make reasonable and diverse charging strategies to increase incomes; and (iii) establish a close corporation with various types of social capital to ensure financing sources.
7.5. Solvency Aspect
Good operating performance can improve solvency. Provincial governments should ensure maximum revenue and minimum cost during the construction and operation periods of toll freeways: (i) Policies to improve service quality should be implemented to attract more users, such as reducing charge queuing time, improving pavement service performance, increasing driving safety level, and providing free, diverse real-time traffic information. Furthermore, setting competitive toll rates is another effective policy to attract more users; (ii) policies to improve management efficiency and reduce operating costs should also be adopted to increase free cash flow, including promoting the application of electronic toll collection (ETC) systems, maintenance work outsourcing, and automation equipment.
8. Conclusions
Toll freeways play an important role in promoting economic development and increasing mobility, but the debt problem has become a significant challenge for most of the provincial governments in Mainland China nowadays, which may be inclined to trigger potential debt crisis greatly. Debt risk analysis is necessary for provincial governments to ensure financial sustainability of toll freeways and it is important to identify risk factors and assess the overall debt risk level. In view of this, this research established a debt risk identification and evaluation framework of toll freeways using the grey approach based on 15 evaluation criteria. Debt risk evaluation was conducted to determine and compare debt risk levels of toll freeways in 29 provinces in Mainland China, which were classified into three categories: low debt risk, medium debt risk, and high debt risk, based on grey possibility degree values. The results show that for 29 provincial governments, 20.7% of them have low debt risk, 34.5% of them have medium debt risk, and 44.8% of provinces have high debt risk; for the whole Mainland China, the debt risk of toll freeways has been getting higher and higher in the past 15 years, especially since 2010. Accordingly, some important policy implications were proposed based on the evaluation findings. As part of highway infrastructure, debt risk evaluation and analysis of toll freeways are critical issues and attract attention from researchers. However, few studies have yet evaluated toll freeway debt risk in Mainland China from the perspective of provincial government. This research intends to contribute to the literature.
However, there are two limitations to this research. Firstly, although the number of experts involved in this research is sufficient to make judgments, more experts can be invited to improve the accuracy of the results. Secondly, other uncertainties, such as the availability of data and characterization of dynamic data should also be considered. These limitations should be taken into consideration in future work.
Author Contributions
X.M. designed the research methods and wrote the manuscript; J.G. collected and analyzed the data; X.Z. edited and revised the manuscript.
Funding
This research was funded by Humanities and Social Science Research Program of Ministry of Education in China (Grant Number 16XJCZH002) and supported by the Fundamental Research Funds for the Central Universities (Grant Number 310823170657 and 300102238501) and National Natural Science Foundation of China (Grant Number 71701022) and Natural Science Basic Research Plan in Shaanxi Province of China (Grant Number 2018JQ7002) and National Key R & D project (Grant Number 2017YFC0803906).
Conflicts of Interest
The authors declare no conflicts of interest.
Appendix A

Table A1.
Values of 15 evaluation criteria.
| Provinces | A1 | A2 | A3 | A4 | A5 | A6 | A7 | A8 | A9 | A10 | A11 | A12 | A13 | A14 | A15 |
|---|---|---|---|---|---|---|---|---|---|---|---|---|---|---|---|
| Guangdong (S1) | 55.74 | 43.53 | 5.37 | 73.58 | 47.94 | [1.24,3.56] | [2.66,4.54] | [2.01,3.89] | 5.58 | [2.47,3.27] | [3.57,5.43] | 3.64 | 1.82 | 9.60 | 6.06 |
| Hunan (S2) | 78.39 | 43.61 | 2.48 | 83.47 | 63.42 | [0.66,1.83] | [2.21,3.97] | [1.56,3.32] | 5.56 | [1.73,2.29] | [1.57,2.01] | 1.78 | −0.16 | 2.29 | 4.23 |
| Henan (S3) | 73.14 | 34.03 | 6.27 | 76.54 | 62.93 | [1.03,3.29] | [4.49,5.63] | [3.84,4.98] | 6.01 | [2.75,3.65] | [2.37,3.04] | 1.94 | 0.73 | 3.46 | 6.71 |
| Hebei (S4) | 74.67 | 43.50 | 8.90 | 78.56 | 61.22 | [0.17,1.47] | [2.66,4.54] | [2.01,3.89] | 6.02 | [1.85,2.45] | [2.45,3.15] | 2.34 | −0.45 | 3.58 | 4.57 |
| Heilongjiang (S5) | 52.55 | 13.58 | 2.20 | 69.37 | 41.19 | [5.05,7.63] | [1.28,2.11] | [0.63,1.46] | 5.58 | [4.07,5.39] | [3.15,4.04] | 3.67 | 1.09 | 4.61 | 9.98 |
| Inner Mongolia (S6) | 60.93 | 24.81 | 2.18 | 80.43 | 52.45 | [3.38,4.78] | [4.56,6.16] | [5.27,6.83] | 5.65 | [2.18,2.89] | [1.77,2.26] | 3.12 | 0.38 | 2.58 | 5.31 |
| Shaanxi (S7) | 79.38 | 42.64 | 5.37 | 74.78 | 62.27 | [0.31,1.65] | [2.66,5.56] | [1.07,3.97] | 5.65 | [2.01,2.67] | [1.89,2.42] | 1.68 | −0.49 | 2.76 | 4.97 |
| Guizhou (S8) | 64.02 | 36.77 | 2.46 | 84.51 | 56.06 | [1.36,2.45] | [3.15,5.35] | [1.56,3.76] | 5.78 | [4.52,5.99] | [2.09,3.46] | 2.43 | −0.77 | 1.59 | 1.13 |
| Jiangxi (S9) | 67.42 | 20.00 | 2.25 | 83.99 | 57.98 | [1.29,3.63] | [2.13,3.06] | [0.54,1.47] | 5.69 | [2.06,2.72] | [0.42,1.83] | 2.35 | 0.39 | 2.08 | 5.04 |
| Shanxi (S10) | 57.74 | 23.56 | 2.50 | 76.22 | 49.66 | [1.95,2.46] | [3.14,4.78] | [1.55,3.19] | 6.05 | [0.19,1.58] | [1.36,1.75] | 1.56 | −0.32 | 1.99 | 2.92 |
| Hubei (S11) | 75.39 | 28.69 | 3.77 | 79.51 | 64.84 | [4.08,5.66] | [6.15,7.52] | [4.56,5.93] | 5.95 | [2.47,3.27] | [3.61,5.07] | 1.89 | −0.17 | 2.36 | 6.08 |
| Fujian (S12) | 68.14 | 35.96 | 3.30 | 78.94 | 58.66 | [1.01,2.27] | [4.23,6.35] | [2.64,4.71] | 5.84 | [2.01,2.67] | [0.21,1.55] | 2.02 | −0.26 | 1.76 | 4.92 |
| Guangxi (S13) | 65.63 | 17.42 | 1.60 | 86.63 | 57.44 | [0.06,1.07] | [2.16,3.31] | [0.51,1.72] | 5.76 | [2.51,3.32] | [1.15,3.47] | 1.67 | 0.30 | 1.68 | 6.13 |
| Jiangsu (S14) | 47.02 | 14.22 | 6.65 | 62.07 | 47.44 | [1.08,2.37] | [2.81,5.52] | [1.22,3.91] | 5.72 | [4.23,5.61] | [4.27,5.48] | 3.54 | 1.55 | 6.24 | 10.31 |
| Sichuan (S15) | 51.39 | 12.21 | 1.40 | 67.83 | 44.25 | [2.63,3.79] | [2.31,3.46] | [0.72,1.87] | 5.82 | [3.04,4.03] | [0.54,1.98] | 2.11 | 0.97 | 2.25 | 7.49 |
| Liaoning (S16) | 57.80 | 13.21 | 1.21 | 76.3 | 43.71 | [0.41,1.52] | [1.74,3.48] | [1.91,3.82] | 6.02 | [3.29,4.36] | [1.03,1.32] | 2.27 | 0.33 | 1.51 | 0.83 |
| Xinjiang (S17) | 58.23 | 8.49 | 0.94 | 76.86 | 46.08 | [1.06,2.08] | [3.11,4.51] | [3.42,4.95] | 5.92 | [2.47,3.27] | [2.81,4.04] | 1.68 | −0.09 | 1.19 | 0.64 |
| Shandong (S18) | 82.08 | 12.57 | 0.78 | 88.35 | 68.59 | [3.43,5.54] | [0.37,1.34] | [0.41,1.47] | 5.86 | [5.71,7.57] | [1.52,2.67] | 1.32 | −0.33 | 0.76 | 13.94 |
| Anhui (S19) | 66.52 | 12.40 | 0.06 | 87.81 | 53.21 | [0.47,1.59] | [1.41,2.42] | [1.55,2.66] | 5.79 | [1.07,1.42] | [2.86,3.67] | 2.14 | 0.50 | 4.18 | 2.61 |
| Zhejiang (S20) | 56.54 | 23.77 | 3.56 | 74.63 | 44.62 | [1.79,2.99] | [2.28,2.84] | [2.51,3.12] | 5.75 | [3.29,4.36] | [3.72,4.75] | 2.35 | 1.55 | 5.41 | 8.07 |
| Yunnan (S21) | 72.09 | 26.01 | 4.01 | 95.16 | 62.53 | [1.24,3.56] | [4.58,5.92] | [5.03,6.51] | 5.82 | [1.19,1.58] | [1.22,1.56] | 2.03 | −0.26 | 1.78 | 2.94 |
| Gansu (S22) | 65.19 | 14.12 | 0.89 | 86.05 | 56.06 | [0.66,1.83] | [1.16,2.72] | [1.27,2.99] | 5.68 | [3.17,4.29] | [0.52,1.95] | 1.95 | 0.01 | 2.22 | 0.94 |
| Jilin (S23) | 83.73 | 13.57 | 0.99 | 91.52 | 72.01 | [1.03,3.29] | [0.58,1.35] | [0.64,1.48] | 5.92 | [2.06,2.72] | [1.51,2.65] | 1.34 | −0.28 | 0.74 | 5.03 |
| Chongqing (S24) | 58.48 | 15.37 | 1.34 | 77.19 | 50.29 | [0.17,1.47] | [1.37,1.84] | [1.51,2.02] | 5.63 | [1.77,2.34] | [1.98,3.25] | 1.08 | 0.16 | 1.43 | 4.38 |
| Ningxia (S25) | 37.91 | 1.80 | 0.13 | 50.04 | 32.68 | [5.05,7.63] | [2.64,3.92] | [2.86,4.29] | 5.87 | [1.33,2.44] | [2.43,4.55] | 1.24 | 0.11 | 0.63 | 0.81 |
| Qinghai (S26) | 54.43 | 3.03 | 0.14 | 71.85 | 43.81 | [3.38,4.78] | [2.94,5.41] | [3.23,5.94] | 5.86 | [2.29,3.38] | [2.31,4.38] | 0.95 | 0.02 | 0.44 | 0.77 |
| Tianjin (S27) | 71.12 | 9.44 | 1.01 | 93.88 | 56.16 | [0.31,1.65] | [1.69,2.67] | [1.86,2.93] | 5.91 | [1.52,2.02] | [1.52,2.67] | 1.42 | −0.11 | 0.76 | 3.73 |
| Beijing (S28) | 59.82 | 8.54 | 2.74 | 78.96 | 56.45 | [1.36,2.45] | [0.28,1.66] | [0.31,1.82] | 6.03 | [1.89,2.51] | [1.71,2.91] | 2.06 | 0.12 | 1.04 | 4.66 |
| Shanghai (S29) | 39.67 | 3.55 | 1.05 | 52.36 | 41.12 | [1.29,3.63] | [2.61,4.33] | [2.87,4.72] | 5.97 | [3.12,4.14] | [2.52,4.67] | 1.52 | 0.20 | 0.76 | 7.62 |
Table A2.
Normalized decision value.
| Si | A1 | A2 | A3 | A4 | A5 | A6 | A7 | A8 | A9 | A10 | A11 | A12 | A13 | A14 | A15 |
|---|---|---|---|---|---|---|---|---|---|---|---|---|---|---|---|
| S1 | 0.68 | 0.04 | 0.01 | 0.68 | 0.68 | [0.25,0.47] | [0.43,0.60] | [0.38,0.57] | 1.00 | [0.28,0.43] | [0.06,0.24] | 0.99 | 1.00 | 1.00 | 0.43 |
| S2 | 0.48 | 0.04 | 0.02 | 0.60 | 0.52 | [0.13,0.24] | [0.36,0.53] | [0.31,0.49] | 1.00 | [0.11,0.62] | [0.13,0.66] | 0.49 | 0.09 | 0.24 | 0.30 |
| S3 | 0.52 | 0.05 | 0.01 | 0.65 | 0.52 | [0.21,0.43] | [0.63,0.75] | [0.61,0.73] | 0.93 | [0.17,0.39] | [0.09,0.43] | 0.53 | 0.40 | 0.36 | 0.48 |
| S4 | 0.51 | 0.04 | 0.01 | 0.64 | 0.53 | [0.03,0.19] | [0.43,0.60] | [0.38,0.57] | 0.92 | [0.10,0.58] | [0.09,0.42] | 0.64 | 0.25 | 0.37 | 0.33 |
| S5 | 0.72 | 0.13 | 0.03 | 0.72 | 0.79 | [0.96,1.00] | [0.21,0.28] | [0.12,0.21] | 1.00 | [0.05,0.26] | [0.07,0.33] | 1.00 | 0.60 | 0.48 | 0.72 |
| S6 | 0.62 | 0.07 | 0.03 | 0.62 | 0.62 | [0.62,0.68] | [0.74,0.82] | [0.92,1.00] | 0.98 | [0.09,0.49] | [0.12,0.58] | 0.85 | 0.21 | 0.27 | 0.38 |
| S7 | 0.48 | 0.04 | 0.01 | 0.67 | 0.52 | [0.06,0.22] | [0.43,0.74] | [0.21,0.58] | 0.98 | [0.09,0.53] | [0.11,0.55] | 0.46 | 0.27 | 0.29 | 0.36 |
| S8 | 0.59 | 0.05 | 0.02 | 0.59 | 0.58 | [0.27,0.32] | [0.51,0.71] | [0.32,0.55] | 0.96 | [0.04,0.24] | [0.10,0.38] | 0.66 | 0.42 | 0.17 | 0.08 |
| S9 | 0.56 | 0.09 | 0.03 | 0.60 | 0.56 | [0.26,0.48] | [0.35,0.41] | [0.10,0.22] | 0.98 | [0.09,0.52] | [0.50,0.72] | 0.64 | 0.21 | 0.22 | 0.36 |
| S10 | 0.66 | 0.08 | 0.02 | 0.66 | 0.66 | [0.32,0.39] | [0.51,0.64] | [0.29,0.47] | 0.92 | [0.81,0.92] | [0.15,0.75] | 0.43 | 0.18 | 0.21 | 0.21 |
| S11 | 0.50 | 0.06 | 0.02 | 0.63 | 0.50 | [0.74,0.81] | [0.93,1.00] | [0.77,0.87] | 0.93 | [0.08,0.43] | [0.06,0.26] | 0.51 | 0.09 | 0.25 | 0.44 |
| S12 | 0.56 | 0.05 | 0.02 | 0.63 | 0.56 | [0.21,0.32] | [0.69,0.84] | [0.50,0.69] | 0.95 | [0.09,0.53] | [0.85,1.00] | 0.55 | 0.14 | 0.18 | 0.35 |
| S13 | 0.58 | 0.10 | 0.04 | 0.58 | 0.57 | [0.01,0.14] | [0.35,0.44] | [0.10,0.25] | 0.97 | [0.08,0.43] | [0.18,0.38] | 0.46 | 0.16 | 0.18 | 0.44 |
| S14 | 0.81 | 0.13 | 0.01 | 0.81 | 0.69 | [0.21,0.31] | [0.46,0.73] | [0.23,0.57] | 0.97 | [0.04,0.25] | [0.05,0.24] | 0.96 | 0.85 | 0.65 | 0.74 |
| S15 | 0.74 | 0.15 | 0.04 | 0.74 | 0.74 | [0.42,0.53] | [0.38,0.46] | [0.14,0.27] | 0.96 | [0.06,0.35] | [0.39,0.67] | 0.57 | 0.53 | 0.23 | 0.54 |
| S16 | 0.66 | 0.14 | 0.05 | 0.66 | 0.75 | [0.08,0.21] | [0.28,0.46] | [0.36,0.56] | 0.92 | [0.06,0.33] | [0.20,1.00] | 0.62 | 0.18 | 0.16 | 0.06 |
| S17 | 0.65 | 0.21 | 0.06 | 0.65 | 0.71 | [0.21,0.27] | [0.51,0.62] | [0.65,0.72] | 0.94 | [0.08,0.43] | [0.07,0.33] | 0.46 | 0.05 | 0.12 | 0.05 |
| S18 | 0.46 | 0.14 | 0.08 | 0.57 | 0.48 | [0.68,0.73] | [0.06,0.18] | [0.08,0.22] | 0.95 | [0.03,0.19] | [0.14,0.49] | 0.36 | 0.18 | 0.08 | 1.00 |
| S19 | 0.57 | 0.15 | 1.00 | 0.57 | 0.61 | [0.09,0.21] | [0.23,0.32] | [0.29,0.39] | 0.96 | [0.18,1.00] | [0.07,0.36] | 0.58 | 0.27 | 0.44 | 0.19 |
| S20 | 0.67 | 0.08 | 0.02 | 0.67 | 0.73 | [0.35,0.39] | [0.37,0.48] | [0.38,0.46] | 0.97 | [0.06,0.33] | [0.06,0.28] | 0.64 | 0.85 | 0.56 | 0.58 |
| S21 | 0.53 | 0.07 | 0.01 | 0.53 | 0.52 | [0.25,0.47] | [0.74,0.79] | [0.83,0.95] | 0.96 | [0.16,0.90] | [0.17,0.85] | 0.55 | 0.14 | 0.19 | 0.21 |
| S22 | 0.58 | 0.13 | 0.07 | 0.58 | 0.58 | [0.13,0.24] | [0.19,0.36] | [0.24,0.44] | 0.98 | [0.06,0.33] | [0.40,0.68] | 0.53 | 0.01 | 0.23 | 0.07 |
| S23 | 0.45 | 0.13 | 0.06 | 0.55 | 0.45 | [0.22,0.43] | [0.09,0.18] | [0.12,0.22] | 0.94 | [0.09,0.52] | [0.14,0.50] | 0.37 | 0.15 | 0.08 | 0.36 |
| S24 | 0.65 | 0.12 | 0.04 | 0.65 | 0.65 | [0.03,0.19] | [0.12,0.24] | [0.29,0.35] | 0.99 | [0.11,0.61] | [0.11,0.41] | 0.29 | 0.09 | 0.15 | 0.31 |
| S25 | 1.00 | 1.00 | 0.46 | 1.00 | 1.00 | [0.95,1.00] | [0.43,0.52] | [0.54,0.63] | 0.95 | [0.14,0.58] | [0.09,0.29] | 0.34 | 0.06 | 0.07 | 0.06 |
| S26 | 0.70 | 0.59 | 0.43 | 0.70 | 0.75 | [0.63,0.67] | [0.48,0.72] | [0.61,0.87] | 0.95 | [0.08,0.42] | [0.09,0.30] | 0.26 | 0.01 | 0.05 | 0.06 |
| S27 | 0.53 | 0.19 | 0.06 | 0.53 | 0.58 | [0.06,0.22] | [0.27,0.36] | [0.35,0.43] | 0.94 | [0.13,0.70] | [0.14,0.49] | 0.39 | 0.06 | 0.08 | 0.27 |
| S28 | 0.63 | 0.21 | 0.02 | 0.63 | 0.58 | [0.27,0.32] | [0.05,0.22] | [0.06,0.27] | 0.92 | [0.10,0.57] | [0.12,0.45] | 0.56 | 0.07 | 0.11 | 0.33 |
| S29 | 0.96 | 0.51 | 0.06 | 0.96 | 0.79 | [0.26,0.48] | [0.42,0.58] | [0.54,0.69] | 0.93 | [0.06,0.34] | [0.08,0.28] | 0.41 | 0.11 | 0.08 | 0.55 |
Table A3.
Grey weighted normalized decision value.
| Si | A1 | A2 | A3 | A4 | A5 | A6 | A7 | A8 | A9 | A10 | A11 | A12 | A13 | A14 | A15 |
|---|---|---|---|---|---|---|---|---|---|---|---|---|---|---|---|
| S1 | [0.35,0.49] | [0.02,0.03] | [0.00,0.01] | [0.47,0.58] | [0.26,0.37] | [0.15,0.36] | [0.19,0.38] | [0.28,0.54] | [0.44,0.62] | [0.15,0.32] | [0.04,0.20] | [0.57,0.75] | [0.66,0.84] | [0.71,0.92] | [0.21,0.28] |
| S2 | [0.25,0.35] | [0.02,0.03] | [0.00,0.01] | [0.41,0.51] | [0.20,0.28] | [0.08,0.19] | [0.16,0.33] | [0.23,0.46] | [0.44,0.62] | [0.06,0.46] | [0.09,0.54] | [0.28,0.37] | [0.06,0.08] | [0.17,0.22] | [0.15,0.19] |
| S3 | [0.27,0.38] | [0.02,0.03] | [0.00,0.01] | [0.44,0.56] | [0.20,0.28] | [0.13,0.33] | [0.28,0.47] | [0.44,0.69] | [0.41,0.57] | [0.09,0.29] | [0.06,0.35] | [0.30,0.41] | [0.26,0.34] | [0.26,0.32] | [0.23,0.31] |
| S4 | [0.26,0.37] | [0.02,0.03] | [0.00,0.01] | [0.44,0.55] | [0.20,0.29] | [0.02,0.15] | [0.19,0.38] | [0.28,0.54] | [0.40,0.57] | [0.05,0.43] | [0.06,0.34] | [0.37,0.48] | [0.16,0.21] | [0.26,0.33] | [0.16,0.21] |
| S5 | [0.37,0.52] | [0.06,0.09] | [0.01,0.02] | [0.49,0.62] | [0.30,0.43] | [0.59,0.77] | [0.09,0.18] | [0.09,0.2] | [0.44,0.62] | [0.03,0.19] | [0.05,0.27] | [0.57,0.76] | [0.39,0.51] | [0.34,0.43] | [0.35,0.46] |
| S6 | [0.32,0.45] | [0.03,0.05] | [0.01,0.02] | [0.42,0.53] | [0.24,0.33] | [0.38,0.52] | [0.33,0.51] | [0.67,0.94] | [0.43,0.61] | [0.05,0.36] | [0.08,0.47] | [0.49,0.64] | [0.14,0.18] | [0.19,0.24] | [0.18,0.24] |
| S7 | [0.25,0.35] | [0.02,0.03] | [0.00,0.01] | [0.46,0.57] | [0.20,0.28] | [0.04,0.17] | [0.19,0.46] | [0.15,0.55] | [0.43,0.61] | [0.05,0.39] | [0.07,0.45] | [0.26,0.35] | [0.18,0.23] | [0.21,0.26] | [0.17,0.23] |
| S8 | [0.30,0.43] | [0.02,0.03] | [0.00,0.01] | [0.40,0.51] | [0.22,0.31] | [0.17,0.25] | [0.23,0.44] | [0.23,0.52] | [0.42,0.59] | [0.02,0.18] | [0.07,0.31] | [0.38,0.50] | [0.28,0.35] | [0.12,0.15] | [0.04,0.05] |
| S9 | [0.29,0.40] | [0.04,0.06] | [0.01,0.02] | [0.41,0.51] | [0.21,0.30] | [0.16,0.37] | [0.16,0.26] | [0.07,0.21] | [0.43,0.61] | [0.05,0.38] | [0.34,0.59] | [0.37,0.48] | [0.14,0.18] | [0.16,0.24] | [0.17,0.23] |
| S10 | [0.34,0.48] | [0.04,0.05] | [0.00,0.01] | [0.45,0.57] | [0.25,0.36] | [0.21,0.30] | [0.23,0.40] | [0.21,0.44] | [0.40,0.57] | [0.44,0.68] | [0.10,0.61] | [0.25,0.33] | [0.12,0.15] | [0.15,0.19] | [0.10,0.14] |
| S11 | [0.26,0.36] | [0.03,0.04] | [0.00,0.01] | [0.43,0.54] | [0.19,0.27] | [0.45,0.62] | [0.42,0.63] | [0.56,0.82] | [0.41,0.57] | [0.04,0.32] | [0.04,0.21] | [0.29,0.39] | [0.06,0.08] | [0.18,0.23] | [0.21,0.28] |
| S12 | [0.29,0.40] | [0.02,0.03] | [0.00,0.01] | [0.43,0.54] | [0.21,0.30] | [0.13,0.25] | [0.31,0.53] | [0.36,0.65] | [0.42,0.59] | [0.05,0.39] | [0.57,0.82] | [0.31,0.42] | [0.09,0.12] | [0.13,0.16] | [0.17,0.23] |
| S13 | [0.30,0.42] | [0.05,0.07] | [0.02,0.03] | [0.41,0.50] | [0.22,0.31] | [0.01,0.11] | [0.16,0.28] | [0.07,0.24] | [0.42,0.60] | [0.04,0.32] | [0.12,0.31] | [0.26,0.35] | [0.11,0.13] | [0.13,0.16] | [0.21,0.28] |
| S14 | [0.41,0.58] | [0.06,0.09] | [0.00,0.01] | [0.55,0.69] | [0.26,0.37] | [0.13,0.24] | [0.21,0.46] | [0.17,0.54] | [0.42,0.60] | [0.02,0.18] | [0.03,0.20] | [0.55,0.73] | [0.56,0.72] | [0.46,0.59] | [0.36,0.48] |
| S15 | [0.38,0.53] | [0.07,0.10] | [0.02,0.03] | [0.51,0.63] | [0.28,0.40] | [0.26,0.41] | [0.17,0.29] | [0.10,0.25] | [0.42,0.59] | [0.03,0.26] | [0.26,0.55] | [0.33,0.43] | [0.35,0.45] | [0.16,0.21] | [0.26,0.35] |
| S16 | [0.34,0.48] | [0.07,0.10] | [0.02,0.03] | [0.45,0.57] | [0.29,0.40] | [0.05,0.16] | [0.13,0.29] | [0.26,0.53] | [0.40,0.57] | [0.03,0.24] | [0.13,0.82] | [0.35,0.47] | [0.12,0.15] | [0.11,0.14] | [0.03,0.04] |
| S17 | [0.33,0.47] | [0.10,0.14] | [0.03,0.04] | [0.44,0.56] | [0.27,0.38] | [0.13,0.21] | [0.23,0.39] | [0.47,0.68] | [0.41,0.58] | [0.04,0.32] | [0.05,0.27] | [0.26,0.35] | [0.03,0.04] | [0.09,0.11] | [0.02,0.03] |
| S18 | [0.24,0.33] | [0.07,0.10] | [0.04,0.05] | [0.39,0.49] | [0.18,0.26] | [0.42,0.56] | [0.03,0.11] | [0.06,0.21] | [0.42,0.59] | [0.02,0.14] | [0.09,0.40] | [0.21,0.27] | [0.12,0.15] | [0.06,0.07] | [0.49,0.64] |
| S19 | [0.29,0.41] | [0.07,0.10] | [0.47,0.64] | [0.39,0.49] | [0.23,0.33] | [0.06,0.16] | [0.11,0.20] | [0.21,0.37] | [0.42,0.59] | [0.10,0.74] | [0.05,0.29] | [0.33,0.44] | [0.18,0.23] | [0.31,0.46] | [0.09,0.12] |
| S20 | [0.34,0.48] | [0.04,0.05] | [0.01,0.03] | [0.46,0.57] | [0.28,0.39] | [0.21,0.30] | [0.17,0.30] | [0.28,0.43] | [0.42,0.60] | [0.03,0.24] | [0.04,0.23] | [0.37,0.48] | [0.56,0.72] | [0.41,0.55] | [0.28,0.37] |
| S21 | [0.27,0.38] | [0.03,0.05] | [0.02,0.03] | [0.36,0.45] | [0.20,0.28] | [0.15,0.36] | [0.33,0.49] | [0.61,0.90] | [0.42,0.59] | [0.09,0.66] | [0.11,0.69] | [0.31,0.42] | [0.09,0.12] | [0.14,0.17] | [0.10,0.14] |
| S22 | [0.30,0.42] | [0.06,0.09] | [0.03,0.04] | [0.41,0.50] | [0.22,0.31] | [0.08,0.19] | [0.09,0.23] | [0.17,0.41] | [0.43,0.61] | [0.03,0.24] | [0.27,0.55] | [0.30,0.41] | [0.01,0.01] | [0.16,0.21] | [0.03,0.05] |
| S23 | [0.23,0.32] | [0.06,0.09] | [0.03,0.04] | [0.38,0.47] | [0.17,0.24] | [0.14,0.33] | [0.04,0.11] | [0.09,0.21] | [0.41,0.58] | [0.05,0.38] | [0.09,0.41] | [0.21,0.28] | [0.1,0.13] | [0.06,0.07] | [0.17,0.23] |
| S24 | [0.33,0.47] | [0.06,0.08] | [0.02,0.03] | [0.44,0.56] | [0.25,0.35] | [0.02,0.15] | [0.05,0.15] | [0.21,0.33] | [0.43,0.61] | [0.06,0.45] | [0.07,0.33] | [0.17,0.22] | [0.06,0.08] | [0.11,0.14] | [0.15,0.20] |
| S25 | [0.51,0.72] | [0.48,0.68] | [0.22,0.29] | [0.68,0.86] | [0.38,0.54] | [0.58,0.77] | [0.19,0.33] | [0.39,0.59] | [0.42,0.59] | [0.08,0.43] | [0.06,0.24] | [0.19,0.26] | [0.04,0.05] | [0.05,0.06] | [0.03,0.04] |
| S26 | [0.36,0.51] | [0.28,0.40] | [0.21,0.27] | [0.48,0.60] | [0.29,0.40] | [0.39,0.52] | [0.22,0.45] | [0.44,0.82] | [0.42,0.59] | [0.04,0.31] | [0.06,0.24] | [0.15,0.21] | [0.01,0.01] | [0.04,0.05] | [0.03,0.04] |
| S27 | [0.27,0.38] | [0.09,0.13] | [0.03,0.04] | [0.36,0.45] | [0.22,0.31] | [0.04,0.17] | [0.12,0.23] | [0.26,0.41] | [0.41,0.58] | [0.07,0.52] | [0.09,0.40] | [0.22,0.30] | [0.04,0.05] | [0.06,0.07] | [0.13,0.17] |
| S28 | [0.32,0.45] | [0.1,0.14] | [0.01,0.08] | [0.43,0.54] | [0.22,0.31] | [0.17,0.25] | [0.02,0.14] | [0.04,0.25] | [0.40,0.57] | [0.05,0.42] | [0.08,0.37] | [0.32,0.42] | [0.05,0.06] | [0.08,0.13] | [0.16,0.21] |
| S29 | [0.49,0.69] | [0.24,0.35] | [0.03,0.07] | [0.66,0.82] | [0.30,0.43] | [0.16,0.37] | [0.19,0.36] | [0.39,0.65] | [0.41,0.57] | [0.03,0.25] | [0.05,0.23] | [0.23,0.31] | [0.07,0.09] | [0.06,0.07] | [0.27,0.35] |
References
- Sun, Z.; Li, X.; Xie, Y. A comparison of innovative financing and general fiscal investment strategies for second-class highways: Perspectives for building a sustainable financing strategy. Transp. Policy 2014, 35, 193–201. [Google Scholar] [CrossRef]
- Ministry of Transport of the People’s Republic of China. Statistical Report of National Highways. 2017. Available online: http://www.mot.gov.cn/shuju/ (accessed on 5 January 2019).
- Xu, Y.; Sun, C.; Skibniewski, M.J.; Chan, A.P.; Yeung, J.F.; Cheng, H. System Dynamics (SD)-based concession pricing model for PPP highway projects. Int. J. Proj. Manag. 2012, 30, 240–251. [Google Scholar] [CrossRef]
- Huang, H.-J. Pricing and logit-based mode choice models of a transit and highway system with elastic demand. Eur. J. Oper. Res. 2002, 140, 562–570. [Google Scholar] [CrossRef]
- Song, S. Should China Implement Congestion Pricing? Chin. Econ. 2015, 48, 57–67. [Google Scholar] [CrossRef]
- Xu, Y.; Yeung, J.F.; Jiang, S. Determining appropriate government guarantees for concession contract: Lessons learned from 10 PPP projects in China. Int. J. Strateg. Prop. Manag. 2014, 18, 356–367. [Google Scholar] [CrossRef]
- Xu, X.; Zhang, K.; Kong, Y.; Chen, J.; Yu, B. Effectiveness of erosion control measures along the Qinghai–Tibet highway, Tibetan plateau, China. Transp. Res. Part D Transp. Environ. 2006, 11, 302–309. [Google Scholar] [CrossRef] [Green Version]
- Chen, C.; Doloi, H. BOT application in China: Driving and impeding factors. Int. J. Proj. Manag. 2008, 26, 388–398. [Google Scholar] [CrossRef]
- Grimsey, D.; Lewis, M.K. Evaluating the risks of public private partnerships for infrastructure projects. Int. J. Proj. Manag. 2002, 20, 107–118. [Google Scholar] [CrossRef]
- Dias, A., Jr.; Ioannou, P.G. Debt capacity and optimal capital structure for privately financed infrastructure projects. J. Constr. Eng. Manag. 1995, 121, 404–414. [Google Scholar] [CrossRef]
- Chou, J.-S.; Tserng, H.P.; Lin, C.; Yeh, C.-P. Critical factors and risk allocation for PPP policy: Comparison between HSR and general infrastructure projects. Transp. Policy 2012, 22, 36–48. [Google Scholar] [CrossRef]
- Liu, J.; Wei, Q. Risk evaluation of electric vehicle charging infrastructure public-private partnership projects in China using fuzzy TOPSIS. J. Clean. Prod. 2018, 189, 211–222. [Google Scholar] [CrossRef]
- Welch, I. Two common problems in capital structure research: The financial-debt-to-asset ratio and issuing activity versus leverage changes. Int. Rev. Financ. 2011, 11, 1–17. [Google Scholar] [CrossRef]
- Hoevenaars, R.P.; Molenaar, R.D.; Schotman, P.C.; Steenkamp, T.B. Strategic asset allocation with liabilities: Beyond stocks and bonds. J. Econ. Dyn. Control 2008, 32, 2939–2970. [Google Scholar] [CrossRef]
- Ertuğrul, İ.; Karakaşoğlu, N. Performance evaluation of Turkish cement firms with fuzzy analytic hierarchy process and TOPSIS methods. Expert Syst. Appl. 2009, 36, 702–715. [Google Scholar] [CrossRef]
- Wang, X.; Dennis, L.; Tu, Y.S. Measuring financial condition: A study of US states. Public Budg. Financ. 2007, 27, 1–21. [Google Scholar] [CrossRef]
- Lane, P.R.; Milesi-Ferretti, G.M. The external wealth of nations: Measures of foreign assets and liabilities for industrial and developing countries. J. Int. Econ. 2001, 55, 263–294. [Google Scholar] [CrossRef]
- Daskalakis, N.; Psillaki, M. Do country or firm factors explain capital structure? Evidence from SMEs in France and Greece. Appl. Financ. Econ. 2008, 18, 87–97. [Google Scholar] [CrossRef]
- Huang, G. The determinants of capital structure: Evidence from China. China Econ. Rev. 2006, 17, 14–36. [Google Scholar] [CrossRef]
- Altman, E.I. An emerging market credit scoring system for corporate bonds. Emerg. Mark. Rev. 2005, 6, 311–323. [Google Scholar] [CrossRef]
- Rehan, R.; Unger, A.J.; Knight, M.A.; Haas, C.T. Financially sustainable management strategies for urban wastewater collection infrastructure–Implementation of a system dynamics model. Tunn. Undergr. Space Technol. 2014, 39, 102–115. [Google Scholar] [CrossRef]
- Benito, B.; Montesinos, V.; Bastida, F. An example of creative accounting in public sector: The private financing of infrastructures in Spain. Crit. Perspect. Account. 2008, 19, 963–986. [Google Scholar] [CrossRef]
- Lucas, R.E., Jr. Interest rates and currency prices in a two-country world. J. Monet. Econ. 1982, 10, 335–359. [Google Scholar] [CrossRef]
- Ghorbani, A.; Ravanshadnia, M.; Nobakht, M.B. A survey of risks in public private partnership highway projects in Iran. In Proceedings of the 2014 International Conference on Construction and Real Estate Management (ICCREM), Kunming, China, 27–28 September 2014; pp. 482–492. [Google Scholar]
- Pantelias, A.; Zhang, Z. Methodological framework for evaluation of financial viability of public-private partnerships: Investment risk approach. J. Infrastruct. Syst. 2010, 16, 241–250. [Google Scholar] [CrossRef]
- Shaoul, J.; Stafford, A.; Stapleton, P. Highway robbery? A financial analysis of design, build, finance and operate (DBFO) in UK roads. Transp. Rev. 2006, 26, 257–274. [Google Scholar] [CrossRef]
- El-Sayegh, S.M.; Mansour, M.H. Risk assessment and allocation in highway construction projects in the UAE. J. Manag. Eng. 2015, 31, 04015004. [Google Scholar] [CrossRef]
- Wang, M.-T.; Chou, H.-Y. Risk allocation and risk handling of highway projects in Taiwan. J. Manag. Eng. 2003, 19, 60–68. [Google Scholar] [CrossRef]
- Mousavi, S.M.; Tavakkoli-Moghaddam, R.; Azaron, A.; Mojtahedi, S.; Hashemi, H. Risk assessment for highway projects using jackknife technique. Expert Syst. Appl. 2011, 38, 5514–5524. [Google Scholar] [CrossRef]
- Sastoque, L.M.; Arboleda, C.A.; Ponz, J.L. A proposal for risk allocation in social infrastructure projects applying PPP in Colombia. Procedia Eng. 2016, 145, 1354–1361. [Google Scholar] [CrossRef]
- Ebrahimnejad, S.; Mousavi, S.M.; Seyrafianpour, H. Risk identification and assessment for build–operate–transfer projects: A fuzzy multi attribute decision making model. Expert Syst. Appl. 2010, 37, 575–586. [Google Scholar] [CrossRef]
- Zhao, T.; Sundararajan, S.K.; Tseng, C.-L. Highway development decision-making under uncertainty: A real options approach. J. Infrastruct. Syst. 2004, 10, 23–32. [Google Scholar] [CrossRef]
- Kumar, L.; Jindal, A.; Velaga, N.R. Financial risk assessment and modelling of PPP based Indian highway infrastructure projects. Transp. Policy 2018, 62, 2–11. [Google Scholar] [CrossRef]
- Vassallo, J.; Sanchez-Solino, A. Subordinated public participation loans for financing toll highway concessions in Spain. Transp. Res. Rec. J. Transp. Res. Board 2007, 1996, 1–8. [Google Scholar] [CrossRef]
- Ng, A.; Loosemore, M. Risk allocation in the private provision of public infrastructure. Int. J. Proj. Manag. 2007, 25, 66–76. [Google Scholar] [CrossRef]
- Li, H.-J.; Zhao, Z.-M.; Yu, X.-L. Grey theory applied in non-subsampled Contourlet transform. IET Image Process. 2012, 6, 264–272. [Google Scholar] [CrossRef]
- Baskaran, V.; Nachiappan, S.; Rahman, S. Indian textile suppliers’ sustainability evaluation using the grey approach. Int. J. Prod. Econ. 2012, 135, 647–658. [Google Scholar] [CrossRef]
- Chithambaranathan, P.; Subramanian, N.; Gunasekaran, A.; Palaniappan, P.K. Service supply chain environmental performance evaluation using grey based hybrid MCDM approach. Int. J. Prod. Econ. 2015, 166, 163–176. [Google Scholar] [CrossRef] [Green Version]
- Zhang, Y.-J.; Zhang, X.-T.; Li, Q.-H.; Ran, L.; Cai, Z.-X. Gray theory based energy saving potential evaluation and planning for distribution networks. Int. J. Electr. Power Energy Syst. 2014, 57, 298–303. [Google Scholar] [CrossRef]
- Wu, Y.; Hu, Y.; Lin, X.; Li, L.; Ke, Y. Identifying and analyzing barriers to offshore wind power development in China using the grey decision-making trial and evaluation laboratory approach. J. Clean. Prod. 2018, 189, 853–863. [Google Scholar] [CrossRef]
- Bai, C.; Sarkis, J. A grey-based DEMATEL model for evaluating business process management critical success factors. Int. J. Prod. Econ. 2013, 146, 281–292. [Google Scholar] [CrossRef]
- Huang, G.; Dan Moore, R. Grey linear programming, its solving approach, and its application. Int. J. Syst. Sci. 1993, 24, 159–172. [Google Scholar] [CrossRef]
- Chan, J.W.; Tong, T.K. Multi-criteria material selections and end-of-life product strategy: Grey relational analysis approach. Mater. Des. 2007, 28, 1539–1546. [Google Scholar] [CrossRef]
- Khameneh, A.-H.; Taheri, A.; Ershadi, M. Offering a framework for evaluating the performance of project risk management system. Procedia-Soc. Behav. Sci. 2016, 226, 82–90. [Google Scholar] [CrossRef]
- Yang, H.; Meng, Q. Highway pricing and capacity choice in a road network under a build–operate–transfer scheme. Transp. Res. Part A Policy Pract. 2000, 34, 207–222. [Google Scholar] [CrossRef]
- Yang, H.; Meng, Q. A note on “highway pricing and capacity choice in a road network under a build-operate-transfer scheme”. Transp. Res. Part A Policy Pract. 2002, 36, 659–663. [Google Scholar] [CrossRef]
- Chen, X.; Zhang, L.; He, X.; Xiong, C.; Li, Z. Surrogate-based optimization of expensive-to-evaluate objective for optimal highway toll charges in transportation network. Comput.-Aided Civ. Infrastruct. Eng. 2014, 29, 359–381. [Google Scholar] [CrossRef]
- Shan, L.; Garvin, M.J.; Kumar, R. Collar options to manage revenue risks in real toll public-private partnership transportation projects. Constr. Manag. Econ. 2010, 28, 1057–1069. [Google Scholar] [CrossRef]
- Gul, F.A.; Tsui, J.S.L. A test of the free cash flow and debt monitoring hypotheses: Evidence from audit pricing. J. Account. Econ. 1997, 24, 219–237. [Google Scholar] [CrossRef]
- Mulier, K.; Schoors, K.; Merlevede, B. Investment-cash flow sensitivity and financial constraints: Evidence from unquoted European SMEs. J. Bank. Financ. 2016, 73, 182–197. [Google Scholar] [CrossRef]
- Chong, B.S. The impact of divergence in voting and cash-flow rights on the use of bank debt. Pac.-Basin Financ. J. 2010, 18, 158–174. [Google Scholar] [CrossRef]
- Gul, F.A. Free cash flow, debt-monitoring and managers’ LIFO/FIFO policy choice. J. Corp. Financ. 2001, 7, 475–492. [Google Scholar] [CrossRef]
- Richardson, S. Over-investment of free cash flow. Rev. Account. Stud. 2006, 11, 159–189. [Google Scholar] [CrossRef]
- Gleason, K.C.; Mathur, I.; Wiggins, R.A., III. The use of acquisitions and joint ventures by US banks expanding abroad. J. Financ. Res. 2006, 29, 503–522. [Google Scholar] [CrossRef]
- Ebneth, O.; Theuvsen, L. Large mergers and acquisitions of European brewing groups—Event study evidence on value creation. Agribus. Int. J. 2007, 23, 377–406. [Google Scholar] [CrossRef]
- Alcalde, A.; Fávero, L.P.L.; Takamatsu, R.T. EBITDA1 margin in brazilian companies Variance decomposition and hierarchical effects. Contad. Adm. 2013, 58, 197–220. [Google Scholar] [CrossRef] [Green Version]
- Fritsch, R. Comparative financial analysis of electricity utilities in West Africa. Energy Policy 2011, 39, 6055–6064. [Google Scholar] [CrossRef]
- Gaganis, C.; Pasiouras, F.; Doumpos, M. Probabilistic neural networks for the identification of qualified audit opinions. Expert Syst. Appl. 2007, 32, 114–124. [Google Scholar] [CrossRef]
- Effah Ameyaw, E.; Chan, A.P. Identifying public-private partnership (PPP) risks in managing water supply projects in Ghana. J. Facil. Manag. 2013, 11, 152–182. [Google Scholar] [CrossRef]
- Wu, Y.; Li, L.; Xu, R.; Chen, K.; Hu, Y.; Lin, X. Risk assessment in straw-based power generation public-private partnership projects in China: A fuzzy synthetic evaluation analysis. J. Clean. Prod. 2017, 161, 977–990. [Google Scholar] [CrossRef]
- Li, G.-D.; Yamaguchi, D.; Nagai, M. A grey-based decision-making approach to the supplier selection problem. Math. Comput. Model. 2007, 46, 573–581. [Google Scholar] [CrossRef]
- Golmohammadi, D.; Mellat-Parast, M. Developing a grey-based decision-making model for supplier selection. Int. J. Prod. Econ. 2012, 137, 191–200. [Google Scholar] [CrossRef]
- Lavee, D.; Beniad, G.; Solomon, C. The effect of investment in transportation infrastructure on the debt-to-GDP ratio. Transp. Rev. 2011, 31, 769–789. [Google Scholar] [CrossRef]
- Tsui, K.Y. China’s infrastructure investment boom and local debt crisis. Eurasian Geogr. Econ. 2011, 52, 686–711. [Google Scholar] [CrossRef]
- Zhang, S.; Gao, Y.; Feng, Z.; Sun, W. PPP application in infrastructure development in China: Institutional analysis and implications. Int. J. Proj. Manag. 2015, 33, 497–509. [Google Scholar] [CrossRef]
- Xu, M.; Grant-Muller, S.; Gao, Z. Evolution and assessment of economic regulatory policies for expressway infrastructure in China. Transp. Policy 2015, 41, 42–49. [Google Scholar] [CrossRef] [Green Version]
Figure 1.
Debt scale of toll freeways in each province in Mainland China. (a) Remaining debts, (b) debt–asset ratio.
Figure 1.
Debt scale of toll freeways in each province in Mainland China. (a) Remaining debts, (b) debt–asset ratio.

Figure 2.
Grey possibility values in Mainland China over the past 15 years.

Table 1.
Risk factor list based on literature review.
| Categories | Risk Factors | Literature |
|---|---|---|
| Debt scale risk | Debt–asset ratio | [13,14,15,16,17] |
| Remaining debts | [18,19,20] | |
| Repayment of principal and interest | [9,21,22,23] | |
| Cost of financing | [24] | |
| Debt structure risk | Commercial loan ratio | [25,26] |
| Proportion of short-term loans | [26,27] | |
| Debt management risk | Debt management system | [28] |
| Leadership and management skills | [28,29] | |
| Debt managers’ skill | [28,29] | |
| External environment risk | Policy | [28,30,31,32] |
| Interest-rate fluctuation | [25,30,31] | |
| Exchange-rate fluctuation | [27,30] | |
| Inflation rate | [25,28,33] | |
| Investment from the government finance | [32,34] | |
| Political interference | [28,35] |
Table 2.
Calculation results of debt risk factors.
| Risk Factors | OP | MI | IRI | Normalized Values of IRI | Ranking |
|---|---|---|---|---|---|
| Debt–asset ratio # | 5.33 | 5.16 | 5.26 | 0.99 | 1 |
| Remaining debts # | 5.15 | 4.86 | 5.21 | 0.98 | 2 |
| Free cash flow *,# | 4.97 | 4.62 | 5.17 | 0.96 | 3 |
| Toll revenue *,# | 4.82 | 4.65 | 5.09 | 0.94 | 4 |
| Investment from the government finance # | 5.01 | 4.54 | 4.94 | 0.92 | 5 |
| Proportion of short-term loans # | 4.67 | 4.23 | 4.85 | 0.91 | 6 |
| Repayment of principal and interest # | 4.53 | 4.36 | 4.79 | 0.89 | 7 |
| Commercial loan ratio # | 4.31 | 4.14 | 4.65 | 0.86 | 8 |
| EBITDA margin *,# | 3.95 | 3.58 | 4.43 | 0.82 | 9 |
| Debt management system @ | 3.79 | 3.62 | 4.37 | 0.81 | 10 |
| Policy @ | 3.63 | 3.43 | 4.26 | 0.79 | 11 |
| Debt managers’ skill @ | 3.32 | 3.15 | 4.17 | 0.77 | 12 |
| Interest rate # | 3.83 | 3.46 | 3.95 | 0.73 | 13 |
| Exchange-rate fluctuation @ | 3.63 | 2.96 | 3.78 | 0.68 | 14 |
| Inflation-rate fluctuation @ | 3.36 | 3.19 | 3.57 | 0.52 | 15 |
| Leadership and management skills @ | 3.23 | 2.87 | 3.14 | 0.48 | 16 |
| Cost of financing # | 3.06 | 2.75 | 3.05 | 0.42 | 17 |
| Political interference @ | 2.84 | 2.56 | 2.76 | 0.32 | 19 |
Note: * refers to newly added risk factors; # refers to quantitative risk factors; @ refers to qualitative risk factors.
Table 3.
The scale of criteria weights and qualitative criteria ratings value.
| Scale | Θw | ΘG |
|---|---|---|
| Very low (VL) | [0.0,0.1] | [0,1] |
| Low (L) | [0.1,0.3] | [1,3] |
| Medium low (ML) | [0.3,0.4] | [3,4] |
| Medium (M) | [0.4,0.5] | [4,5] |
| Medium high (MH) | [0.5,0.6] | [5,6] |
| High (H) | [0.6,0.9] | [6,9] |
| Very High (VH) | [0.9,1.0] | [9,10] |
Table 4.
Criteria weights of toll freeway debt risk evaluation.
| Categories | Risk Factors (Aj) | Unit | Θwj |
|---|---|---|---|
| Debt scale risk | Debt–asset ratio (A1) | % | [0.657,0.843] |
| Remaining debts (A2) | Billion USD | [0.714,0.900] | |
| Repayment of principal and interest (A3) | Billion USD | [0.571,0.757] | |
| Debt structure risk | Commercial loan ratio (A4) | % | [0.486,0.643] |
| Proportion of short-term loans (A5) | % | [0.614,0.771] | |
| Debt management risk | Debt management system (A6) | - | [0.729,0.943] |
| Debt managers’ skill (A7) | - | [0.451,0.625] | |
| External environment risk | Policy (A8) | - | [0.512,0.722] |
| Interest-rate fluctuation (A9) | - | [0.476,0.682] | |
| Exchange-rate fluctuation (A10) | - | [0.381,0.538] | |
| Inflation rate (A11) | % | [0.474,0.637] | |
| Investment from the government finance (A12) | Billion USD | [0.684,0.857] | |
| Solvency risk | Free cash flow (A13) | Billion USD | [0.437,0.618] |
| Toll revenue (A14) | Billion USD | [0.547,0.738] | |
| EBITDA margin (A15) | % | [0.671,0.816] |
Table 5.
Grey possibility degree values of 29 provinces.
| Grey Possibility Degree Range | Category | Provinces | Grey Possibility Degree Value | Ranking of GDP |
|---|---|---|---|---|
| 0.2 ≤ P{Si ≤ Smax} ≤ 0.3 | Low debt risk | Ningxia (S25) | 0.232 | 29 |
| Guangdong (S1) | 0.241 | 1 | ||
| Anhui (S19) | 0.253 | 13 | ||
| Qinghai (S26) | 0.258 | 30 | ||
| Shandong (S18) | 0.273 | 3 | ||
| Shanghai (S29) | 0.289 | 11 | ||
| 0.3 < P{Si ≤ Smax} ≤ 0.5 | Medium debt risk | Gansu (S22) | 0.324 | 27 |
| Xinjiang (S17) | 0.343 | 26 | ||
| Jilin (S23) | 0.360 | 23 | ||
| Zhejiang (S20) | 0.364 | 4 | ||
| Tianjin (S27) | 0.375 | 19 | ||
| Jiangsu (S14) | 0.391 | 2 | ||
| Liaoning (S16) | 0.424 | 14 | ||
| Chongqing (S24) | 0.458 | 18 | ||
| Sichuan (S15) | 0.489 | 6 | ||
| Guangxi (S13) | 0.493 | 17 | ||
| 0.5 < P{Si ≤ Smax} ≤ 0.7 | High debt risk | Inner Mongolia (S6) | 0.511 | 22 |
| Heilongjiang (S5) | 0.523 | 21 | ||
| Jiangxi (S9) | 0.546 | 16 | ||
| Guizhou (S8) | 0.552 | 25 | ||
| Hunan (S2) | 0.567 | 9 | ||
| Shanxi (S10) | 0.579 | 24 | ||
| Beijing (S28) | 0.588 | 12 | ||
| Fujian (S12) | 0.605 | 10 | ||
| Hubei (S11) | 0.618 | 7 | ||
| Yunnan (S21) | 0.632 | 20 | ||
| Shaanxi (S7) | 0.643 | 15 | ||
| Henan (S3) | 0.674 | 5 | ||
| Hebei (S4) | 0.686 | 8 |
© 2019 by the authors. Licensee MDPI, Basel, Switzerland. This article is an open access article distributed under the terms and conditions of the Creative Commons Attribution (CC BY) license (http://creativecommons.org/licenses/by/4.0/).
Share and Cite
MDPI and ACS Style
Mao, X.; Gan, J.; Zhao, X. Debt Risk Evaluation of Toll Freeways in Mainland China Using the Grey Approach. Sustainability 2019, 11, 1430. https://0-doi-org.brum.beds.ac.uk/10.3390/su11051430
AMA Style
Mao X, Gan J, Zhao X. Debt Risk Evaluation of Toll Freeways in Mainland China Using the Grey Approach. Sustainability. 2019; 11(5):1430. https://0-doi-org.brum.beds.ac.uk/10.3390/su11051430
Chicago/Turabian StyleMao, Xinhua, Jiahua Gan, and Xilong Zhao. 2019. "Debt Risk Evaluation of Toll Freeways in Mainland China Using the Grey Approach" Sustainability 11, no. 5: 1430. https://0-doi-org.brum.beds.ac.uk/10.3390/su11051430
Note that from the first issue of 2016, this journal uses article numbers instead of page numbers. See further details here.