Article

Influence of Ownership Structure on the Determinants of Effective Tax Rates of Spanish Companies

by
Elena Fernández-Rodríguez
*,
Roberto García-Fernández
and
Antonio Martínez-Arias
Department of Accounting, Faculty of Economics and Business, University of Oviedo, Avenida del Cristo, 33071 Oviedo, Spain
*
Author to whom correspondence should be addressed.
Sustainability 2019, 11(5), 1441; https://0-doi-org.brum.beds.ac.uk/10.3390/su11051441
Submission received: 29 January 2019 / Revised: 27 February 2019 / Accepted: 4 March 2019 / Published: 8 March 2019
(This article belongs to the Section Air, Climate Change and Sustainability)

Abstract

:
This paper examines the effect of state ownership on the effective tax rates of Spanish companies. Using information regarding 3169 companies during the period of 2008–2014, we show that there are significant differences between the tax burdens of non-state-owned enterprises (NSOEs) and state-owned enterprises (SOEs), with the effective tax rates of private ownership companies being higher than those of state-owned firms. Company features, such as size, leverage, research and development investment, profitability, firm age, foreign operations, and auditing determine the tax burden of private ownership firms. That of state-owned companies, however, is affected only by leverage and capital intensity. For both SOEs and NSOEs, the tax burden is lower when they are taxed under the Spanish special taxation regime for small- and medium-sized enterprises. In short, company characteristics are more important in private ownership firms, in which almost all the variables considered have certain repercussions. This result may be because private ownership companies devote more resources to tax avoidance, and their fiscal strategy may determine their economic and financial structure. However, SOEs present significantly lower effective tax rates than NSOEs, probably because of the tax incentives that the law provides for them to support their sustainability.

Graphical Abstract

1. Introduction

The empirical literature on the effective tax rate (ETR) has grown over the last few decades. Early research aimed at identifying the company features that explain their tax strategies. In this initial stage, well described in reviews by Shackelford and Shevlin [1], Hanlon and Heitzman [2], and Graham et al. [3], the company features that can explain the ETR were analyzed. Leading studies from that early stage include those by Stickney and McGee [4], Zimmerman [5], Gupta and Newberry [6], Mills et al. [7], Manzon and Plesko [8], and Rego [9].
Subsequently, this line of research has advanced, and researchers have proposed other focuses and incorporated new variables, as described in the review by Wilde and Wilson [10]. Several studies have considered management incentives [11,12,13,14,15,16], company governance activities [17,18,19,20,21,22,23,24,25], or ownership structure from various perspectives [26,27,28,29,30,31].
This paper is framed within the latter category, because its purpose is to analyze whether ownership structure has an impact on the ETR of Spanish companies. For this purpose, the explanatory variables of ETRs are initially studied considering the firms’ ownership structure, whether state-controlled or privately controlled, as the main variable. Then, the effects of the ownership type on the determinants of ETR are considered, taking variables used in the prior literature, such as size, leverage, asset structure, capital intensity, and profitability. In addition, other more novel variables are incorporated, such as firm age, audit of financial statements, foreign operations, and the special taxation regime provided by Spanish regulations for small- and medium-sized enterprises (SMEs).
There has been little previous research on the effect of state ownership on the ETR. As far as we know, this variable has only been considered in the studies by Zeng [28], Wu et al. [29], Chan et al. [32], and Wu et al. [33] for listed companies in China, and in the papers of Derashid and Zhang [34], Adhikari et al. [35], and Mahenthiran and Kasipillai [36] for listed companies in Malaysia. These papers are addressed in the following section.
Other prior research that considered the effect of ownership structure on the ETR has had different focuses. Several studies focused on determining the impact of the tax burden associated with family or non-family ownership, one in the US and the other in Spain [26,27]. A second group of studies focused on the effects of the separation between ownership and control on taxation. Such studies primarily addressed the US and China, namely, the works of Badertscher et al. [30], McGuire et al. [31], and Khan et al. [37] for the US and Tang et al. [38] for China.
In consequence, there have been no prior studies in Spain analyzing ETRs and distinguishing between state and private enterprises. However, we consider that there may be differences between the two types of enterprises, although which will bear greater tax pressure cannot be predicted a priori. On the one hand, state-owned enterprises (SOEs) are probably less fiscally aggressive than non-state-owned enterprises (NSOEs), but, on the other, there are some tax incentives in Spain to foster the sustainability of SOEs provided that they meet certain social needs. We therefore consider that it would be of great interest to carry out research focusing on Spain on the effect of state or private ownership on ETRs and their determinants. The results would be very useful for both the government and businesses, as such results would explain the real effect of tax regulations.
The contribution of this paper is three-fold. Firstly, it analyzes all types of Spanish non-financial companies, thus broadening the scope of previous research that was mostly limited to listed companies. This allows conclusions to be drawn that can be extrapolated to all Spanish companies and not only to listed companies, which are the minority.
Secondly, it considers a country that is very different from China and Malaysia, which are the countries where most of the related studies have been carried out. While China and Malaysia are considered emerging countries, Spain has been ranked among the developed countries for decades. Therefore, it will be of great interest to know whether the structure of ownership affects the ETRs of companies operating in a developed country.
Thirdly, the sample is analyzed as a whole, but the model estimations incorporate a variable representing state ownership and its interactions with the remaining explanatory variables. This is a novel approach. With such interactions, it will be possible to know if ownership structure affects the ETR determinants.
Specifically, the following questions are addressed:
  • Does ownership structure influence the ETRs of Spanish firms?
  • Does ownership structure affect the determinants of the ETRs of Spanish firms?
To answer these questions, a sample of 3169 Spanish non-financial companies, both listed and unlisted, over the period of 2008–2014 is analyzed, of which 2961 are privately owned and 208 are state-owned. To classify them, the ownership structure is taken into account, distinguishing between state-owned enterprises (SOEs), in which the government owns the majority of the capital, and non-state-owned enterprises (NSOEs), in which private investors own the majority of the capital. Regarding the methodology applied, the estimations were performed using random effects, controlling for both heteroscedasticity and autocorrelation.
The research is structured as follows: Section 2 introduces the explanatory variables of ETRs, sets the hypothesis, and designs the research models; Section 3 describes the selected sample and explains empirical results; and Section 4 summarizes the conclusions.

2. Study Design

2.1. Ownership Structure

As noted in the previous section, much of the literature has attempted to define what factors influence the ETR. The present study pays special attention to the effect of state ownership on the ETR. More specifically, the main objective is to determine how the type of ownership affects the determinants of the ETRs of Spanish companies. The main results of the prior studies on Chinese and Malaysian companies are discussed below. So far, these are the only papers that have addressed the effects of state ownership on the ETR.
For Chinese companies, Zeng [28] examined the effect of ownership concentration and state ownership on the tax practices of listed companies from 1998 to 2008, showing that firms with equity concentration bear a lower tax burden and that firms whose largest shareholders are government-related have higher ETRs compared with those without such shareholders. This suggests that paying more taxes carries with it a good reputation for managers, making them more likely to receive promotions and a promising political career. It also provides support for the argument that government-related firms pursue social and political goals rather than maximizing profit.
Wu et al. [33] examined how the type of ownership and institutional environment affect the taxation of listed Chinese companies between 1999 and 2006. These authors found that private ownership companies enjoy a lower effective tax rate than local government entities. In addition, preferential taxation of private ownership firms is associated with local government incentives to promote local economic growth. They also concluded that private ownership companies located in regions with lower levels of privatization receive preferential tax treatment.
In the abovementioned two studies [28,33], the estimates were made using a sample of companies that included both SOEs and NSOEs, and the models incorporated a variable to capture the effect of ownership structure on the ETR. Therefore, they could only conclude whether or not the ownership structure affected the ETR but could not draw conclusions on the impact of ownership on the factors determining the tax burden. Both these research papers show that firm size, capital intensity, and inventory intensity have a positive impact on the ETR. For debt and profitability, however, the results vary, as Zeng [28] found that neither of the two variables is significant, while Wu et al. [33] found a negative relationship between both variables and the ETR.
Wu et al. [29] used state ownership and tax status to analyze the relationship between size and ETR for listed Chinese companies between 1998 and 2006. In particular, they examined how firm size, state ownership, and tax status together affect the ETR of Chinese companies. These authors found that when firms do not enjoy a preferential tax status, firm size is positively associated with effective tax rates for privately controlled firms but negatively for state-controlled firms. The results show that political cost theory explains the relationship between size and ETR for SOEs, whereas political power theory explains this relationship for NSOEs. For companies that already enjoy a preferential tax status, there is no significant relationship between their size and their tax burdens.
It is important to note that Wu et al. [29] separated firms into two samples, distinguishing between SOEs and NSOEs, and the estimates were carried out separately. Therefore, variables representing ownership structure were not included in the model. The results show few differences between the explanatory variables of the ETR for each group of firms. Leverage and capital intensity have a negative impact on the ETR, and inventory intensity and profitability have a positive impact on the tax burden, while size has a different effect on the ETR of SOEs and NSOEs, as mentioned above.
Finally, Chan et al. [32] investigated how government ownership and corporate governance influence the tax aggressiveness of listed Chinese companies from 2003 to 2009. This study adopted a different approach to the previous ones, because it studied fiscal aggressiveness, which the authors measured using two dependent variables based on the ETR. Therefore, the results of this research are not comparable with the previous ones nor with those obtained in this study. They found that companies not controlled by the government adopt a more aggressive fiscal strategy than SOEs. They note that SOEs have higher ETRs, providing evidence that managers of government-controlled firms pursue the political objective of protecting government revenues, leading their firms to avoid aggressive tax planning.
With regard to the studies carried out for listed companies in Malaysia, it should be noted that they considered the variable representing government ownership as one of the explanatory variables of the corporate tax burden. However, no research has studied the effect of ownership structure on the determinants of the ETR. Derashid and Zhang [34], for the period of 1990–1999, concluded that whether a company is state-owned or privately owned has no bearing on the ETR. However, Adhikari et al. [35], for the same time frame, showed that companies achieve lower taxation as the percentage of government ownership increases. Finally, Mahenthiran and Kasipillai [36], for the period of 2006–2008, observed that ETRs based on tax payment are lower for SOEs. However, when they analyzed ETRs based on corporate income tax expense, state ownership was not a significant determinant.
Consequently, the effect of state ownership on the ETR in Malaysia does not seem so clear, and furthermore, its effect is contrary to that observed in China. The reason SOEs have a lighter tax burden is because they enjoy government privileges (e.g., tax subsidies and government investment), which may help lower their ETRs.
An analysis of the prior literature reveals two different scenarios. On the one hand, in China, SOEs are subject to higher tax burdens, because they avoid tax strategies that might affect the reputation of the managers. Moreover, state-owned companies do not always aim to maximize profit but, rather, to cover social needs. However, on the other hand, there is evidence that Malaysian SOEs have lower ETRs than NSOEs, although the results are inconclusive.
In general, Spanish tax legislation is common to all companies, but it establishes some tax incentives that affect only state-owned companies. The motivation is the sustainability of these firms, because some cover social needs. For this reason, for SOEs, there might be an indirect relationship between state ownership and tax burden.
Consequently, the sign of the relationship between ownership type and ETRs in Spanish companies is not clear a priori. According to the first argument given above, state-owned companies will bear higher ETRs than private ownership companies, but according to the second, SOEs will enjoy lower ETRs than NSOEs. Accordingly, depending on which of the two circumstances has a greater weight, government-controlled Spanish enterprises will have higher or lower ETRs than private ownership companies. However, although this aspect is of interest, our main objective is to test the impact of the type of ownership on the determinants of the tax burden. If state-owned or privately owned companies adopt different tax strategies, then surely the determinants of their tax burden will also differ, although in China the factors determining the ETR of both types of company are practically the same, except for firm size.
Therefore, the following hypotheses are proposed for testing:
Hypothesis 1 (H1).
Ownership structure, whether state-owned or privately owned, affects ETR.
Hypothesis 2 (H2).
Relations between business characteristics and ETR are affected by ownership structure, whether state-owned or privately owned.
The possible explanatory variables of ETRs are analyzed below, addressing not only the prior literature, but also considering the specific features of the Spanish tax system.

2.2. Control Variables

As is customary in ETR research, size, leverage, tangible assets, investment in research and development (RD), inventory, and profitability are included as control variables. For these variables, which are habitually used in the literature [6,21,25,27,28,29,33,34,35,36,39,40], there is no consensus as to their effect on the ETR, as can be noted from the literature review performed by Fonseca-Díaz et al. [41]. This may be for various reasons, such as the way in which the ETR is measured, the country, the timeframe, or the type of firm. Moreover, Delgado et al. [42] concluded that there is more or less a consensus with regard to the principal explanatory variables of the ETR: size, leverage, composition of the assets, and profitability, but the results are not conclusive, as they find different relations between these variables and the ETR.
In addition, firm age is considered, because younger companies have less experience in all aspects including taxation and are expected to bear a higher tax burden [26,27]. On the other hand, in Spain, newly created companies benefit from lower statutory tax rates that may bring a lower tax burden.
We also consider foreign operations, imports, and exports. In contrast, most previous studies considered conducting operations overseas through subsidiaries [43,44,45,46].
Whether the company falls under a special regime implemented in Spain since 1995, which grants certain advantages to SMEs is also considered [27]. To define this group of companies, we classify them by annual net revenues—at 8 million euros during 2008–2010 and at 10 million euros after 2011.
Finally, another variable considered is whether the company is audited, because we understand that firms under audit will adopt a conservative fiscal strategy to avoid problems with the auditors. This represents a variant from the previous literature, because some studies have considered the audit to be a determinant of the ETR. However, the variable that is commonly analyzed is whether or not the auditing firm is one of the BIG-4 because most previous studies use samples in which all the companies are audited [21,36,47].

2.3. Econometric Specification and Description of Variables

Statistical tests were run to determine whether the use of ordinary least-squares method was more appropriate than panel data. The F test and the Breush and Pagan multiplier test indicated that it is appropriate to consider individual effects and to work with panel data. The suitability of using a dynamic model was then verified, including the lagged dependent variable in the model. It was concluded that this lagged variable is not significant, and the model cannot be estimated using the Arellano and Bond [48] methodology.
For this reason, the estimates were run using static panel data, and the Hausman test was applied to verify whether the individual effects are correlated with the explanatory variables. Although, initially, the results of the test advised the use of fixed effects, the features of the independent variables made it more advisable to use random effects. Thus, as Hsiao [49] noted, fixed-effect estimation removes information from the model and makes it impossible to estimate the β of the constant variables over time. This is because the method must perform a transformation that cancels out these variables, so it does not consider their effect [50].
Given the above and considering that the GOVOWN (Government Ownership) variable is invariant over time, the random effect estimator was chosen, even though autocorrelation (Wooldridge test) and heteroscedasticity (Wald test) tests were also done, with both problems being detected. Therefore, estimates were performed using a methodology of feasible generalized least squares to control for both problems.
To test the hypotheses presented in the previous section, the following models were estimated, considering that model (1) searches for the explanatory variables of the ETR, one of them being ownership structure, whereas model (2) aims to test the effect of the state ownership variable over the other explanatory variables:
ETRi,t = β0 + β1GOVOWNi,t + β2SIZEi,t + β3LEVi,t + β4CAPINTi,t + β5RDi,t + β6INVINTi,t + β7ROAi,t + β8FIRMAGEi,t + β9FOREIGNi,t + β10SMEi,t + β11AUDITi,t + Sector Dummies + Year Dummies + υ + εi,t
ETRi,t = β0 + β1GOVOWNi,t + β2SIZEi,t + β3GOVOWNxSIZEi,t + β4LEVi,t + β5GOVOWNxLEVi,t + β6CAPINTi,t + β7GOVOWNxCAPINTi,t + β8RDi,t + β9GOVOWNxRDi,t + β10INVINTi,t + β11GOVOWNxINVINT,t + β12ROAi,t + β13GOVOWNxROAi,t + β14FIRMAGEi,t + β15GOVOWNxFIRMAGEi,t + β16FOREIGNi,t + β17GOVOWNxFOREIGNi,t + β18SMEi,t + β19GOVOWNxSMEi,t + β20AUDITi,t + β21GOVOWNxAUDITi,t + Sector Dummies + Year Dummies + υ + εi,t
where the ETR is the dependent variable indicating the company’s tax burden. According to Martínez Vargas [51], the studies generally calculated the tax burden using the tax expense as a proxy for tax payments, but both are different. For this reason, in this research the tax burden is defined in six different ways, three in terms of corporate income tax (CIT) expense and the three in terms of CIT payment:
  • GAAPETR1: The tax expense is divided by the pretax income of entity i in year t. For this first measure of tax burden, all the observations with a negative tax expense and/or negative pretax income were eliminated. Observations with values greater than one were also eliminated to limit the variable between zero and one, as is customary in the prior literature.
  • GAAPETR2: The tax expense is divided by the pretax income of firm i in year t. For this second measure, all the observations for the dependent variable -ETR- were used, following the methodology of Monterrey-Mayoral and Sánchez-Segura [21]. According to these authors, the use of all the observations allows for greater generality and richer empirical results.
  • GAAPETR3: This is a measure of long-term tax burden, based on the methodology developed by Dyreng et al. [52]. It is defined as the three-year sum (from year t − 2 to year t) of the tax expense divided by the three-year sum of pretax income.
  • CASHETR1: This is the cash tax paid by the pretax income of entity i in year t. As with the first measure based on income tax expense, all the observations with negative cash taxes paid and/or negative pretax income were eliminated. In addition, the variable is limited between zero and one, following the usual procedure from previous investigations.
  • CASHETR2: This is the cash tax paid by the pretax income of company i in year t, using all the observations, again following the criteria of Monterrey-Mayoral and Sánchez-Segura [21].
  • CASHETR3: This is the second measure of the long-term tax burden, defined as the three-year sum (from year t − 2 to year t) of the cash tax paid divided by the three-year sum of pretax income [52].
GAAPETR1 and CASHETR1 are the two measures that are most widely used in the prior literature to calculate the ETR [53]. GAAPETR2 and CASHETR2 were developed by Dyreng et al. [52], and they are used in some research. Finally, GAAPETR3 and CASHETR3 are the newer measures [21] and thus the least used in related studies.
Regarding the explanatory variables, GOVOWN is the variable of interest. It is a dummy, indicating the ownership structure of the company, and it equals 1 if the majority of the firm is owned by the government (more than 50%) and 0 otherwise.
Regarding the control variables, SIZE is the size of the entity, measured as the natural logarithm of total assets; LEV is leverage, calculated as the ratio of total debt to total assets; CAPINT is capital intensity, calculated as the ratio of property, plant, and equipment to total assets; RD is research and development intensity, calculated by dividing RD investment by total assets; INVINT is inventory intensity, calculated as the ratio of inventories to total assets; ROA is the return on assets, measured as the ratio of pre-tax net income and total assets; FIRMAGE is the firm’s age, measured as the logarithm of the firm’s years of life; FOREIGN is a dummy variable representing foreign operations that equals 1 if the entity performs these operations and 0 otherwise; SME is a dummy for a small and medium enterprise, which takes the value 1 if the company is subject to the special SME tax regime and 0 otherwise; and AUDIT is a dummy variable for auditing, which equals 1 if the entity is audited and 0 otherwise. Also, sector dummies and year dummies are included to control for potential sector and year fixed effects.
Finally, it should be noted that all the variables, both dependent and independent, except for the dummies, were limited by the percentiles of 1% and 99% to avoid outliers. In addition, to facilitate readability, all the variables are summarized in Appendix A.

3. Sample and Results

3.1. Sample

This paper used the Sistema de Análisis de Balances Ibéricos (SABI) database, elaborated by Bureau van Dijk, which is now a Moody’s Analytics Company. This database contains financial information of Spanish and Portuguese companies, both listed and unlisted.
To carry out this research, information from the annual accounts of Spanish companies during the 2008–2014 period was gathered. It was not possible to cover a longer period with homogeneous data, because it was necessary to avoid the effect of Spanish legislative reforms. First, there was an accounting reform in 2007, which is why the timeframe begins in 2008. Then, there were two other reforms that became effective as of 2015: Act 27/2014 of 27 November on Corporate Income Tax, and Act 22/2015 of 20 July on Auditing. This is why the last year considered in this study is 2014.
The firms were classified by sector according to the standard industrial classification (SIC): agriculture, forestry, and fishing; mining; construction; manufacturing; transportation, communication, electric, gas, and sanitary services; wholesale trade; retail trade; finance, insurance, and real estate; services; and public administration.
Firms in the finance, insurance, and real estate SIC were excluded, as is common in the prior literature, because they have special features and specific regulations. In addition, for all the sectors to be representative of both types of ownership, those in which the number of SOEs or NSOEs did not reach 5% were eliminated. Finally, all the firms with particular features or those that are subject to special regulations, such as associations or cooperatives, were excluded, because they may distort the results.
After filtering, as shown in Table 1, the sample comprised 3169 companies, 208 state-owned and 2961 privately owned.

3.2. Descriptive Statistics and Mean Difference

Table 2 presents the descriptive statistics and the variables used. Panel A shows the mean, median, percentiles, minimum, maximum, and the means comparison test for every variable, both dependent and independent, and panel B shows the Pearson correlation matrix.
The results show that there is a clear difference between the ETR of state-owned and privately owned Spanish companies. It is visibly greater in NSOEs, because of all of the tax burden measures used. In fact, there are significant differences for the six ETR measures at the 1% level, as observed through the means comparison test. Specifically, the ETRs of state-owned companies fluctuate between 5.42% and 14.48%, whereas those for private ownership companies range between 12.29% and 26.48% on average during the analysis period, depending on the ETR definition considered. In addition, if the comparison is made between the ETRs and the statutory tax rate in force over the period (30%), it is observed that the ETR is always lower, regardless of the measure used and the type of ownership. There are large differences between the ETRs calculated according to income tax expense versus those based on CIT payments, with the former being higher.
Regarding the explanatory variables, they are all significantly different at the 1% level. In fact, a high percentage of SOEs are larger, less leveraged, have more capital intensity and inventory and less RD, are less profitable, older, perform fewer foreign operations, most are SMEs, and are audited.
It is clear that there are significant differences between state-owned and privately owned companies, which could have an impact on their respective tax burdens. It is, therefore, of great interest to analyze the determinants of the ETRs of both types of enterprise, because they are likely to play a different role because of their different characteristics.
Regarding the correlation matrix, as shown in panel B of Table 2, all the ETR measures are negatively correlated with the variable representing ownership. Furthermore, the control variables are generally correlated with the ETR, except for the one representing foreign operations.

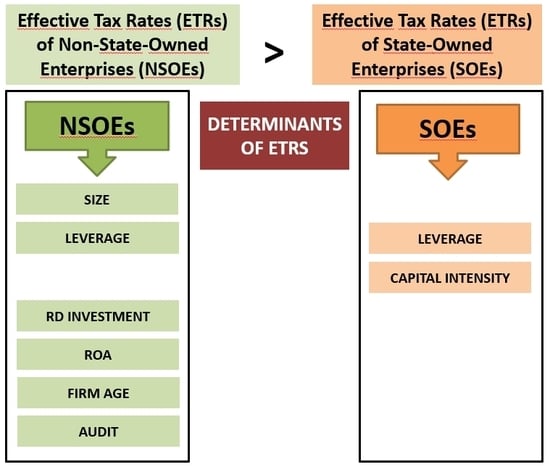
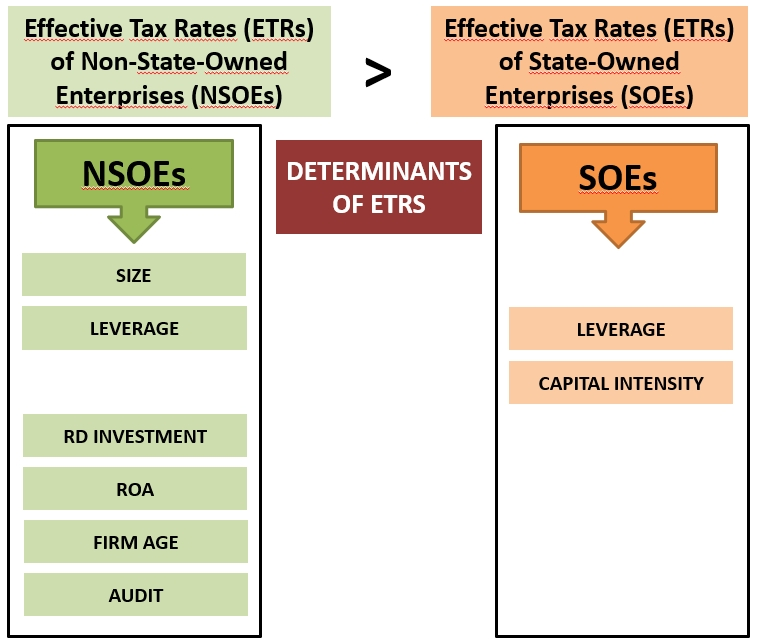
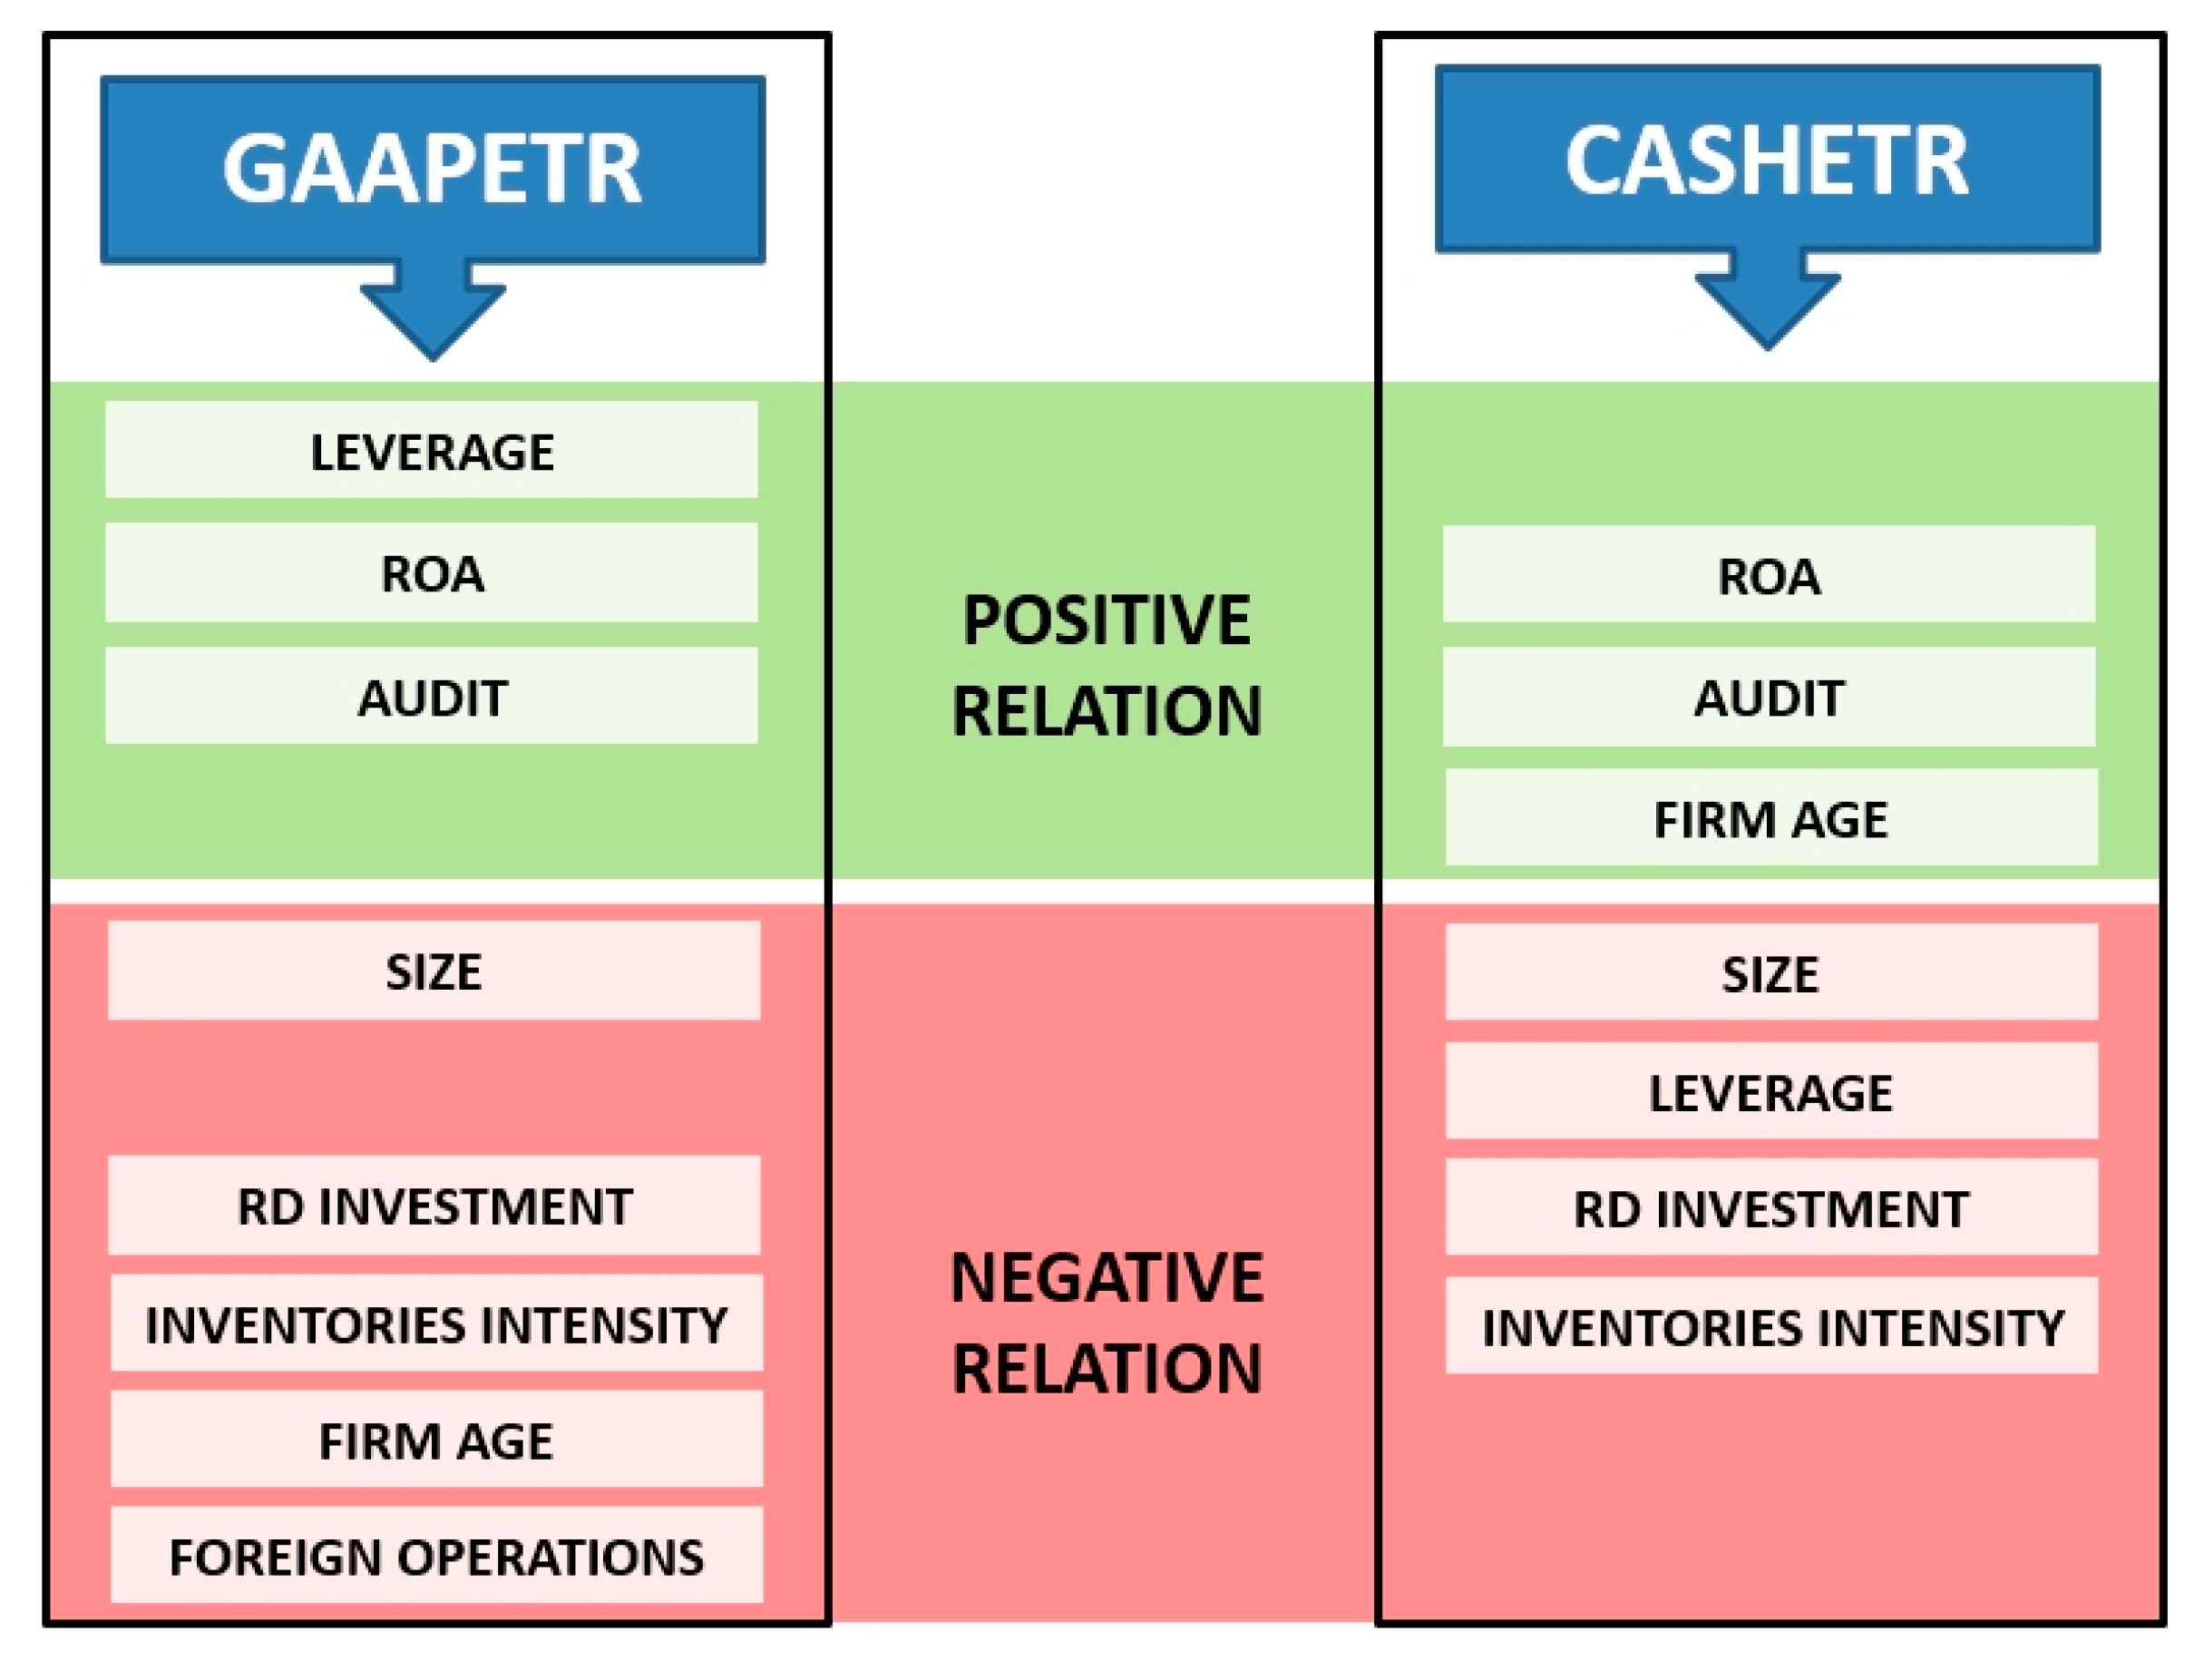
3.3. Determinants of Effective Tax Rates in Spanish State-Owned and Privately Owned Companies

The regression results for model (l) are shown in Table 3 according to the different ETR measures.
The negative and significant (at the 1% level) coefficient of the GOVOWN variable in all the estimations shows that the ETRs of SOEs are lower than those of NSOEs; this finding was verified in the means comparisons. These results confirm that the tax incentives offered by Spanish regulations for state-owned companies have a greater impact on the ETR than the tax strategy of private ownership companies. This result is the opposite of that obtained in previous research conducted in China [28,29,32,33].
The size variable turned out to be significant in all the estimations performed. The negative and significant coefficient indicates that larger companies have a lower ETR, thereby confirming the political power hypothesis and the greater allocation of resources to tax strategy to reduce taxation.
The coefficient of the leverage variable was negative and significant in all the estimations corresponding to CASHETR but was positive and significant for those related to GAAPETR. Therefore, companies with greater leverage pay less for CIT but bear a larger tax burden through income tax expense. The reason may be the presence of interests in excess of the tax-deductible limit in a fiscal year, because they can be deducted in future years. This affects the deferred tax of companies.
In the case of capital intensity, the results of the estimates were inconclusive, because the coefficient was only significant in estimates (II) and (IV), that is, in one case for expenditure and in the other for payment. Therefore, this variable cannot be considered a determinant of the ETR.
Regarding the RD variable, in all the estimations the coefficient was negative and significant, showing that the tax incentives offered by Spanish regulations have practical repercussions in that they allow the companies with the most intensive RD to reduce their tax burden.
The coefficients of the inventory intensity variable were negative and significant in all six estimations, indicating that companies with high inventories bear lower ETRs, even though such assets do not benefit from any tax incentive.
The ROA variable was always significant, even though in estimation (I) the relationship was indirect, whereas in the five other estimations it was direct. Therefore, it seems clear that the most profitable companies bear greater tax burdens, as has been shown in most of the prior literature. It must be noted that in the sample used for estimation (I), all the observations with accounting losses were eliminated, leaving only the most profitable companies. Therefore, perhaps this group allocates greater resources to tax strategy and reduces its ETR based on income tax expense through deferred tax.
The coefficient of the FIRMAGE variable was positive and significant in all estimations corresponding to CASHETR but was negative and significant for GAAPETR. Consequently, older companies pay greater taxes, but the indirect relationship for ETRs based on income tax expense might result from accumulated experience, enabling them to adopt a better tax strategy by taking advantage of deferred taxation.
With regard to external operations represented by the FOREIGN variable, this variable had a negative and significant coefficient for the first two estimations, indicating that companies carrying out more foreign operations reduce their ETRs based on corporate income tax expense. However, there was no conclusive relationship between ETR and CIT payment.
Concerning the SME variable, the six estimations showed that SMEs have lower ETRs, which is consistent with the tax benefits offered by Spanish regulations for this group of companies.
Finally, for the AUDIT variable, the results showed positive and significant coefficients in five out of six estimations, which shows that companies subject to auditing bear a larger tax burden. This is probably due to the application of more conservative fiscal strategies to avoid problems with the auditors.

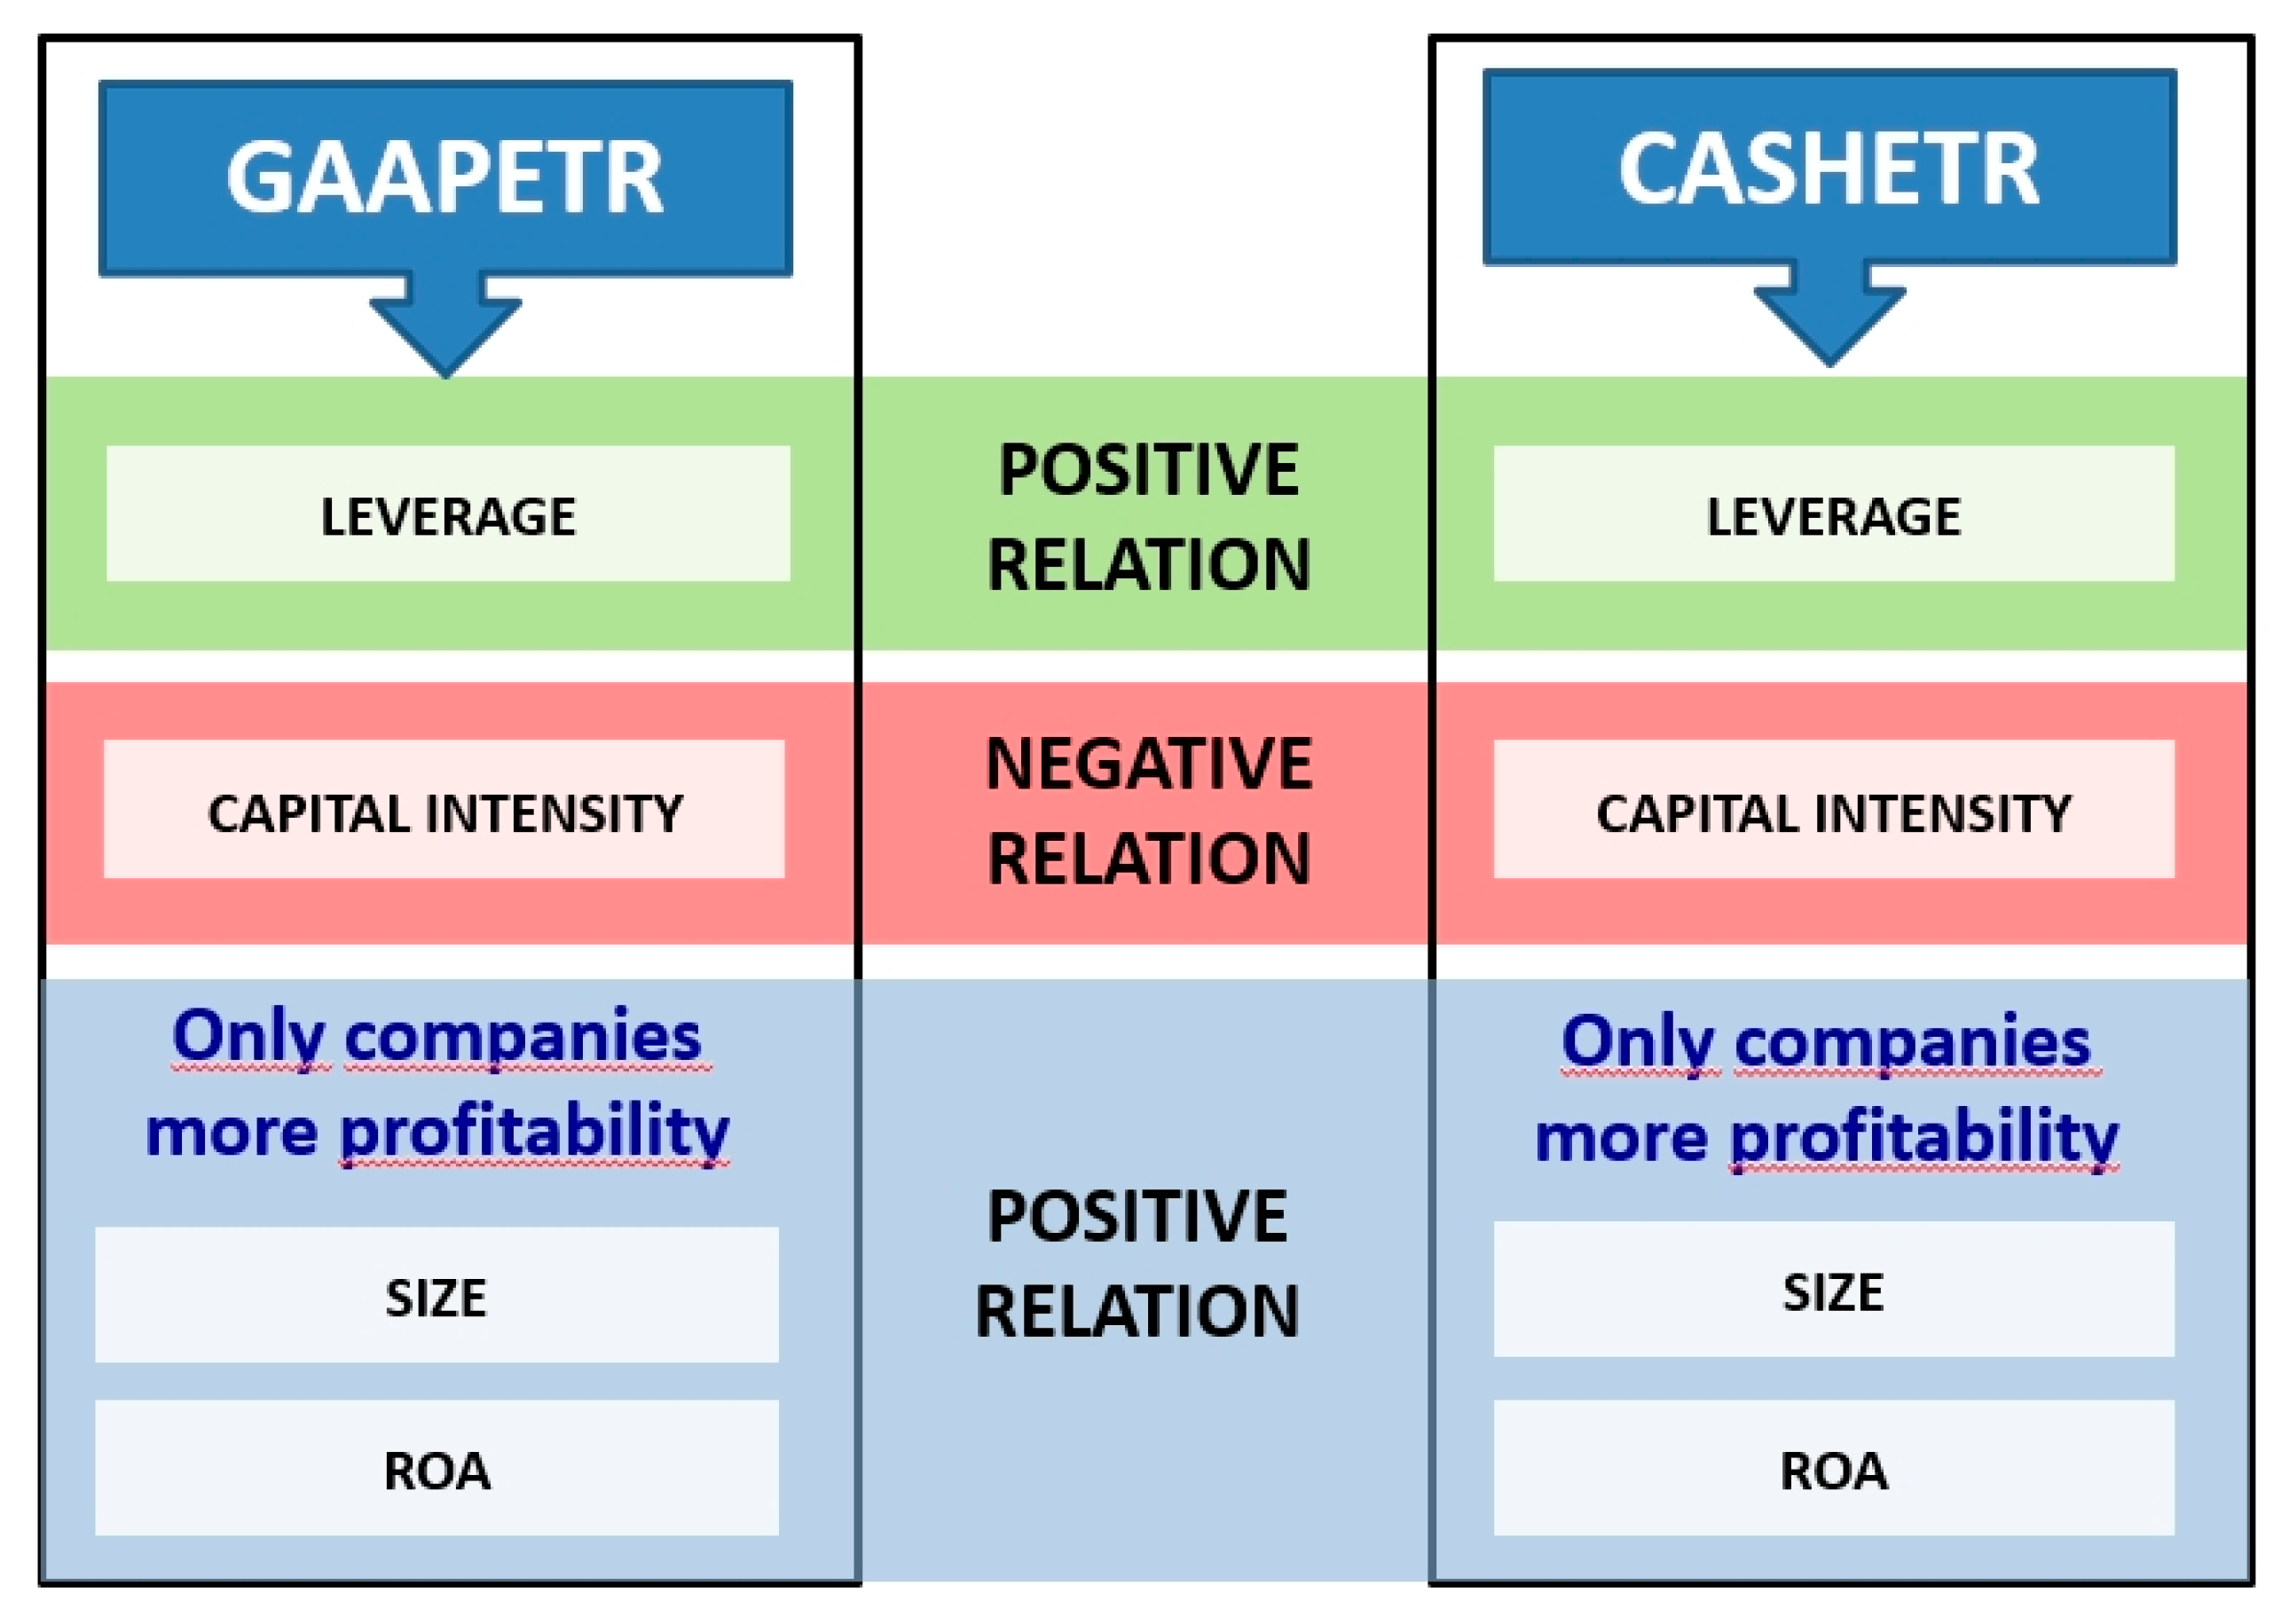
3.4. Effects of Ownership Structure on the Effective Tax Rates of Spanish Companies

This section analyzes whether the relations between the explanatory variables and the ETR of the sample as given in the previous section differ between state-owned and privately owned companies. To perform this test, each explanatory variable was interacted with the dummy for state ownership (GOVOWN), as shown in model (2).
As in Table 3, the coefficients for each of these explanatory variables provide evidence regarding their association with the ETR of private ownership firms, whereas the sum of these coefficients plus the coefficients of their corresponding interaction terms with GOVOWN provides evidence as to whether such explanatory variables are associated with the ETR when the company is state-owned.
The results of all six estimations of model (2) are shown in Panel A of Table 4 and the sum of the coefficients is shown in Panel B of Table 4.
The coefficient of the SIZE variable was negative and significant for the six estimates for model (2), corroborating the results obtained with the model (1). However, for the variable GOVOWNxSIZE only the coefficients for estimates (I) and (IV) were significant and had a positive sign. These estimations are for companies with a positive pretax result, meaning that size is directly related to tax burden for more profitable SOEs. Therefore, the inverse relationship between tax burden and size is ratified, but only for private ownership companies. Consequently, the political power hypothesis has effects on all NSOEs, which manage to reduce their ETRs when they are larger. Furthermore, it is likely that this lower tax burden is because private ownership companies dedicate more resources to tax strategy than state-owned firms. On the other hand, the political cost hypothesis has effects on state firms, but only on the most profitable ones.
Regarding leverage, the signs and significance for the LEV variable were also maintained in relation to model (l), confirming that NSOEs pay fewer taxes when they have higher leverage. However, they present higher ETRs according to corporate income tax expense. As stated above, this might derive from interest on the debt that cannot be deducted in the present fiscal year and can only be deducted in subsequent years. On the other hand, there was a change in sign for SOEs in the CASHETR estimations, indicating that they pay more taxes when they have greater leverage.
Concerning capital intensity, the results of the estimates according to model (1) were non-determinant, a situation that was maintained for NSOEs according to model (2). Nevertheless, there were conclusive results for SOEs, with a negative and significant relationship between capital intensity and ETR, because in five estimations, the GOVOWNxCAPINT variable showed a negative and significant sign.
The coefficients of the RD variable were negative and significant in all the estimations for the model (2), corroborating the results obtained with model (1). Nevertheless, for the variable GOVOWNxRD there was a change in sign. Therefore, we can confirm that the companies that invest most in RD have a lower tax burden, but only when they are privately owned. However, the results for SOEs were not conclusive, because the GOVOWNxRD variable was significant in two of the six estimations, though with a positive sign.
Regarding inventories, they have no impact on CIT payment in any type of company, because none of the estimates turned out to be significant. However, the estimations for GAAPETR were aligned with those performed with model (l), confirming an inverse relationship between inventory intensity and ETR based on income tax expense for both state-owned and privately owned companies.
For the ROA variable the same results were obtained as with model (l), that is, more profitable NSOEs bear a greater tax burden, even though the relationship was again the opposite in estimation (I). On the other hand, the interaction variable of GOVOWNxROA was only significant for companies having a positive result in estimations (I) and (IV), meaning that ROA is directly related to tax burden for more profitable SOEs.
In terms of firm age, the estimations of model (2) confirmed the results reached with model (1), although only for NSOEs. Consequently, it is verified that older private ownership companies pay more taxes; however, when GAAPETR is considered, the relationship is the opposite, indicating that companies with more experience manage to lower their tax burden owing to deferred tax. However, in the case of state-owned companies, age does not prove to be an explanatory variable of the tax burden.
Foreign operations do not affect the ETR of state-owned companies, given that the GOVOWNxFOREIGN variable was not significant in any of the estimations. On the other hand, for private ownership companies, the results obtained from model (1) were confirmed. Thus, NSOEs that carry out foreign operations have a lighter tax burden based on CIT expense.
Concerning the SME variable, the results of the previous section for both groups of firms were supported, confirming that SMEs bear lower ETRs. However, for state-owned companies the influence of this variable was less evident because the coefficients were negative and significant in four of the estimations.
For the AUDIT variable, the estimations of model (2) also supported the results obtained from model (1) indicating that NSOEs bear a greater tax burden when they are subject to auditing. However, the results for SOEs were not conclusive because the GOVOWNxAUDIT variable was significant in two of the six estimations, though with a negative sign.
Finally, Figure 1; Figure 2 summarize the determinants of the ETRs in both NSOEs and SOEs.

4. Conclusions

The objective of this paper was to provide evidence regarding how the ownership structure of Spanish companies, whether state-owned or privately owned, influences the determinants of the effective tax rate (ETR). To this end, a sample of 2961 NSOEs and 298 SOEs was used for the period of 2008–2014. To make the estimations, data panel methodology with random effects was applied, controlling for autocorrelation and heteroscedasticity.
The results show differences between the tax burdens of privately owned and state-owned companies because, according to the tax burden measures used, the ETR is higher in NSOEs. In fact, as shown in the means test, there were significant differences at the 1% level for the six tax burden measures used. Furthermore, if the ETRs and the current statutory tax rate throughout the period (30%) are compared, the ETR is always found to be lower, irrespective of the definition used and the type of ownership.
Similarly, it should be emphasized that the company features of both groups are significantly different. In particular, SOEs are larger, less leveraged, more intensive in terms of capital and inventory though not in RD, less profitable, and older, and they perform fewer foreign operations, most are SMEs, and a larger percentage of them are audited.
In terms of ETR determinants, it is evident that private ownership companies manage to reduce their tax burden when they are larger. Furthermore, they pay less CIT when they are more leveraged. In addition, they bear lower ETRs when they are more intensive in RD as a consequence of the tax incentives offered by Spanish law. Similarly, they bear a greater tax burden when they are more profitable.
It is confirmed that older NSOEs pay more taxes but bear lower ETRs based on corporate income tax expense. This might be the result of accumulated experience, which enables them to adopt a better tax strategy by taking advantage of deferred taxation. Similarly, foreign operations reduce a company’s tax burden based on income tax expense. It was also confirmed that audited NSOEs bear a higher tax burden.
Concerning state-owned companies, few variables were identified as determinants of ETRs. Specifically, such companies pay more taxes when they are more leveraged and bear a lower ETR when they are more capital-intensive.
Finally, the only variable that is the same for both groups is the one related to SMEs. Firms included in the special tax regime for SMEs manage to reduce their ETRs, regardless of their ownership structure.
Therefore, company characteristics are more important in private ownership firms, in which almost all the variables considered have repercussions. However, in SOEs, only leverage, capital intensity, and inclusion in the SME regime affect their tax burden. This result may be because private ownership companies devote more resources to tax avoidance and their fiscal strategy may determine their economic and financial structure. However, state-owned companies have significantly lower ETRs than private ownership firms, probably because of the tax incentives offered by Spanish regulations to them.
In conclusion, this research shows that the determinants of the ETRs of Spanish companies differ depending on their ownership structure. These results differ from those obtained for companies in China, where research shows that there are hardly any differences between the determinants of the tax burden in terms of ownership structure. The different results may be due to the distinctive characteristics of the two countries.

Author Contributions

Conceptualization, methodology, and formal analysis, E.F.-R. and A.M.-A.; data curation, E.F.-R. and R.G-.F.; review and editing of manuscript, E.F.-R., R.G.-F., and A.M.-A.

Funding

This research received no external funding.

Conflicts of Interest

The authors declare no conflict of interest.

Appendix A

Table A1. Variable Definitions.
Dependent Variables
GAAPETR1Total tax expense divided by pretax income. Firms are required to have both a positive denominator and numerator. The variable is winsorized at 0 and 1.
GAAPETR2Total tax expense divided by pretax income. The variable is winsorized at 1% and 99% of the distribution.
GAAPETR3The three-year sum (from year t − 2 to year t) of total tax expense divided by the three-year sum of pretax income. The variable is winsorized at 1% and 99% of the distribution.
Based on the measure developed by Dyreng et al. [52].
CASHETR1Total cash taxes paid divided by pretax income. Firms are required to have both a positive denominator and numerator. The variable is winsorized at 0 and 1.
CASHETR2Total cash taxes paid divided by pretax income. The variable is winsorized at 1% and 99% of the distribution.
CASHETR3The three-year sum (from year t − 2 to year t) of total cash taxes paid divided by the three-year sum of pretax income. The variable is winsorized at 1% and 99% of the distribution.
Based on the measure developed by Dyreng et al. [52].
Variable of Interest
GOVOWNA dummy that equals 1 if the majority of the firm is owned by the government (more than 50%), and 0 otherwise.
Control Variables
SIZENatural logarithm of total assets.
LEVTotal leverage scaled by total assets.
CAPINTThe book value of the property, plant, and equipment scaled by total assets.
RDResearch and development investment scaled by total assets.
INVINTTotal inventories scaled by total assets.
ROAPretax income scaled by total assets.
FIRMAGENatural logarithm of the firm’s age since the date of it was established to the closing date of each financial year, rounded up.
FOREIGNA dummy that equals 1 if the firm undertakes foreign operations and 0 otherwise.
SMEEquals 1 if the firm is a small- or medium-sized enterprise (SME) and 0 otherwise.
SMEs between 2008 and 2010: Sales <8,000,000 euros.
SMEs since 2011: Sales <10,000,000 euros.
AUDITA dummy that equals 1 if the firm is audited and 0 otherwise.
SECTORA dummy variable for each SIC sector.
YEARA dummy variable for each year (2008–2014).
All continuous control variables are winsorized at 1% and 99% of the distribution.

References

  1. Shackelford, D.A.; Shevlin, T. Empirical tax research in accounting. J. Account. Econ. 2001, 31, 321–387. [Google Scholar] [CrossRef] [Green Version]
  2. Hanlon, M.; Heitzman, S. A review of tax research. J. Account. Econ. 2010, 50, 127–178. [Google Scholar] [CrossRef] [Green Version]
  3. Graham, J.R.; Raedy, J.S.; Shackelford, D.A. Research in accounting for income taxes. J. Account. Econ. 2012, 53, 412–434. [Google Scholar] [CrossRef]
  4. Stickney, C.P.; McGee, V.E. Effective corporate tax rates the effect of size, capital intensity, leverage, and other factors. J. Account. Public Policy 1982, 1, 125–152. [Google Scholar] [CrossRef]
  5. Zimmerman, J.L. Taxes and firm size. J. Account. Econ. 1983, 5, 119–149. [Google Scholar] [CrossRef]
  6. Gupta, S.; Newberry, K. Determinants of the variability in corporate effective tax rates: Evidence from longitudinal data. J. Account. Public Policy 1997, 16, 1–34. [Google Scholar] [CrossRef]
  7. Mills, L.; Erickson, M.M.; Maydew, E.L. Investments in tax planning. J. Am. Tax. Assoc. 1998, 20, 1–20. [Google Scholar]
  8. Manzon, G.B.; Plesko, G.A. The relation between financial and tax reporting measures of income. Tax Law Rev. 2002, 55, 175–214. [Google Scholar]
  9. Rego, S.O. Tax-Avoidance Activities of U.S. Multinational Corporations. Contemp. Account. Res. 2003, 20, 805–833. [Google Scholar] [CrossRef] [Green Version]
  10. Wilde, J.H.; Wilson, R.J. Perspectives on Corporate Tax Planning: Observations from the Past Decade. J. Am. Tax. Assoc. 2018, 40, 63–81. [Google Scholar] [CrossRef]
  11. Phillips, J.D. Corporate tax-planning effectiveness: The role of compensation-based incentives. Account. Rev. 2003, 78, 847–874. [Google Scholar] [CrossRef]
  12. Armstrong, C.S.; Blouin, J.L.; Larcker, D.F. The incentives for tax planning. J. Account. Econ. 2012, 53, 391–411. [Google Scholar] [CrossRef]
  13. Rego, S.O.; Wilson, R. Equity Risk Incentives and Corporate Tax Aggressiveness. J. Account. Res. 2012, 50, 775–810. [Google Scholar] [CrossRef]
  14. Gaertner, F.B. CEO After-Tax Compensation Incentives and Corporate Tax Avoidance. Contemp. Account. Res. 2014, 31, 1077–1102. [Google Scholar] [CrossRef] [Green Version]
  15. Powers, K.; Robinson, J.R.; Stomberg, B. How do CEO incentives affect corporate tax planning and financial reporting of income taxes? Rev. Account. Stud. 2016, 21, 672–710. [Google Scholar] [CrossRef]
  16. Chi, S.; Huang, S.X.; Sanchez, J.M. CEO Inside Debt Incentives and Corporate Tax Sheltering. J. Account. Res. 2017, 55, 837–876. [Google Scholar] [CrossRef] [Green Version]
  17. Desai, M.A.; Dharmapala, D. Corporate tax avoidance and high-powered incentives. J. Financ. Econ. 2006, 79, 145–179. [Google Scholar] [CrossRef] [Green Version]
  18. Minnick, K.; Noga, T. Do corporate governance characteristics influence tax management? J. Corp. Financ. 2010, 16, 703–718. [Google Scholar] [CrossRef]
  19. Armstrong, C.S.; Blouin, J.L.; Jagolinzer, A.D.; Larcker, D.F. Corporate governance, incentives, and tax avoidance. J. Account. Econ. 2015, 60, 1–17. [Google Scholar] [CrossRef] [Green Version]
  20. Richardson, G.; Taylor, G.; Lanis, R. The impact of board of director oversight characteristics on corporate tax aggressiveness: An empirical analysis. J. Account. Public Policy 2013, 32, 68–88. [Google Scholar] [CrossRef]
  21. Monterrey-Mayoral, J.; Sánchez-Segura, A. Planificación fiscal y gobierno corporativo en las empresas cotizadas españolas. Hacienda Publica Espanola 2015, 214, 55–89. [Google Scholar] [CrossRef]
  22. Bird, A.; Karolyi, S.A. Governance and taxes: Evidence from regression discontinuity. Account. Rev. 2017, 92, 29–50. [Google Scholar] [CrossRef]
  23. Kim, J.; Im, C. Study on Corporate Social Responsibility (CSR): Focus on Tax Avoidance and Financial Ratio Analysis. Sustainability 2017, 9, 1710. [Google Scholar] [CrossRef]
  24. Young, A. How does governance affect tax avoidance? Evidence from shareholder proposals. Appl. Econ. Lett. 2017, 24, 1208–1213. [Google Scholar] [CrossRef]
  25. Gulzar, M.A.; Cherian, J.; Sial, M.; Badulescu, A.; Thu, P.; Badulescu, D.; Khuong, N. Does Corporate Social Responsibility Influence Corporate Tax Avoidance of Chinese Listed Companies? Sustainability 2018, 10, 4549. [Google Scholar] [CrossRef]
  26. Chen, S.; Chen, X.; Cheng, Q.; Shevlin, T. Are family firms more tax aggressive than non-family firms? J. Financ. Econ. 2010, 95, 41–61. [Google Scholar] [CrossRef] [Green Version]
  27. Monterrey-Mayoral, J.; Sánchez-Segura, A. Diferencias en agresividad fiscal entre empresas familiares y no familiares. Span. J. Financ. Account. 2010, 39, 65–97. [Google Scholar]
  28. Zeng, T. Institutional environment, inside ownership and effective tax rate. Nankai Bus. Rev. Int. 2011, 2, 348–357. [Google Scholar] [CrossRef]
  29. Wu, L.; Wang, Y.; Luo, W.; Gillis, P. State ownership, tax status and size effect of effective tax rate in China. Account. Bus. Res. 2012, 42, 97–114. [Google Scholar] [CrossRef] [Green Version]
  30. Badertscher, B.A.; Katz, S.P.; Rego, S.O. The separation of ownership and control and corporate tax avoidance. J. Account. Econ. 2013, 56, 228–250. [Google Scholar] [CrossRef]
  31. McGuire, S.T.; Wang, D.; Wilson, R.J. Dual class ownership and tax avoidance. Account. Rev. 2014, 89, 1487–1516. [Google Scholar] [CrossRef]
  32. Chan, K.H.; Mo, P.L.L.; Zhou, A.Y. Government ownership, corporate governance and tax aggressiveness: Evidence from China. Account. Financ. 2013, 53, 1029–1051. [Google Scholar] [CrossRef]
  33. Wu, W.; Rui, O.M.; Wu, C. Institutional environment, ownership and firm taxation. Econ. Transit. 2013, 21, 17–51. [Google Scholar] [CrossRef]
  34. Derashid, C.; Zhang, H. Effective tax rates and the “industrial policy” hypothesis: Evidence from Malaysia. J. Int. Account. Audit. Tax. 2003, 12, 45–62. [Google Scholar] [CrossRef]
  35. Adhikari, A.; Derashid, C.; Zhang, H. Public policy, political connections, and effective tax rates: Longitudinal evidence from Malaysia. J. Account. Public Policy 2006, 25, 574–595. [Google Scholar] [CrossRef]
  36. Mahenthiran, S.; Kasipillai, J. Influence of ownership structure and corporate governance on effective tax rates and tax planning: Malaysian evidence. Aust. Tax Forum 2012, 27, 941–969. [Google Scholar] [CrossRef]
  37. Khan, M.; Srinivasan, S.; Tan, L. Institutional ownership and corporate tax avoidance: New evidence. Account. Rev. 2017, 92, 101–122. [Google Scholar] [CrossRef]
  38. Tang, T.; Mo, P.L.L.; Chan, K.H. Tax collector or tax avoider? An investigation of intergovernmental agency conflicts. Account. Rev. 2017, 92, 247–270. [Google Scholar] [CrossRef]
  39. Fernández-Rodríguez, E. The determining factors of the Spanish business tax burden through the accounting information. The case of financing decissions. Span. J. Financ. Account. 2004, 33, 125–159. [Google Scholar]
  40. Park, S. Related Party Transactions and Tax Avoidance of Business Groups. Sustainability 2018, 10, 3571. [Google Scholar] [CrossRef]
  41. Fonseca-Díaz, A.R.; Fernández-Rodríguez, E.; Martínez-Arias, A. Factores empresariales e institucionales condicionantes de la presión fiscal a nivel internacional. Span. J. Financ. Account. 2018. [Google Scholar] [CrossRef]
  42. Delgado, F.J.; Fernandez-Rodriguez, E.; Martinez-Arias, A. Effective tax rates in corporate taxation: A quantile regression for the EU. Eng. Econ. 2014, 25, 487–496. [Google Scholar] [CrossRef]
  43. Frank, M.M.; Lynch, L.J.; Rego, S.O. Tax Reporting Aggressiveness and Its Relation to Aggressive Financial Reporting. Account. Rev. 2009, 84, 467–496. [Google Scholar] [CrossRef]
  44. Wilson, R.J. An Examination of Corporate Tax Shelter Participants. Account. Rev. 2009, 84, 969–999. [Google Scholar] [CrossRef]
  45. Hope, O.-K.; Ma, M.; Thomas, W.B. Tax avoidance and geographic earnings disclosure. J. Account. Econ. 2013, 56, 170–189. [Google Scholar] [CrossRef]
  46. Dyreng, S.D.; Hanlon, M.; Maydew, E.L.; Thornock, J.R. Changes in corporate effective tax rates over the past 25 years. J. Financ. Econ. 2017, 124, 441–463. [Google Scholar] [CrossRef]
  47. Lisowsky, P. Seeking Shelter: Empirically modeling tax shelters using financial statement information. Account. Rev. 2010, 85, 1693–1720. [Google Scholar] [CrossRef]
  48. Arellano, M.; Bond, S. Some tests of specification for panel data: Monte Carlo evidence and an application to employment equations. Rev. Econ. Stud. 1991, 58, 277–297. [Google Scholar] [CrossRef]
  49. Hsiao, C. Panel Data Analysis-Advantages and Challenges 2013; Wang Yanan Institute for Studies in Economics (WISE), Xiamen University: Xiamen, China, 2013. [Google Scholar]
  50. Baltagi, B.H. Econometric Analysis of Panel Data, 4th ed.; John Wiley & Sons: Chichester, UK; Hoboken, NJ, USA, 2008; ISBN 978-0-470-51886-1. [Google Scholar]
  51. Martínez Vargas, J. From accrued to paid income tax: A review of effective tax rate calculation. Span. Account. Rev. 2015, 18, 68–77. [Google Scholar]
  52. Dyreng, S.D.; Hanlon, M.; Maydew, E.L. Long-run corporate tax avoidance. Account. Rev. 2008, 83, 61–82. [Google Scholar] [CrossRef]
  53. Wang, K.; Zhang, H.; Tsai, S.-B.; Jiang, J.; Sun, Y.; Wang, J. An Empirical Study on Effective Tax Rate and CEO Promotion: Evidence from Local SOEs in China. Sustainability 2018, 10, 2007. [Google Scholar] [CrossRef]
Figure 1. Determinants of effective tax rates (ETRs) in NSOEs.
Sustainability 11 01441 g001
Figure 2. Determinants of ETRs in SOEs.
Sustainability 11 01441 g002
Table 1. Sample selection procedure. SOEs: state-owned enterprises; NSOEs: non-state-owned enterprises.
Non-Financial Companies with Data Available for 2008–20146772
minus “Mining”, because SOEs represent 1.96%(51)
minus “Manufacturing”, because SOEs account for 0.26%(1904)
minus “Wholesale trade”, because SOEs account for 0.24%(1235)
minus “Retail trade”, because there are no SOEs in this sector(381)
minus entities with particular characteristics or subject to special regulations(32)
Total companies3169
Majority stake in capital held by the state—SOEs208
Majority stake in capital held by private investors—NSOEs 2961
Table 2. Descriptive statistics, means test, and correlation matrix.
Panel A. Descriptive Statistics and Means Test
SampleSOEsNSOEsMeans Test
P 25P 50 (Median)P 75MeanMinimumMaximumMeanMeanDifferenceT Value
GAAPETR10.21570.29510.30070.25850.00001.00000.14480.2648−0.1200−15.823 ***
GAAPETR20.08280.28310.30010.2040−2.41481.66670.07570.2130−0.1373−17.519 ***
GAAPETR30.09350.27540.30020.2016−2.11511.59630.06840.2108−0.1424−17.930 ***
CASHETR10.00000.10840.29680.16500.00001.00000.10240.1683−0.0659−9.575 ***
CASHETR20.00000.00000.25110.1193−1.56632.74710.05680.1236−0.0667−8.911 ***
CASHETR30.00000.04170.24750.1185−1.32681.88310.05420.1229−0.0688−9.004 ***
SIZE15.947516.871818.048817.080513.586021.834417.339117.06200.27716.643 ***
LEV0.43500.66140.83870.63250.03451.52110.57330.6367−0.0634−8.643 ***
CAPINT0.01630.11680.44300.25440.00000.95140.33470.24880.085910.394 ***
RD0.00000.00000.00000.00070.00000.07270.00040.0007−0.0003−3.540 ***
INVINT0.00000.00170.01850.04240.00000.79940.08330.03950.04389.622 ***
ROA−0.00370.02600.08490.0403−0.50530.5152−0.00520.0434−0.0486−19.979 ***
FIRMAGE2.33232.87333.29972.7853−5.89994.85472.94682.77390.17299.151 ***
FOREIGN0.00000.00000.00000.24900.00001.00000.06250.2621−0.1996−28.337 ***
SME0.00000.00001.00000.33740.00001.00000.47070.32800.142710.376 ***
AUDIT1.00001.00001.00000.88160.00001.00000.91140.87950.03194.100 ***
Panel B. Correlation matrix
GAAPETR1CASHETR1GAAPETR2CASHETR2GAAPETR3CASHETR3GOVOWNSIZELEVCAPINTRDINVINTROAFIRMAGEFOREIGNSMEAUDIT
GAAPETR11
CASHETR10.247 ***1
GAAPETR21.000 ***0.195 ***1
CASHETR20.198 ***1.000 ***0.168 ***1
GAAPETR30.411 ***0.188 ***0.352 ***0.121 ***1
CASHETR30.179 ***0.532 ***0.145 ***0.347 ***0.252 ***1
GOVOWN−0.200 ***−0.076 ***−0.119 ***−0.056 ***−0.131 ***−0.070 ***1
SIZE−0.037 ***0.022 **−0.038 ***−0.022 ***−0.045 ***−0.027 ***0.045 ***1
LEV0.123 ***−0.044 ***0.025 ***−0.046 ***0.036 ***−0.067 ***−0.059 ***0.118 ***1
CAPINT−0.024 ***0.025 ***−0.005−0.023 ***−0.014−0.035 ***0.074 ***0.071 ***−0.017 **1
RD−0.026 ***−0.020 **−0.025 ***−0.019 ***−0.020 **−0.012−0.018 ***0.0060.019 ***−0.055 ***1
INVINT−0.036 ***−0.036 ***−0.032 ***−0.023 ***−0.034 ***−0.034 ***0.093 ***0.075 ***0.041 ***−0.149 ***0.032 ***1
ROA−0.0100.062 ***0.091 ***0.134 ***0.091 ***0.143 ***−0.106 ***−0.089 ***−0.279 ***−0.104 ***−0.025 ***−0.097 ***1
FIRMAGE−0.027 ***0.088 ***−0.023 ***0.047 ***−0.024 ***0.049 ***0.054 ***0.046 ***−0.196 ***−0.073 ***0.014 **0.068 ***0.040 ***1
FOREIGN0.0040.0110.0000.0100.0070.028 ***−0.114 ***0.115 ***0.028 ***−0.177 ***0.129 ***0.041 ***0.026 ***0.080 ***1
SME−0.073 ***−0.115 ***−0.049 ***−0.074 ***−0.065 ***−0.080 ***0.075 ***−0.405 ***−0.121 ***0.108 ***−0.040 ***−0.006−0.129 ***−0.106 ***−0.170 ***1
AUDIT0.054 ***0.175 ***0.020 ***0.087 ***0.0070.074 ***0.024 ***0.140 ***−0.026 ***−0.036 ***0.036 ***0.0090.032 ***0.263 ***0.061 ***−0.226 ***1
Panel A shows the statistical descriptions of the dependent and explanatory variables. The dependent variables measure the corporate tax burden through six variables: GAAPETR1 (Total tax expense divided by pretax income. Firms are required to have both a positive denominator and numerator), GAAPETR2 (Total tax expense divided by pretax income), GAAPETR3 (The three-year sum, from year t − 2 to year t, of total tax expense divided by the three-year sum of pretax income), CASHETR1 (Total cash taxes paid divided by pretax income. Firms are required to have both a positive denominator and numerator), CASHETR2 (Total cash taxes paid divided by pretax income) and CASHETR3 (The three-year sum, from year t − 2 to year t, of total cash taxes paid divided by the three-year sum of pretax income). Regarding the explanatory variables, GOVOWN is the variable of interest. It is a dummy indicating the ownership structure of the company and it is equals 1 if the majority of the firm is owned by the government (more than 50%), and 0 otherwise. Regarding the control variables, SIZE is the size of the entity, measured as the natural logarithm of total assets; LEV is leverage, calculated as the ratio of total debt to total assets; CAPINT is capital intensity, calculated as the ratio of property, plant, and equipment to total assets; RD is research and development intensity, calculated by dividing research and development investment by total assets; INVINT is inventory intensity, calculated as the ratio of inventories to total assets; ROA is the return on assets, measured as the ratio of pre-tax net income and total assets; FIRMAGE is the firm’s age, measured as the logarithm of the firm’s years of life; FOREIGN is a dummy variable representing foreign operations that equals 1 if the entity performs these operations, and 0 otherwise; SME is a dummy for a small and medium enterprise, which takes the value 1 if the company is subject to the special SME tax regime, and 0 otherwise; and AUDIT is a dummy variable for auditing, which equals 1 if the entity is audited, and 0 otherwise. The differences in means between state-owned and privately owned companies regarding such variables and their level of significance according to Student’s t test of mean difference for independent samples are also given. The Pearson correlation matrix is shown in Panel B. ***, **, and * represent significant values at the 1%, 5%, and 10% levels, respectively.
Table 3. Determinants of effective tax rates.
(I)(II)(III)(IV)(V)(VI)
GAAPETR1GAAPETR2GAAPETR3CASHETR1CASHETR2CASHETR3
GOVOWN−0.1108 ***
(−21.25)
−0.1110 ***
(−12.97)
−0.1152 ***
(−12.10)
−0.0604 ***
(−7.67)
−0.0490 ***
(−5.36)
−0.0495 ***
(−5.64)
SIZE−0.0073 ***
(−8.28)
−0.0120 ***
(−7.86)
−0.0149 ***
(−8.78)
−0.0056 ***
(−4.32)
−0.0092 ***
(−5.64)
−0.0087 ***
(−5.60)
LEV0.0562 ***
(11.52)
0.0444 ***
(5.28)
0.0513 ***
(5.57)
−0.0292 ***
(−4.07)
−0.0160 *
(−1.80)
−0.0373 ***
(−4.44)
CAPINT−0.0041
(−0.93)
0.0171 **
(2.23)
0.0054
(0.63)
0.0209 ***
(3.17)
0.0026
(0.31)
−0.0092
(−1.18)
RD−0.9208 ***
(−4.04)
−1.4060 ***
(−3.67)
−1.0803 ***
(−2.59)
−0.8039 ***
(−2.59)
−1.0714 ***
(−2.71)
−0.7785 **
(−2.07)
INVINT−0.0441 ***
(−3.76)
−0.0516 ***
(−2.71)
−0.0591 ***
(−2.72)
−0.0345 **
(−1.99)
−0.0383 *
(−1.88)
−0.0388 **
(−1.95)
ROA−0.0453 ***
(−3.44)
0.1975 ***
(10.21)
0.1814 ***
(8.37)
0.0782 ***
(4.01)
0.2926 ***
(14.25)
0.2296 ***
(11.62)
FIRMAGE−0.0045 ***
(−2.78)
−0.0072 ***
(−2.47)
−0.0059 *
(−1.72)
0.0112 ***
(4.70)
0.0069 **
(2.26)
0.0089 ***
(2.85)
FOREIGN−0.0066 ***
(−2.48)
−0.0081 *
(−1.66)
−0.0080
(−1.48)
−0.0015
(−0.39)
−0.0052
(−1.02)
0.0085 *
(1.71)
SME−0.0207 ***
(−7.19)
−0.0302 ***
(−5.98)
−0.0430 ***
(−7.79)
−0.0381 ***
(−8.97)
−0.0357 ***
(−6.67)
−0.0359 ***
(−7.12)
AUDIT0.0227 ***
(5.65)
0.0224 ***
(3.13)
0.0049
(0.56)
0.0923 ***
(15.86)
0.0681 ***
(9.02)
0.0510 ***
(6.44)
SectorYesYesYesYesYesYes
YearYesYesYesYesYesYes
Wald Test987.28 ***561.60 ***522.90 ***667.45 ***582.22 ***523.57 ***
Observations13,23119,27014,12812,80419,25214,119
The regressions use a panel data model, through random effects, controlling for both heteroscedasticity and autocorrelation. The definitions of the variables can be found in Appendix A. The regressions are estimated with annual data for the period of 2008–2014. Dummy variables are included for every year and sector in all estimations, though their coefficients are not shown for reasons of space. The T statistics are shown in parentheses and represent values that are significant at the 1%, 5%, and 10% levels, respectively.
Table 4. Effect of ownership structure on the determinants of effective tax rates.
Panel A. Results of Estimations
(I)(II)(III)(IV)(V)(VI)
GAAPETR1GAAPETR2GAAPETR3CASHETR1CASHETR2CASHETR3
GOVOWN−0.1751 *
(−1.92)
−0.0178
(−0.13)
−0.0398
(−0.25)
−0.1470
(−1.07)
−0.1474
(−0.99)
0.1347
(0.93)
SIZE−0.0073 ***
(−8.16)
−0.0121 ***
(−7.68)
−0.0151 ***
(−8.56)
−0.0056 ***
(−4.25)
−0.0094 ***
(−5.61)
−0.0079 ***
(−4.93)
GOVOWxSIZE0.0114 ***
(2.64)
0.0032
(0.49)
0.0036
(0.52)
0.0124 *
(1.91)
0.0092
(1.35)
−0.0061
(−0.94)
LEV0.0520 ***
(10.44)
0.0407 ***
(4.67)
0.0499 ***
(5.24)
−0.0369 ***
(−5.02)
−0.0238 ***
(−2.57)
−0.0426 ***
(−4.91)
GOVOWNxLEV0.0389 *
(1.76)
0.0241
(0.71)
−0.0085
(−0.22)
0.1565 ***
(4.68)
0.0944 ***
(2.60)
0.0721 **
(2.04)
CAPINT−0.0010
(−0.22)
0.0217 ***
(2.73)
0.0078
(0.88)
0.0249 ***
(3.71)
0.0086
(1.02)
−0.0079
(−0.99)
GOVOWNxCAPINT−0.1092 ***
(−4.85)
−0.0995 ***
(−3.02)
−0.0732 **
(−2.01)
−0.0645 *
(−1.86)
−0.0782 **
(−2.23)
−0.0043
(−0.13)
RD−1.0415 ***
(−4.55)
−1.6073 ***
(−4.12)
−1.1319 ***
(−2.68)
−0.8789 ***
(−2.80)
−1.0940 ***
(−2.72)
−0.7618 **
(−2.01)
GOVOWNxRD4.0810 ***
(3.00)
5.2810 ***
(2.55)
1.9834
(0.75)
2.5752
(1.31)
1.6380
(0.75)
0.6001
(0.25)
INVINT−0.0209 *
(−1.68)
−0.0299
(−1.46)
−0.0395 *
(−1.69)
−0.0142
(−0.75)
−0.0330
(−1.51)
−0.0246
(−1.15)
GOVOWNxINVINT−0.1451 ***
(−3.68)
−0.1189 *
(−1.89)
−0.0601
(−0.84)
−0.0905
(−1.59)
0.0546
(0.82)
0.0015
(0.02)
ROA−0.0431 ***
(−3.27)
0.1950 ***
(9.86)
0.1800 ***
(8.13)
0.0716 ***
(3.65)
0.2930 ***
(13.96)
0.2309 ***
(11.43)
GOVOWNxROA0.2143 **
(2.00)
0.1423
(1.44)
0.1715
(1.57)
0.3189 **
(2.01)
−0.0077
(−0.07)
−0.0021
(−0.02)
FIRMAGE−0.0046 ***
(−2.79)
−0.0068 **
(−2.29)
−0.0056
(−1.58)
0.0121 ***
(5.02)
0.0064 **
(2.03)
0.0094 ***
(2.92)
GOVOWNxFIRMAGE0.0036
(0.41)
−0.0054
(−0.39)
−0.0080
(−0.48)
−0.0342 ***
(−2.62)
0.0056
(0.38)
−0.0125
(−0.81)
FOREIGN−0.0065 **
(−2.44)
−0.0086 *
(−1.75)
−0.0084
(−1.54)
−0.0014
(−0.35)
−0.0045
(−0.86)
0.0094 *
(1.87)
GOVOWNxFOREIGN−0.0056
(−0.25)
0.0371
(1.06)
0.0206
(0.53)
0.0337
(0.96)
−0.0421
(−1.13)
−0.0295
(−0.81)
SME−0.0168 ***
(−5.69)
−0.0284 ***
(−5.42)
−0.0405 ***
(−7.06)
−0.0360 ***
(−8.22)
−0.0356 ***
(−6.39)
−0.0320 ***
(−6.11)
GOVOWNxSME−0.0634 ***
(−5.15)
−0.0381 *
(−1.90)
−0.0467 **
(−2.09)
−0.0297
(−1.58)
0.0067
(0.31)
−0.0522 ***
(−2.52)
AUDIT0.0259 ***
(6.20)
0.0223 ***
(3.03)
0.0044
(0.48)
0.0947 ***
(15.95)
0.0724 ***
(9.29)
0.0532 ***
(6.49)
GOVOWNxAUDIT−0.0372 *
(−1.83)
−0.0009
(0.03)
0.0068
(0.19)
−0.0458
(−1.56)
−0.0759 **
(−2.37)
−0.0231
(−0.72)
SectorYesYesYesYesYesYes
YearYesYesYesYesYesYes
Wald Test1241.37 ***624.31 ***570.54 ***750.68 ***623.23 ***556.58 ***
Observations13,23119,27014,12812,80419,25214,119
Panel B. Sum of Coefficients
Explanatory VariableCoefficientGAAPETR1GAAPETR2GAAPETR3CASHETR1CASHETR2CASHETR3
SIZEβ2 + β30.0041 ***−0.0089−0.01150.0068 *−0.0002−0.014
LEVβ4 + β50.0909 *0.06480.04140.1196 ***0.0706 ***0.1147 **
CAPINTβ6 + β7−0.1102 ***−0.0778 ***−0.0654 **−0.0396 *−0.0696 **−0.0122
RDβ8 + β93.0395 ***3.6737 ***0.85151.69630.544−0.1617
INVINTβ10 + β11−0.1660 ***−0.1488 *−0.0996−0.10470.0216−0.0231
ROAβ12 + β130.1712 **0.33730.35150.3905 **0.28530.2288
FIRMAGEβ14 + β15−0.001−0.0122−0.0136−0.0221 ***0.012−0.0031
FOREIGNβ16 + β17−0.01210.02850.01220.0323−0.0466−0.0201
SMEβ18 + β19−0.0802 ***−0.0665 *−0.0872 **−0.0657−0.0289−0.0842 ***
AUDITβ20 + β21−0.0116 *0.02320.01120.0489−0.0035 **0.0301
The regressions use a panel data model, through random effects, controlling for both heteroscedasticity and autocorrelation. The definitions of the variables can be found in Appendix A. The regressions are estimated with annual data for the period of 2008–2014. Dummy variables are included for every year and sector in all estimations, though their coefficients are not shown for reasons of space. The T statistics are shown in parentheses and represent values that are significant at the 1%, 5%, and 10% levels, respectively.

