Response of Nitrogen Losses to Excessive Nitrogen Fertilizer Application in Intensive Greenhouse Vegetable Production

1
State Key Laboratory of Urban and Regional Ecology, Research Center for Eco-Environmental Sciences, Chinese Academy of Sciences, Beijing 100085, China
2
University of Chinese Academy of Sciences, Beijing 100049, China
*
Author to whom correspondence should be addressed.
Sustainability 2019, 11(6), 1513; https://0-doi-org.brum.beds.ac.uk/10.3390/su11061513
Submission received: 19 February 2019
/
Revised: 5 March 2019
/
Accepted: 7 March 2019
/
Published: 13 March 2019
(This article belongs to the Section Sustainable Agriculture)
Abstract
:Excessive nitrogen fertilizer application in greenhouse vegetable production (GVP) is of scientific and public concern because of its significance to international environmental sustainability. We conducted a meta-analysis using 1174 paired observations from 69 publications on the effects of nitrogen fertilizer application and reducing nitrogen fertilizer application on the nitrogen losses on a broad scale. We found that the increase in nitrogen loss is much higher than that in production gain caused by excessive application of nitrogen fertilizer: nitrate leaching (+187.5%), ammonium leaching (+28.1%), total nitrogen leaching (+217.0%), nitrous oxide emission (+202.0%), ammonia emission (+176.4%), nitric oxide emission (+543.3%), yield (+35.7%) and nitrogen uptake (+24.5%). Environmental variables respond nonlinearly to nitrogen fertilizer application, with severe nitrate leaching and nitrous oxide emission when the application rate exceeds 570 kg N/ha and 733 kg/N, respectively. The effect of nitrogen fertilizer on yield growth decreases when the application rate exceeds 302 kg N/ha. Appropriate reduction in nitrogen fertilizer application rate substantially mitigates the environmental cost, for example, decreasing nitrate leaching (−32.4%), ammonium leaching (−6.5%), total nitrogen leaching (−37.3%), ammonia emission (−28.4%), nitrous oxide emission (−38.6%) and nitric oxide emission (−8.0%), while it has no significant effect on the nitrogen uptake and yield.
1. Introduction
China is the world’s largest vegetable producer (constituting ~50.5% of the world’s yield in 2016) [1,2] and greenhouse vegetable production (GVP) is a major vegetable cultivation system in China because of its higher economic benefits. However, vegetable production is an intensive cropping system with relatively low nutrient use efficiency [3,4]. Excessive nitrogen fertilizer application is especially common in GVP, which consumes about 40% of the total nitrogen input [5]. Due to its excessive nitrogen input, the nitrogen losses (e.g., nitrate leaching, greenhouse gas emission) are getting severe [6]. In GVP, the 0–4 m depth of soil, the total nitrogen accumulation reaches 1269 ± 114 kg N/ha for the top soil layer (depth: 0–4 m) [7]. In northern China, the nitrate concentration of groundwater nearby vegetable greenhouses is much higher than other places [5]. Nitrous oxide is an important part of greenhouse gas despite its small share [8]. The average nitrous oxide emission factor of vegetable system in China is 0.69%, which is higher than other crop systems. The nitrous oxide emission in GVP is about 1.4 times than in open-field vegetable production [9]. In order to reduce the environmental cost, it is necessary to have a growing knowledge base about the multiple aspects of the effect of excessive nitrogen input [10].
More recently, the main focus of nitrogen management in vegetable production has been shifted from growth to environmental sustainability [11]. There are various practices to optimize nitrogen input, such as optimizing the fertilizer application rate and frequency, using organic manure, slow-release fertilizers, inhibitors and fertigation [12]. Among them, clarifying the effect of nitrogen fertilizer application and determining the optimal application rate are the most fundamental step for pursuing sustainable agricultural development. A large number of field studies have been conducted to clarify the effect of nitrogen fertilizer application through control experiments [13,14,15,16,17,18]. Although these field trails are rudimentary, the local conditions vary a lot (i.e., management practices, spatiotemporal disparity of climate, different soil properties) and the sample size at each site is too small for further analyze. The heterogeneity and limited data bring uncertainty of the results and it is difficult to use these results directly in a larger scale. The research on the environmental and productivity effects of nitrogen application in a broad scale is still needed.
The relationship between nitrogen application rate and nitrogen losses has been reported in many early studies. Some studies suggested that there is a linear relationship between direct nitrous oxide emission and nitrogen input in different agricultural systems [19,20]. But more evidence showed that a nonlinear relationship exists between nitrogen losses and nitrogen input. Many previous studies have established that the environmental respond to one gradual change is not smooth. Kim et al. [21] found that, in most datasets, direct nitrous oxide emission has a non-linear dependency on the nitrogen input; and thus, proposed a conceptual model composed of three steps—linear, exponential and steady state—to describe the relationship. In the Chinese intensive agricultural systems, the relationship between nitrogen rate and nitrogen losses could be fitted using a logarithmic model for four different crops [22]. These non-linear relationships mean that a threshold of nitrogen input may occur beyond which there is an abrupt change of environmental variables. The threshold is crucial to support nitrogen management decision making. Nonetheless, few previous studies have established nitrogen input thresholds for GVP, in which the nitrogen application rate is far more than in crop production system.
Since 2015, China has developed a program to achieve “zero-growth for fertilizer” by 2020. Many field works have been conducted to explore the effect of reducing nitrogen application. They have dealt with the practices of local application by setting different proportions of the conventional application rate of the local farmers (which usually exceeds more than plants need) and comparing the effects of different nitrogen fertilizer application rates on the environment (e.g., leaching, gas emission) and productivity (e.g., plant uptake, yield). There is still a lack of research on the environmental and productivity effects of reducing nitrogen application in a broad scale. More evidence is needed to support that reducing nitrogen fertilizer application is a feasible solution in terms of both environment and food security.
Meta-analysis offers an efficient way to utilize the data of individual field studies and draw a conclusion applicable at broad scales [23,24]. This method has been applied to analyze the effects of nitrogen management practices, such as no-tillage, use of cover crops, use of inhibitors, water and nitrogen management and manure substitution [12,25,26,27,28,29]. Based on meta-analysis, the purpose of current study is to improve our understanding about the response of nitrogen losses to nitrogen input in Chinese GVP. More specifically, we want to explore: (1) What is the magnitude of nitrogen loss to environment caused by excessive nitrogen fertilizer application in GVP at broader spatial scale? (2) Is there a threshold of nitrogen fertilizer application beyond which there will be severe environmental impacts? (3) What is the magnitude of nitrogen losses decrease when reducing conventional nitrogen fertilizer application at broader spatial scale?
2. Materials and Methods
2.1. Database Collection
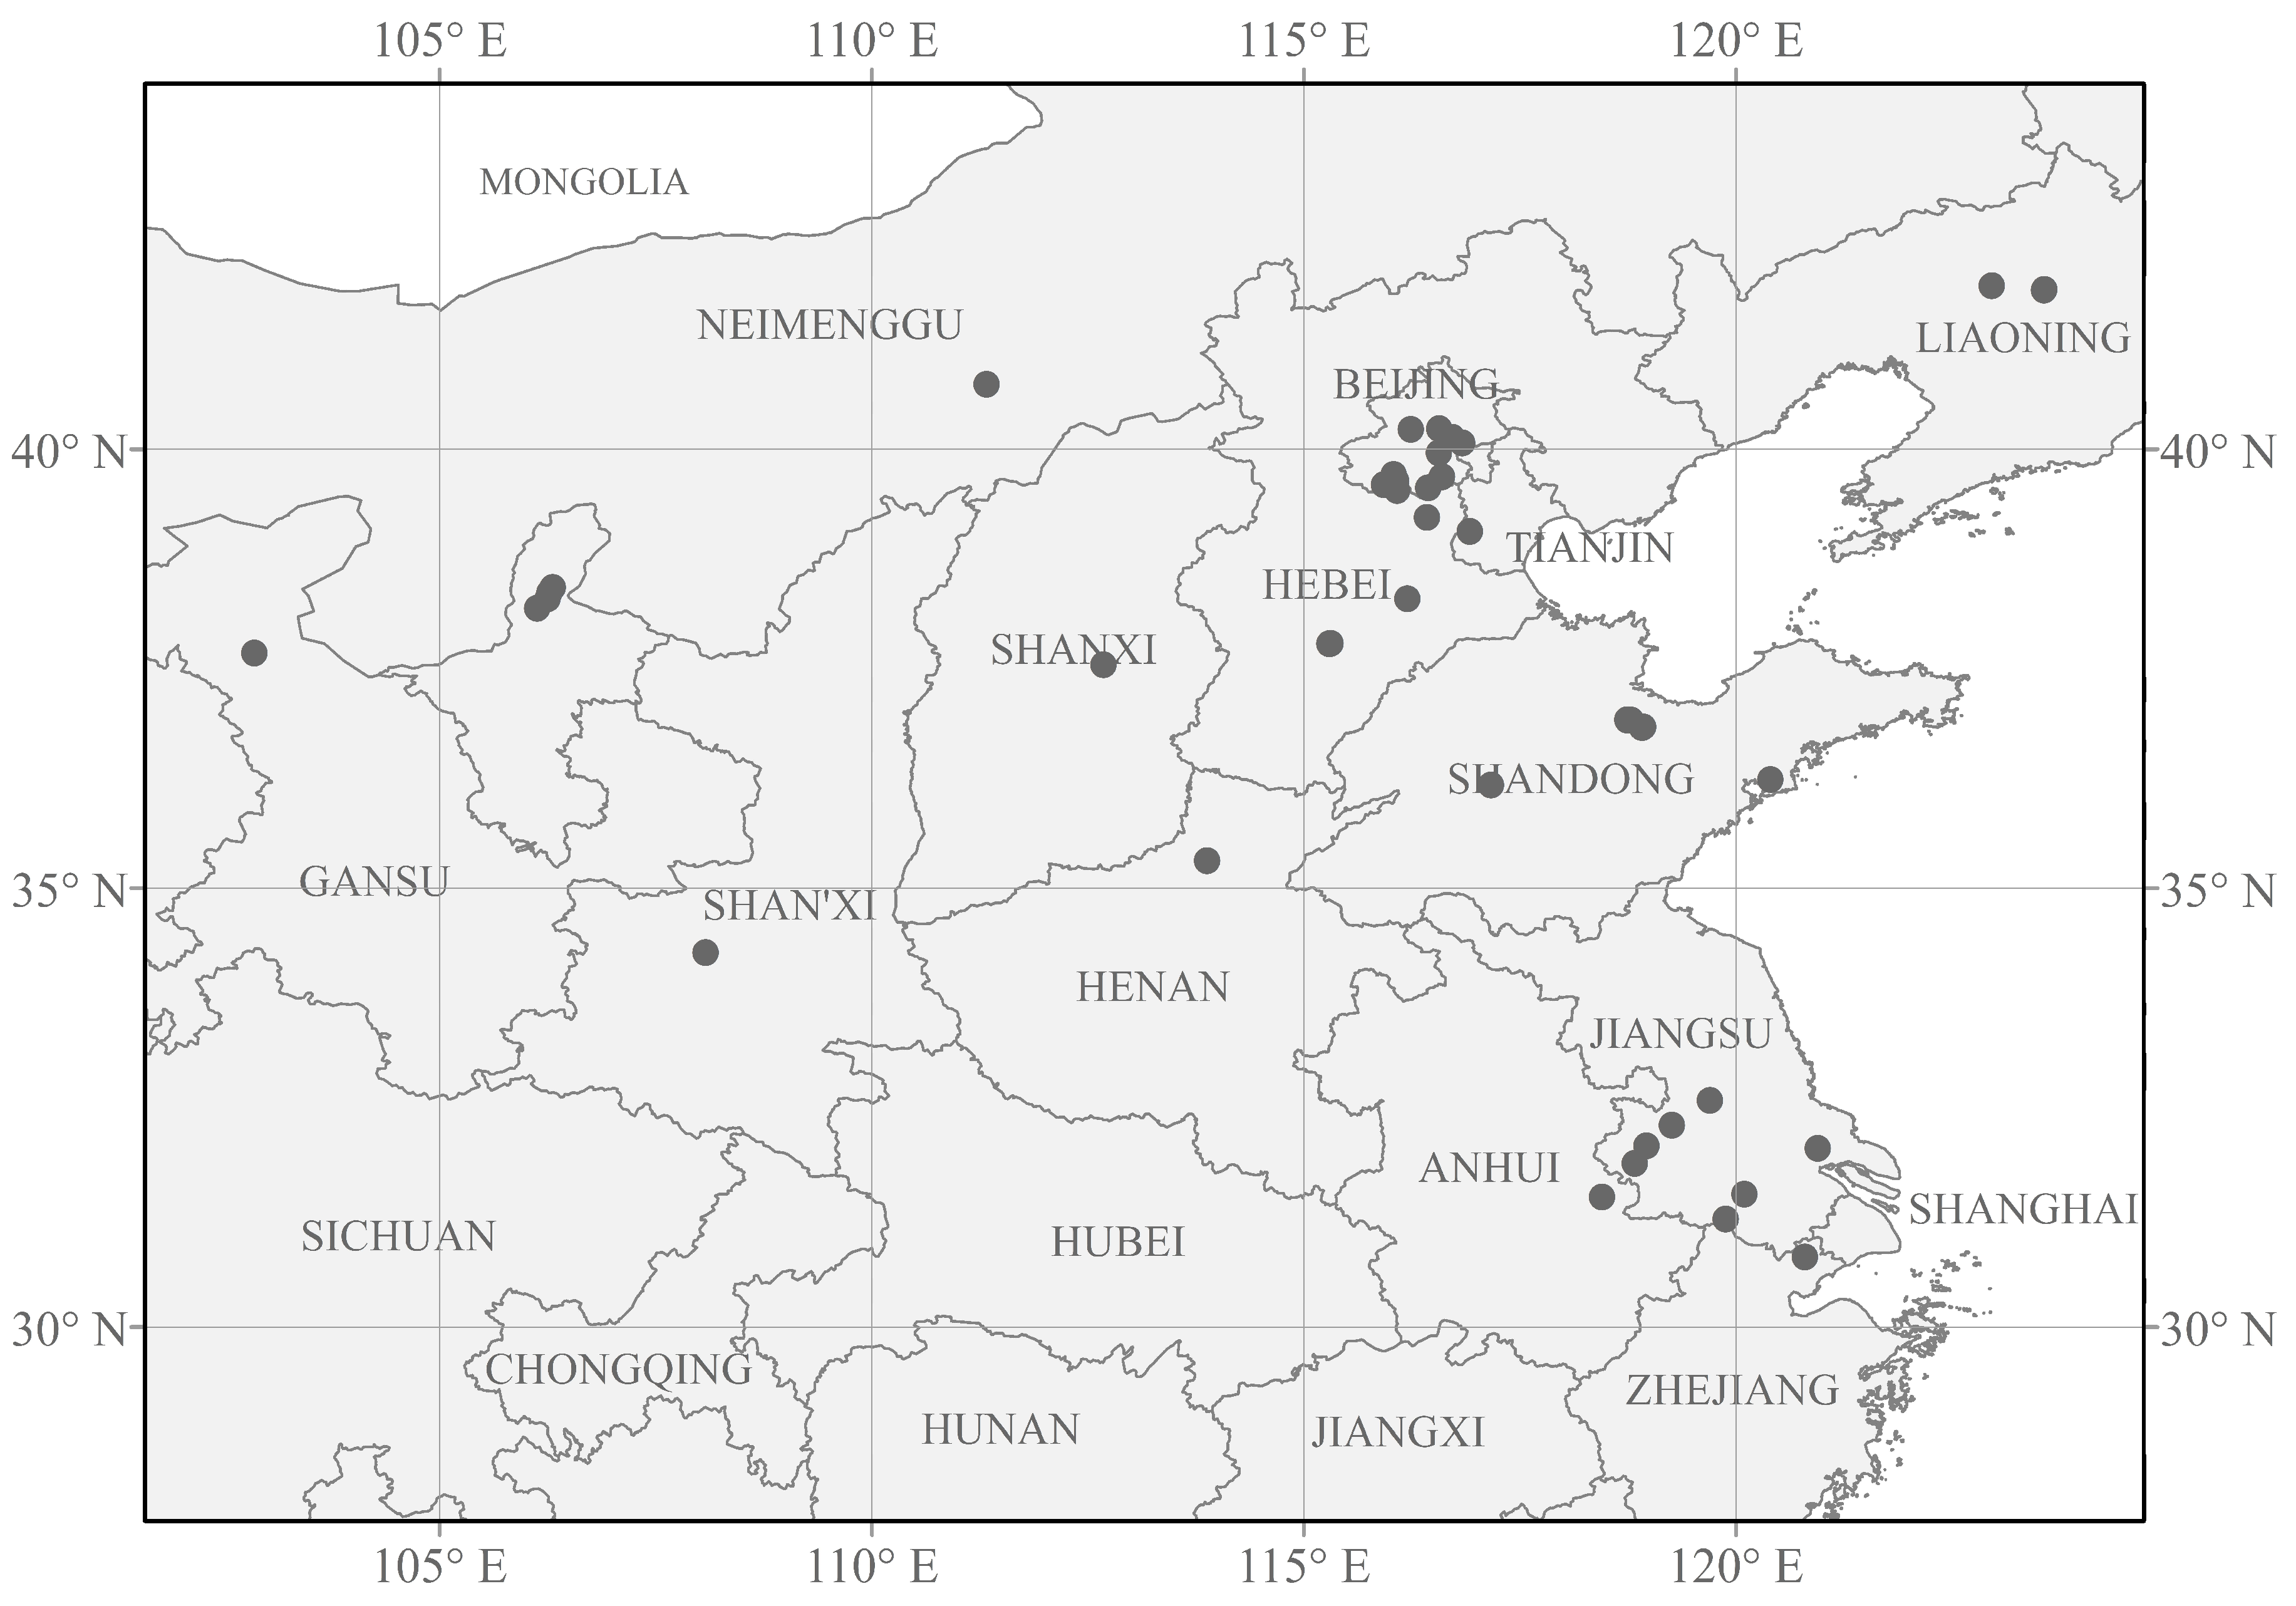
We retrieve relevant studies from the China National Knowledge Internet (http://www.cnki.com.cn) and Web of Science (www.webofknowledge.com). Each study compiled in our database should satisfy these selection criteria: (1) The study was conducted in China before December 31, 2017. (2) The experiment was conducted under the field conditions rather than the laboratory conditions. (3) In the experiment, the levels of inorganic nitrogen fertilizers might vary but all other treatments (e.g., phosphate fertilizer, potash fertilizer and organic manure application) should remain constant. (4) If the result of the same experiment was used in more than one articles, it was computed only once in this meta-analysis. (5) If the vegetables in a study were covered only by protective plastic mulch or film rather than the greenhouse, the study would be excluded. Following the selection criteria (above), we exclude some studies because their experimental designs did not conform to the above criteria. For example, in many studies, the control group did not apply the fertilizer containing other elements, resulting in inconsistencies in the contents of potassium and phosphate with the treatment group. Some of the fertilizers applied in the studies were combined fertilizers, which lowered the contents of other elements except nitrogen in the reduction process. From the screening process, we build a database consisting of 69 published references and 1174 paired observations (Figure 1 and Supplementary Materials). In each observation, the mean of measured data and sample size of treatment group and control group are collected from tables or figures. WebPlotDigitizer (https://automeris.io/WebPlotDigitizer/) is used to extract data from images [30].
Since the current study intends to explore the performance of different application rates of nitrogen fertilizer, we divide these experiment data into two separate groups. In the first group, the control treatment does not use nitrogen fertilizer (NN). The result calculated by this group is to quantify the effect of nitrogen fertilizer application. In the second group, the control treatment uses the conventional dosage of nitrogen fertilizer of the local farmers (CN), which was noted in the published research. This conventional application rate is always an excessive nitrogen rate. Based on these two data groups, the subsequent analysis is conducted.
2.2. Statistical Analysis
In the compiled research, the measured results have a practical physical scale. Hence, the response ratio (i.e., a ratio of the treatment group result to the control group result) can be used as the effect size to quantify the treatments impacts in ecology [31]. We calculate the response ratio as:
where is the mean of measured data, is the mean of treatment group and is the mean of control group in each research. The meta-analysis result is computed using the log response ratio, that is,
We use the log response ratio and the standard error in the meta-analysis process to prepare summary of effect and confidence limits. Then we convert them back to response ratio.
The results are weighted based on the precision of its effect value: (i.e., the weight assignment increases with the precision of the effect value). The precision of previous studies is mainly from the inverse of pooled variance. In related study area, results using different weighting functions are qualitatively similar [24]. In order to accommodate the lack of standard deviations, we use an alternative method, given by
where is the replicates of treatment group and is the replicates of control group in each research. Note that Equation (3) embodies the principle of high weight assignment to more precise study with fewer assumptions [32,33].
Traditional parametric models rely on the assumption that the observations of treatment and control groups are normally distributed. However, few experimental results in the ecological field can satisfy this requirement. To this end, we adopt the bootstrapping method to test the significance and estimate the confidence limits [32]. The mean effect size and the 95% confidence limits are produced using bootstrapping (9999 iterations) in this study. If the 95% confidence limits overlap with zero, the treatment is considered to have significant effects. We apply meta-analysis to quantify the effect of nitrogen fertilization (based on data in the first group, in which the control treatment is NN) and reduced nitrogen fertilization (based on data in the second group, in which the control treatment is CN). All meta-analysis is calculated using OpenMEE—an intuitive, open-source, free software for meta-analysis in ecology and evolutionary biology [34]. To better present the results, we use the form of percentages (R − 1) × 100% to represent the effect size.
Scatterplots and smoothing lines are used to detect the response in environment and productivity to nitrogen fertilizer application. The deviance reduction method is then used to explore the thresholds of nitrogen application rate, which cause abrupt changes in environment and production [35]. We determine the thresholds of application rate using the data in the first group (in which the control treatment is NN). The scatter plots and smoothing curves were depicted by package “ggplot2” in R (https://www.r-project.org/). The determination of the location of the thresholds is complicated using package “rpart” in R. Although multiple-comparison trap and Raven’s paradox may hide in the null hypothesis testing [36], our objective is to prove that the effect size is not the same along the fertilizer application rate gradient. So, we use Chi-square test to testify the existence of the thresholds [37]. In order to reduce the uncertainty of the result, we conduct bootstrap with 4999 times for one variable to get threshold results and chose the median as the final thresholds. We plot figures using ArcGIS and Origin 2018.
3. Results
3.1. Impact of Nitrogen Fertilizer Application on Nitrogen Losses
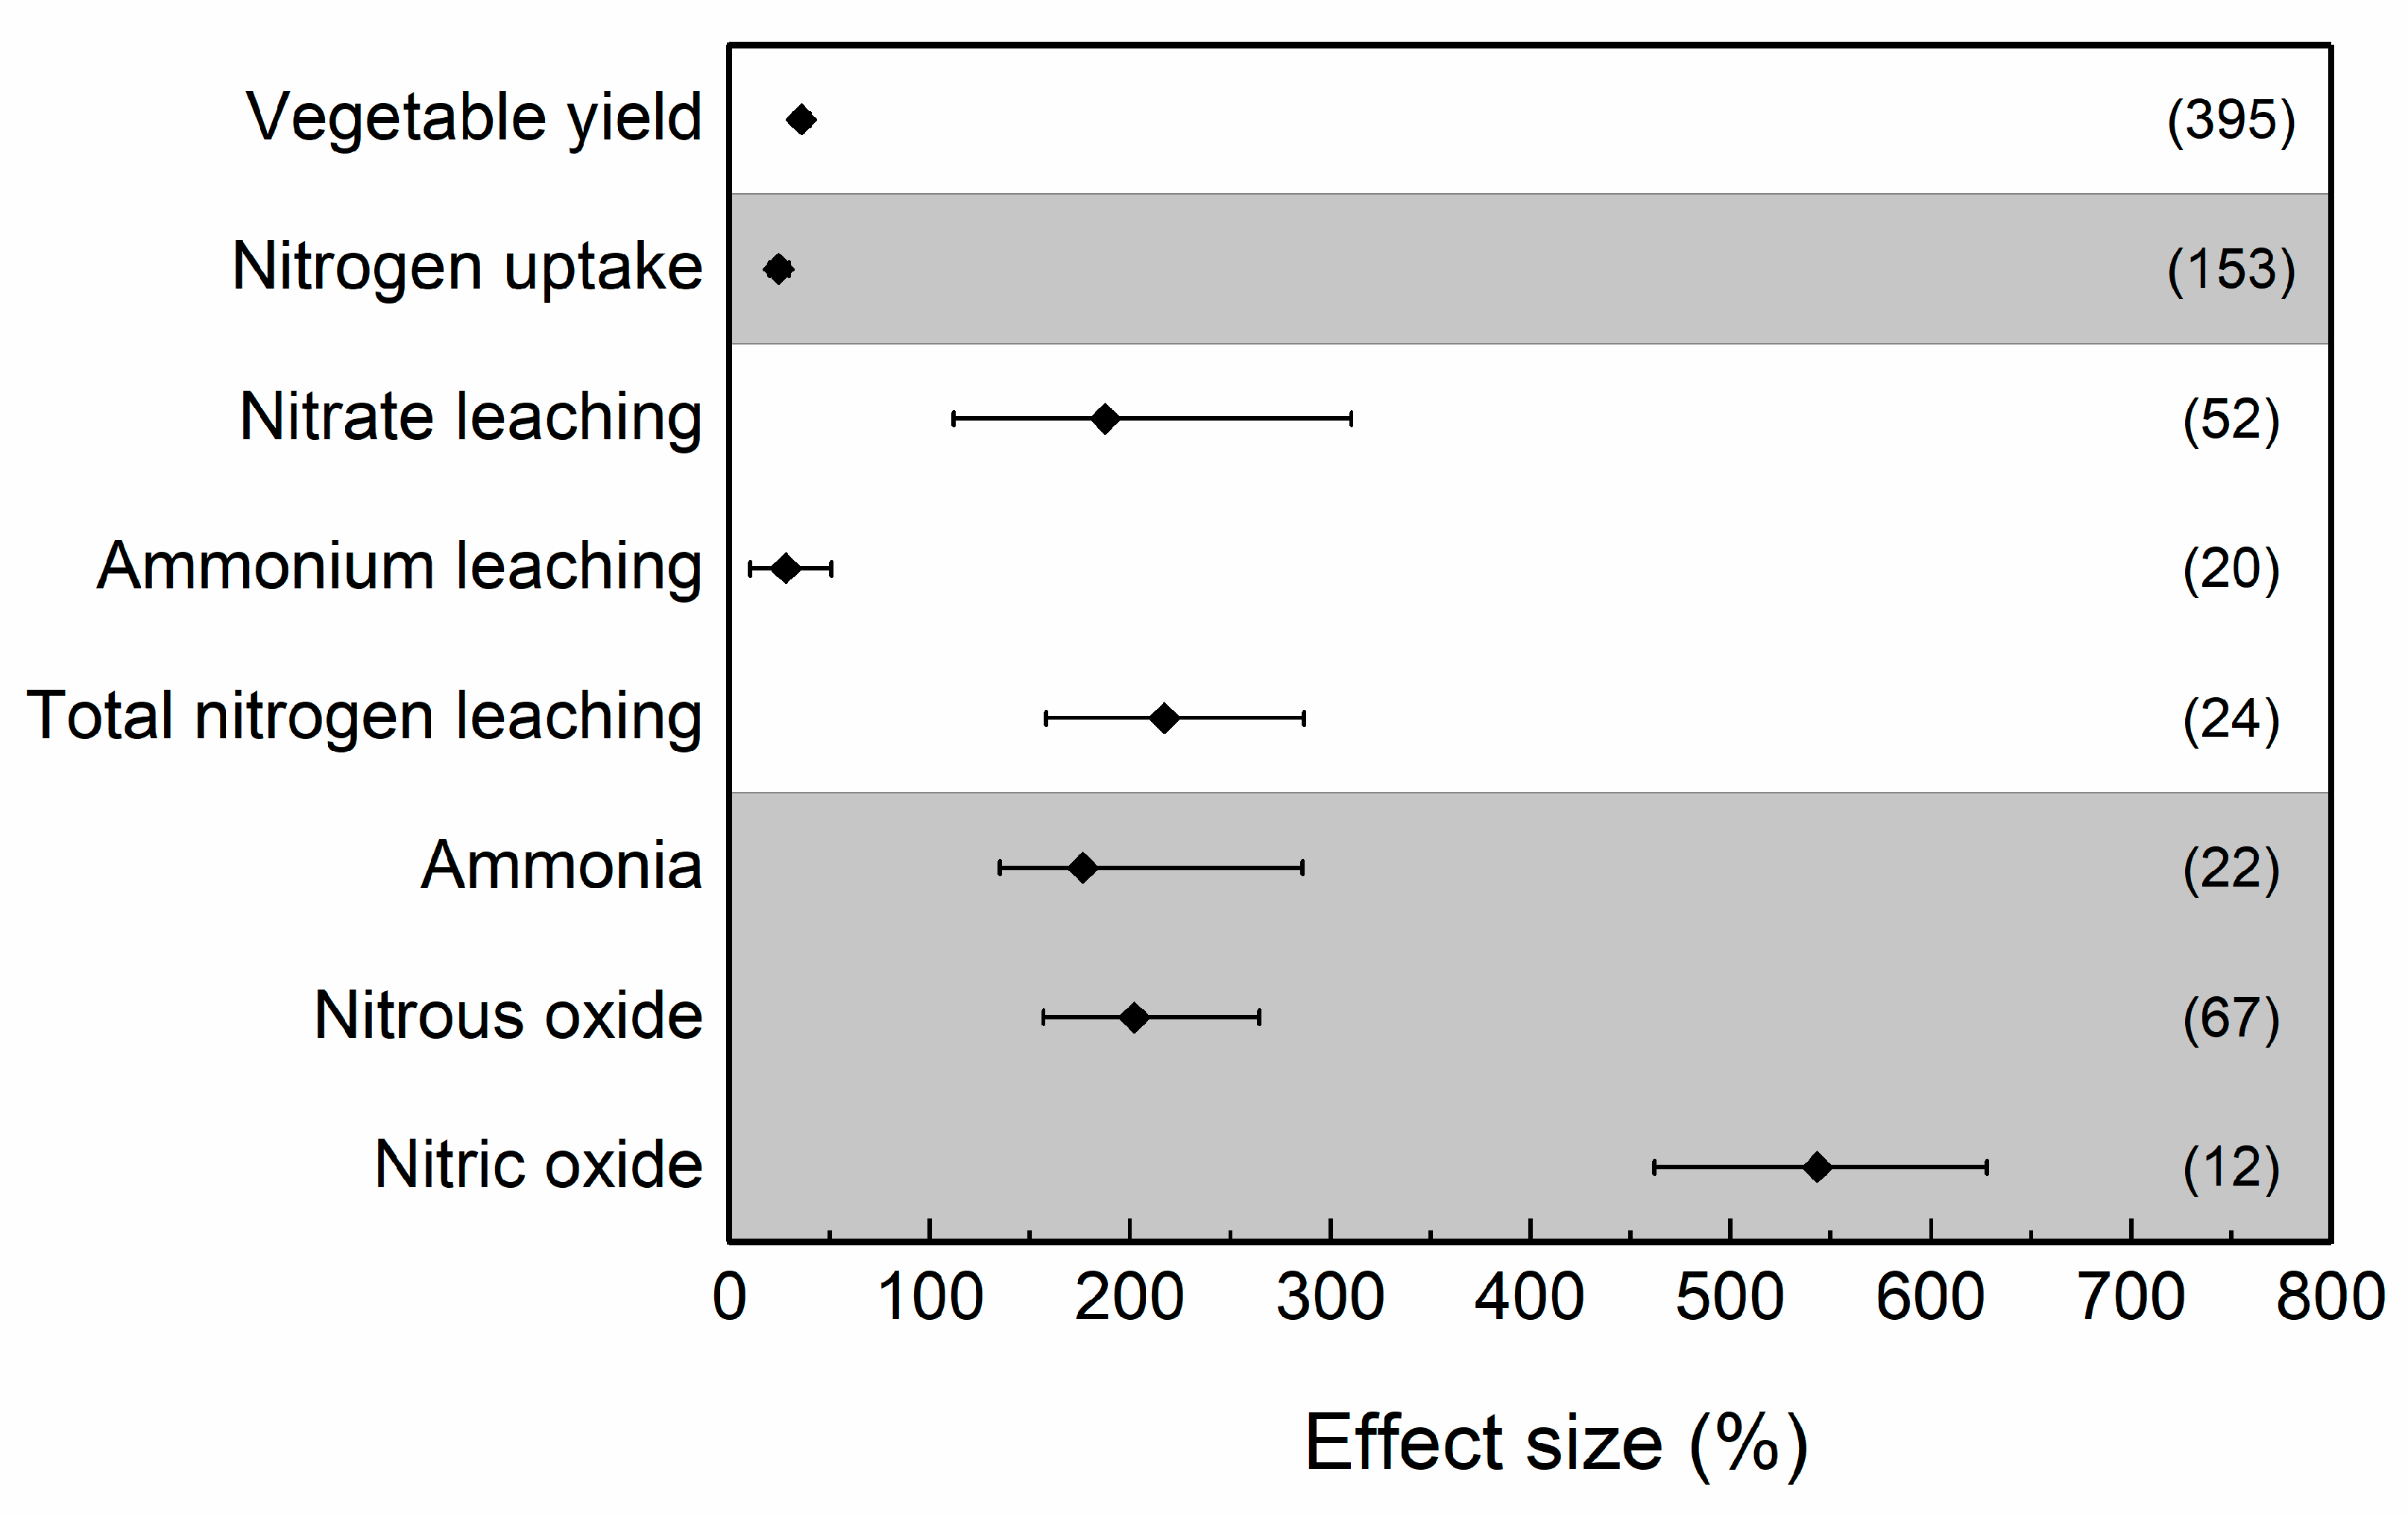
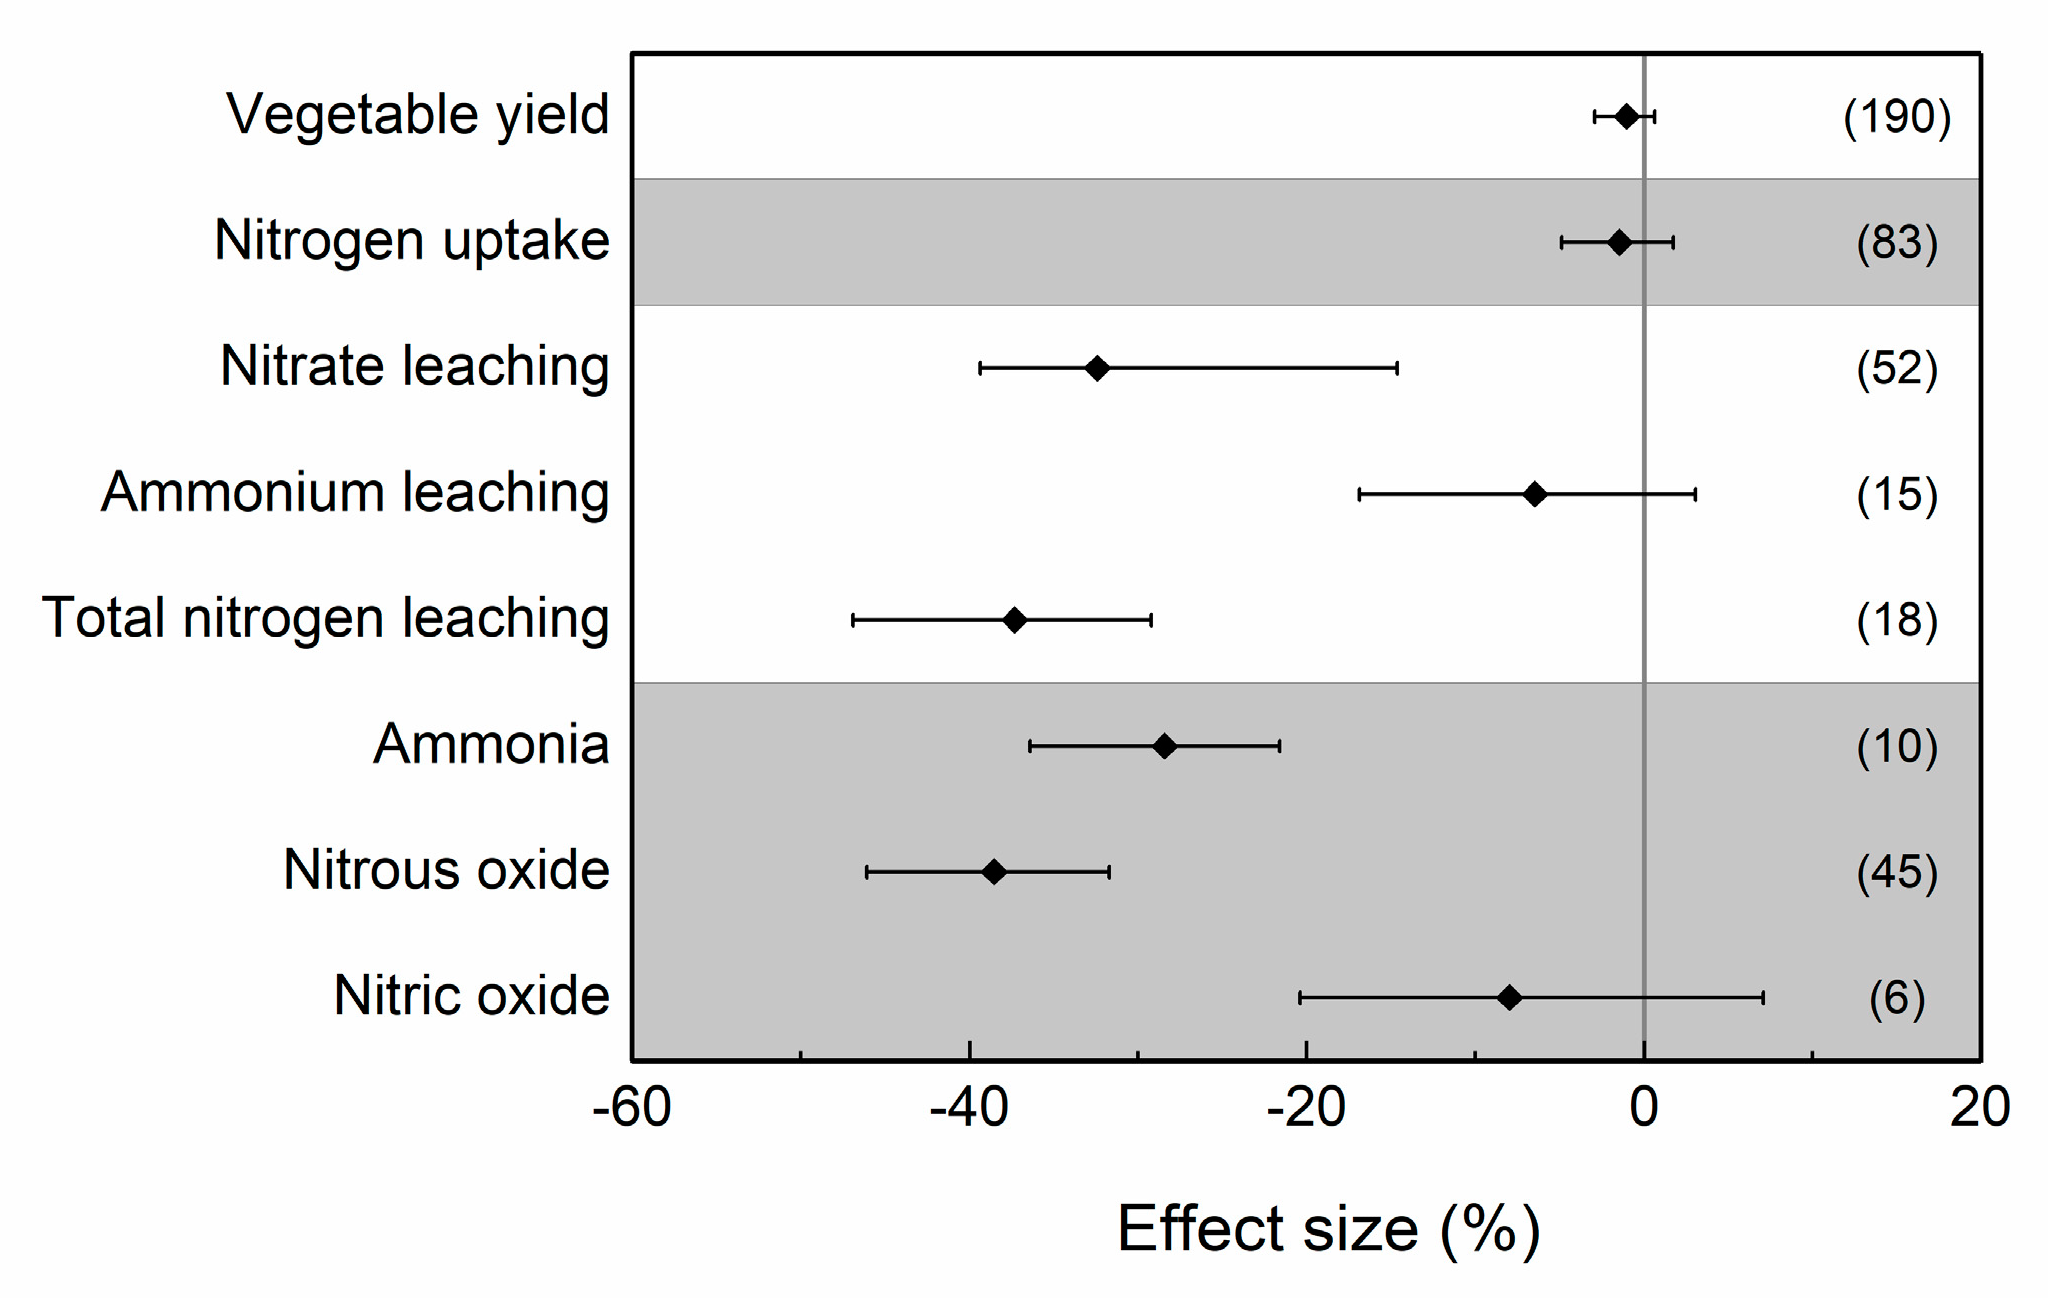
The response of nitrogen loss and production to nitrogen fertilization is shown in Figure 2. The application of nitrogen fertilizer significantly increases nitrogen losses including leaching and gas emission. It makes a noticeable impact on the environment, causing almost three times nitrate leaching and total nitrogen leaching (2.88 times (CI: 2.11–4.10) and 3.17 times (CI: 2.58–3.87), respectively). In terms of gas emission, its application in greenhouse vegetation elevates the emission of ammonia, nitrous oxide and nitric oxide by 176.42% (CI: 135.1–286.1%), 202.02% (CI: 156.8–264.7%) and 543.3% (CI: 461.8–627.9%), respectively. Compared with nitrogen losses, its application increases the nitrogen uptake and vegetable yield by 24.5% (CI: 19.9–29.8%) and 35.7% (CI: 31.8–40.1%), respectively.
3.2. The Thresholds of Nitrogen Fertilizer Application Rate
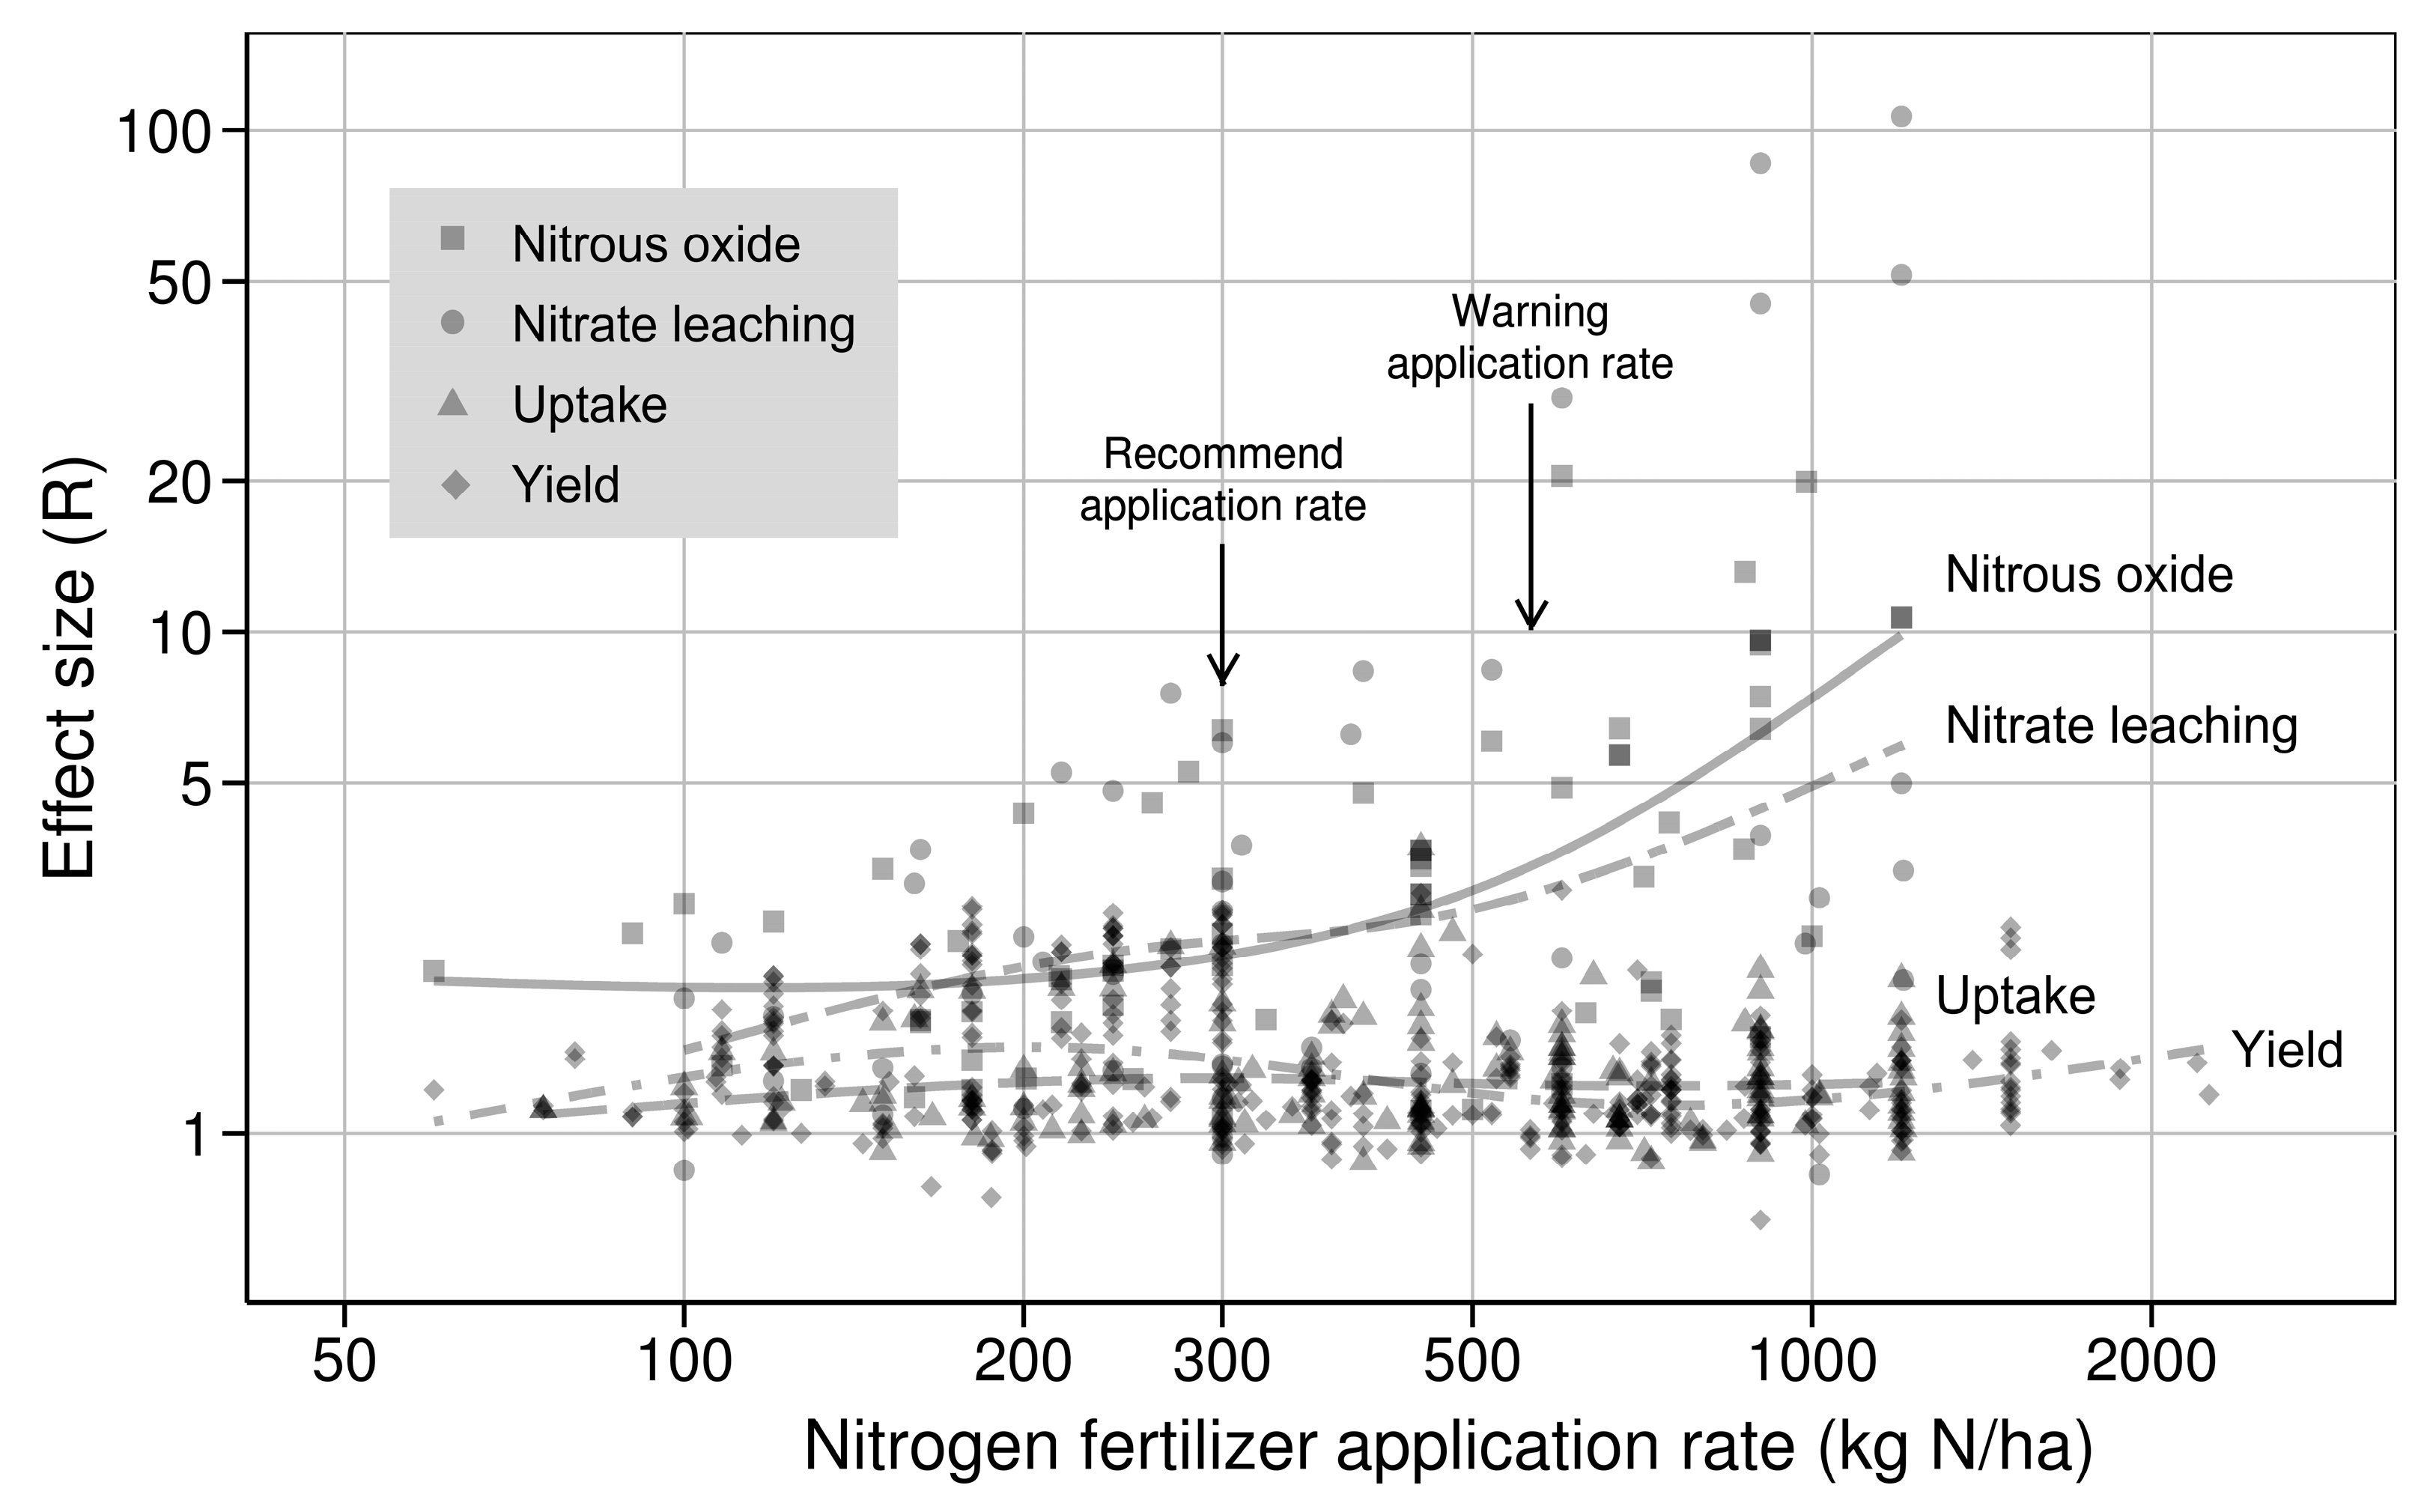
Although many individual experiments have examined the response of nitrogen loss to different nitrogen fertilizer application rates, it is difficult to draw general conclusions because of various planting environment and limited samples in each study. As such, meta-analysis (details in Section 2.2) appears to be a feasible approach tackle these problems. Here, this study demonstrates that a non-linear relationship exists between nitrogen loss and nitrogen fertilizer application rate (Figure 3). The effect of fertilization on both nitrous oxide and nitrate leaching are much higher than that on yield and uptake. It means that the application of nitrogen fertilizer causes more environmental problems than that brings productivity.
When the application rate is at a low stage, the effect on nitrous oxide shows a steady trend. When the application rate is at a high stage, the effect size presents an obvious increasing trend, where the slope of the smooth line increases gradually (note that the Y-axis is a log axis). The effect on nitrate leaching displays a similar trend as nitrous oxide. However, the effect size on nitrogen uptake and yield, both show steady trend and reach their peaks when the nitrogen application rate is less than 300 kg N/ha. When the rate increases, additional nitrogen fertilizer input does not bring more nitrogen uptake and yield increment.
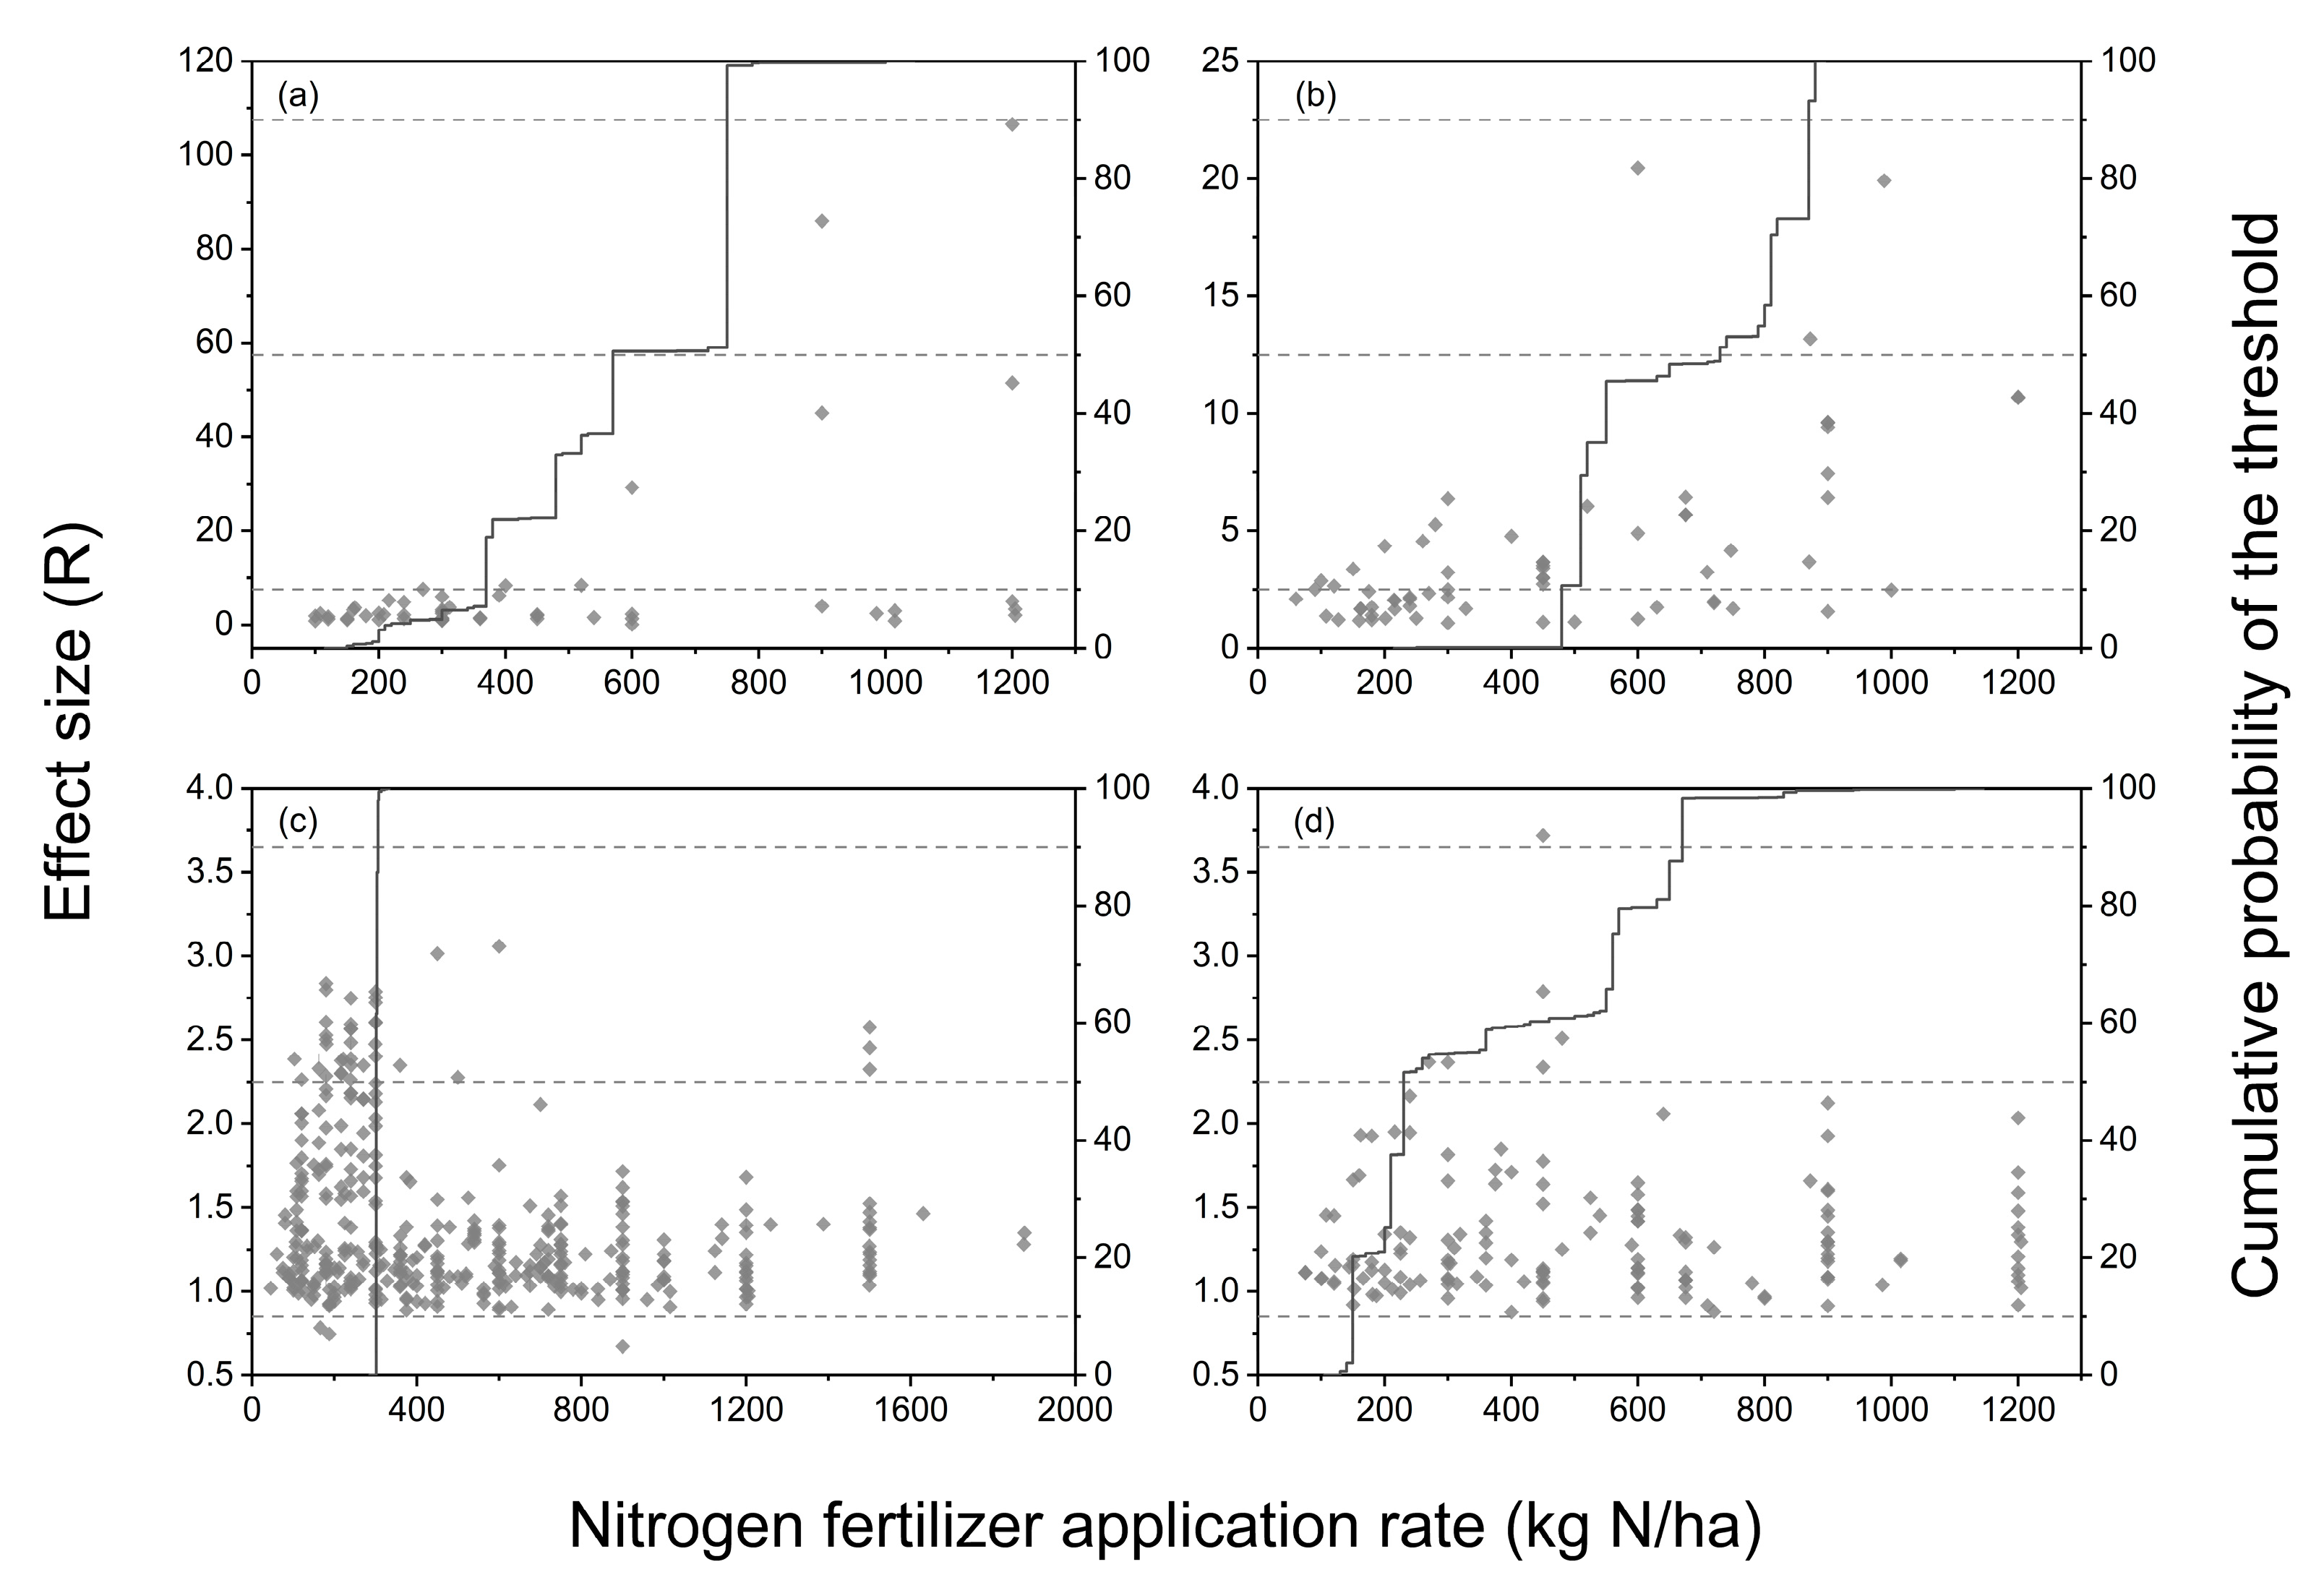
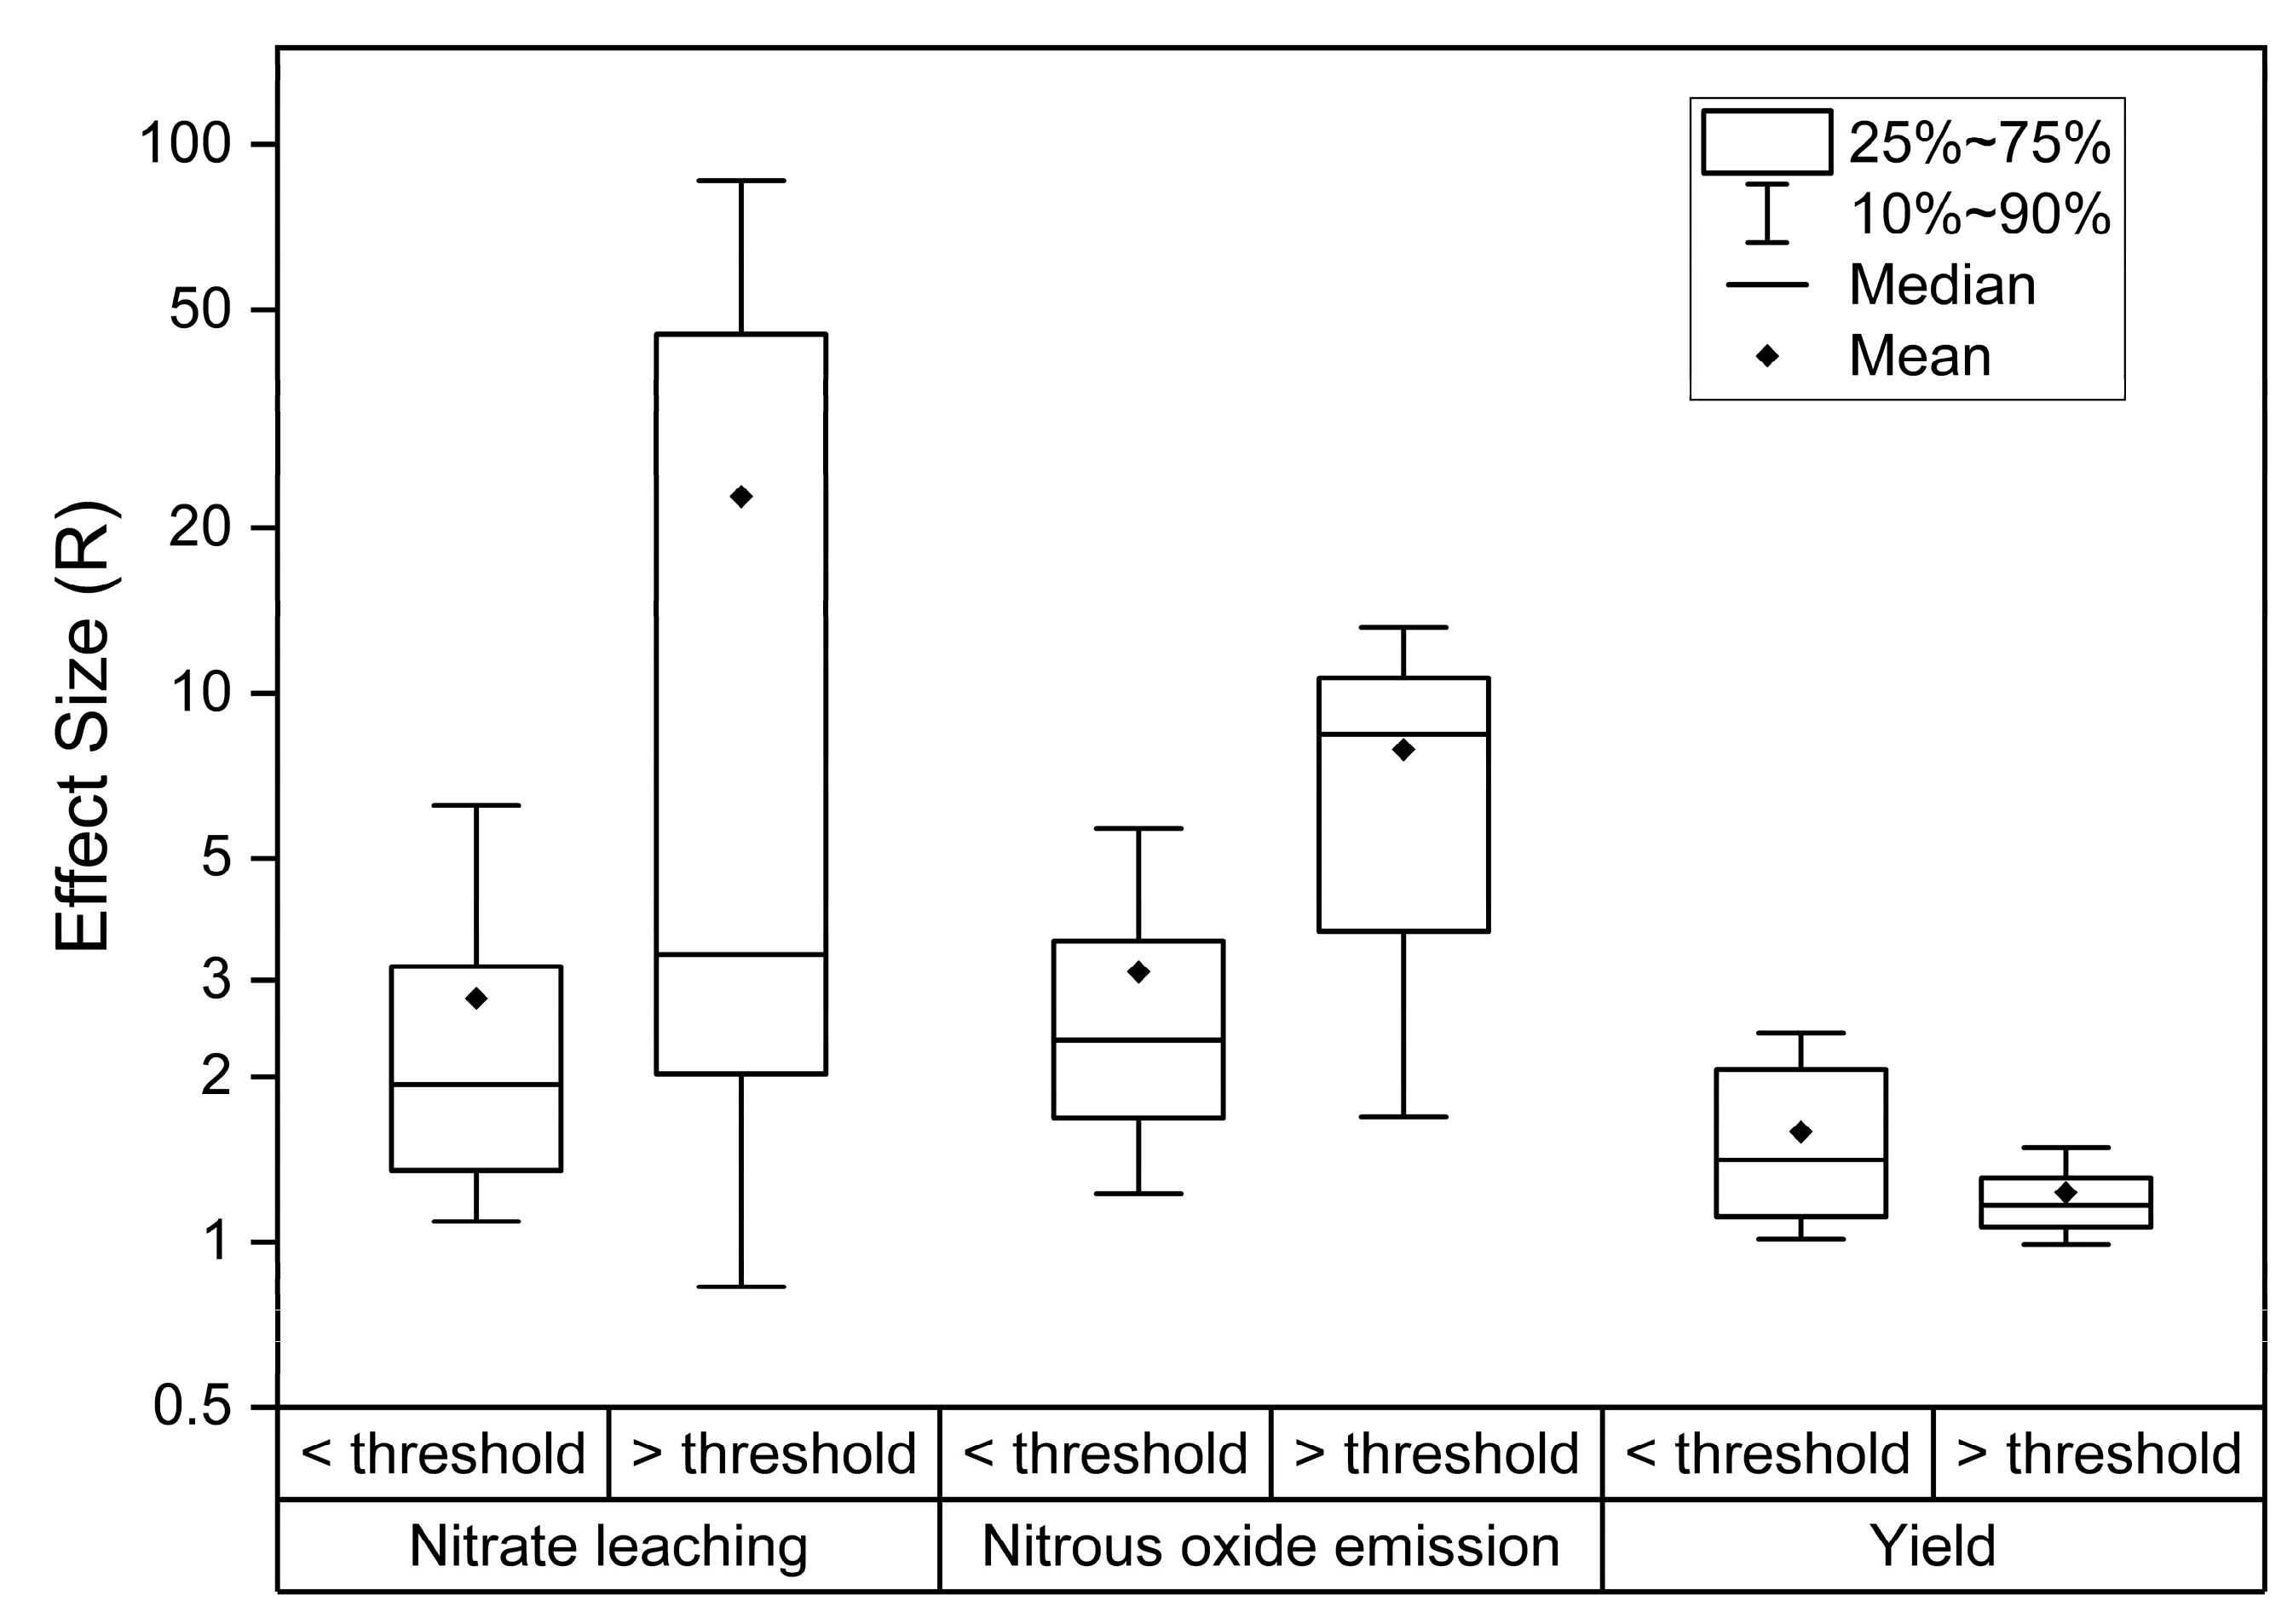
To better comprehend the non-linear relationship between nitrogen fertilizer application rates and environmental response, we detect the existence and location of the thresholds using nonparametric change point analysis. The threshold refers to a small change in the rate of nitrogen fertilizer applied, beyond which there will be significant changes in the environment and productivity. The existence of the threshold indicates that the responses of environmental variables (leaching, gas emission) to different nitrogen fertilizer application rates show more than one stage. The resample is to decrease the uncertainty and resample results are showed in Figure 4. The median of 4999 results is determined as the final threshold. The thresholds of nitrogen fertilizer application rate on nitrate leaching, nitrous oxide, yield and nitrogen uptake are 570 (90% CI: 375–750) kg N/ha, 733(90% CI: 485–871) kg N/ha, 302 (90% CI: 302–306) kg N/ha and 233 (90% CI: 156–671) kg N/ha, respectively. Only the threshold on nitrogen uptake does not pass 95% Chi-square tests. Figure 5 shows the different effects on variables (except nitrogen uptake) when the nitrogen application rate is below and above the thresholds. When the application rate exceeds the threshold, the effect on nitrate leaching and nitrous oxide emission increases while the effect on yield decreases. The average effect size (R) on nitrate leaching, nitrous oxide and yield change from 2.8 to 22.8, from 3.1 to 7.9, from 1.6 to 1.2, respectively.
3.3. Impact of Reducing Nitrogen Fertilizer Application on Reactive Nitrogen Losses
We analyze the impact of reducing nitrogen fertilizer application by comparing the responses under optimal application rates with the under conventional application rates of local farmers. Figure 6 clearly presents that a decline of nitrogen application that significantly decreases the environmental impacts. In terms of leaching, it lowers nitrate leaching by about 32.4% (CI: −39.4% to −14.6%); ammonium leaching by about 6.5% (CI: −16.9% to −3.0%); and total nitrogen leaching by about 37.3% (CI: −46.9 to −29.2%). It reduces greenhouse gas emissions, such as cutting nitrous oxide by about 38.6% (CI: −46.1% to −31.7%); ammonia by about 28.1% (CI: −36.4% to −21.6%); and nitric oxide by about 8.0% (CI: −20.4% to −7.1%). In addition, reducing nitrogen application causes insignificant influence on nitrogen uptake and yield, despite of a slight decrease.
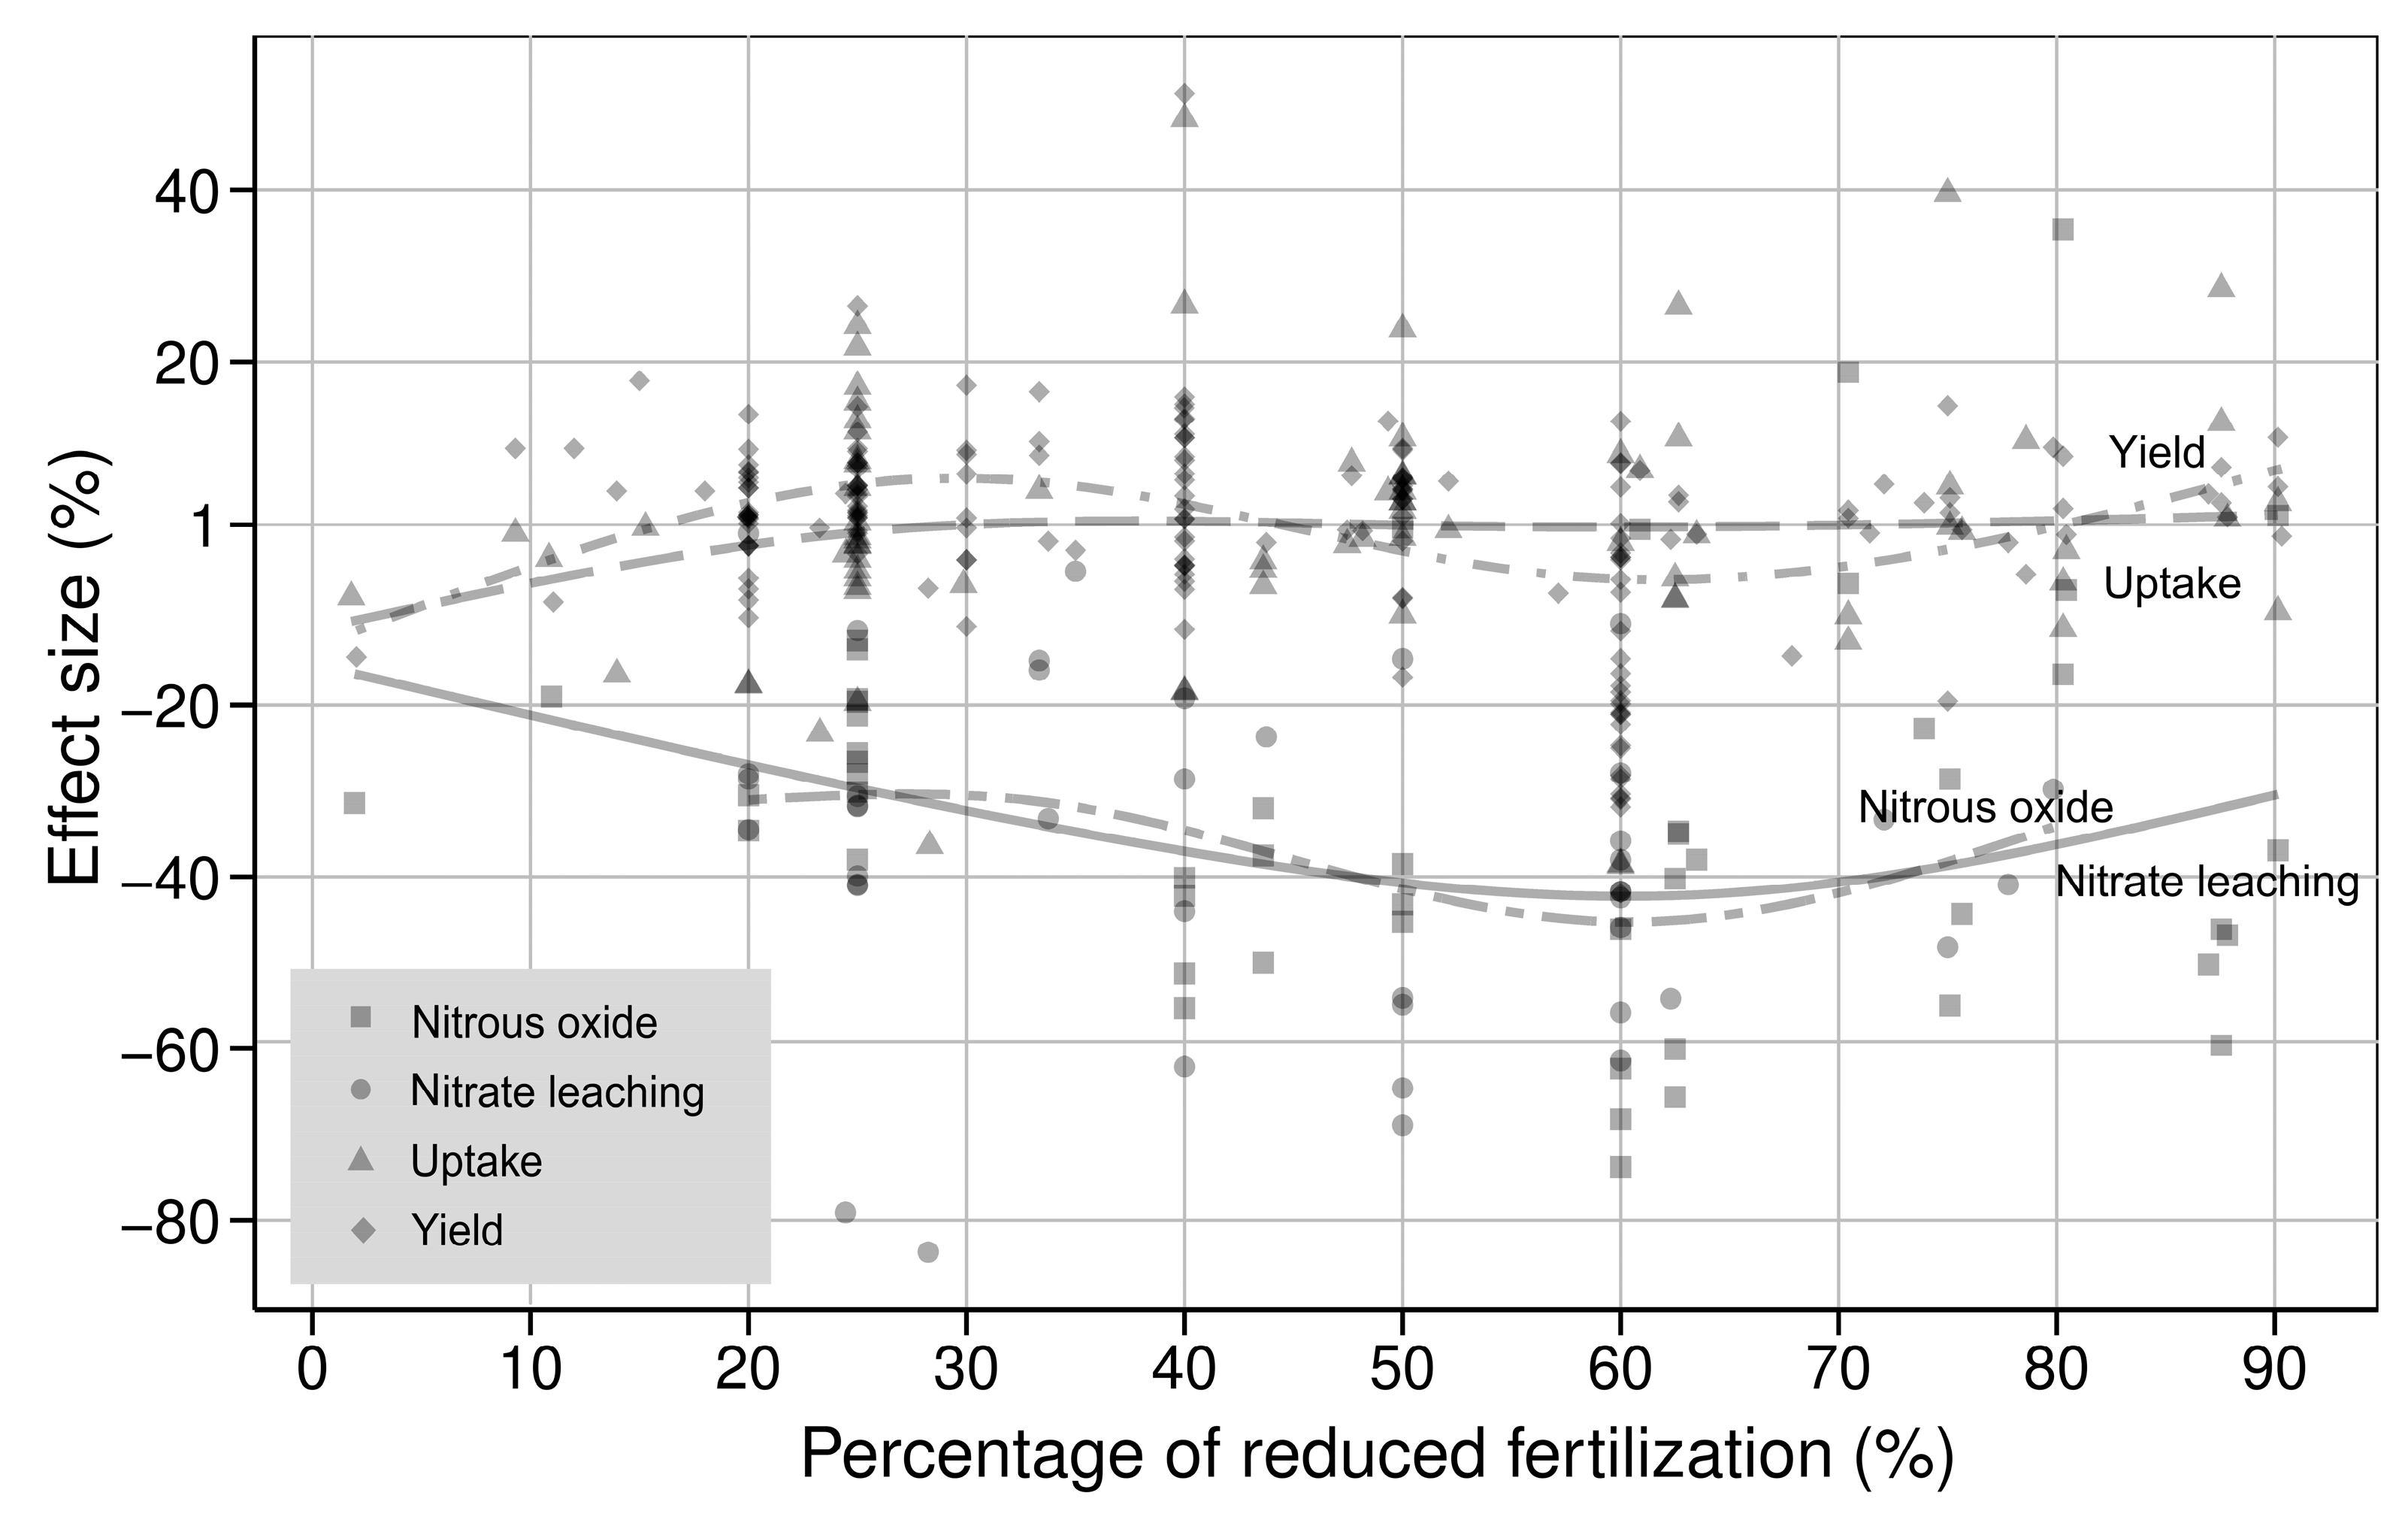
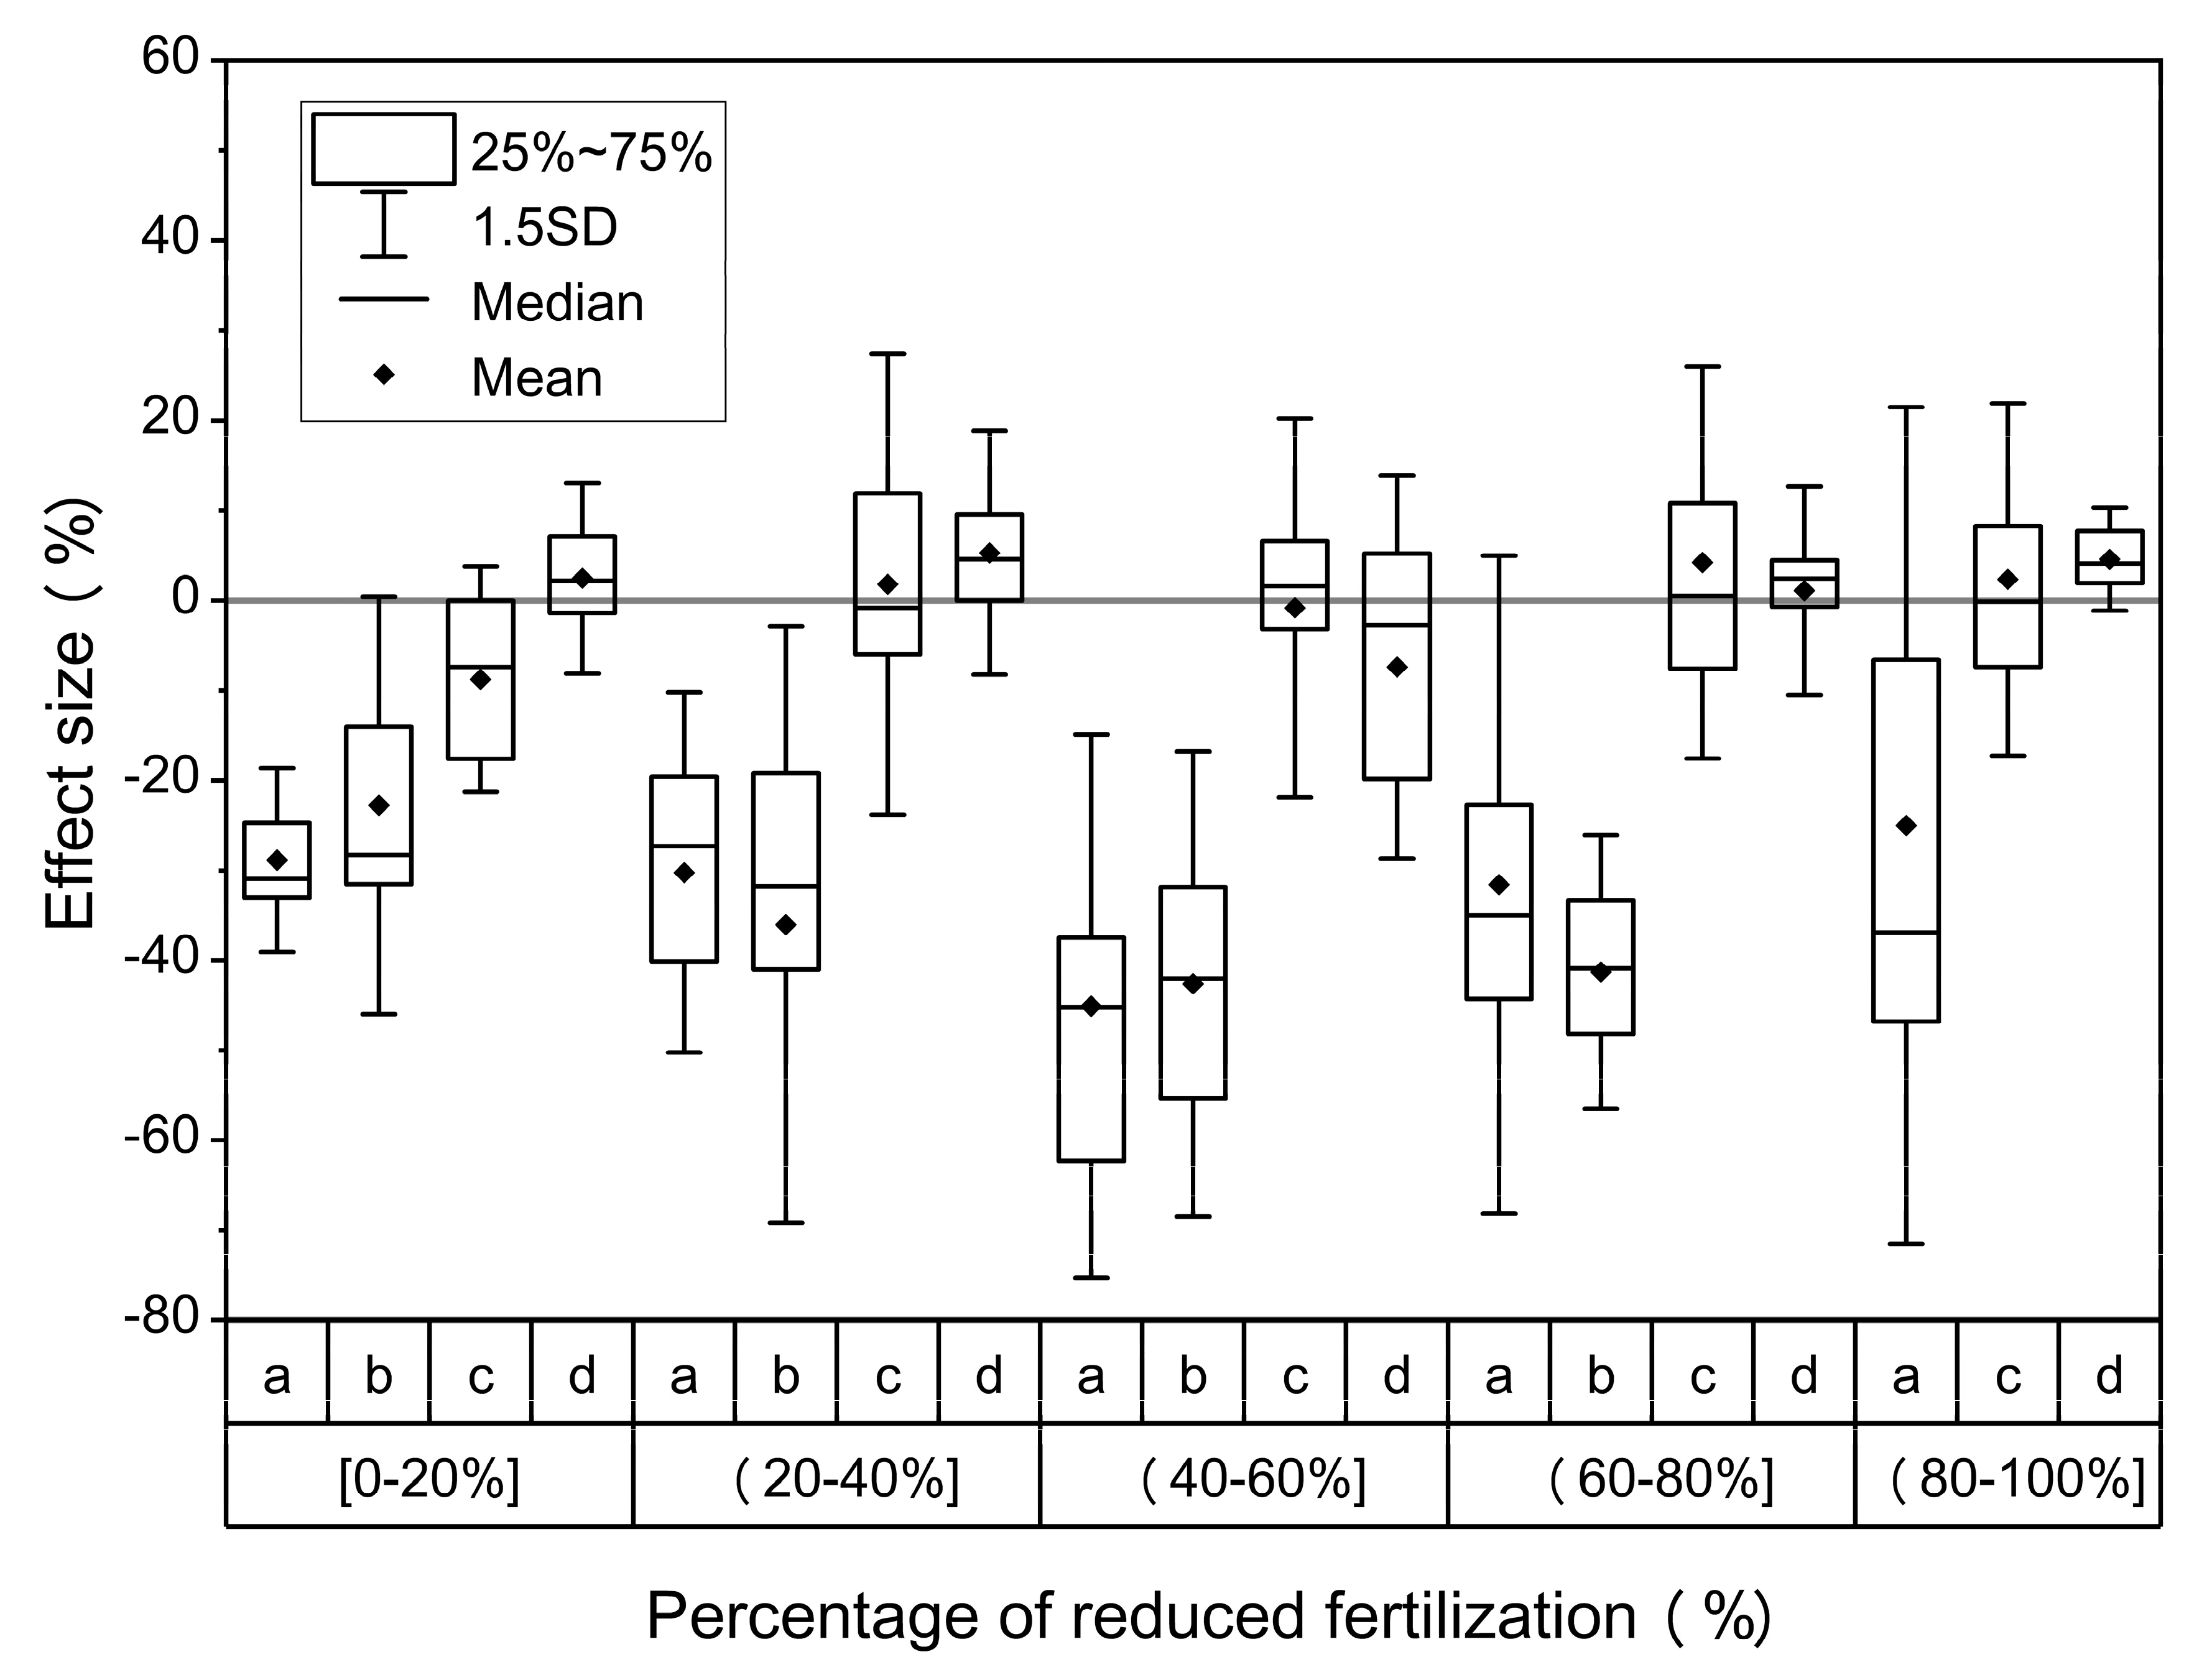
In order to have clear understanding of the effect of reducing fertilization, we calculated the percentage of reduced fertilization relative to conventional application rate and depict the relationship between it and nitrogen losses and productivity (Figure 7 and Figure 8). The results indicate that the effect size of nitrogen losses is obviously smaller than one. It means reducing fertilization can significantly reduce the nitrogen losses. When the conventional nitrogen application is cut by 40–60%, the nitrate leaching (−45.1%) and nitrous oxide emission (−42.6%) both are reduced to minimum levels (Figure 7 and Figure 8). The trends of nitrogen uptake and yield reflect the feasibility of reducing nitrogen application on overall productivity. The effect size of nitrogen uptake and yield stabilize at one despite of the reduction in nitrogen application rate. This suggests that a moderate reduction in nitrogen application does not sacrifice the vegetable yield.
4. Discussion
4.1. Characteristic of Environmental Response in GVP
In the ecosystem, nitrogen addition substantially increases nitrification (154%), denitrification (84%), inorganic nitrogen leaching (461%), nitrous oxide emission (134%), forming “a leaky terrestrial nitrogen system” [38]. And in greenhouse vegetable production (GVP), the nitrogen fertilizer application causes serious environmental problems with: 202.0% (CI: 156.8–264.7%) nitrous oxide emission augment and 187.5% (CI: 111.7–310.4%) nitrate leaching increase (Figure 2). The results indicated that the huge environmental cost caused by excessive nitrogen input could not be compensated with the little increased yield in Chinese GVP.
In addition, in GVP, we confirm there is a threshold of nitrogen fertilizer input beyond which there will be significant environmental impacts. Excessive nitrogen due to fertilizers not only presents environmental consequences, which will pollute underground water, increase eutrophication of surface water [39]. The environmental costs will increase by many times instead of staying constant. Many studies establish a non-linear relationship exists between nitrogen losses (nitrate leaching and nitrous oxide emission) and nitrogen input. It means that when the input rate exceeds the threshold, a little extra nitrogen input will cause huge environment costs. And this result is in accordance with an increasing number of studies which found that the nitrogen losses grows much faster than that of a linear relationship in relation to the nitrogen input [8,40,41,42]. Observations across terrestrial ecosystems showed nitrification increases exponentially with nitrogen load [43]. In the north of China, nitrate accumulation increased exponentially with nitrogen surplus or nitrogen input at the high ground [44]. Based on meta-analysis, Cui et al. [40] developed an exponential relationship between nitrogen input and nitrate leaching for maize in China. Kim et al. [21] conceptualized three stages to describe the response of nitrous oxide emission to nitrogen input, that is, linear, exponential and steady state. The critical points of these stages are nitrogen uptake by crops and soil microbes. We focus on the GVP, which consumes much more fertilizer and has lower use efficiency than other crops and causes more serious nitrogen losses [45]. Our results show a rapid increase in reactive nitrogen losses when the nitrogen fertilizer application exceeded the thresholds (570 kg N/ha for nitrate leaching, 733 kg N/ha for nitrous oxide). This result emphasizes the importance of optimal fertilization in terms of environmental cost.
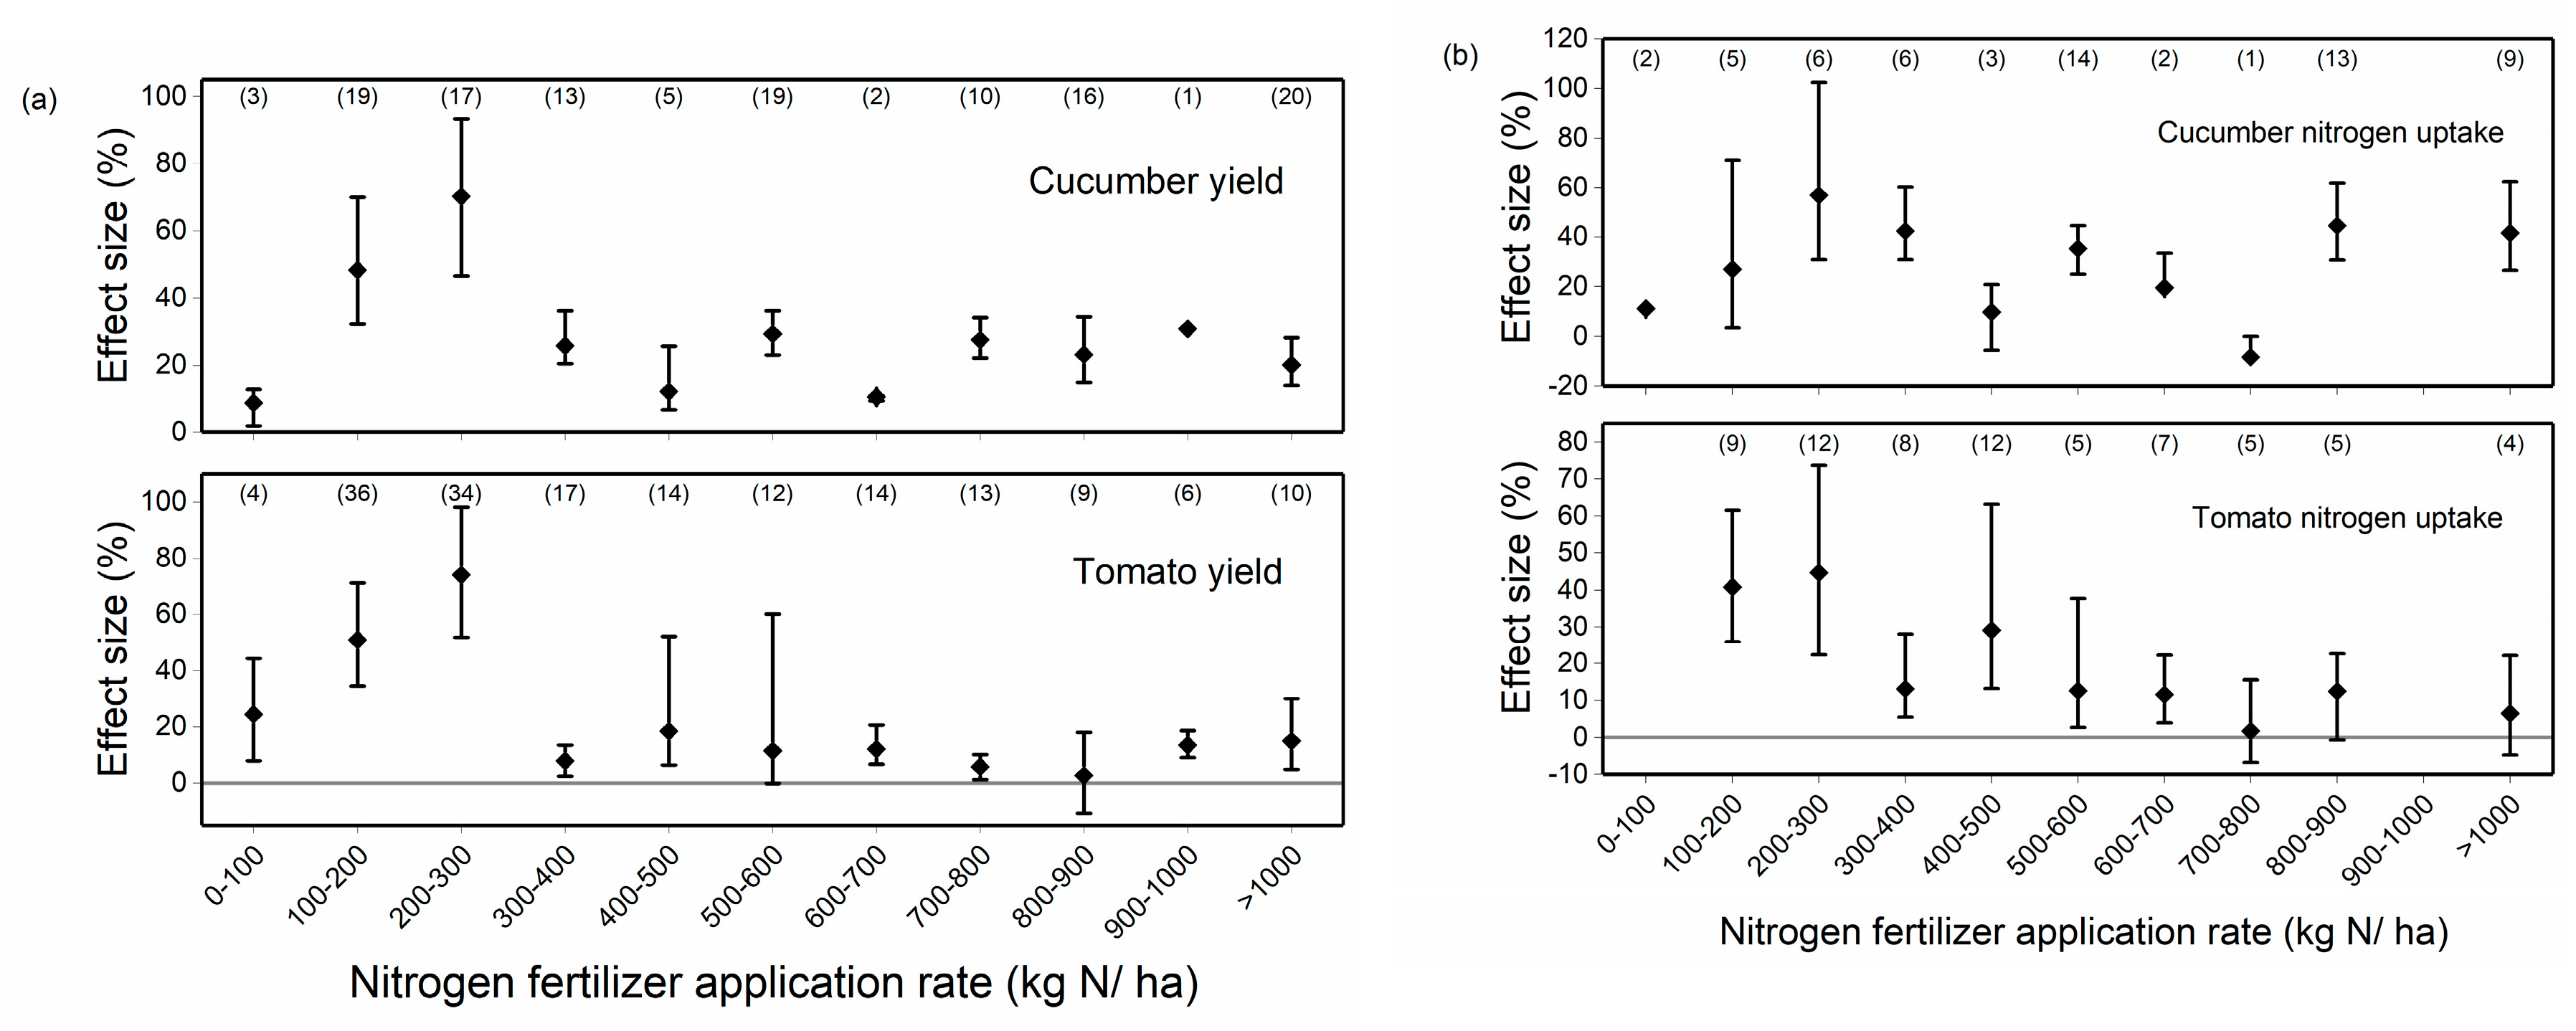
4.2. Implication in Decision Making
Our results reveal that, the threshold of the nitrogen application rate is around 302 kg N/ha in terms of yield. When the application rate exceeds this value, the effect of nitrogen fertilizer will decrease. Because the yield is closely related to nitrogen uptake (Figure 9) [46]. When the application rate is more than the plant requirement, further nitrogen input will be unproductive, might even limit the plant nitrogen uptake. Our application rate threshold value is consistent with the guidance to greenhouse vegetable and tomato in Guidance on Scientific Fertilization for Major Crops in 2018 [47], which comes from the agronomic knowledge. And it is also consistent with Wang et al.’s recommendation that nitrogen fertilization dosages should be about 0–205 kg/ha, 0–320 kg/ha, 0–260 kg/ha for leafy vegetables, gourds and leguminous vegetables, respectively, by analyzing 3414 field datasets of vegetables in the southern China [48]. When the application rate is less than the threshold, the plants and soil microbes would compensate for the soil nitrogen and external input, hence the reactive nitrogen losses response is steady. When it exceeds the threshold, the surplus nitrate availability in soil leads to increasing nitrogen leaching; and enhances nitrous oxide emission because of increasing nitrification and denitrification [38]. Considering both environmental impact and productivity, we recommend 302 kg N/ha as an optimal nitrogen fertilizer application rate in terms of yield sustainability and 570 kg N/kg as a warning application rate in terms of environmental sustainability.
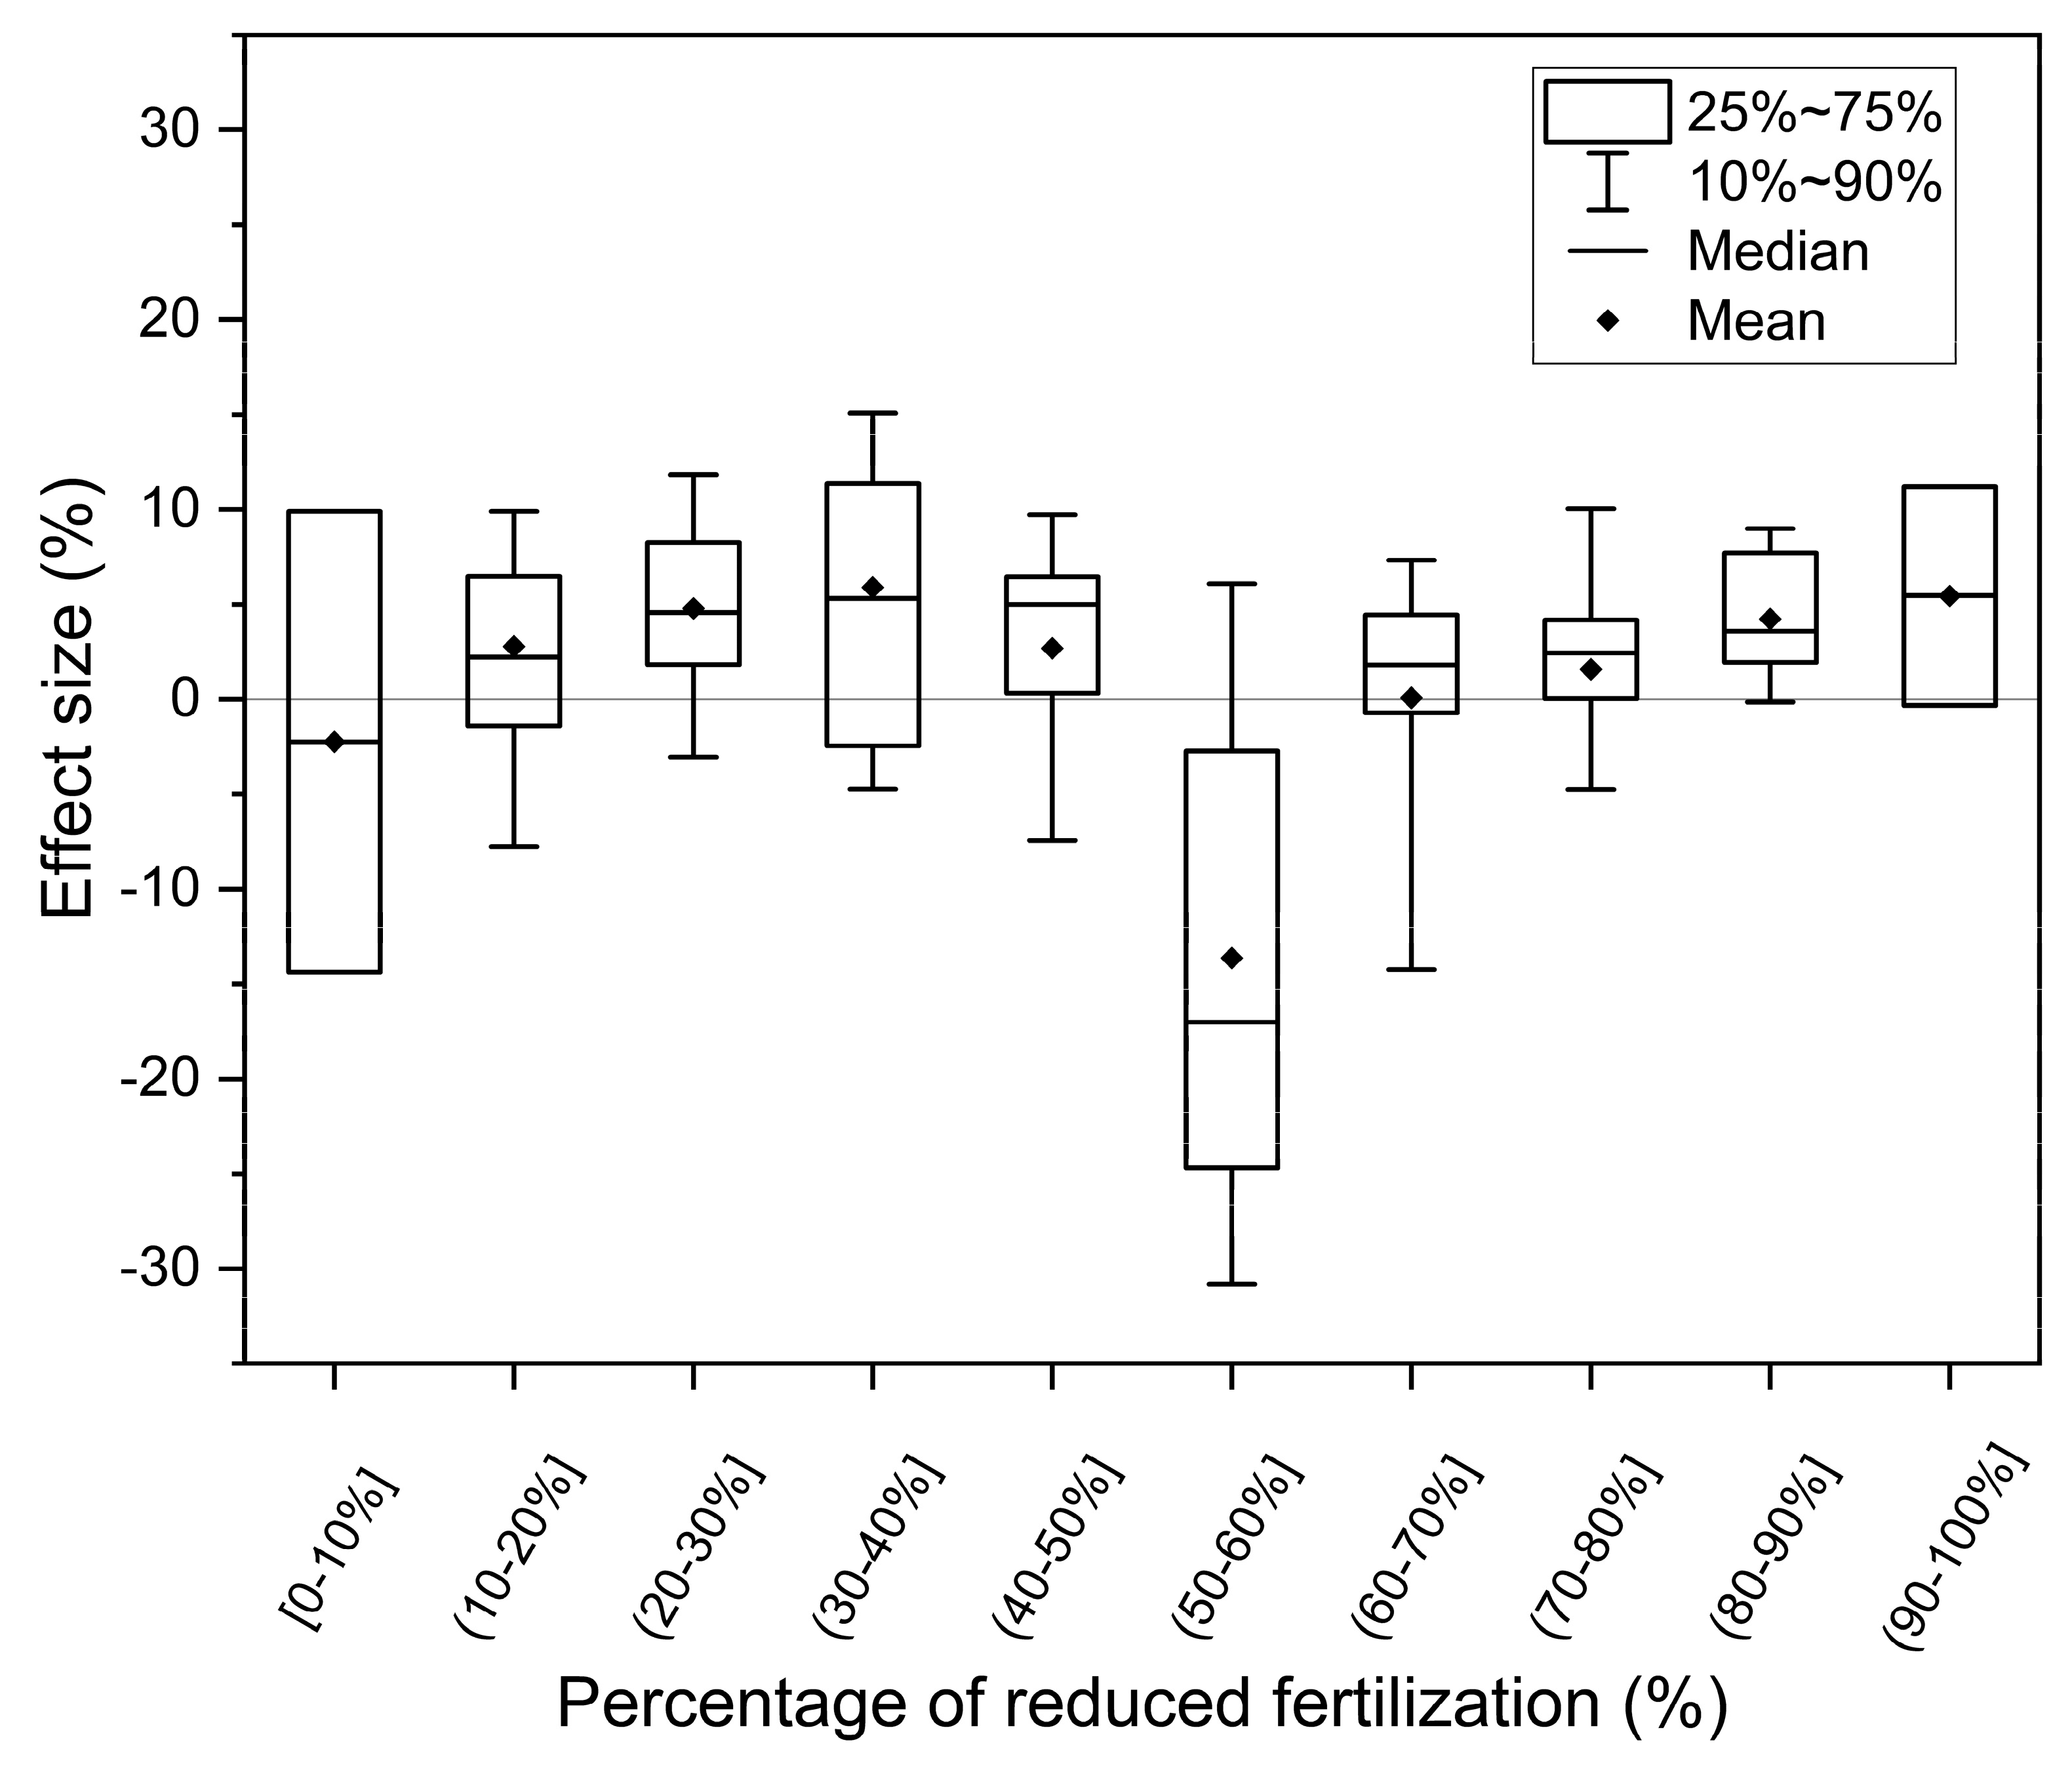
Excessive nitrogen fertilizer application is common in the Chinese agriculture system, especially in GVP. In Chinese GVP, conventional nitrogen fertilizer input is 2–8 times more than the vegetable requirement [49]. Apparently, reducing nitrogen application to optimal rate is one of efficient strategies to mitigate environmental risks. Our study comprehensively quantifies the effects of reducing nitrogen application rate on a larger scale. Comparing to the conventional application rate, reducing nitrogen input significantly decreases reactive nitrogen losses in terms of leaching and gas emission. 40–60% reduction in nitrogen fertilizer could result in more than 40% reduction in nitrous oxide emission and nitrate leaching (Figure 8). However, it hardly has any negative influence on plant nitrogen uptake and yield. These results reflect the current situation of excessive fertilization in Chinese GVP and it is feasible to reduce fertilization. Appropriate reduction of fertilization based on conventional fertilizer application rate would not reduce yield but maintain yield to some extent. When it comes to reducing fertilizer application, yield is the most important consideration due to the huge vegetable demand of the market. So, on the premise of ensuring the yield, a 20–40% reduction in fertilization is optimal (Figure 8 and Figure 10), despite only results about 30.2% reduction in nitrate leaching and 36.0% reduction in nitrous oxide emission.
Note that the 20–40% reduction in fertilization here is in accordance to Nayak et al. [49]. They found that a reduction in nitrogen fertilizer (20–40%) can reduce nitrous oxide in vegetable production (by 32–121%) without any negative impacts on the yield. An average nitrogen fertilizer rate reduction of 28% significantly reduced nitrogen leaching about 35.3%, nitrous oxide emission about 31.2% but could result in 1.3% yield increase for major crop [12]. Chen et al. also proved that reducing the fertilizer application by 30% in China, would significantly enhance the environmental performance by reducing soil nitrogen surplus and total nitrogen emission, without threaten to food security [50].
4.3. Future Consideration
This meta-analysis relied on large amount of field data to perform statistical analysis and have several limitations. Firstly, the experimental points applied in this study are not evenly distributed across China and covered very few studies in the southwest China. This might be because of uneven distribution of vegetable cultivation areas in China; and researchers preferred to experiment with existing vegetable cultivation areas instead of constructing new greenhouses. Secondly, our estimates have uncertainty because of limited sample size and could be influenced by a few of outliers. Considering the integrity of the collected data in this meta-analysis, we kept all data in the analysis process. In a future study, we hope to gather more studies about greenhouse gas emission and leaching in greenhouse vegetable ecosystem. From there, we would have enough scientific evidence to clarify the relationship between the nitrogen fertilizer application and environmental impact.
5. Conclusions
Greenhouse vegetable production is becoming the mainstream vegetable cultivation approach in modern China. Despite the desirable scale of the economy of this cultivation approach, excessive nitrogen fertilizer application in greenhouse vegetable presents environmental challenges. Based on meta-analysis, we evaluate the impacts of nitrogen fertilizer on the nitrogen losses on a broad scale. We find that nitrogen fertilizer application significantly increases nitrogen losses (nitrous oxide emission and nitrate leaching) and productivity (plant uptake, yield) in the greenhouse vegetable production system. And these responses of environmental impacts to different nitrogen fertilizer application rates show a non-linear relationship. When nitrogen input exceeds the threshold (570 kg N/ha for nitrate leaching, 733 kg N/ha for nitrous oxide), it will cause several times the leaching and gas emission. We also clarify the effect of reducing nitrogen fertilizer application on a large scale. Compared with the conventional fertilization rate, commonly used by local farmers, reducing nitrogen fertilizer application rate significantly reduces the negative effects on the environment but has minimal effect on the yield and nitrogen uptake. Twenty to forty percent reduction in fertilization is optimal and it results in about 30% reduction in nitrous oxide emission and nitrate leaching while slightly increase vegetable yield. We confirmed that proper management of the nitrogen fertilizer application rate can mitigate adverse environmental pollution and achieve sustainable crop productivity. Our findings should provide helpful guidance for the scientific management of Chinese greenhouse vegetable cultivation.
Supplementary Materials
The following are available online at https://0-www-mdpi-com.brum.beds.ac.uk/2071-1050/11/6/1513/s1, Table S1: References for publications used in the meta-analysis.
Author Contributions
Conceptualization, H.Z., X.L. and Y.J.; Formal analysis, H.Z., X.L. and Y.J.; Writing—original draft, H.Z.; Writing—review & editing, H.Z., X.L. and Y.J.
Funding
This research was funded by National Key R&D Program of China, grant number 2016YFD0201206.
Acknowledgments
We are grateful for the constructive comments on this manuscript from the reviewers and editors. Shaochen Guo, Yunjie Liao, Xi Luo and Xiaofeng Chen gave helpful suggestions. We appreciate the authors of all the published data for their hard work.
Conflicts of Interest
The authors declare no conflict of interest.
References
- FAOSTAT. 2018. Available online: http://www.fao.org/faostat/zh/#compare (accessed on 4 April 2018).
- Zhang, Y.; Lin, F.; Jin, Y.; Wang, X.; Liu, S.; Zou, J. Response of nitric and nitrous oxide fluxes to N fertilizer application in greenhouse vegetable cropping systems in southeast China. Sci. Rep. 2016, 6, 20700. [Google Scholar] [CrossRef] [PubMed] [Green Version]
- Ma, L.; Velthof, G.L.; Wang, F.H.; Qin, W.; Zhang, W.F.; Liu, Z.; Zhang, Y.; Wei, J.; Lesschen, J.P.; Ma, W.Q.; et al. Nitrogen and phosphorus use efficiencies and losses in the food chain in China at regional scales in 1980 and 2005. Sci. Total Environ. 2012, 434, 51–61. [Google Scholar] [CrossRef] [PubMed]
- Tei, F.; Nicola, S.; Benincasa, P. Advances in Research on Fertilization Management of Vegetable Crops; Springer International Publishing: Cham, Switzerland, 2017. [Google Scholar]
- Ju, X.T.; Kou, C.L.; Zhang, F.S.; Christie, P. Nitrogen balance and groundwater nitrate contamination: Comparison among three intensive cropping systems on the North China Plain. Environ. Pollut. 2006, 143, 117–125. [Google Scholar] [CrossRef] [PubMed] [Green Version]
- Sun, Y.; Zhang, J.; Wang, H.; Wang, L.; Li, H. Identifying optimal water and nitrogen inputs for high efficiency and low environment impacts of a greenhouse summer cucumber with a model method. Agric. Water Manag. 2019, 212, 23–34. [Google Scholar] [CrossRef]
- Zhou, J.; Gu, B.; Schlesinger, W.H.; Ju, X. Significant accumulation of nitrate in Chinese semi-humid croplands. Sci. Rep. 2016, 6, 25088. [Google Scholar] [CrossRef] [Green Version]
- Snyder, C.S.; Bruulsema, T.W.; Jensen, T.L.; Fixen, P.E. Review of greenhouse gas emissions from crop production systems and fertilizer management effects. Agric. Ecosyst. Environ. 2009, 133, 247–266. [Google Scholar] [CrossRef]
- Wang, X.; Zou, C.; Gao, X.; Guan, X.; Zhang, W.; Zhang, Y.; Shi, X.; Chen, X. Nitrous oxide emissions in Chinese vegetable systems: A meta-analysis. Environ. Pollut. 2018, 239, 375–383. [Google Scholar] [CrossRef]
- Zhang, X.; Davidson, E.A.; Mauzerall, D.L.; Searchinger, T.D.; Dumas, P.; Shen, Y. Managing nitrogen for sustainable development. Nature 2015, 15, 91. [Google Scholar] [CrossRef]
- Hochmuth, G.J. Progress in mineral nutrition and nutrient management for vegetable crops in the last 25 years. Hortscience 2003, 38, 999–1003. [Google Scholar] [CrossRef]
- Xia, L.; Lam, S.K.; Chen, D.; Wang, J.; Tang, Q.; Yan, X. Can knowledge-based N management produce more staple grain with lower greenhouse gas emission and reactive nitrogen pollution? A meta-analysis. Glob. Chang. Biol. 2017, 23, 1917–1925. [Google Scholar] [CrossRef]
- He, F.; Jiang, R.; Chen, Q.; Zhang, F.; Su, F. Nitrous oxide emissions from an intensively managed greenhouse vegetable cropping system in Northern China. Environ. Pollut. 2009, 157, 1666–1672. [Google Scholar] [CrossRef]
- Liu, Q.; Qin, Y.; Zou, J.; Guo, Y.; Gao, Z. Annual nitrous oxide emissions from open-air and greenhouse vegetable cropping systems in China. Plant Soil 2013, 370, 223–233. [Google Scholar] [CrossRef]
- Ren, T.; Christie, P.; Wang, J.; Chen, Q.; Zhang, F. Root zone soil nitrogen management to maintain high tomato yields and minimum nitrogen losses to the environment. Sci. Hortic. 2010, 125, 25–33. [Google Scholar] [CrossRef] [Green Version]
- Riya, S.; Ju, M.; Sheng, Z.L.; Wei-Ming, S.H.I.; Hosomi, M. Short-term responses of nitrous oxide emissions and concentration profiles to fertilization and irrigation in greenhouse vegetable cultivation. Pedosphere 2012, 22, 764–775. [Google Scholar] [CrossRef]
- Sun, Y.; Hu, K.L.; Fan, Z.B.; Wei, Y.P.; Lin, S.; Wang, J.G. Simulating the fate of nitrogen and optimizing water and nitrogen management of greenhouse tomato in North China using the EU-Rotate_N model. Agric. Water Manag. 2013, 128, 72–84. [Google Scholar] [CrossRef]
- Zhang, J.; Li, H.; Wang, Y.; Deng, J.; Wang, L. Multiple-year nitrous oxide emissions from a greenhouse vegetable field in China: Effects of nitrogen management. Sci. Total Environ. 2018, 616–617, 1139–1148. [Google Scholar] [CrossRef]
- IPCC. Revised 1996 IPCC Guidelines for National Greenhouse Gas Inventories. 2018. Available online: https://www.ipcc-nggip.iges.or.jp/public/gl/invs1.html (accessed on 11 June 2018).
- Liu, S.; Lin, F.; Wu, S.; Ji, C.; Sun, Y.; Jin, Y.; Li, S.; Li, Z.; Zou, J. A meta-analysis of fertilizer-induced soil NO and combined NO + N2O emissions. Glob. Chang. Biol. 2017, 23, 2520–2532. [Google Scholar] [CrossRef]
- Kim, D.-G.; Hernandez-Ramirez, G.; Giltrap, D. Linear and nonlinear dependency of direct nitrous oxide emissions on fertilizer nitrogen input: A meta-analysis. Agric. Ecosyst. Environ. 2013, 168, 53–65. [Google Scholar] [CrossRef]
- Ju, X.T.; Xing, G.X.; Chen, X.P.; Zhang, S.L.; Zhang, L.J.; Liu, X.J.; Cui, Z.L.; Yin, B.; Christie, P.; Zhu, Z.L.; et al. Reducing environmental risk by improving N management in intensive Chinese agricultural systems. Proc. Natl. Acad. Sci. USA 2009, 106, 3041–3046. [Google Scholar] [CrossRef] [Green Version]
- Hedges, L.V.; Olkin, I. Advances in statistical methods for meta-analysis. N. Direct. Progr. Eval. 1985, 1984, 25–42. [Google Scholar] [CrossRef]
- Van Groenigen, K.J.; Osenberg, C.W.; Hungate, B.A. Increased soil emissions of potent greenhouse gases under increased atmospheric CO2. Nature 2011, 475, 214–216. [Google Scholar] [CrossRef] [PubMed]
- Cai, Y.; Akiyama, H. Effects of inhibitors and biochar on nitrous oxide emissions, nitrate leaching, and plant nitrogen uptake from urine patches of grazing animals on grasslands: A meta-analysis. Soil Sci. Plant Nutr. 2017, 63, 405–414. [Google Scholar] [CrossRef]
- Daryanto, S.; Wang, L.; Jacinthe, P.A. Impacts of no-tillage management on nitrate loss from corn, soybean and wheat cultivation: A meta-analysis. Sci. Rep. 2017, 7, 12117. [Google Scholar] [CrossRef] [PubMed] [Green Version]
- Nummer, S.A.; Qian, S.S.; Harmel, R.D. A meta-analysis on the effect of agricultural conservation practices on nutrient loss. J. Environ. Qual. 2018, 47, 1172–1178. [Google Scholar] [CrossRef] [PubMed]
- Quemada, M.; Baranski, M.; Nobel-de Lange, M.N.J.; Vallejo, A.; Cooper, J.M. Meta-analysis of strategies to control nitrate leaching in irrigated agricultural systems and their effects on crop yield. Agric. Ecosyst. Environ. 2013, 174, 1–10. [Google Scholar] [CrossRef] [Green Version]
- Xia, L.; Lam, S.K.; Yan, X.; Chen, D. How does recycling of livestock manure in agroecosystems affect crop productivity, reactive nitrogen losses, and soil carbon balance? Environ. Sci. Technol. 2017, 51, 7450–7457. [Google Scholar] [CrossRef] [PubMed]
- Rohatgi, A. WebPlotDigitizer—Extract Data from Plots, Images, and Maps. 2018. Available online: https://automeris.io/WebPlotDigitizer/ (accessed on 18 April 2018).
- Borenstein, M.; Hedges, L.V.; Higgins, J.P.T.; Rothstein, H.R. Introduction to Meta-Analysis; Wiley: Oxford, UK, 2009. [Google Scholar]
- Adams, D.C.; Gurevitch, J.; Rosenberg, M.S. Resampling tests for meta-analysis of ecological data. Ecology 1997, 78, 1277. [Google Scholar] [CrossRef]
- Rosenbaum, P.R.; Hedges, L.; Olkin, I. Statistical methods for meta-analysis. J. Am. Stat. Assoc. 1987, 82, 350–351. [Google Scholar] [CrossRef]
- Wallace, B.C.; Lajeunesse, M.J.; Dietz, G.; Dahabreh, I.J.; Trikalinos, T.A.; Schmid, C.H.; Gurevitch, J. OpenMEE: Intuitive, open-source software for meta-analysis in ecology and evolutionary biology. Methods Ecol. Evol. 2017, 8, 941–947. [Google Scholar] [CrossRef]
- Qian, S.S.; King, R.S.; Richardson, C.J. Two statistical methods for the detection of environmental thresholds. Ecol. Model. 2003, 166, 87–97. [Google Scholar] [CrossRef] [Green Version]
- Qian, S.S.; Cuffney, T.F. The multiple-comparison trap and the Raven’s paradox-perils of using null hypothesis testing in environmental assessment. Environ. Monit. Assess. 2018, 190, 409. [Google Scholar] [CrossRef]
- Venables, W.N.; Ripley, B.D. Modern Applied Statistics with S-Plus; Springer: New York, NY, USA, 1994. [Google Scholar]
- Lu, M.; Yang, Y.; Luo, Y.; Fang, C.; Zhou, X.; Chen, J.; Yang, X.; Li, B. Responses of ecosystem nitrogen cycle to nitrogen addition: A meta-analysis. New Phytol. 2011, 189, 1040–1050. [Google Scholar] [CrossRef] [PubMed]
- Gu, B.; Ge, Y.; Ren, Y.; Xu, B.; Luo, W.; Jiang, H.; Gu, B.; Chang, J. Atmospheric reactive nitrogen in China: Sources, recent trends, and damage costs. Environ. Sci. Technol. 2012, 46, 9420–9427. [Google Scholar] [CrossRef] [PubMed]
- Cui, Z.; Yue, S.; Wang, G.; Meng, Q.; Wu, L.; Yang, Z.; Zhang, Q.; Li, S.; Zhang, F.; Chen, X. Closing the yield gap could reduce projected greenhouse gas emissions: A case study of maize production in China. Glob. Chang. Biol. 2013, 19, 2467–2477. [Google Scholar] [CrossRef] [PubMed]
- Hoben, J.P.; Gehl, R.J.; Millar, N.; Grace, P.R.; Robertson, G.P. Nonlinear nitrous oxide (N2O) response to nitrogen fertilizer in on-farm corn crops of the US Midwest. Glob. Chang. Biol. 2011, 17, 1140–1152. [Google Scholar] [CrossRef]
- Shcherbak, I.; Millar, N.; Robertson, G.P. Global metaanalysis of the nonlinear response of soil nitrous oxide (N2O) emissions to fertilizer nitrogen. Proc. Natl. Acad. Sci. USA 2014, 111, 9199–9204. [Google Scholar] [CrossRef] [PubMed]
- Niu, S.; Classen, A.T.; Dukes, J.S.; Kardol, P.; Liu, L.; Luo, Y.; Rustad, L.; Sun, J.; Tang, J.; Templer, P.H.; et al. Global patterns and substrate-based mechanisms of the terrestrial nitrogen cycle. Ecol. Lett. 2016, 19, 697–709. [Google Scholar] [CrossRef] [PubMed] [Green Version]
- Ju, X.; Zhang, C. Nitrogen cycling and environmental impacts in upland agricultural soils in North China: A review. J. Integr. Agric. 2017, 16, 2848–2862. [Google Scholar] [CrossRef]
- Ti, C.; Luo, Y.; Yan, X. Characteristics of nitrogen balance in open-air and greenhouse vegetable cropping systems of China. Environ. Sci. Pollut. R 2015, 22, 18508–18518. [Google Scholar] [CrossRef] [PubMed]
- Edmeades, D.C. The long-term effects of manures and fertilisers on soil productivity and quality: A review. Nutr. Cycl. Agroecosyst. 2003, 66, 165–180. [Google Scholar] [CrossRef]
- Chinese Ministry of Agriculture. Guidance on Scientific Fertilization for Major Crops in Spring 2018. Available online: http://www.moa.gov.cn/ztzl/nyhfjlzxd/201803/t20180330_6139380.htm (accessed on 17 April 2018).
- Wang, R.; Liao, X.; Yu, W.; Li, S.; Zhan, Z.; Liang, J. Updating the main vegetable fertilization index system for southern China. J. Plant Nutr. 2017, 40, 2571–2586. [Google Scholar] [CrossRef]
- Nayak, D.; Saetnan, E.; Cheng, K.; Wang, W.; Koslowski, F.; Cheng, Y.-F.; Zhu, W.Y.; Wang, J.-K.; Liu, J.-X.; Moran, D.; et al. Management opportunities to mitigate greenhouse gas emissions from Chinese agriculture. Agric. Ecosyst. Environ. 2015, 209, 108–124. [Google Scholar] [CrossRef] [Green Version]
- Chen, M.; Sun, F.; Shindo, J. China’s agricultural nitrogen flows in 2011: Environmental assessment and management scenarios. Resour. Conserv. Recycl. 2016, 111, 10–27. [Google Scholar] [CrossRef] [Green Version]
Figure 1.
Distribution of field experiments collected in this study.

Figure 2.
Effect of nitrogen fertilization on nitrogen loss and production. The effect size is represented by the form of percentages (R − 1) × 100%. R is the ratio of the treatment group result to the control group result. The bars represent 95% confidence intervals. The number in each parenthesis represents the number of paired observations.

Figure 3.
The relationship between nitrogen fertilizer application rate and nitrogen losses. The effect size is represented by R (the ratio of the treatment group result to the control group result) to represent the effect size. The smooth lined are calculated using method “rlm” in package “ggplot2.” The recommend application rate and warning application rate are based on the thresholds of nitrogen fertilizer application rate on yield and environment variable.

Figure 4.
Scatterplots of the effect size of nitrogen fertilizer application on (a) nitrate leaching (b) nitrous oxide emission (c) yield and (d) nitrogen uptake. The effect size is represented by R (the ratio of the treatment group result to the control group result). The lines indicate the cumulative probability of the thresholds of the nitrogen fertilizer application rate. Horizontal gray dash lines indicate cumulative probability of 10%, 50%, 90%, respectively.

Figure 5.
The effect of nitrogen application on the nitrate leaching, nitrous oxide emission and yield below and above the thresholds. The effects are expressed as effect size R (the ratio of the treatment group result to the control group result).
Figure 5.
The effect of nitrogen application on the nitrate leaching, nitrous oxide emission and yield below and above the thresholds. The effects are expressed as effect size R (the ratio of the treatment group result to the control group result).

Figure 6.
Effect of reducing nitrogen application on leaching, gas emission and productivity relative to conventional nitrogen fertilizer application rate (CN). The effect is represented by the form of percentages (R − 1) × 100%. R is the ratio of the treatment group result to the control group result. The bars represent 95% confidence intervals. The number in each parenthesis represents the number of paired observations.

Figure 7.
The relationship between reducing nitrogen fertilizer and reactive nitrogen losses. The effect size is represented by (R − 1) × 100%. R is the ratio of the treatment group result to the control group result. The smooth lines are calculated using method “rlm” in package “ggplot2.”.
Figure 7.
The relationship between reducing nitrogen fertilizer and reactive nitrogen losses. The effect size is represented by (R − 1) × 100%. R is the ratio of the treatment group result to the control group result. The smooth lines are calculated using method “rlm” in package “ggplot2.”.

Figure 8.
The effect of different percentage of reducing nitrogen fertilizer application rate on (a) nitrate leaching, (b) nitrous oxide emission (c) nitrogen uptake and (d) yield. The effect size is represented by (R − 1) × 100%. R is the ratio of the treatment group result to the control group result.

Figure 9.
Effect of nitrogen fertilizer application on yield (a) and nitrogen uptake (b) of major vegetable species (i.e., cucumber, tomato) in greenhouse vegetable production (GVP). The effect size is represented by (R − 1) × 100%. R is the ratio of the treatment group result to the control group result. The bars represent 95% confidence intervals. The number in each parenthesis represents the number of paired observations.

Figure 10.
Effect of reducing nitrogen fertilizer application on yield. The effect size is represented by (R − 1) × 100%. R is the ratio of the treatment group result to the control group result.
Figure 10.
Effect of reducing nitrogen fertilizer application on yield. The effect size is represented by (R − 1) × 100%. R is the ratio of the treatment group result to the control group result.

© 2019 by the authors. Licensee MDPI, Basel, Switzerland. This article is an open access article distributed under the terms and conditions of the Creative Commons Attribution (CC BY) license (http://creativecommons.org/licenses/by/4.0/).
Share and Cite
MDPI and ACS Style
Zhao, H.; Li, X.; Jiang, Y. Response of Nitrogen Losses to Excessive Nitrogen Fertilizer Application in Intensive Greenhouse Vegetable Production. Sustainability 2019, 11, 1513. https://0-doi-org.brum.beds.ac.uk/10.3390/su11061513
AMA Style
Zhao H, Li X, Jiang Y. Response of Nitrogen Losses to Excessive Nitrogen Fertilizer Application in Intensive Greenhouse Vegetable Production. Sustainability. 2019; 11(6):1513. https://0-doi-org.brum.beds.ac.uk/10.3390/su11061513
Chicago/Turabian StyleZhao, Hui, Xuyong Li, and Yan Jiang. 2019. "Response of Nitrogen Losses to Excessive Nitrogen Fertilizer Application in Intensive Greenhouse Vegetable Production" Sustainability 11, no. 6: 1513. https://0-doi-org.brum.beds.ac.uk/10.3390/su11061513
Note that from the first issue of 2016, this journal uses article numbers instead of page numbers. See further details here.