Article

Competitive Intelligence and Sustainable Competitive Advantage in the Hotel Industry

by
Gisela Casado Salguero
1,*,
Manuel Ángel Fernández Gámez
2,
Ignacio Aldeanueva Fernández
3 and
Daniel Ruíz Palomo
2
1
PhD Programm of Business and Economics, Campus El Ejido s/n 29071, University of Málaga, 29016 Málaga, Spain
2
Department of Finance and Accounting, Campus El Ejido s/n 29071, University of Málaga, 29016 Málaga, Spain
3
Department of Economics and Business Administration, Campus El Ejido s/n 29071, University of Málaga, 29016 Málaga, Spain
*
Author to whom correspondence should be addressed.
Sustainability 2019, 11(6), 1597; https://0-doi-org.brum.beds.ac.uk/10.3390/su11061597
Submission received: 17 February 2019 / Revised: 9 March 2019 / Accepted: 12 March 2019 / Published: 15 March 2019
(This article belongs to the Special Issue Sustainable Development in the Hotel Industry)

Abstract

:
Competitive intelligence (CI) is a business tool within strategic management, and it is gaining significance as a process that enables companies to achieve sustainable competitive advantage. This study explores the current state of CI in the Spanish hotel industry. For this purpose, a path model has been developed which empirically investigates the relationship between CI use and its backgrounds. The results obtained suggest that environmental and organizational characteristics affect CI effort, and in turn, CI effort affects CI use. This study provides theoretical and practical implications to help managers develop sustainable competitive advantages through the potential that CI offers within the hotel industry.

1. Introduction

Corporate sustainability has gained increased attention in recent years within the academic community [1]. The literature about corporate sustainability identifies three research areas: economic prosperity, environmental integrity, and social sustainability [2,3,4,5]. This paper focuses on economic prosperity, addressing the long-term competitiveness of the hotel industry. Strategic management is linked to the aforementioned economic dimension, as it aims to provide companies with sustainable competitive advantages [6,7].
In the field of strategic management, competitive intelligence (CI) practices are gaining importance both in practice and in research [8]. CI is a business tool that supports organizations with their strategic management and allows them to increase business performance through knowledge improvement, internal communications, and strategic quality plans [9]. CI is a process involving the discovery, analysis and use of information regarding an organizational environment and its conversion into knowledge on an ongoing basis [8,10]. In recent decades, the need for technological improvements, cost reduction, and the alignment of business strategy with the environment have enabled the expansion of CI [11,12,13]. CI helps organizations to detect new opportunities [14], to create value [15], and to improve performance [8]. In addition, due to CI being formally and systematically developed, managers are able to make better-informed decisions in relation to future events [12].
Sustainable competitive advantages are also important in the hospitality industry [16], whose survival depends on numerous factors [17]. These factors include CI [18,19,20,21], which can help organizations in any industry achieve the aforementioned sustainable competitive advantages [22]. However, the current literature about CI requires more extensive development in the context of the hotel industry, specifically regarding the use of robust statistical methods to test the effects and relationships of CI activities [16].
To cover the gap in the current literature, we aim to recognize the factors related to CI use in the hotel industry. For this purpose, we review the literature on CI and Propose a path model which we test using PLS (partial least squares), a variance-based structural equation modelling (SEM). The model shows how environmental characteristics such as competitor diversification, and organizational characteristics such as size, belonging to a group, star rating, and ISO certificate can have an impact on CI effort, and in turn, on the use of CI. The model postulates a causal chain in which factors earlier in the causal chain can affect those later in the chain. In this way, the present study contributes to the literature on the hotel industry in several aspects. Firstly, the study throws light on CI practice and the significance of its usage to build a sustainable competitive advantage. Secondly, it associates CI use to the factors related to its implementation. Finally, the paper provides results on CI obtained by robust statistical methods.
This paper continues as follows: After this introduction, the literature review and research hypotheses are presented. Then, the measures and sample characteristics are explained. Consecutively, results of the developed path model are detailed. Finally, conclusions and implications are provided.

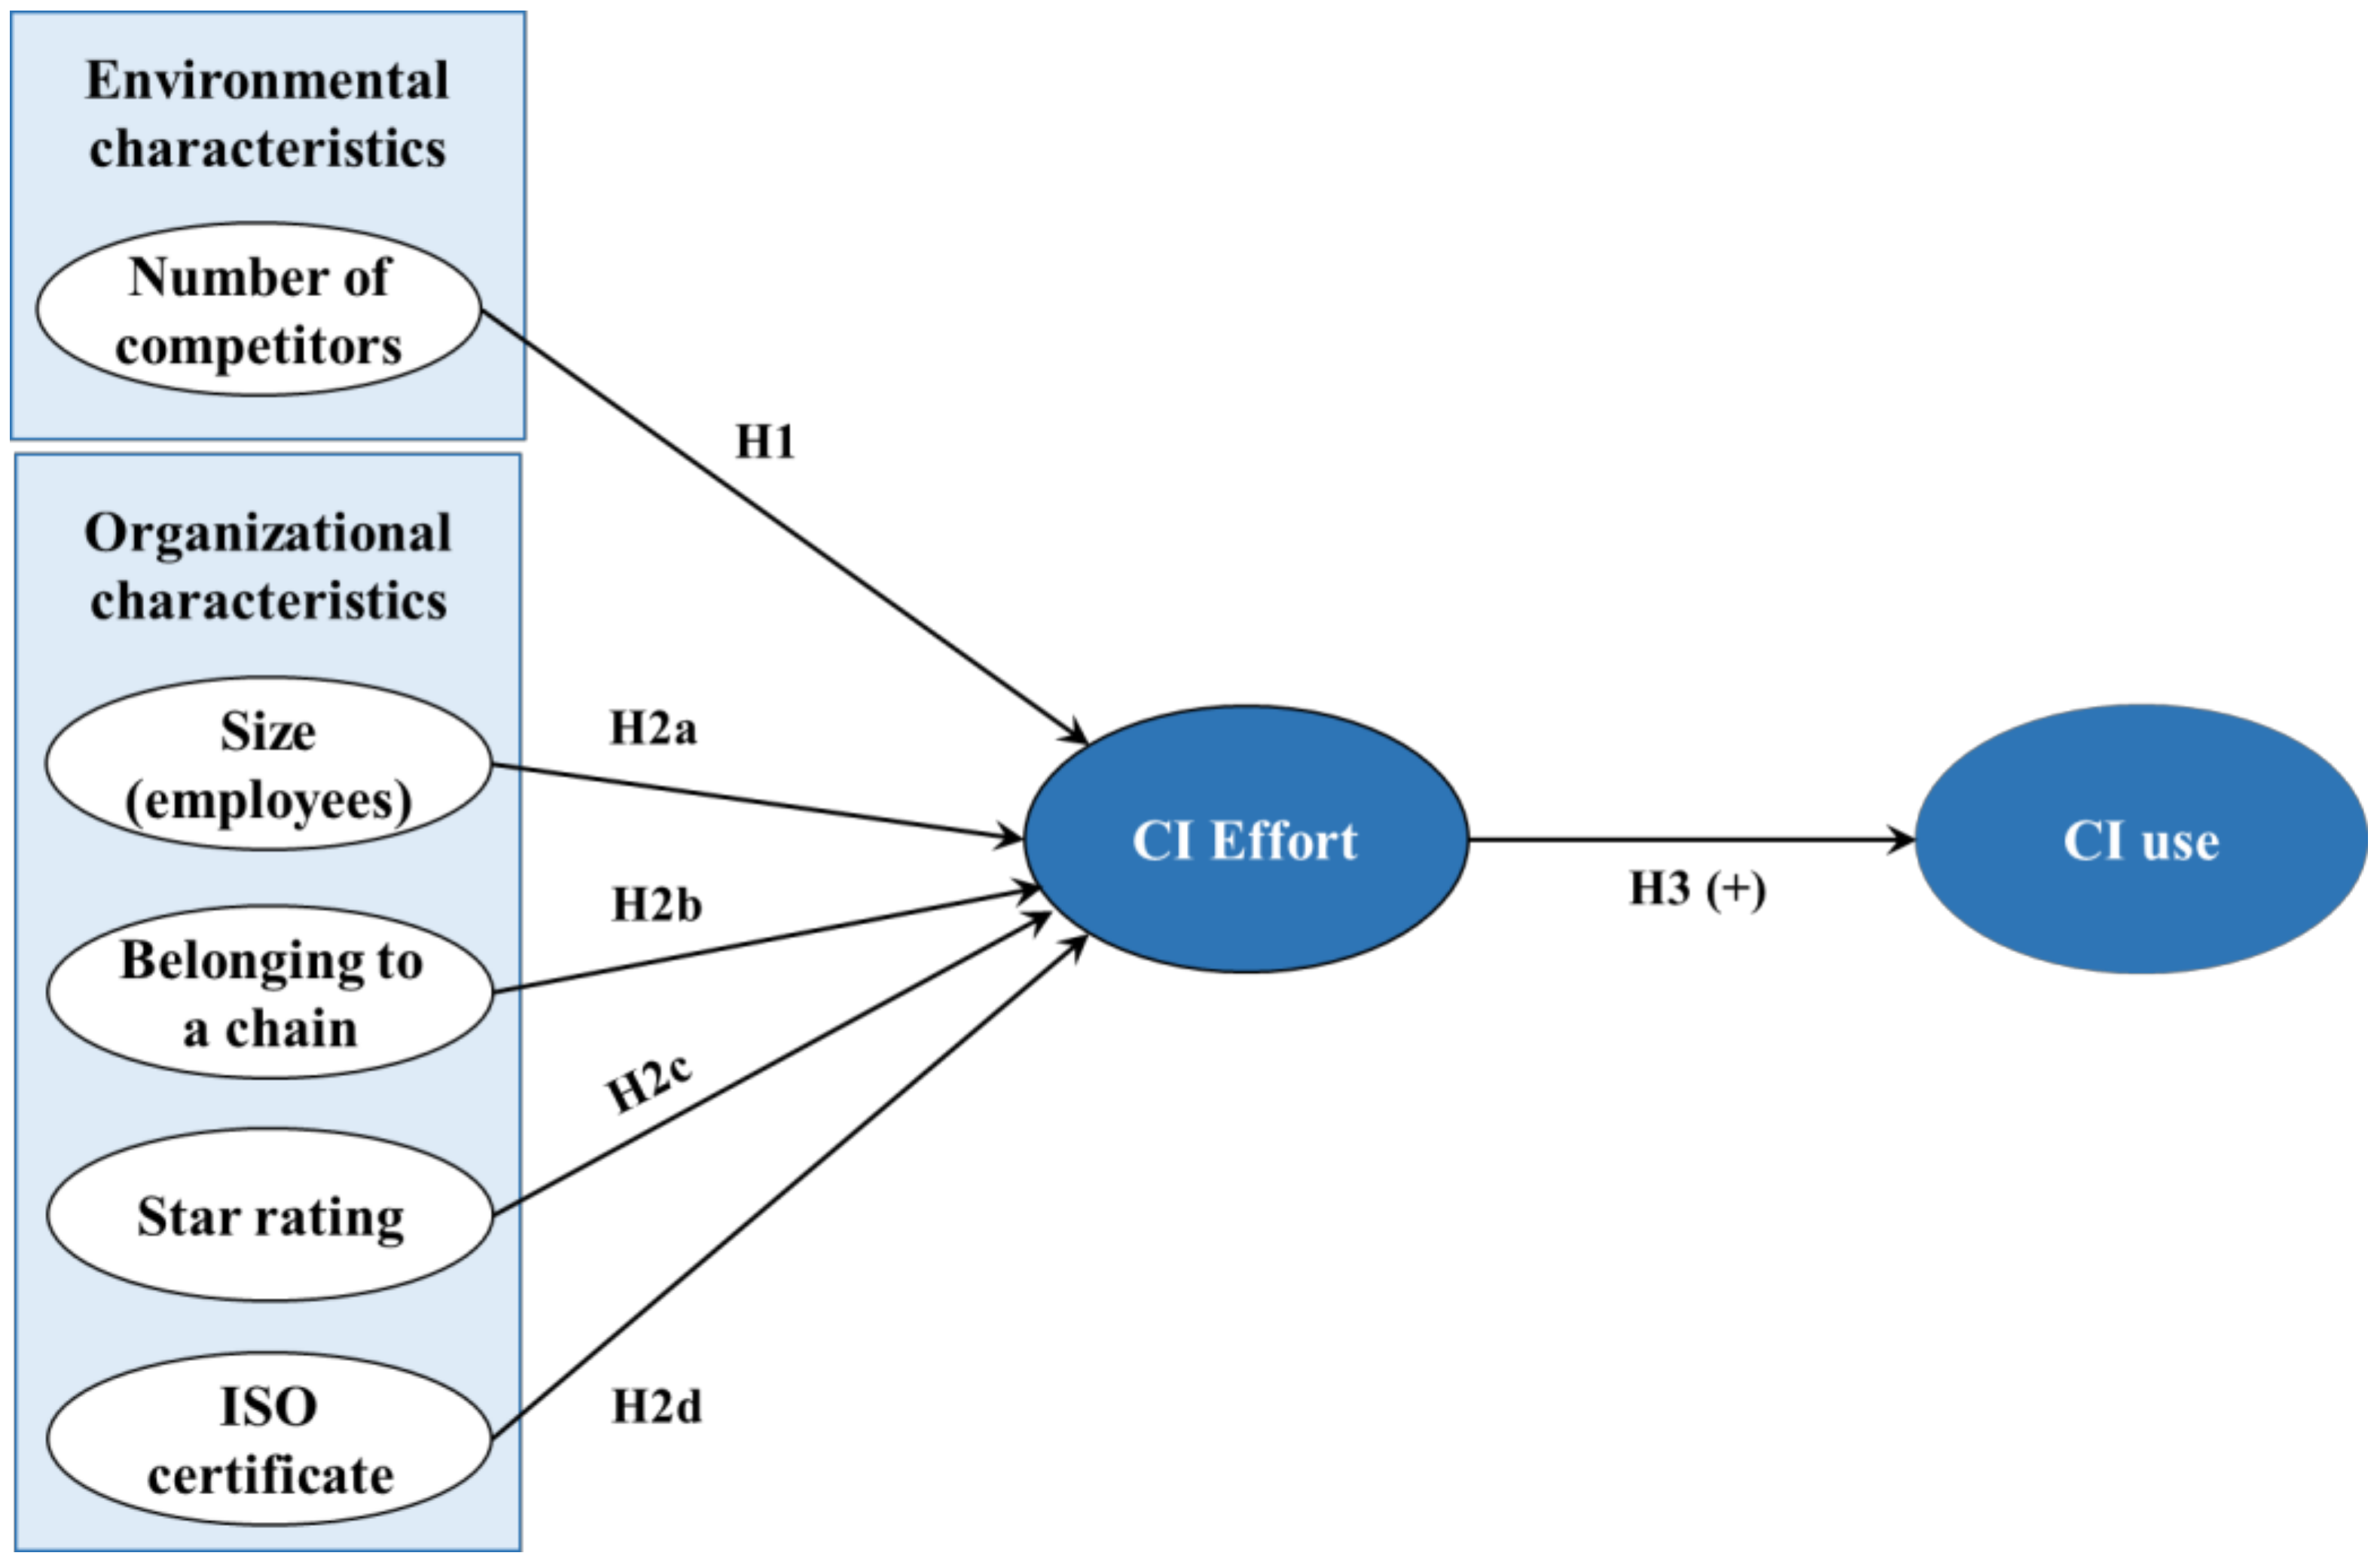
2. Literature Review and Hypotheses

In the field of strategic management, CI arises as an important practice since it enables a company to capture information from the organizational environment, which has been affected by the sustainability revolution [23]. CI allows managers to adapt their strategies to the fast-changing industry and understand competitive forces in order to grow sustainably [24,25].
Previous studies on CI in the hospitality industry have covered issues related to environmental scanning, competitor analysis, applied technologies, and CI use. Environmental scanning has shown a positive relationship with organizational performance and strategic planning [16,26,27,28,29,30]. On the other hand, studies about competitor analysis have shown that hotel managers focus on assessing a small set of competitors as they rely on limited resources [31,32], and that the factors taken into account are location, rates, service, quality, and distribution channels [33].
The studies that have addressed applied technologies found that text mining can be used both for CI in hotels [34] and for CI in restaurants [35]. These studies identify that strategic implementation of information technologies is a way to obtain sustainable competitive advantages in the hotel reservation process [36], and that CI activities are suitable in the hospitality industry [37]. Finally, CI use has been analyzed in American and Brazilian hotels, perceiving that hotel managers have a low level of awareness about CI, and therefore, further research is needed on CI use in this industry [16,18,19].
Although the existing knowledge about CI use is limited for hotel companies, there is an extensive knowledge about this issue in other industrial sectors [38]. CI use is related indirectly to the competitor diversification through the CI effort. Several studies found that the amount of competition was positively related to the amount and type of CI [38,39]. It has also been proved that a larger amount of competence affects the perception that managers have about CI [8]. Therefore, and considering the effects that environmental characteristics have on CI and specifically the number of competitors, we formulate the first of our research hypotheses for the hotel industry:
Hypothesis 1 (H1):
A larger number of competitor hotels is related to a larger effort to obtain CI.
Previous literature notes that compilation and CI use requires organizational resource allocation, such as personnel and funds for CI acquisition, and that the organizational size (e.g., number of employees) is an indicator of potential organizational resources [40]. Considering that hotels possess singular organizational characteristics [41] related to their star rating, belonging to a chain and quality certificates [20,42], we want to prove whether these organizational characteristics are associated with a greater effort to obtain CI. Thus, we formulate the second research hypothesis:
Hypothesis 2 (H2):
Hotels’ organizational characteristics are associated with a greater effort to obtain CI.
Due to the fact that there are multiple indicators that represent different organizational characteristics of the hotels, we formulate a separate set of sub-hypotheses for each factor of the organization characteristics:
Hypothesis 2a (H2a):
The effort to obtain CI is greater in hotels with a larger number of employees.
Hypothesis 2b (H2b):
The effort to obtain CI is greater in hotels that belong to a chain.
Hypothesis 2c (H2c):
The effort to obtain CI is greater in hotels with a higher star rating.
Hypothesis 2d (H2d):
The effort to obtain CI is greater in hotels with an ISO certificate (UNE 166006 of Technological Surveillance and Competitive Intelligence)
Resources allocation is an indication of management priorities, and managers who put more effort on CI also have more interest in CI, and are more likely to use it in the decision-making process [43]. Consequentially, we want to find out if for hotel companies there exists a relationship between CI effort and its use. Thus, we formulate our third hypothesis as follows:
Hypothesis 3 (H3):
The effort that hotels invest in obtaining CI is positively related to their CI use.
Figure 1 illustrates the conceptual model and the hypothesis in the current study.

3. Measures and Sample Characteristics

The constructs and items used in this study appear in Table 1, and have been obtained from previous literature about CI activities [8,16,18,20,21,38,40,42]. The environmental characteristic of competitor diversification was associated with the number of competitors that each hotel had in its city. Organizational characteristic was a construct on potential organizational resources, and has been associated with hotel size (number of employees), star rating, belonging to a group, and ISO certificate (UNE 166006 of Technological Surveillance and Competitive Intelligence). CI effort was associated with the sources of CI information that the hotels use (specialized press, networking, and big data). CI use was obtained through the degree of dissemination of CI within the organization and through the feedback delivered to the decision-makers.
The information about the number of competitors and the number of employees from the hotels in the sample was obtained from the SABI (The Iberian Balance Sheet Analysis System created by Bureau Van Dijk). This database provided accounting information for Spanish and Portuguese companies, obtained from the annual published accounts. Star rating, belonging to a group, and ISO certificate were obtained from Official Guide of Spanish Hotels [44]. Finally, all the items of CI effort and CI use were measured through a questionnaire sent to the hotels in the sample, using a 7-point Likert-type scale in which 1 means “zero use” and 7 “high use”. The questionnaire was sent via email, along with a cover letter, to the hotels included in the sample. Prior to sending the survey, the authors identified the person in charge of CI activities. Following another approach utilized in the literature [8], the questionnaire was sent to the CEO and we asked him to forward it to the person in charge of capturing and analyzing environmental information and decision-making.
The hotels in the sample were randomly selected from the list of operating Spanish hotels in 2017. The sample was stratified by region with a sample error of <2% (95% confidence interval). Out of the 320 questionnaires sent, we obtained 156 responses, from which 127 were finally used after incomplete questionnaires had been deleted. The response rate was similar to other CI surveys [8,45]. The questionnaires were mainly completed by the CEO and by the person in charge of the commercial department, as in other CI papers [16]. More than half of the hotels in the sample (59.05%) had less than 100 employees, and between 201 and 400 rooms (59.84%). Likewise, a 4-star rating is the most prevalent in the sample (58.27%), and 58.27% of the hotels belong to a group. The profile of the interviewees was characterized by university education and extensive experience in the industry (Table 2).

4. Results

4.1. Statistical Procedure

Our research model was tested using partial least squares (PLS), a variance-based structural equation modelling (SEM) [46]. PLS was particularly suitable to test the proposed theoretical model because it allowed simultaneous estimation of multiple relationships between latent constructs involving hierarchical variables and accounts for measurement error in the constructs [47]. PLS analyses are more flexible than covariance-based SEM in order to model both reflective and formative latent factors at the same time [48]. In addition, PLS-SEM simultaneously allows assessment of the reliability and validity of the measures of theoretical constructs (outer or measurement model) and the estimation of the relationships between these constructs (inner model) [49]. PLS-SEM is primarily intended for causal-predictive analysis, where the problems explored are complex and prior theoretical knowledge is scarce [50]. Consequently, PLS-SEM is an appropriate technique to use in a theory development situation such as this study [49,51]. Traditional PLS is preferable because the study uses second order models and does not have a sufficiently large data set (e.g., a sample size N > 300) [52]. This study uses SmartPLS 3.2.7 software.

4.2. Outer Model Validation

According to the research model (Figure 1), two reflective (mode A) composites configure the first step constructs that define CI effort as a formative composite. A two-step approach was conducted [47] because when the model defines the reflective first-order constructs and formative second-order construct, the two step approach works better than the repeated indicators approach [53]. Additionally, it is more useful if the researcher is mainly interested in higher-level estimates [48].
Each latent variable in the model was measured by multiple items and evaluated in terms of reliability, nomological validity, and composition weights [54]. While criteria such as Cronbach’s alpha, composite reliability, and average variance extracted are applied to evaluate reflective measures in lower order constructs, an internal consistency perspective is inappropriate for assessing formative ones [55,56], such as our higher order construct. In consequence, we assessed our formative measurement model by assessing VIF values for collinearity issues, as well as the significance and relevance of items [47]. Significances were obtained by a nonparametric (10,000) bootstrap procedure. Further, we assessed the predictive ability by using the blindfolding procedure in SmartPLS in order to check that cross-validated commonalities and redundancies Q2 were superior to 0 [57]. Reliability and convergent validity of measures are shown in Table 3. Most of the items load on their respective constructs were more than 0.71 [58]. However, there was one item with a loading of 0.57 that may have been acceptable [59] if its rejection did not improve the model fit [47] since this loading was above 0.4, and the differences between this loading and the other cross-loadings were more than 0.3 [60]. Moreover, all the reliability items exceeded their shortcuts values. Finally, in order to assess formative reliability, all the weights were significant and VIF values were below 3, suggesting that composite was well performed [47].
Discriminant validity was verified according to Fornell-Lacker and HTMT criteria [62] as shown in Table 4 (panel A), as well as cross-loadings criterion [51] (panel B).

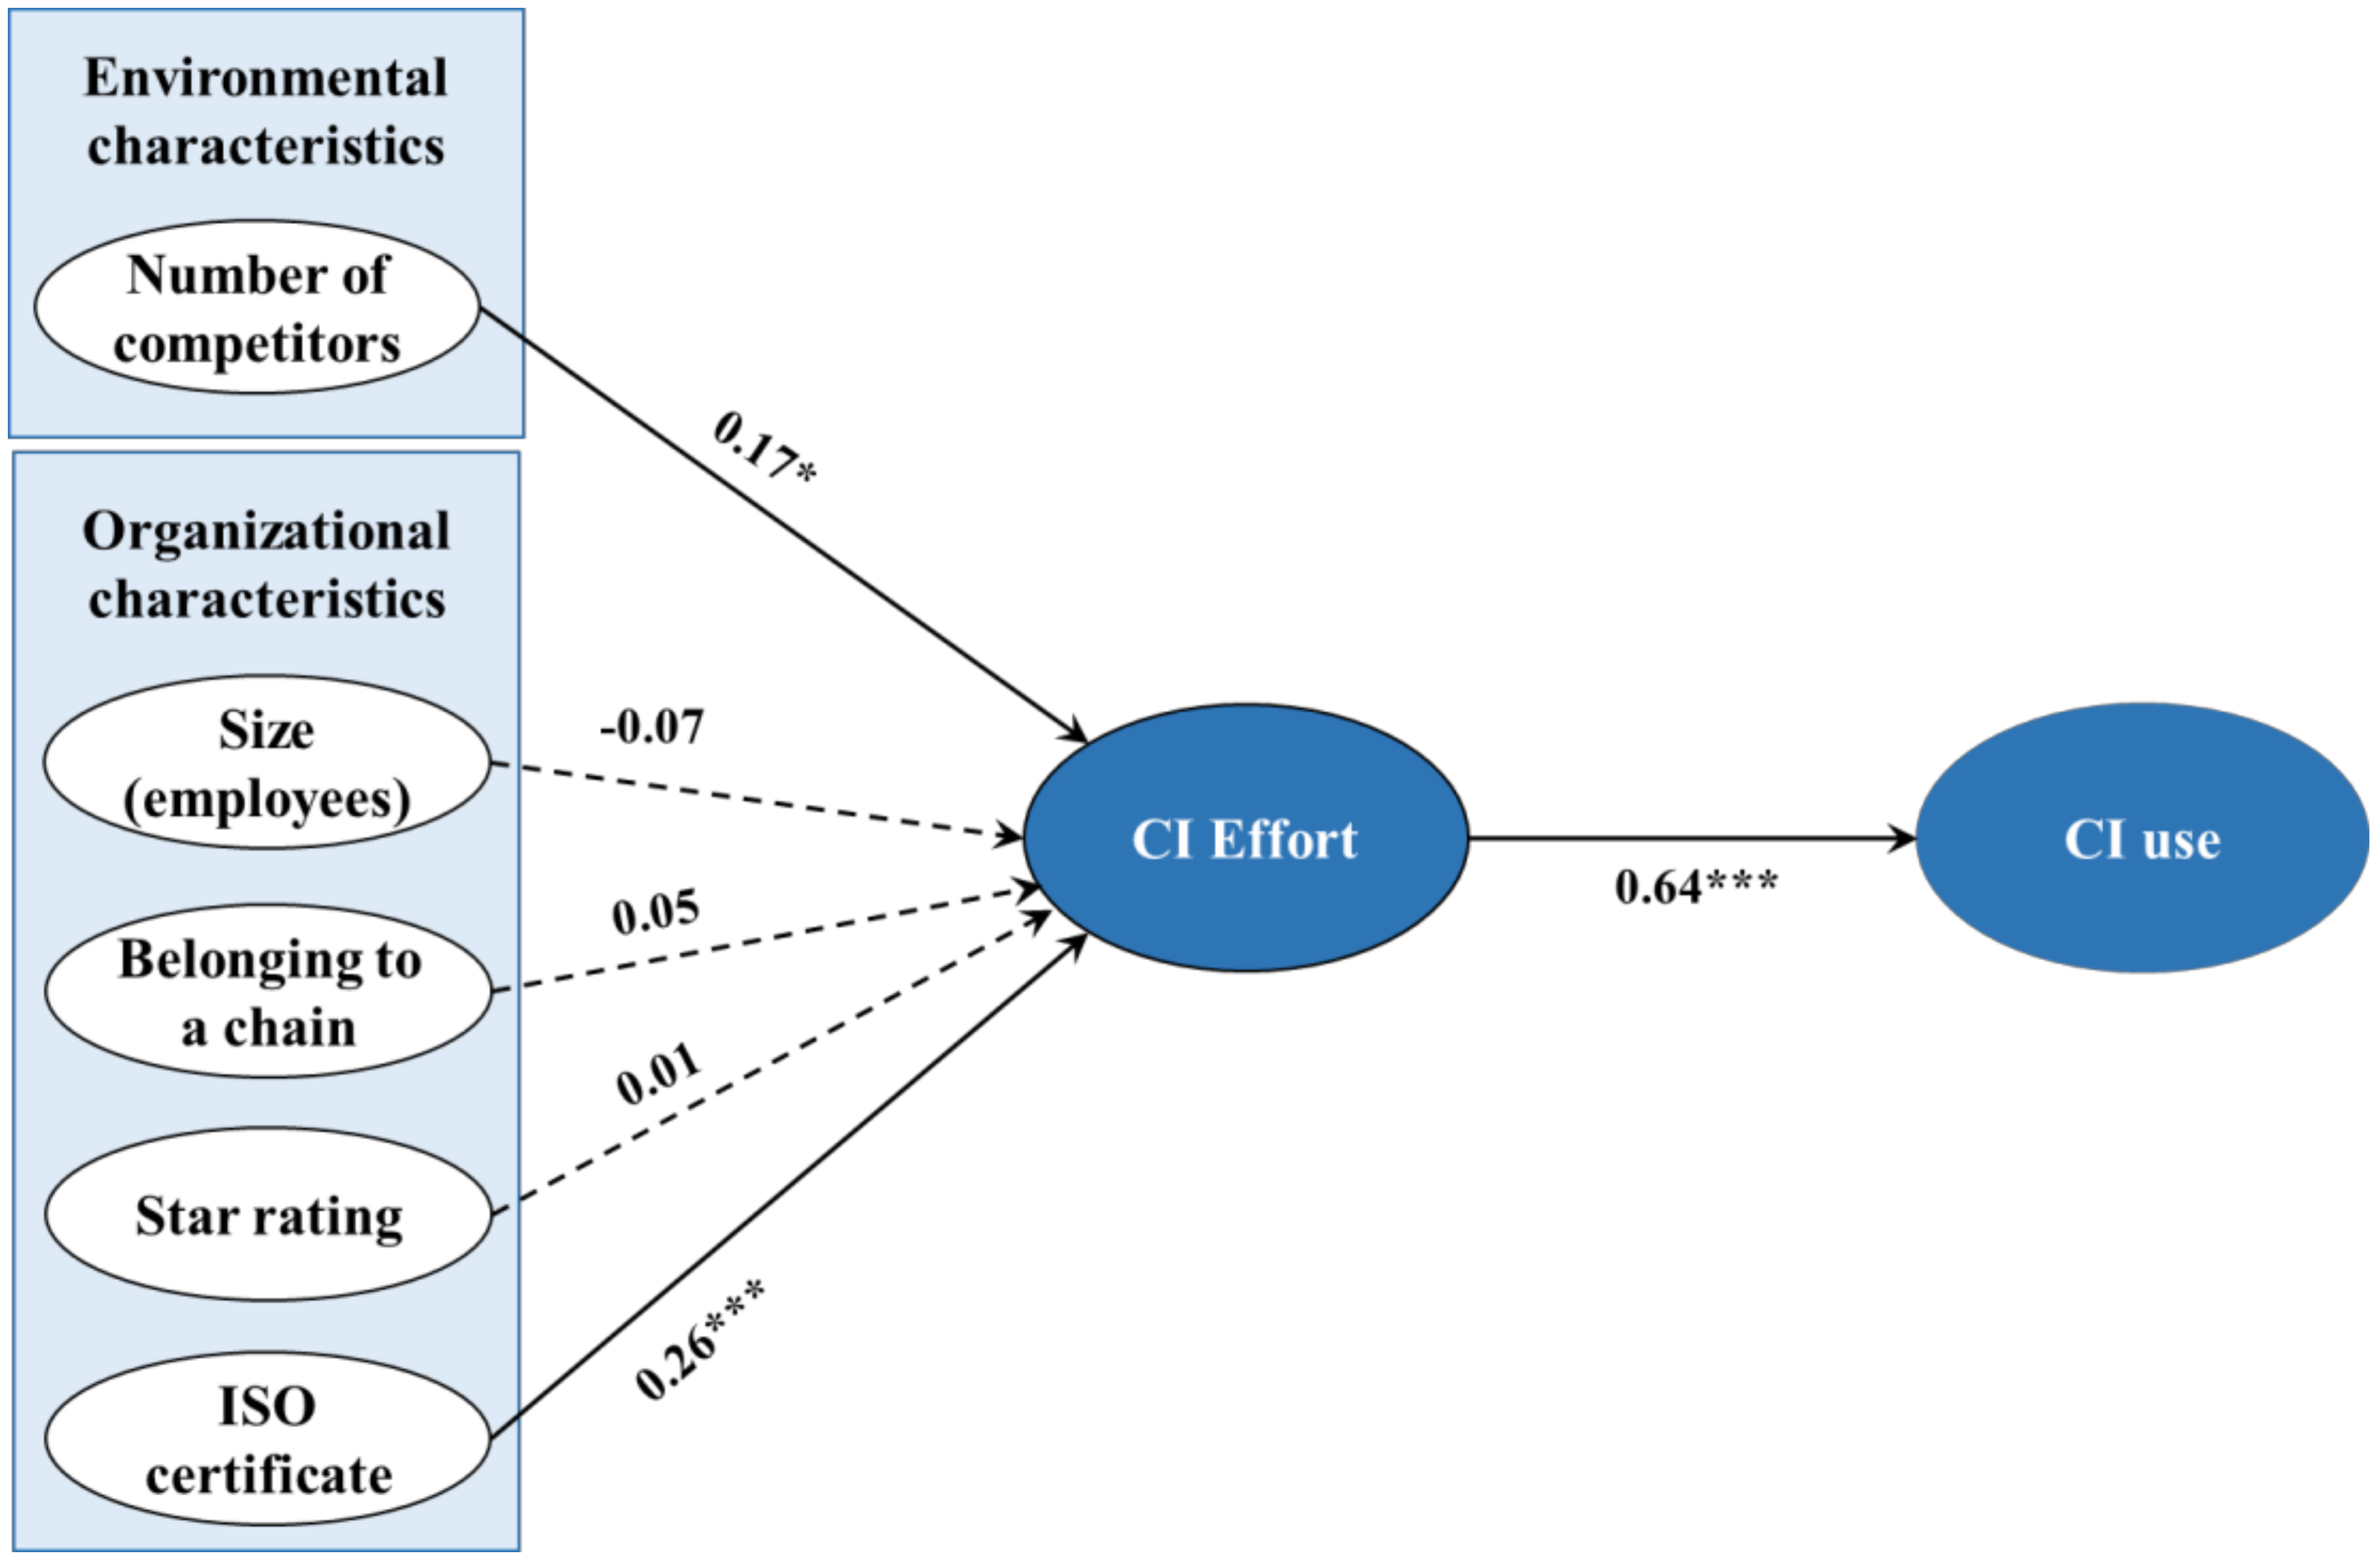
4.3. Structural Model

A blindfolding procedure (omission distance of 9) assessed the overall predictive relevance of the model as a first step in the quality assessment [55,63]. The analyses revealed cross-validated redundancies Stone–Geisser Q2 value of 0.05 for CI effort, and 0.21 for CI use. This finding provides support for the model’s overall predictive relevance, since the Q2 values were above 0 [63]. As a second quality assessment, this study assessed the standardized root mean square residual (SRMR). A value less than 0.08 reflected a good fit for SRMR [64,65]. Moreover, R2 were up to 0.10. Finally, RMStheta was 0.18, but its threshold values are yet to be determined [66]. These results suggest that environmental characteristics, and specifically a small number of competitors, are associated with a greater CI effort of the hotels (path = 0.17 *). Therefore, H1 hypothesis is accepted. The results also show that the organizational characteristic related with ISO certificate is associated with a greater CI effort of the hotels (path = 0.26 ***), so H2d hypothesis is accepted. Likewise, CI effort had a positive and significant impact on CI use (path = 0.64 ***), suggesting that H3 can also be accepted. Path coefficients and their bootstrapping significance levels are reported in Table 5 and Figure 2.

5. Conclusions and Implications

This paper analyzed CI use in the hotel industry, and how CI use is affected by organizational and environmental characteristics through CI effort. For our purpose, we employed a sample consisting of 127 Spanish hotels and developed a causal chain, which we tested through the methodology of PLS.
The results generally support the research hypothesis. Regarding our first hypothesis, which postulated that a growing number of competitors would generate a greater effort to obtain CI, our model proved that in fact CI effort increased in a more competitive environment. This was aligned with other researches [39], which exposed that the more intense the competition, the more likely that companies will embrace CI. This is important to take into account in a fast-changing industry where the number of hotels competing is increasing. In this context, CI use is beneficial as it could help hotel managers to better understand their organizational environment and thus be able to design the best strategies to adapt to it. Our second hypothesis, which specified that hotels’ organizational characteristics have an impact on the effort to obtain CI, was also verified. ISO certification does have an impact on CI use, identifying that achieving this certification was important for hotels willing to increase their CI use. However, as in previous studies [67,68], organizational size did not seem to have an impact on CI effort. This leads us to understand that CI use is independent from hotels’ size, and that this should not be an obstacle for smaller hotels when using CI for strategic management purposes. Likewise, our model showed that both star rating and belonging to a group does not have an impact on CI use. Finally, our third hypothesis, which postulated that CI effort was positively related to CI use, was accepted, showing that the CI effort that hotels made indeed had a positive impact on CI use.
For the purpose of academic research, this study contributed in numerous ways. First, this was the first study of its kind that empirically investigated the relationship between CI use and its backgrounds through an advanced statistical methodology. Second, this study increased the knowledge about CI practices in the hotel industry. Although we can find several researches about CI in hotels, to the best of our knowledge this is the first study done on the Spanish hotel industry.
From a managerial point of view, this paper could help managers to better understand CI practices and how to use these to obtain a sustainable competitive advantage. Although hotel managers cannot have a direct impact on the environmental characteristics (number of competitors), they can influence their organizational characteristics by putting in place the suitable mechanism to obtain the ISO certificate (UNE 166006 of Technological Surveillance and Competitive Intelligence).
By understanding the relationship between CI use and its backgrounds, hotel managers will be able to leverage their CI effort by evaluating their environmental and organizational characteristics. This effort will have a direct impact on CI use, which will aid in the achievement of a sustainable competitive advantage.
We have to acknowledge some limitations related to the cross-section method used when gathering data. As the competition in the industry increases, more and more hotels will either start CI activities or increase their use. Thus it would be advisable to work with longitudinal data and track the level of the CI activities over time.
In addition, it would be recommendable to analyses the impact that CI activities might have on the hotels’ performance, and thus reinforce the importance of these activities in the hospitality industry as a means to achieve a sustainable competitive advantage.
Despite this, we believe that the stated limitations do not weaken the relevance of this study and the findings give rise to new opportunities to undertake additional research in other tourism industries such as restaurants, travel agencies and cruise ships. This initiative could be a substantial area for future research, which could help to understand the use of CI in all tourism companies.

Author Contributions

This study has been designed and performed by all of the authors. G.C.S. and I.A.F. collected the data. D.R.P. and M.Á.F.G. analysed the data. The introduction, literature review and hypothesis were written by G.C.S., I.A.F. and M.Á.F.G. All of the authors wrote the conclusions and implications.

Funding

This research received no external funding.

Acknowledgments

In this section you can acknowledge any support given which is not covered by the author contribution or funding sections. This may include administrative and technical support, or donations in kind (e.g., materials used for experiments).

Conflicts of Interest

The authors declare no conflict of interest.

References

  1. Montiel, I.; Delgado, J. Defining and measuring corporate sustainability: Are we there yet? Organ. Environ. 2014, 27, 113–139. [Google Scholar] [CrossRef]
  2. Florea, L.; Cheung, Y.H.; Herndon, N.C. For all good reasons: Role of values in organizational sustainability. J. Bus. Ethics 2013, 114, 393–408. [Google Scholar] [CrossRef]
  3. Soto, P.; Cismaru, D.M.; Vătămănescu, E.M.; Ciochină, R.S. Sustainable entrepreneurship in SMEs: A business performance perspective. Sustainability 2016, 8, 342. [Google Scholar] [CrossRef]
  4. Misso, R.; Andreopoulou, Z.; Cesaretti, G.P.; Hanna, S.S.; Tzoulis, I. Sustainable development and green tourism: New practices for excellence in the digital era. J. Int. Bus. Entrep. Dev. 2018, 11, 65–74. [Google Scholar] [CrossRef]
  5. Steurer, R.; Langer, M.E.; Konrad, A.; Martinuzzi, A. Corporations, stakeholders and sustainable development I: A theoretical exploration of business-society relations. J. Bus. Ethics 2005, 61, 263–281. [Google Scholar] [CrossRef]
  6. Teece, D.J.; Pisano, G.; Shuen, A. Dynamic capabilities & strategic management. Strateg. Manag. J. 1997, 18, 509–533. [Google Scholar]
  7. Hill, C.W.L.; Jones, G.R. Strategic Management: An Integrated Approach, 9th ed.; South-Western Cengage Learning: Mason, OH, USA, 2009. [Google Scholar]
  8. Adidam, P.T.; Banerjee, M.; Shukla, P. Competitive intelligence and firm’s performance in emerging markets: An exploratory study in India. J. Bus. Ind. Mark. 2012, 27, 242–254. [Google Scholar] [CrossRef]
  9. Rezaie, H.; Ghandehari, F.; Amiri, F. Analyzing the impact of competitive intelligence on innovation at scientific research centers In Isfahan science and technology town. Interdiscip. J. Contemp. Res. Bus. 2011, 3, 939–947. [Google Scholar]
  10. Kim, Y.; Dwivedi, R.; Zhang, J.; Jeong, S.R. Competitive intelligence in social media Twitter: iPhone 6 vs. Galaxy S5. Online Inf. Rev. 2016, 40, 42–61. [Google Scholar] [CrossRef]
  11. Mollayaaghobi, S.S.; Badiee, F. A comparative study of competitive intelligence in public sector (case study: Iran auto industries). Interdiscip. J. Contemp. Res. Bus. 2011, 3, 525–535. [Google Scholar]
  12. Dishman, P.L.; Calof, J.L. Competitive intelligence: A multiphasic precedent to marketing strategy. Eur. J. Mark. 2008, 42, 766–785. [Google Scholar] [CrossRef]
  13. Fleisher, C.S. Competitive intelligence education: Competencies, sources, and trends. Inf. Manag. J. 2004, 38, 56–62. [Google Scholar]
  14. Rapp, A.; Agnihotri, R.; Baker, T.L.; Andzulis, J.M. Competitive intelligence collection and use by sales and service representatives: How managers’ recognition and autonomy moderate individual performance. J. Acad. Mark. Sci. 2015, 43, 357–374. [Google Scholar] [CrossRef]
  15. He, W.; Shen, J.; Tian, X.; Li, Y.; Akula, V.; Yan, G.; Tao, R. Gaining competitive intelligence from social media data: Evidence from two largest retail chains in the world. Ind. Manag. Data Syst. 2015, 115, 1622–1636. [Google Scholar] [CrossRef]
  16. Köseoglu, M.A.; Ross, G.; Okumus, F. Competitive intelligence practices in hotels. Int. J. Hosp. Manag. 2016, 53, 161–172. [Google Scholar] [CrossRef]
  17. Gémar, G.; Moniche, L.; Morales, A.J. Survival analysis of the Spanish hotel industry. Tour. Manag. 2016, 54, 428–438. [Google Scholar] [CrossRef]
  18. Faust, D.; Gadotti, S.J. La inteligencia competitiva aplicada a las redes hoteleras brasileñas. Estudios Y Perspectivas En Turismo 2011, 20, 478–498. [Google Scholar]
  19. Köseoglu, M.A.; Yazici, S.; Okumus, F. Barriers to the implementation of strategic decisions: Evidence from hotels in a developing country. J. Hosp. Mark. Manag. 2018, 27, 514–543. [Google Scholar] [CrossRef]
  20. Casado, G.; Jiménez, J.A. Competitive intelligence in the tourism sector, with special focus on Southern Europe. Tour. Manag. Stud. 2016, 12, 136–144. [Google Scholar] [CrossRef]
  21. Casado, G.; Resende, P.C.; Aldeanueva, I. Proposal of an assessment scale in competitive intelligence applied to the tourism sector. J. Intell. Stud. Bus. 2017, 7, 38–47. [Google Scholar]
  22. Agnihotri, R.; Rapp, A. Perspectives on competitive intelligence within business: A tactical tool for sales-people to gain a competitive advantage. Mark. Rev. 2011, 11, 363–380. [Google Scholar] [CrossRef]
  23. Burns, T.R. The sustainability revolution: A societal paradigm shift. Sustainability 2012, 4, 1118–1134. [Google Scholar] [CrossRef]
  24. Nasri, W. Competitive intelligence in Tunisian companies. J. Enterp. Inf. Manag. 2011, 24, 53–67. [Google Scholar] [CrossRef]
  25. Trong Tuan, L. Organizational social capital as a moderator for the effect of entrepreneurial orientation on competitive intelligence. J. Strateg. Mark. 2017, 25, 301–315. [Google Scholar] [CrossRef]
  26. Kasemsap, K. Hospitality and tourism management: Advanced issues and implications. Int. J. Tour. Hosp. Manag. Digit. Age 2018, 2, 1–16. [Google Scholar] [CrossRef]
  27. Tavitiyaman, P.; Zhang, H.Q.; Law, V.T.; Lin, P.M.C. Exploring the environmental scanning of the hotel industry in China. J. China Tour. Res. 2016, 12, 313–330. [Google Scholar] [CrossRef]
  28. Okumus, F. Potential challenges of employing a formal environmental scanning approach in hospitality organisations. Int. J. Hosp. Manag. 2004, 23, 123–143. [Google Scholar] [CrossRef]
  29. Kay, C. What do managers read? A survey of journals and periodicals used by lodging managers in the hospitality industry. J. Hosp. Tour. Educ. 2001, 13, 76–86. [Google Scholar] [CrossRef]
  30. Wu, A.; Costa, J.; Teare, R. Using environmental scanning for business expansion into China and Eastern Europe: The case of transnational hotel companies. Int. J. Contemp. Hosp. Manag. 1998, 10, 257–263. [Google Scholar] [CrossRef]
  31. Li, J.; Netessine, S. Who Are My Competitors? Let the Customer Decide; INSEAD Working Paper: Fontainebleau, France, 2012. [Google Scholar]
  32. Bergen, M.; Peteraf, M.A. Competitor identification and competitor analysis: A broad-based managerial approach. Manag. Decis. Econ. 2002, 23, 157–169. [Google Scholar] [CrossRef]
  33. Mohammed, I.; Guillet, B.D.; Law, R. Competitor set identification in the hotel industry: A case study of a full-service hotel in Hong Kong. Int. J. Hosp. Manag. 2014, 39, 29–40. [Google Scholar] [CrossRef]
  34. Lau, K.N.; Lee, K.H.; Ho, Y. Text mining for the hotel industry. Cornell Hotel Restaur. Adm. Q. 2005, 46, 344–362. [Google Scholar] [CrossRef]
  35. He, W.; Zha, S.; Li, L. Social media competitive analysis and text mining: A case study in the pizza industry. Int. J. Inf. Manag. 2013, 33, 464–472. [Google Scholar] [CrossRef]
  36. Sigala, M.; Lockwood, A.; Jones, P. Strategic implementation and IT: Gaining competitive advantage from the hotel reservations process. Int. J. Contemp. Hosp. Manag. 2001, 13, 364–371. [Google Scholar] [CrossRef]
  37. Korte, D.; Ariyachandra, T.; Frolick, M. Business intelligence in the hospitality industry. Int. J. Innov. Manag. Technol. 2013, 4, 429–434. [Google Scholar] [CrossRef]
  38. Zinkhan, G.M.; Gelb, B.D. Competitive intelligence practices of industrial marketers. Ind. Mark. Manag. 1985, 14, 269–275. [Google Scholar] [CrossRef]
  39. Oubrich, M.; Hakmaoui, A.; Bierwolf, R.; Haddani, M. Development of a competitive intelligence maturity model: Insights from Moroccan companies. J. Intell. Stud. Bus. 2018, 8, 25–36. [Google Scholar]
  40. Peyrot, M.; Childs, N.; Van Doren, D.; Allen, K. An empirically based model of competitor intelligence use. J. Bus. Res. 2002, 55, 747–758. [Google Scholar] [CrossRef]
  41. Evans, N.G. Sustainable competitive advantage in tourism organisations: A strategic model applying service dominant logic and tourism’s defining characteristics. Tour. Manag. Perspect. 2016, 18, 14–25. [Google Scholar] [CrossRef]
  42. Fernández, M.A.; Becerra, R. An analysis of Spanish hotel efficiency. Cornell Hosp. Q. 2015, 56, 248–257. [Google Scholar] [CrossRef]
  43. Hambrick, D.C. Environmental scanning and organisational strategy. Strateg. Manag. J. 1982, 3, 159–174. [Google Scholar] [CrossRef]
  44. Turespaña. Official Guide of Spanish Hotels; Turespaña: Madrid, Spain, 2017. [Google Scholar]
  45. Wright, S.; Pickton, D.W.; Callow, J. Competitive intelligence in UK firms: A typology. Mark. Intell. Plan. 2002, 20, 349–360. [Google Scholar] [CrossRef]
  46. Reinartz, W.; Haenlein, M.; Henseler, J. An empirical comparison of the efficacy of covariance-based and variance-based SEM. Int. J. Res. Mark. 2009, 26, 332–344. [Google Scholar] [CrossRef] [Green Version]
  47. Hair, J.F.; Hult, G.T.M.; Ringle, C.M.; Sarstedt, M. A Primer on Partial Least Squares Structural Equation Modeling (PLS-SEM), 2nd ed.; Sage Publications: Thousand Oaks, CA, USA, 2017. [Google Scholar]
  48. Becker, J.M.; Klein, K.; Wetzels, M. Hierarchical latent variable models in PLS-SEM: Guidelines for using reflective-formative type models. Long Range Plan. 2012, 45, 359–394. [Google Scholar] [CrossRef]
  49. Castro, I.; Roldán, J.L. A mediation model between dimensions of social capital. Int. Bus. Rev. 2013, 22, 1034–1050. [Google Scholar] [CrossRef]
  50. Wold, H. Systems Analysis by Partial Least Squares. In Measuring the Unmeasurable; Nijkamp, P., Leitner, H., Wrigley, N., Eds.; Martinus Nijhoff Publishers: Dordrecht, The Netherlands, 1985; pp. 221–251. [Google Scholar] [Green Version]
  51. Chin, W.W. How to Write Up and Report PLS Analyses. In Handbook of Partial Least Squares: Concepts, Methods and Applications; Esposito, V., Chin, W.W., Henseler, J., Wang, H., Eds.; Springer: Berlin, Germany, 2010; pp. 655–690. [Google Scholar]
  52. Segarra, J.R.; Moliner, M.A. Customer equity and CLV in Spanish telecommunication services. J. Bus. Res. 2016, 69, 4694–4705. [Google Scholar] [CrossRef] [Green Version]
  53. Cataldo, R.; Grassia, M.R.; Lauro, N.C.; Marino, M. Developments in higher-order PLS-PM for the building of a system of composite indicators. Qual. Quant. 2017, 51, 657–674. [Google Scholar] [CrossRef]
  54. Henseler, J. Adanco 2.0.1: User Manual; Composite Modeling GmbH & Co: Kleve, Germany, 2017. [Google Scholar]
  55. Hair, J.F.; Sarstedt, M.; Ringle, C.M.; Mena, J.A. An assessment of the use of partial least squares structural equation modeling in marketing research. J. Acad. Mark. Sci. 2012, 40, 414–433. [Google Scholar] [CrossRef]
  56. Diamantopoulos, A. The error term in formative measurement models: Interpretation and modeling implications. J. Model. Manag. 2006, 1, 7–17. [Google Scholar] [CrossRef]
  57. Tenenhaus, M.; Esposito, V.; Chatelin, Y.M.; Lauro, C. PLS path modeling. Comput. Stat. Data Anal. 2005, 48, 159–205. [Google Scholar] [CrossRef]
  58. Carmines, E.G.; Zeller, R.A. Reliability and Validity Assessment; Sage Publications: Beverly Hills, CA, USA, 1979. [Google Scholar]
  59. Barclay, D.W.; Higgins, C.; Thompson, R. The Partial Least Squares (PLS) approach to causal modeling, personal computer adoption and use as an illustration. J. Technol. Stud. 1995, 2, 285–309. [Google Scholar]
  60. Howell, J.M.; Shea, C.M.; Higgins, C.A. Champions of product innovations: Defining, developing, and validating a measure of champion behaviour. J. Bus. Ventur. 2005, 20, 641–661. [Google Scholar] [CrossRef]
  61. Dijkstra, T.K.; Henseler, J. Consistent partial least squares path modeling. MIS Q. 2015, 39, 297–316. [Google Scholar] [CrossRef]
  62. Henseler, J.; Ringle, C.M.; Sarstedt, M. A new criterion for assessing discriminant validity in variance-based structural equation modelling. J. Acad. Mark. Sci. 2015, 43, 115–135. [Google Scholar] [CrossRef]
  63. Henseler, J.; Ringle, C.M.; Sinkovics, R.R. The Use of Partial Least Squares Path Modeling in International Marketing. In New Challenges to International Marketing: Advances in International Marketing; Sinkovics, R.R., Ghauri, P.N., Eds.; Group Publising Limited: Bingley, UK, 2009; pp. 277–319. [Google Scholar]
  64. Henseler, J.; Dijkstra, T.K.; Sarstedt, M.; Ringle, C.M.; Diamantopoulos, A.; Straub, D.W.; Ketchen, D.J.; Hair, J.F.; Hult, G.T.M.; Calantone, R.J. Common beliefs and reality about PLS: Comments on Rönkkö and Evermann (2013). Organ. Res. Methods 2014, 17, 182–209. [Google Scholar] [CrossRef]
  65. Hu, L.T.; Bentler, P.M. Fit indices in covariance structure modeling: Sensitivity to underparameterized model misspecification. Psychol. Methods 1998, 3, 424–453. [Google Scholar] [CrossRef]
  66. Henseler, J.; Hubona, G.; Ray, P.A. Using PLS path modeling in new technology research: Updated guidelines. Ind. Manag. Data Syst. 2016, 116, 2–20. [Google Scholar] [CrossRef]
  67. Priporas, C.V.; Gatsoris, L.; Zacharis, V. Competitive intelligence activity: Evidence from Greece. Mark. Intell. Plan. 2005, 23, 659–669. [Google Scholar] [CrossRef]
  68. Bisson, C.; Tang Tong, M.M. Investigating the competitive intelligence practices of Peruvian fresh grapes exporters. J. Intell. Stud. Bus. 2018, 8, 43–61. [Google Scholar]
Figure 1. Research model of CI use in hotel industry.
Sustainability 11 01597 g001
Figure 2. Results.
Figure 2. Results.
Sustainability 11 01597 g002
Table 1. Constructs and scale items.
Construct/IndicatorCodeScale ItemsSource
Environmental characteristics
Competitor diversificationECHNumber of competitors[38]
Organizational characteristics
SizeOCH1Number of employees[20,40,42]
Star ratingOCH21, 2, 3, 4, 5 (regional classification)
Belonging to a groupOCH31: Belonging to a group; 0: Otherwise
ISO certificateOCH41: Hotel with UNE 166006; 0: Otherwise
CI effort
Specialized pressEFF17-point Likert-type scale[8,16,18,21]
NetworkingEFF27-point Likert-type scale
Big dataEFF37-point Likert-type scale
Use of CI
Written reportsUSE17-point Likert-type scale[8]
MeetingsUSE27-point Likert-type scale
Oral reportsUSE37-point Likert-type scale
Feedback of the informationUSE47-point Likert-type scale
Table 2. Sample hotels´ characteristics and interviewees profile.
PercentageFrequency
Number of Employees
Less than 10059.0575
101–20018.1123
More than 20022.8429
Number of Rooms
Less than 20023.6230
201–40059.8476
More than 40016.5421
Star Rating
11.572
23.945
324.4131
458.2774
511.8115
Belonging to a Group
Yes58.2774
No41.7353
ISO Certificate
Yes19.6925
No80.31102
Education Profile of the Interviewees
Primary5.517
Secondary5.517
University61.4278
Postgraduate27.5635
Experience Years of the Interviewees
Less than 1233.8643
13–2443.3155
More than 2422.8329
Table 3. Convergent validity and reliability of measures.
LoadingsWeightsQ2VIFαρAρCAVE
CI useUSE10.740.340.231.400.710.740.820.53
USE20.780.400.261.40
USE30.570.210.071.20
USE40.810.390.281.55
CI effortEFF10.810.470.061.330.720.730.840.64
EFF20.740.330.001.41
EFF30.840.450.081.55
Q2: Cross-validated redundancies Stone–Geisser Q2 index (omission distance of 9). α: Cronbach’s alpha. ρA: [61] Rho; ρC: Composite reliability. AVE: Average variance extracted. All the loadings and weights are significant at p > 0.01 level from 10,000 repetitions bootstrapping procedure.
Table 4. Discriminant validity.
PANEL A: Fornell-Lacker and HTMT criteria1234567
1CI use0.730.820.110.130.180.220.10
2CI effort0.610.800.220.070.140.310.06
3ECH0.080.191.000.200.270.090.19
4OCH20.100.060.201.000.070.070.13
5OCH30.100.080.270.071.000.010.22
6OCH40.140.270.090.07−0.011.000.03
7OCH10.04−0.030.190.130.22−0.031.00
PANEL B: Cross-Loadings criterion1234567
USE10.740.480.100.070.180.190.12
USE20.780.510.130.020.09−0.040.06
USE30.570.26−0.020.11−0.110.16−0.02
U SE40.810.50−0.010.120.070.15−0.04
EFF10.540.810.150.110.050.24−0.09
EFF20.410.740.10−0.02−0.060.140.01
EFF30.500.840.200.020.170.250.03
ECH0.080.191.000.200.270.090.19
OCH20.100.050.201.000.070.060.13
OCH30.100.080.270.071.00−0.010.22
OCH40.140.270.090.06−0.011.00−0.03
OCH10.04−0.030.190.130.22−0.031.00
PANEL A: HTMT criterion results over the diagonal. Threshold: 0.90. Fornell-Lacker criterion: Construct correlations below the diagonal. Squared-root of AVE in the diagonal. Threshold: Squared-root of AVE must be higher than correlations. PANEL B: Loadings and cross-loadings of items on latent variables.
Table 5. Inner model results and validation criteria.
PathtLo95Hi95f2VIF
Background
Environmental characteristics → CI effort0.17 *1.73−0.020.360.031.14
Star rating → CI effort0.010.10−0.220.210.001.05
Belonging to a group → CI effort0.050.41−0.240.260.001.12
ISO Quality certified → CI effort0.26 ***3.690.100.380.071.01
Size → CI effort−0.070.51−0.390.050.011.08
R2/Adjusted R2/Q20.110.05 0.05
Direct effects on CI use
CI effort → CI use0.64 ***6.540.370.780.761.01
R2/Adjusted R2/Q20.470.45 0.21
Original path values, as well as 10,000 rep; bootstrapping standard deviations and 95% bias-corrected confidence intervals reported; q2: PLS-predict q2 index; Q2: Cross-validated redundancies Stone–Geisser Q2 index; *: p < 0.05; ***: p < 0.001. Overall validation criteria: RMSϴ = 0.18. Saturated/estimated model SRMR: 0.07/0.08. Saturated/estimated model χ2: 69.04/75.71.

