The Production–Living–Ecological Land Classification System and Its Characteristics in the Hilly Area of Sichuan Province, Southwest China Based on Identification of the Main Functions

Abstract
:1. Introduction
2. Materials and Methods
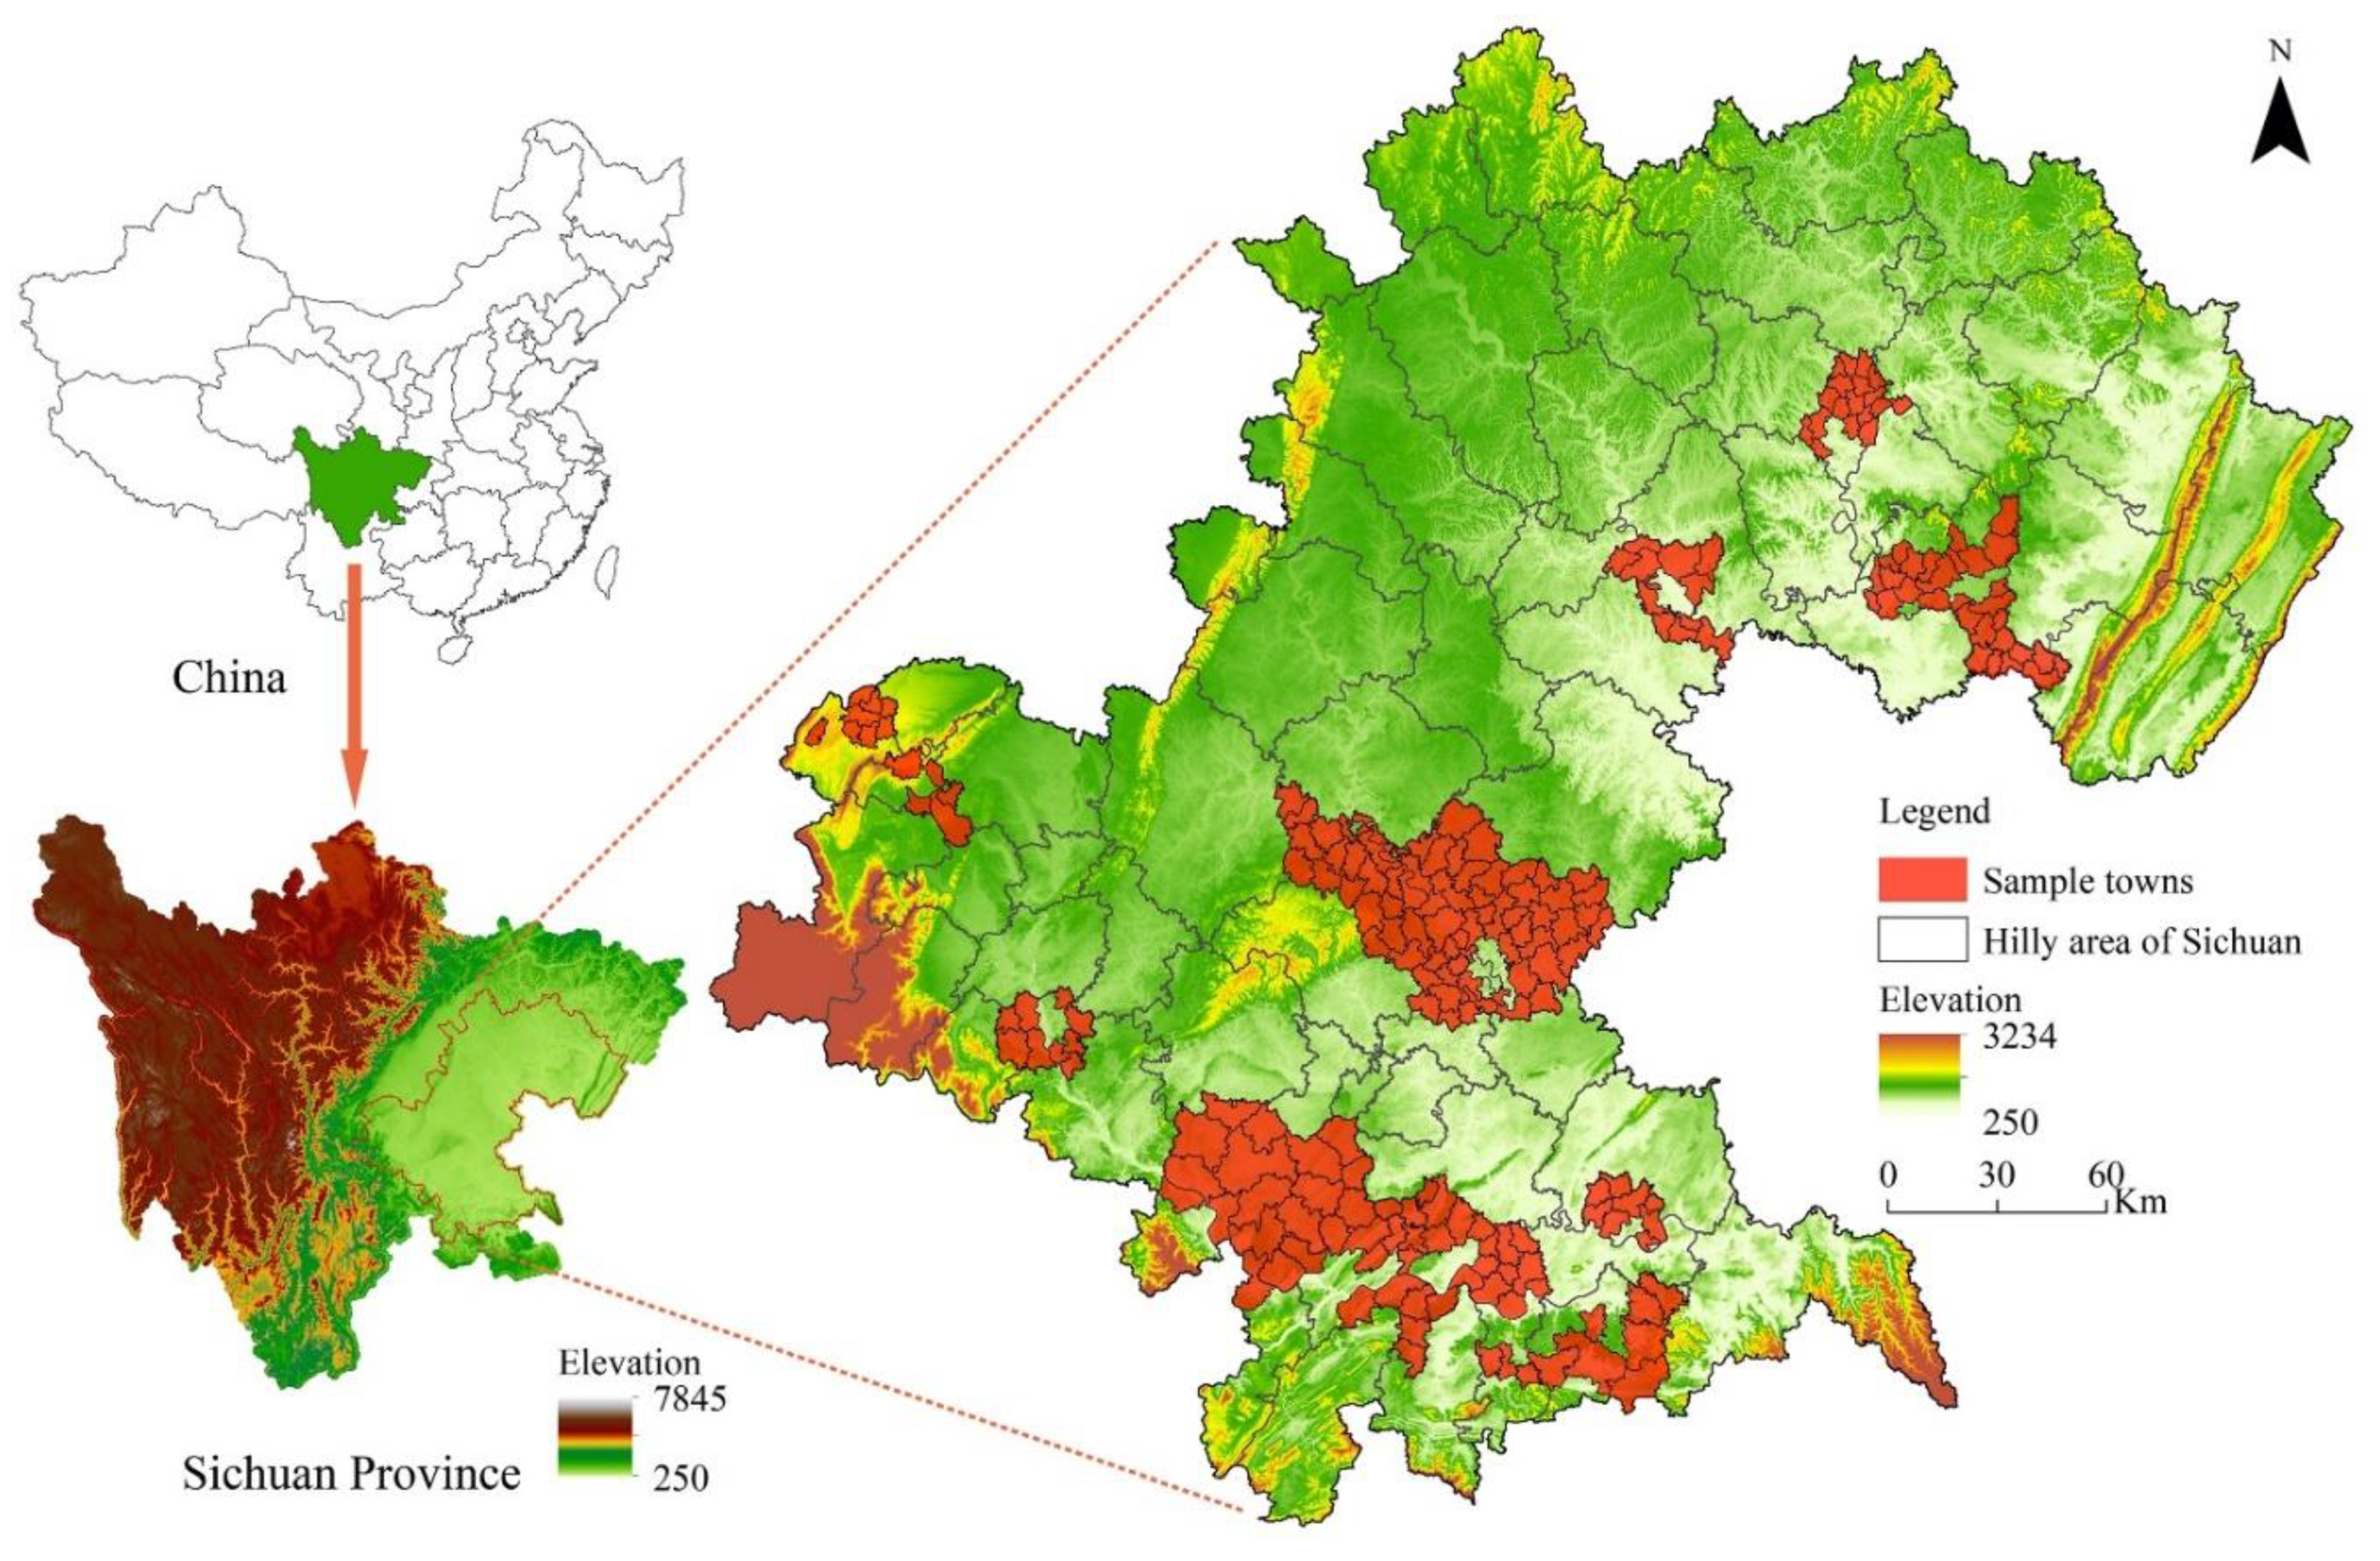
2.1. Study Area
2.2. Data Sources
2.3. Classification and Identification of Production–Living–Ecological Functions (PLEF)
2.3.1. Classification System of PLEF
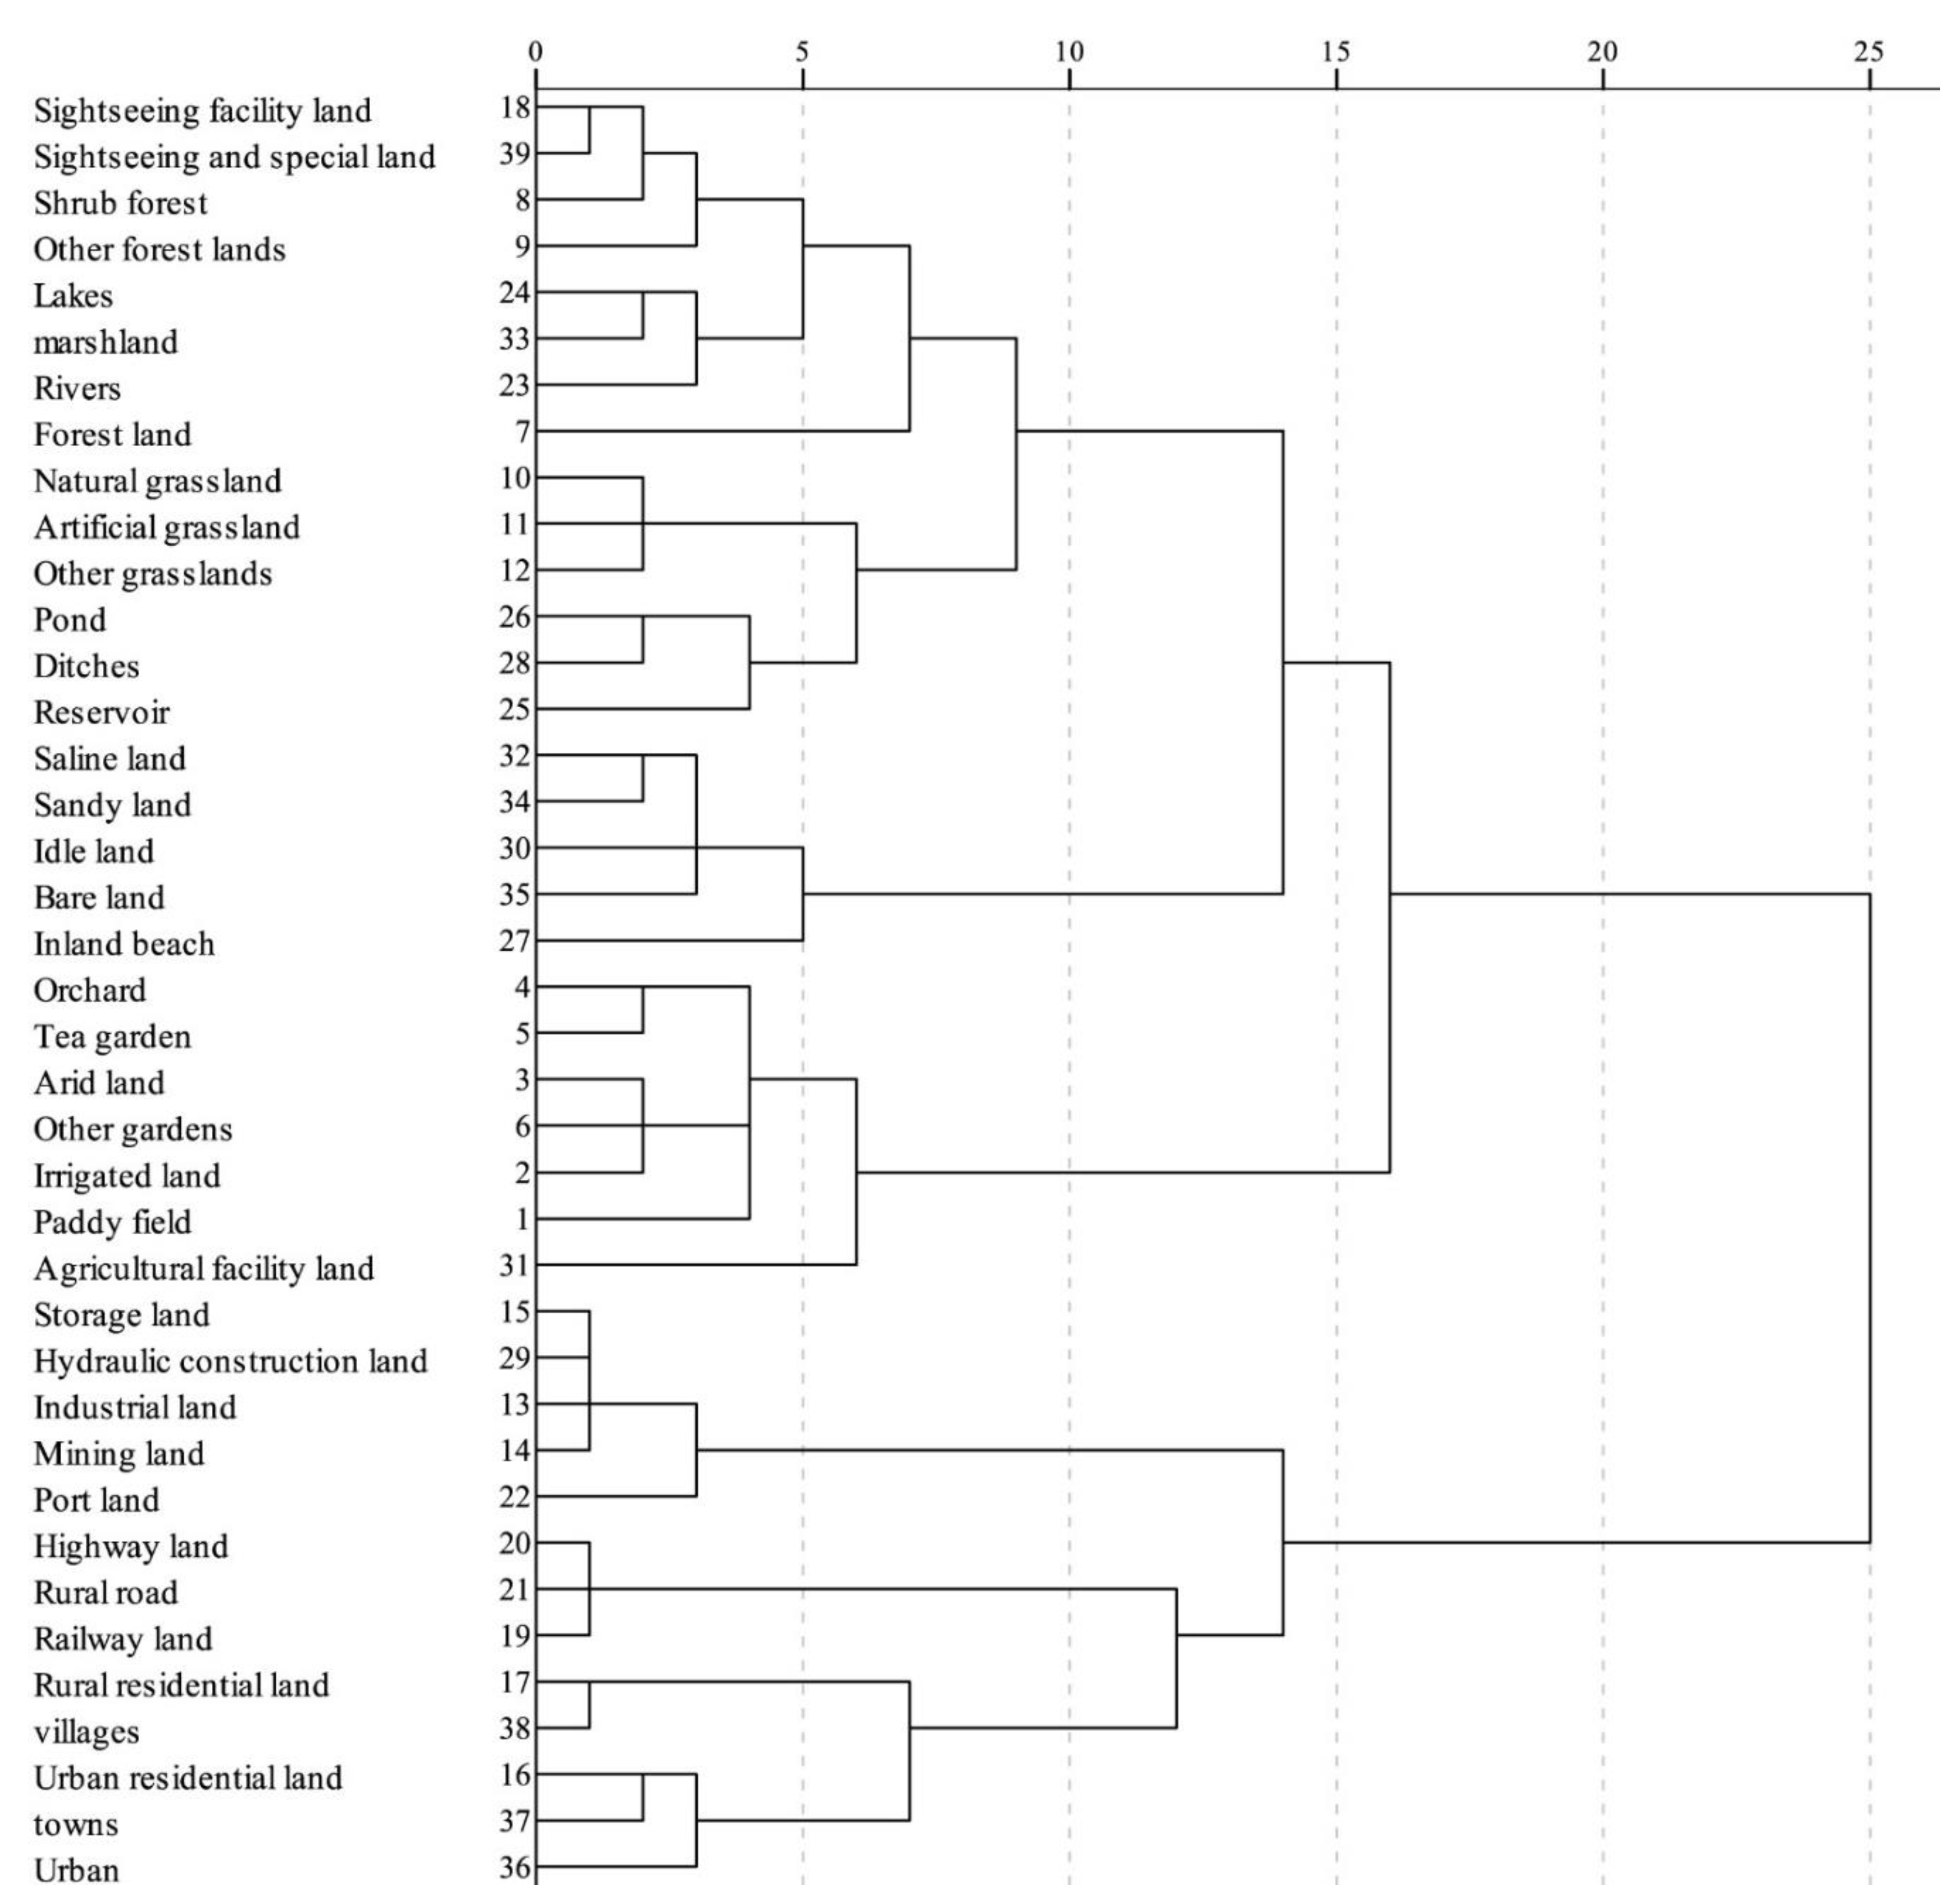
2.3.2. Main Functions Identification of PLEF
2.4. Characteristics of Production–Living–Ecological Land (PLEL)
2.4.1. Calculation of Landscape Metrics
2.4.2. Analysis of Landform Elements
2.4.3. Functional Index Model of PLEL
2.5. Pearson Correlation Coefficient
3. Results and Analysis
3.1. Classification System of Production–Living–Ecological Land (PLEL)
3.2. Analysis of PLEL Distribution Characteristics
3.2.1. Quantitative Structure Characteristics of PLEL
3.2.2. Space Distribution Characteristics of PLEL
3.2.3. Functional Characteristics of PLEL
3.3. Analysis of PLEL Impact Factors
4. Conclusions
- (1)
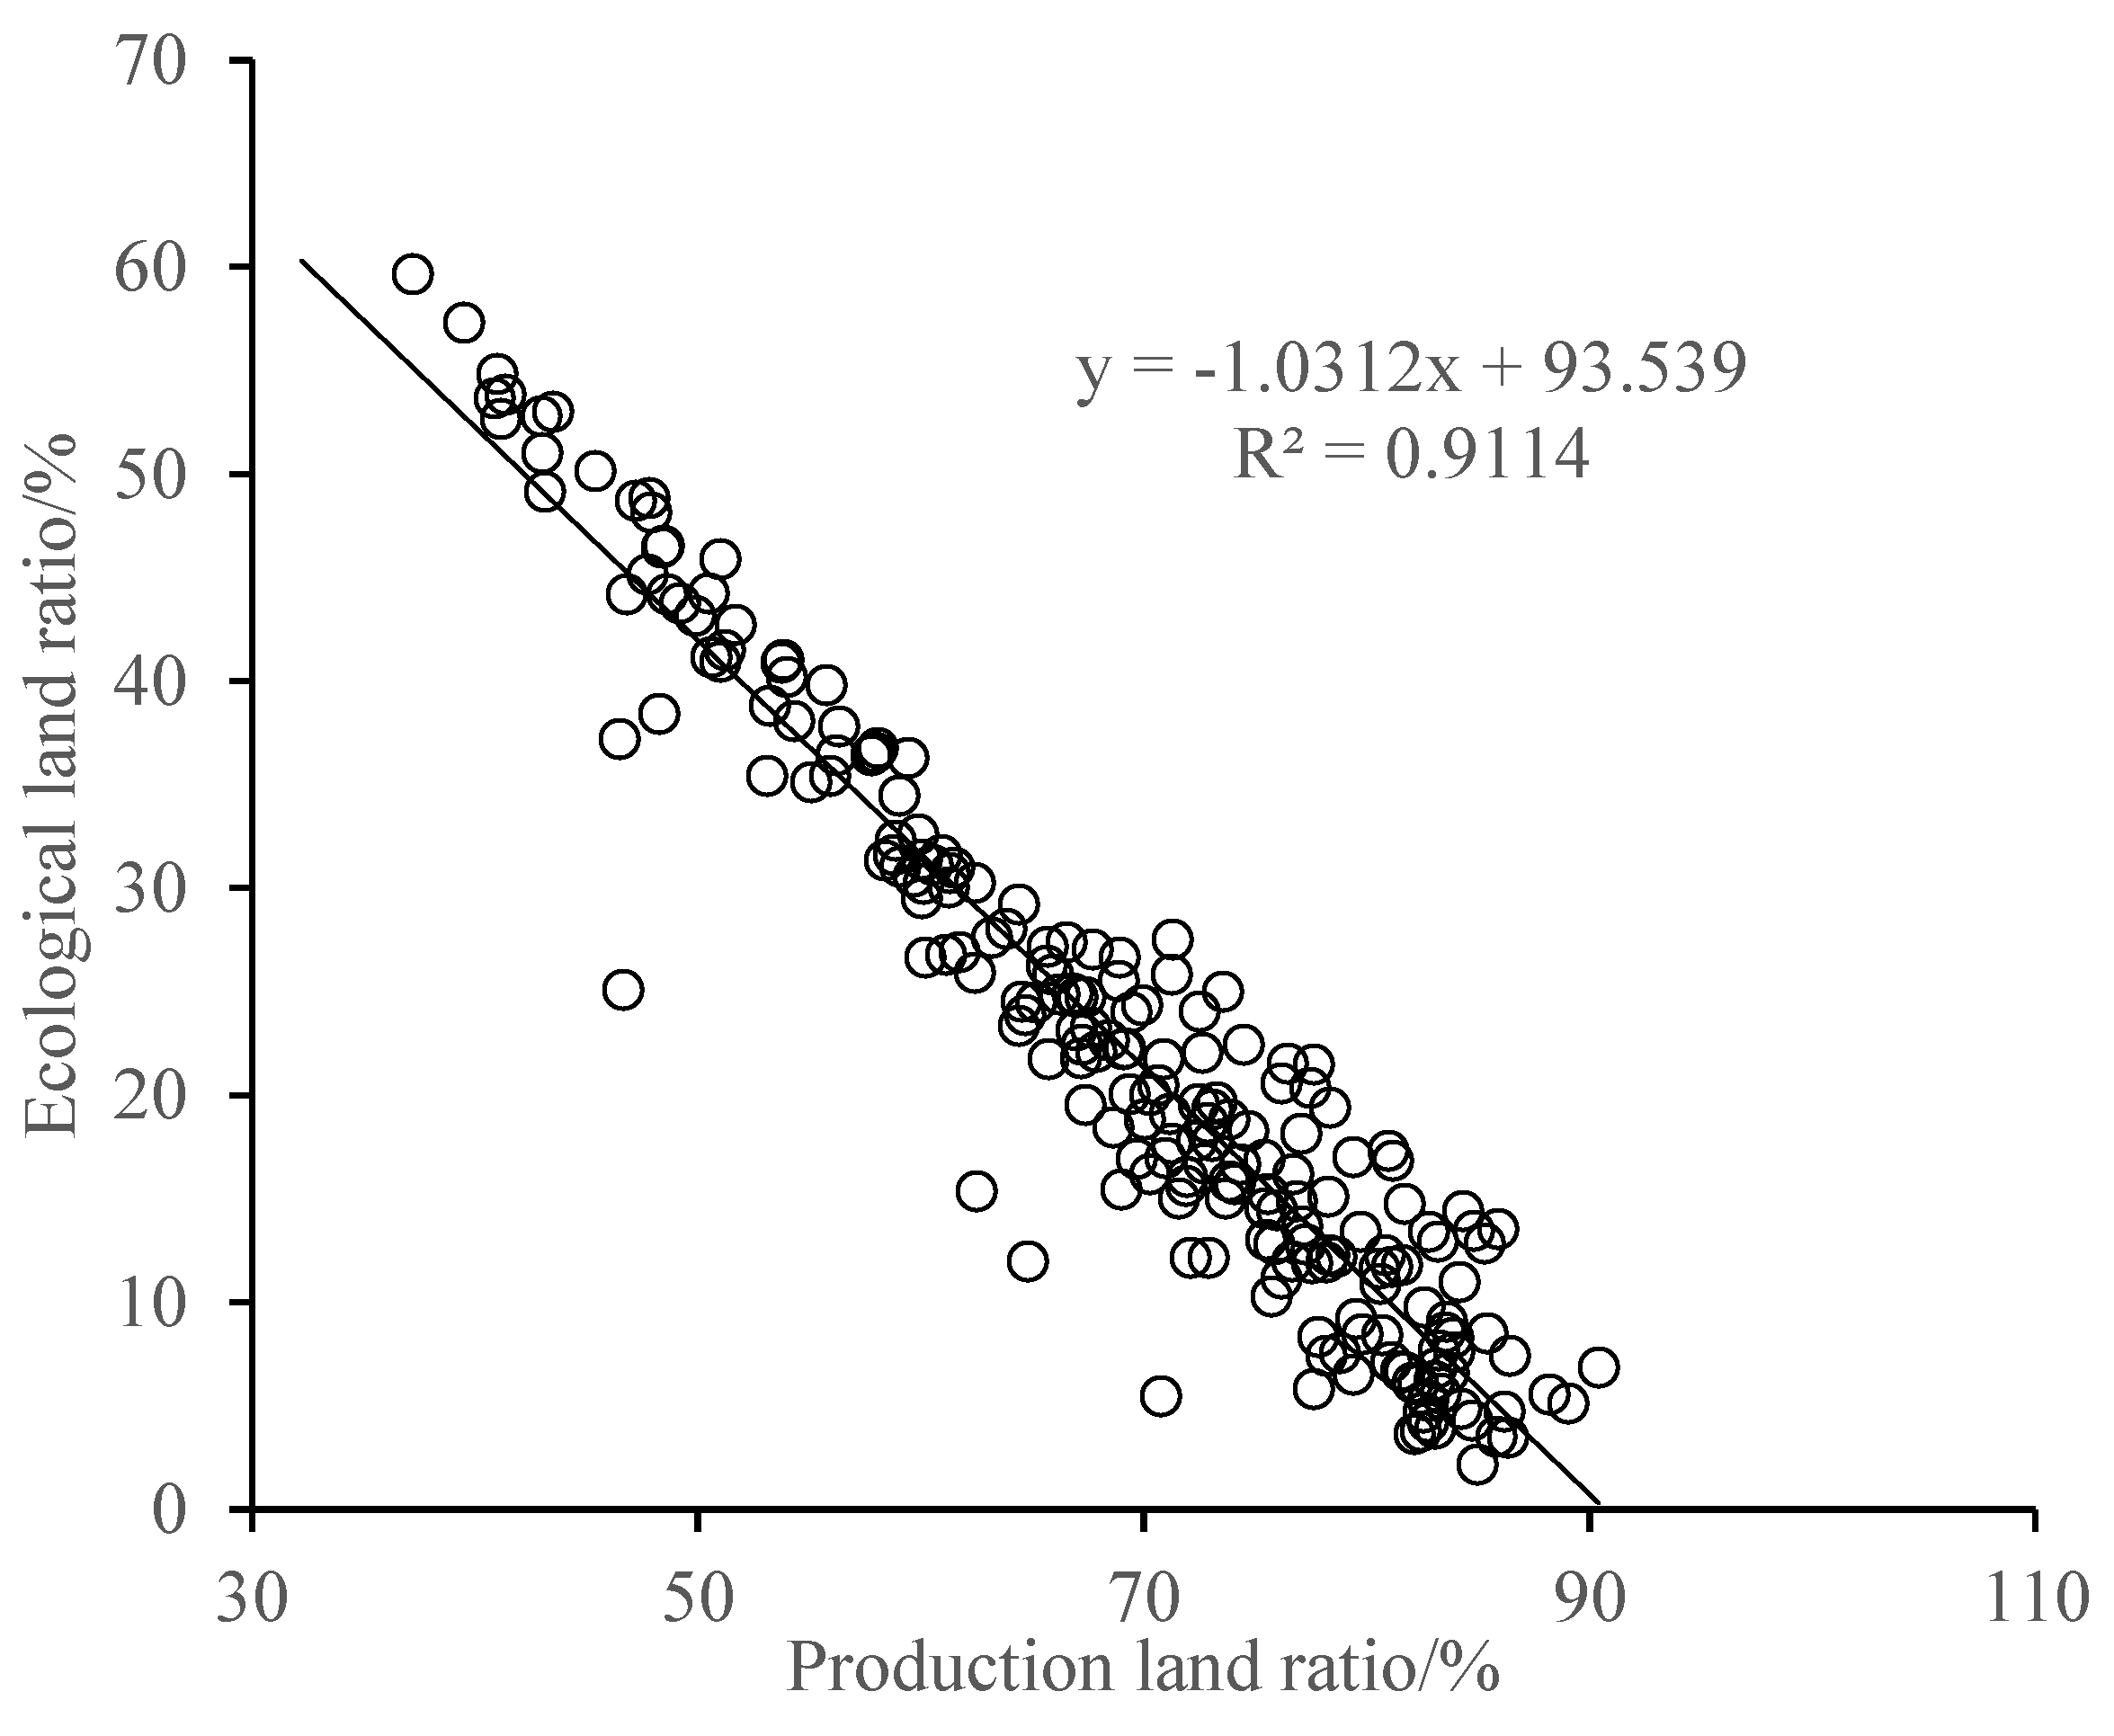
- PLEL in hilly areas of Sichuan Province shows a quantitative structure dominated by production space. PL, LL and EL account for 66.06%, 7.60% and 26.34% of the total area of the study area, respectively. The proportion of agricultural production land is the highest, forestland and rural living land are the second and third, while industrial production land is the smallest;
- (2)
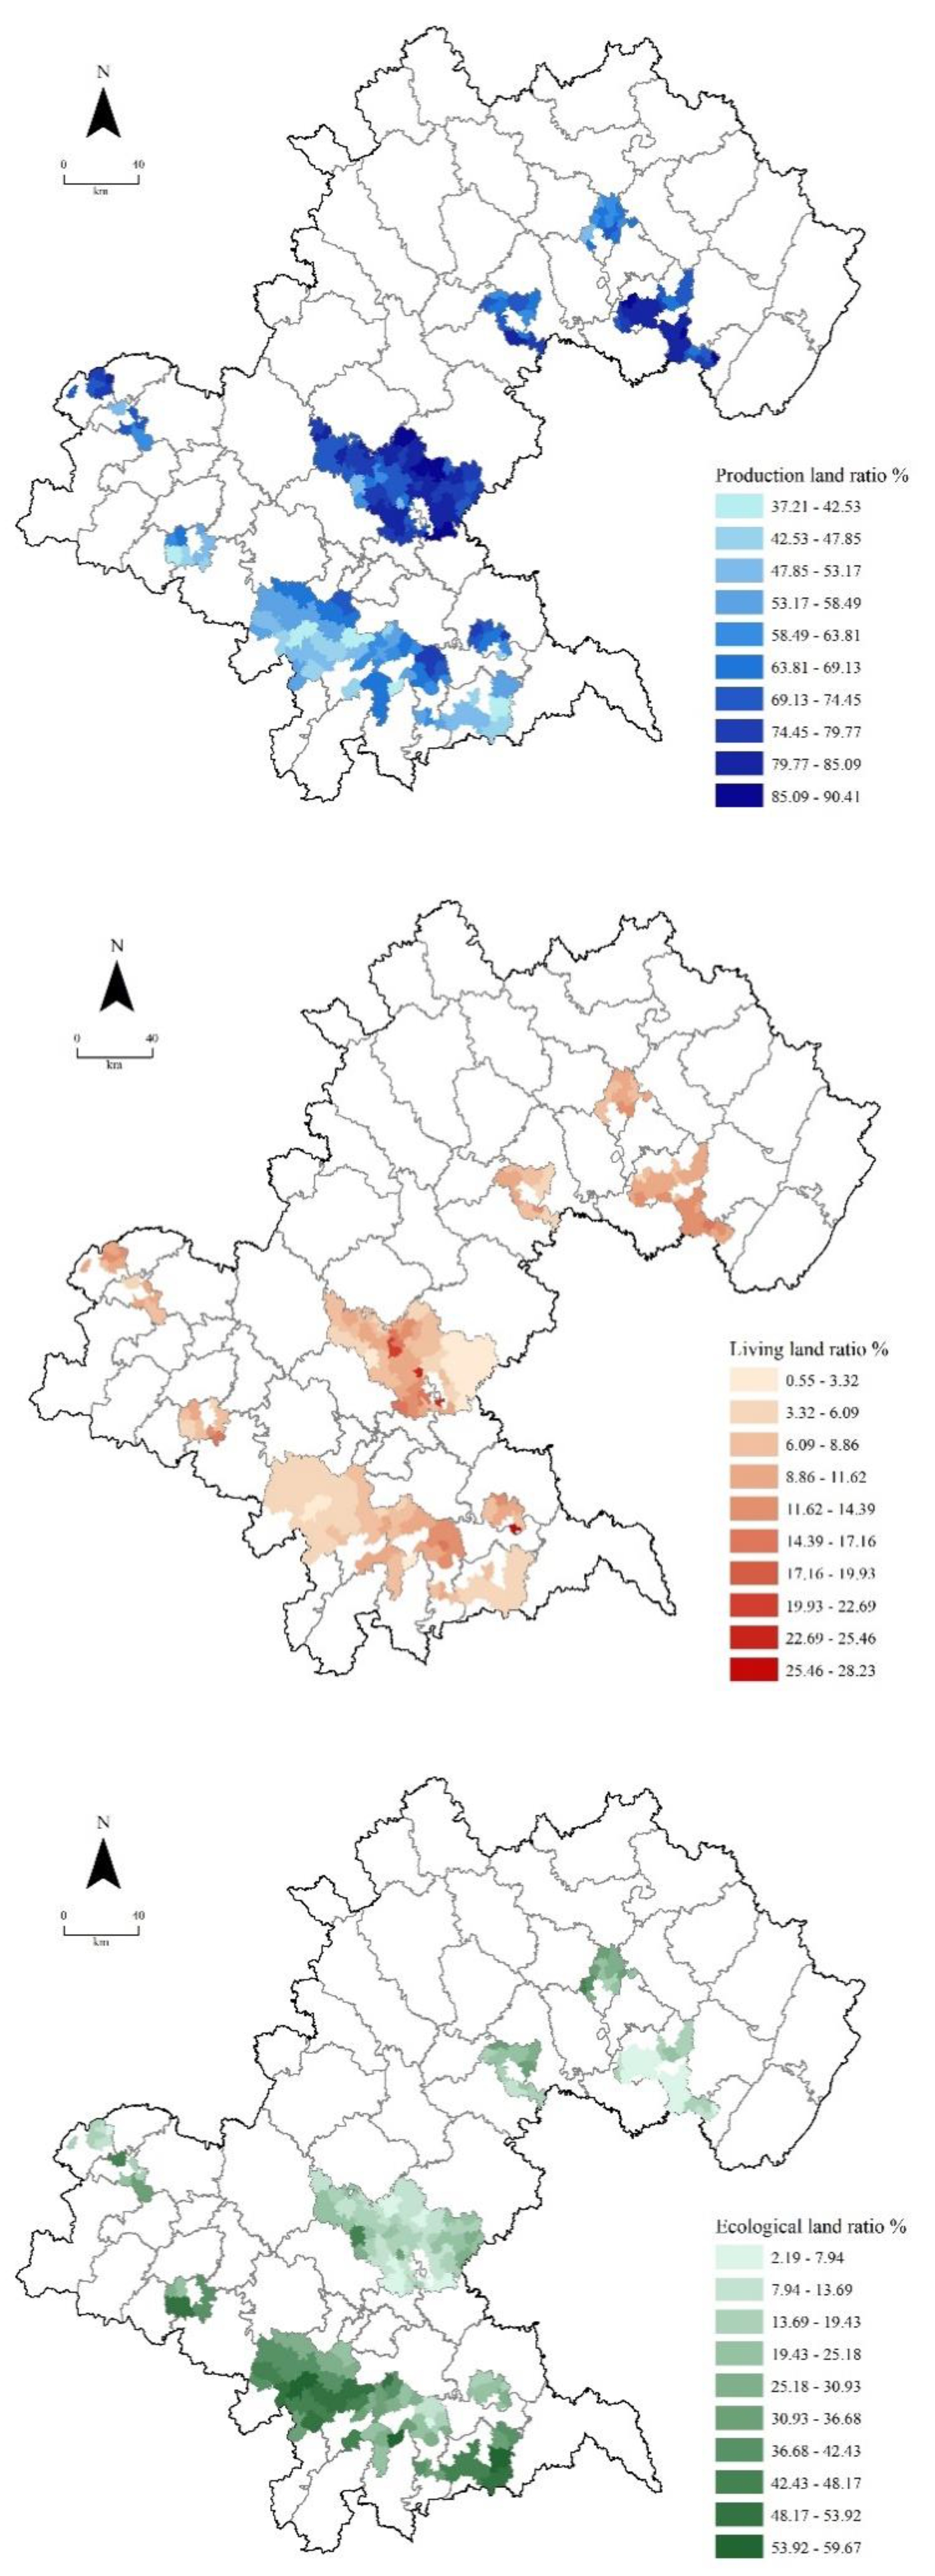
- There are regional differences in the spatial distribution of PLEL in hilly areas of Sichuan Province. The proportion of PL gradually decreases from north to south, the proportion of EL gradually increases from north to south, while the regional difference of LL is not obvious. Meanwhile, the imbalance of PLEL in hilly areas of central Sichuan is the highest, followed by the hilly areas of northeast Sichuan. The analysis results of the landscape pattern show that the patches of PL are larger, the shape is more complex and the distribution is more centralized, while the number of LL is higher, the area is smaller, and the distribution is very fragmented. The spatial distribution pattern of EL is between PL and LL. EL such as forest land and grassland were mainly distributed in the upper and middle hills. PL such as paddy field and arid land are mainly distributed in the middle and lower parts of hills, of which the paddy field has the highest proportion in valleys. LL is mainly distributed in slopes, valleys and flats, of which rural residence land is distributed more in flats;
- (3)
- Production and ecology are the main functions of PLEF in Sichuan hilly areas, among which agricultural & forestry production is the main PF, residence and culture & recreation are the main LF, while the sub-functional index of EF has little difference. PLEF in Sichuan hilly areas is dominated by arid land, paddy field, arbor forest land, and rural residence land;
- (4)
- The distribution pattern of PLEL in hilly areas of Sichuan Province is greatly impacted by natural conditions and socio-economic factors. Five natural conditions mainly affect PL and EL, among which latitude, relative altitude and surface roughness had the greatest impact. Population density is the most important socio-economic factor affecting PLEL. Location condition, gross industrial output, total retail sales of social consumer goods, and urban built-up area have a greater impact on LL.
Author Contributions
Funding
Conflicts of Interest
References
- Maria, L.P.; Cesare, P.M.; Laurence, M.; Marta, P.-S. An aggregation framework to link indicators associated with multifunctional land use to the stakeholder evaluation of policy options. Ecol. Indic. 2011, 11, 71–80. [Google Scholar]
- Cai, E.X.; Jing, Y.; Liu, Y.L.; Yin, C.H.; Gao, Y.; Wei, J.Q. Spatial-Temporal Patterns and Driving Forces of Ecological-Living-Production Land in Hubei Province, Central China. Sustainability 2018, 10, 66. [Google Scholar] [CrossRef]
- Jin, X.X.; Lu, Y.Q.; Lin, J.H.; Qi, X.H.; Hu, G.J.; Li, X. Research on the evolution of spatiotemporal patterns of production-living-ecological space in an urban agglomeration in the Fujian Delta region, China. Acta Ecol. Sin. 2018, 38, 4286–4295. [Google Scholar]
- Liu, Y. On the Logical Structure, Balance Mechanism and Development Principles of Ecological-Living-Production Space. Hubei Soc. Sci. 2016, 3, 5–9. [Google Scholar]
- Huang, J.C.; Lin, H.X.; Qi, X.X. A literature review on optimization of spatial development pattern based on ecological-production-living space. Prog. Geogr. 2017, 36, 378–391. [Google Scholar]
- Liang, L.K.; Gao, X.X.; Sun, S.Y. Study on land-ecological classification system. J. Soil Water Conserv. 2003, 17, 142–146. [Google Scholar]
- Long, H.L.; Liu, Y.Q.; Li, T.T.; Wan, J. Spatial interlinking of land use planning and environmental protection planning from the perspective of ecological civilization construction. Econ. Geogr. 2014, 34, 1–8. [Google Scholar]
- Xu, J.; Zhou, Y.K.; Jin, X.B.; Yi, L.Q. Discussing virgin land classification subsystem based on the protection of the eco-environment. Resour. Sci. 2007, 29, 137–141. [Google Scholar]
- Pérez-Soba, M.; Petit, S.; Jones, L.; Bertrand, N.; Briquel, V.; Omodei-Zorini, L.; Contini, C.; Helming, K.; Farrington, J.H.; Mossello, M.T. Land Use Functions—A Multifunctionality Approach to Assess the Impact of Land Use Changes on Land Use Sustainability; Springer: Berlin/Heidelberg, Germany, 2008. [Google Scholar]
- Chen, J.; Shi, P.J. Discussion on functional land use classification system. J. Beijing Norm. Univ. (Nat. Sci.) 2005, 5, 536–540. [Google Scholar]
- Liu, C.; Xu, Y.Q.; Sun, P.L.; Liu, J. Progress and prospects of multi-functionality of land use research. Prog. Geogr. 2016, 35, 1087–1099. [Google Scholar]
- Huang, A.; Xu, Y.Q.; Hao, J.M.; Sun, P.L.; Liu, C.; Zheng, W.R. Progress Review on Land Use Functions Evaluation and Its Prospects. China Land Sci. 2017, 31, 89–96. [Google Scholar]
- Zhang, H.Q.; Xu, E.Q.; Zhu, H.Y. Ecological-living-industrial land classification system in China. J. Resour. Ecol. 2017, 8, 121–128. [Google Scholar]
- Liu, J.L.; Liu, Y.S.; Li, Y.R. Classification evaluation and spatial-temporal analysis of “production-living-ecological” spaces in China. Acta Geogr. Sin. 2017, 72, 1290–1304. [Google Scholar]
- Nian, P.H.; Cai, Y.M.; Zhang, W.X.; Ma, S.F.; Zhuang, L. Geographic Entity Division and Functions Identification Oriented Comprehensive Regionalization. Econ. Geogr. 2014, 34, 7–14. [Google Scholar]
- Liu, C.; Xu, Y.Q.; Liu, Y.X.; Sun, P.L.; Huang, A.; Zhou, J. Research on Land Use Functions Classification and Evaluation System Based on System Theory. Acta Sci. Nat. Univ. Pekin. 2018, 54, 181–188. [Google Scholar]
- Zhang, H.Q.; Xu, E.Q.; Zhu, H.Y. An ecological-living-industrial land classification system and its spatial distribution in China. Resour. Sci. 2015, 37, 1332–1338. [Google Scholar]
- Hong, H.K.; Xie, D.T.; Guo, L.B.; Hu, R.; Liao, H.P. Differentiation of spatial function in a mountainous rural area from a muhi—functional perspective. Acta Ecol. Sin. 2017, 37, 2415–2427. [Google Scholar]
- Chen, L.; Zhou, S.L.; Zhou, B.B.; LYU, L.G.; Chang, T. Characteristics and Driving Forces of Regional Land Use Transition Based on the Leading Function Classification: A Case Study of Jiangsu Province. Econ. Geogr. 2015, 35, 155–162. [Google Scholar]
- Zhu, F.W.; Jin, Z.F.; Cui, F.F.; Lv, L.G.; Wang, J. Analysis of land-use temporal and spatial pattern in southern Jangsu. Resour. Environ. Yangtze Basin 2015, 24, 23–29. [Google Scholar]
- Yang, Q.K.; Duan, X.J.; Wang, L.; Jin, Z.F. Land Use Transformation Based on Ecological-production-living Spaces and Associated Eco-environment Effects: A Case Study in the Yangtze River Delta. Sci. Geogr. Sin. 2018, 38, 97–106. [Google Scholar]
- Xu, L.; Dong, J.; Chen, E. Coordination Features of Geographical Space Utilization in Urban Agglomeration in the Middle Reaches of the Yangtze River Base on ‘Production-Living-Ecological’ Function. Res. Soil Water Conserv. 2018, 25, 257–263. [Google Scholar]
- Liu, D.Q.; Ma, X.C.; Gong, J.; Li, H.Y. Functional identification and spatiotemporal pattern analysis of production⁃living⁃ecological space in watershed scale: A case study of Bailongjiang Watershed in Gansu. Chin. J. Ecol. 2018, 37, 1490–1497. [Google Scholar]
- Bai, R.S.; Jiang, Y.P.; Jiang, J.D. Analyzing Spatial distribution patterns of ecological-production-living spaces of Jianghuai Urban Agglomeration. China Anc. City 2016, 10, 18–25. [Google Scholar]
- Cheng, T.; Zhao, R.; Liang, Y. Prodution-living-ecological Space Classification and Its Functional Evaluation. Remote Sens. Inf. 2018, 33, 114–121. [Google Scholar]
- Zou, L.L.; Wang, J.Y.; Hu, X.D. An Classification Systems of Production-Living-Ecological Land on the County Level: Theory Building and Empirical Research. China Land Sci. 2018, 32, 59–66. [Google Scholar]
- Yu, L.; Song, A.A.; Zheng, Y.; Jian, Q.; Zhang, P.T. The ecological-living-industral land classification system and the analysis of its spatial distribution-case of Changli county. Chin. J. Agric. Resour. Reg. Plan. 2017, 38, 89–96. [Google Scholar]
- Gao, X.; Liu, Y.; Wu, K.N.; Liu, Z.Y.; Gao, X.C.; Li, C.X. Study on the present situation and optimal allocation of land resources in Pulan County based on production-living-ecological integration. Jiangsu Agric. Sci. 2016, 44, 453–457. [Google Scholar]
- Liu, C.Q. Analysis on the Change of Landscape Patterns of Mibu Land Use in Different Purple Hilly Area. Unpublished Master’s Thesis, Sichuan Agricultural University, Chengdu, China, 2014. [Google Scholar]
- Yi, X.S.; Wang, J.A.; Yue, Y.J. LUCC and land use pattern based on a functional desert land classification system: A case study for Yuyang desert in northan Shannxi. J. Beijing Norm. Univ. (Nat. Sci.) 2008, 44, 439–443. [Google Scholar]
- Zhao, L.; Zhang, G.J.; Zhu, Y.M.; Zhang, P.T.; Xu, H. Land Multi-functional Transformation and Characteristic Analysis based on Land Use Transition: A Case Study of Tang County, Hebei Province. China Land Sci. 2017, 31, 42–50. [Google Scholar]
- Wang, K.; Yao, Y.F.; Bao, J.L. Dynamic change of ecological-living-industrial land and its spatial agglomeration at county-scale. Bull. Soil Water Conserv. 2018, 38, 306–312. [Google Scholar]
- Li, G.D.; Fang, C.L. Quantitative function identification and analysis of urban ecological-production-living spaces. Acta Geogr. Sin. 2016, 71, 49–65. [Google Scholar]
- Xi, J.C.; Wang, S.K.; Zhang, R.Y. Restructuring and Optimizing Production-Living-Ecology Space in Rural Settlements-A Case Study of Gougezhuang Village at Yesanpo Tourism Attraction in Hebei Province. J. Nat. Resour. 2016, 31, 425–434. [Google Scholar]
- Wei, J.; Deng, L.J.; Tan, H.; Hu, Y.; Wang, C. Assessment of Ecological Security of Land Resources in Central Hilly Area of Sichuan Province-A Case Study of Guangan City. J. Sichuan Agric. Univ. 2009, 27, 338–344. [Google Scholar]
- Qiao, B.; Yan, X.C. The Investigation and Research on Rehabilitation and Restoration Modes of Vulnerable Ecological Regions in Hilly Areas of Sichuan. Ecol. Econ. 2008, 10, 41–44. [Google Scholar]
- ASTERGDEM. Available online: http://gdex.cr.usgs.gov/gdex/ (accessed on 18 March 2016).
- Costanza, R.; Arge, R.; Groot, R.; Farber, S.; Grasso, M.; Hannon, B.; Limburg, K.; Naeem, S.; O’Neill, R.V.; Paruelo, J.; et al. The value of the world’s ecosystem services and natural capital. Nature 1997, 387, 253–260. [Google Scholar] [CrossRef]
- Millennium Ecosystem Assessment. Ecosystems and Human Well-Being: A Framework for Assessment; Island Press: Washington, DC, USA, 2003. [Google Scholar]
- Xie, G.D.; Zhang, C.X.; Zhang, L.M.; Chen, W.H.; Li, S.M. Improvement of the Evaluation Method for Ecosystem Service Value Based on Per Unit Area. J. Nat. Resour. 2015, 8, 1243–1254. [Google Scholar]
- Zhao, R.Q.; Huang, X.J.; Zhong, T.Y.; Xu, H. polication of clustering analysis to land use zoning of coastal region in Jiangsu Province. Trans. CSAE 2010, 26, 310–317. [Google Scholar]
- Felix, H.; Angela, L.; Eckhard, M.; Hans-Hermann, T. Landscape Metrics for Assessment of Landscape Destruction and Rehabilitation. Environ. Manag. 2001, 27, 91–107. [Google Scholar]
- McGarigal, K.S.; Cushman, S.; Neel, M.C.; Ene, E. FRAGSTATS: Spatial Pattern Analysis Program for Categorical Maps. Computer Software Program Produced by the Authors at the University of Massachusetts, Amherst. Available online: www.umass.edu/landeco/research/fragstats/fragsta_ ts.html (accessed on 23 January 2015).
- Cui, B.L.; Li, X.Y.; Jiang, G.H.; Zhang, S.Y.; Huang, Y.G. Study on land use/cover in mountain area based on the DEM taking the Qinghai lake basin as an example. J. Nat. Resour. 2011, 26, 871–881. [Google Scholar]
- Jasiewicz, J.; Stepinski, T.F. Geomorphons: A pattern recognition approach to classification and mapping of landforms. Geomorpology 2013, 182, 147–156. [Google Scholar] [CrossRef]


| Land Use Type | Ecological Function | Production Function | Living Function | |||||||||
|---|---|---|---|---|---|---|---|---|---|---|---|---|
| Gas Regulation | Climate Regulation | Waste Treatment | Water Regulation | Soil Formation & Retention | Nutrient Cycling | Biodiversity | Agricultural & Forestry Production | Industrial & Mineral Production | Residence | Traffic | Culture & Recreation | |
| Paddy field | 3 | 1 | 1 | 3 | 1 | 1 | 1 | 5 | 0 | 0 | 0 | 3 |
| Irrigated land | 1 | 1 | 1 | 3 | 1 | 1 | 1 | 5 | 0 | 0 | 0 | 1 |
| Arid land | 1 | 1 | 1 | 1 | 1 | 1 | 1 | 5 | 0 | 0 | 0 | 1 |
| Orchard | 1 | 3 | 1 | 1 | 3 | 1 | 1 | 5 | 0 | 0 | 0 | 3 |
| Tea garden | 3 | 3 | 1 | 1 | 3 | 1 | 1 | 5 | 0 | 0 | 0 | 3 |
| Other gardens | 1 | 3 | 1 | 1 | 1 | 1 | 1 | 5 | 0 | 0 | 0 | 1 |
| Forest land | 5 | 5 | 3 | 5 | 5 | 1 | 5 | 3 | 0 | 0 | 0 | 3 |
| Shrub forest | 3 | 5 | 3 | 5 | 3 | 1 | 3 | 1 | 0 | 0 | 0 | 1 |
| Other forest lands | 5 | 5 | 3 | 3 | 3 | 1 | 3 | 1 | 0 | 0 | 0 | 3 |
| Natural grassland | 3 | 3 | 1 | 3 | 1 | 1 | 3 | 1 | 0 | 0 | 0 | 1 |
| Artificial grassland | 3 | 3 | 1 | 3 | 1 | 1 | 1 | 1 | 0 | 0 | 0 | 1 |
| Other grasslands | 1 | 3 | 1 | 3 | 1 | 1 | 3 | 0 | 0 | 0 | 0 | 1 |
| Industrial land | 0 | 0 | 0 | 0 | 0 | 0 | 0 | 0 | 5 | 0 | 0 | 0 |
| Mining land | 0 | 0 | 0 | 0 | 0 | 0 | 0 | 0 | 5 | 0 | 0 | 0 |
| Storage land | 0 | 0 | 0 | 0 | 0 | 0 | 0 | 0 | 5 | 0 | 0 | 0 |
| Urban residential land | 0 | 0 | 0 | 0 | 0 | 0 | 0 | 0 | 3 | 5 | 3 | 3 |
| Rural residential land | 0 | 0 | 0 | 0 | 0 | 0 | 0 | 0 | 0 | 5 | 0 | 1 |
| Sightseeing facility land | 3 | 5 | 3 | 5 | 3 | 1 | 3 | 0 | 0 | 0 | 0 | 3 |
| Railway land | 0 | 0 | 0 | 0 | 0 | 0 | 0 | 0 | 0 | 0 | 5 | 0 |
| Highway land | 0 | 0 | 0 | 0 | 0 | 0 | 0 | 0 | 0 | 0 | 5 | 1 |
| Rural road | 0 | 0 | 0 | 0 | 0 | 0 | 0 | 0 | 0 | 0 | 5 | 1 |
| Port land | 0 | 0 | 0 | 0 | 0 | 0 | 0 | 0 | 5 | 0 | 3 | 0 |
| Rivers | 3 | 3 | 5 | 5 | 1 | 1 | 3 | 1 | 0 | 0 | 1 | 3 |
| Lakes | 1 | 3 | 5 | 5 | 3 | 1 | 5 | 1 | 0 | 0 | 0 | 3 |
| Reservoir | 1 | 3 | 3 | 5 | 3 | 1 | 3 | 1 | 0 | 0 | 0 | 1 |
| Pond | 1 | 1 | 3 | 5 | 3 | 1 | 1 | 1 | 0 | 0 | 0 | 1 |
| Inland beach | 1 | 3 | 1 | 3 | 5 | 3 | 5 | 1 | 0 | 0 | 0 | 1 |
| Ditches | 1 | 1 | 3 | 5 | 1 | 1 | 0 | 0 | 0 | 0 | 0 | 1 |
| Hydraulic Construction land | 0 | 0 | 0 | 0 | 0 | 0 | 0 | 0 | 5 | 0 | 0 | 0 |
| Idle land | 1 | 1 | 3 | 1 | 5 | 3 | 5 | 0 | 0 | 0 | 0 | 0 |
| Agricultural facility land | 0 | 0 | 0 | 0 | 0 | 0 | 0 | 5 | 0 | 0 | 0 | 1 |
| Saline land | 0 | 0 | 1 | 1 | 5 | 3 | 5 | 0 | 0 | 0 | 0 | 0 |
| Marshland | 3 | 3 | 5 | 5 | 3 | 1 | 5 | 0 | 0 | 0 | 0 | 3 |
| Sandy land | 0 | 0 | 1 | 1 | 5 | 3 | 3 | 0 | 0 | 0 | 0 | 0 |
| Bare land | 0 | 0 | 1 | 1 | 3 | 1 | 5 | 0 | 0 | 0 | 0 | 0 |
| Urban | 0 | 0 | 0 | 0 | 0 | 0 | 0 | 0 | 3 | 5 | 5 | 5 |
| Towns | 0 | 0 | 0 | 0 | 0 | 0 | 0 | 0 | 1 | 5 | 3 | 3 |
| Villages | 0 | 0 | 0 | 0 | 0 | 0 | 0 | 0 | 0 | 5 | 1 | 1 |
| Sightseeing and special land | 3 | 5 | 3 | 5 | 3 | 1 | 3 | 0 | 0 | 0 | 0 | 3 |
| Main Function of PLEF | Clustering Group | Land Use Type |
|---|---|---|
| Ecological function | 1 | Forest land, Shrub forest, Other forest lands, Natural grassland, Artificial grassland, Other grasslands, Sightseeing facility land, Rivers, Lakes, Reservoir, Pond, Inland beach, Ditches, Idle land, Saline land, Marshland, Sandy land, Bare land, Sightseeing and special land. |
| Production function | 2 | Paddy field, Irrigated land, Arid land, Orchard, Tea garden, Other gardens, Agricultural facility land. |
| 3 | Industrial land, Mining land, Storage land, Port land, Hydraulic Construction land. | |
| Living function | 4 | Urban residential land, Rural residential land, Railway land, Highway land, Rural road, Urban, towns, villages. |
| PLEL Class 1 | PLEL Class 2 | PLEL Class 3 | Land Use Type |
|---|---|---|---|
| Ecological land | Wetland | Riverine Wetland | Rivers, Inland beach |
| Lacustrine Wetland | Lakes | ||
| Marshy Wetland | Marshland | ||
| Human-made Wetland | Reservoir, Pond, Ditches | ||
| Forest land | Arbor forest land | Forest land | |
| Shrub forest land | Shrub forest | ||
| Other forest land | Other forest lands | ||
| Grassland | Natural grassland | Natural grassland, Other grasslands | |
| Artificial grassland | Artificial grassland | ||
| Other ecological land | Sightseeing and special land | Sightseeing and special land | |
| Idle land | Idle land | ||
| Saline land | Saline land | ||
| Sandy land | Sandy land | ||
| Bare land | Bare land | ||
| Production land | Agricultural production land | Paddy field | Paddy field |
| Arid land | Irrigated land, Arid land, Agricultural facility land | ||
| Orchard | Orchard, Tea garden, Other gardens | ||
| Industrial production land | Industrial & Mineral land | Industrial land, Mining land, Storage land, Port land, Hydraulic Construction land | |
| Living land | Urban living land | Urban land | Urban, towns, Urban residential land |
| Rural living land | Rural residence land | Villages, Rural residential land | |
| Traffic land | Traffic land | Railway land, Highway land, Rural road |
| PLEL Class 1 | Area | Ratio | PLEL Class 2 | Area | Ratio |
|---|---|---|---|---|---|
| Productive land | 694,604.39 | 66.06 | Agricultural productive land | 692,493.15 | 65.86 |
| Industrial productive land | 2111.24 | 0.20 | |||
| Living land | 79,879.88 | 7.60 | Urban living land | 6775.65 | 0.64 |
| Rural living land | 67,622.65 | 6.43 | |||
| Traffic land | 5481.58 | 0.52 | |||
| Ecological land | 276,911.81 | 26.34 | Wetland | 42,711.88 | 4.06 |
| Forest land | 226,065.15 | 21.50 | |||
| Grassland | 4453.38 | 0.42 | |||
| Other ecological land | 3681.40 | 0.35 |
| Landscape Pattern Indexes | Production Land | Living Land | Ecological Land |
|---|---|---|---|
| Total class area (CA hm2) | 1649.89 | 148.75 | 362.93 |
| Number of patches (NP n) | 115.20 | 492.15 | 210.06 |
| Patch density (PD n/100 hm2) | 1.84 | 9.47 | 3.84 |
| Largest patch index (LPI %) | 18.92 | 0.44 | 1.63 |
| Edge density (ED m/hm2) | 84.89 | 30.79 | 36.61 |
| Patch area mean (AREA_MN hm2) | 59.93 | 5.39 | 1.93 |
| Interspersion juxtaposition index (IJI %) | 53.19 | 40.43 | 35.89 |
| Landscape division Index (DIVISION %) | 0.89 | 1.00 | 1.00 |
| Aggregation index (AI %) | 98.98 | 97.47 | 98.20 |
| PLEL Class 3 | Summit | Ridge | Slope | Valley | Flat |
|---|---|---|---|---|---|
| Riverine wetland | 0.3 | 10.6 | 28.4 | 57.6 | 3.1 |
| Lacustrine wetland | 3.7 | 22.7 | 25.3 | 40.6 | 7.7 |
| Marshy wetland | 3.2 | 29.8 | 36.1 | 24.7 | 6.1 |
| Human-made wetland | 4.9 | 24.8 | 36.2 | 27.8 | 6.4 |
| Arbor forest land | 3.6 | 26.0 | 38.9 | 22.6 | 8.9 |
| Shrub forest land | 5.2 | 23.9 | 35.2 | 26.8 | 8.9 |
| Other forest land | 0.0 | 0.0 | 0.0 | 100.0 | 0.0 |
| Natural grassland | 3.5 | 26.1 | 23.1 | 38.3 | 9.0 |
| Artificial grassland | 0.0 | 0.0 | 40.7 | 48.5 | 10.7 |
| Sightseeing and special land | 4.8 | 23.6 | 36.5 | 25.3 | 9.7 |
| Paddy field | 2.0 | 24.4 | 28.7 | 38.9 | 5.9 |
| Arid land | 2.6 | 27.7 | 28.8 | 34.2 | 6.7 |
| Orchard | 3.4 | 28.9 | 33.8 | 26.5 | 7.4 |
| Industrial & Mineral land | 3.4 | 19.9 | 41.0 | 27.4 | 8.2 |
| Urban land | 0.7 | 26.5 | 37.5 | 32.5 | 2.8 |
| Rural residence land | 5.9 | 22.0 | 31.7 | 29.4 | 10.9 |
| Traffic land | 1.7 | 27.9 | 30.4 | 34.7 | 5.3 |
| Total | 2.8 | 26.4 | 30.9 | 33.3 | 6.6 |
| Production–Living–Ecological Functions | Total | Production Land | Living Land | Ecological Land | |
|---|---|---|---|---|---|
| Production function | Agricultural & Forestry production | 142.0 | 122.8 | 19.2 | |
| Industrial & Mineral production | 0.5 | 0.5 | |||
| Subtotal | 142.5 | 123.3 | 19.2 | ||
| Living function | Residence | 17.3 | 17.3 | ||
| Traffic | 1.4 | 1.4 | |||
| Culture & Recreation | 48.9 | 31.7 | 2.5 | 14.7 | |
| Subtotal | 67.6 | 31.7 | 21.3 | 14.7 | |
| Ecological function | Gas regulation | 22.7 | 12.8 | 9.9 | |
| Climate regulation | 18.4 | 8.2 | 10.2 | ||
| Waste treatment | 14.2 | 7.0 | 7.2 | ||
| Water regulation | 23.5 | 12.5 | 10.9 | ||
| Soil formation & retention | 17.9 | 8.1 | 9.7 | ||
| Nutrient cycling | 9.4 | 7.0 | 2.4 | ||
| Biodiversity | 17.2 | 7.0 | 10.2 | ||
| Subtotal | 123.2 | 62.7 | 60.5 | ||
| Total | 333.3 | 217.7 | 21.3 | 94.3 | |
| Impact Factors | PL Ratio | LL Ratio | EL Ratio | |
|---|---|---|---|---|
| Natural factors | Longitude | 0.276 ** | 0.168 * | −0.306 ** |
| Latitude | 0.411 ** | 0.127 | −0.419 ** | |
| Altitude | −0.043 | −0.159 * | 0.088 | |
| Relative altitude | −0.542 ** | −0.149 * | 0.546 ** | |
| Surface roughness | −0.496 ** | −0.225 ** | 0.526 ** | |
| Socio-economic factors | Location condition | −0.004 | −0.401 ** | 0.124 |
| Population density | 0.276 ** | 0.517 ** | −0.410 ** | |
| Government revenue | −0.104 | 0.103 | 0.065 | |
| Crop sown area | 0.252 ** | −0.252 ** | −0.157 * | |
| Gross industrial output | −0.171 * | 0.381 ** | 0.044 | |
| Total retail sales of social Consumer goods | −0.167 * | 0.207 ** | 0.093 | |
| Urban built-up area | −0.071 | 0.258 ** | −0.011 | |
© 2019 by the authors. Licensee MDPI, Basel, Switzerland. This article is an open access article distributed under the terms and conditions of the Creative Commons Attribution (CC BY) license (http://creativecommons.org/licenses/by/4.0/).
Share and Cite
Liao, G.; He, P.; Gao, X.; Deng, L.; Zhang, H.; Feng, N.; Zhou, W.; Deng, O. The Production–Living–Ecological Land Classification System and Its Characteristics in the Hilly Area of Sichuan Province, Southwest China Based on Identification of the Main Functions. Sustainability 2019, 11, 1600. https://0-doi-org.brum.beds.ac.uk/10.3390/su11061600
Liao G, He P, Gao X, Deng L, Zhang H, Feng N, Zhou W, Deng O. The Production–Living–Ecological Land Classification System and Its Characteristics in the Hilly Area of Sichuan Province, Southwest China Based on Identification of the Main Functions. Sustainability. 2019; 11(6):1600. https://0-doi-org.brum.beds.ac.uk/10.3390/su11061600
Chicago/Turabian StyleLiao, Guitang, Peng He, Xuesong Gao, Liangji Deng, Hui Zhang, Nana Feng, Wei Zhou, and Ouping Deng. 2019. "The Production–Living–Ecological Land Classification System and Its Characteristics in the Hilly Area of Sichuan Province, Southwest China Based on Identification of the Main Functions" Sustainability 11, no. 6: 1600. https://0-doi-org.brum.beds.ac.uk/10.3390/su11061600