System Dynamics Modeling of Dockless Bike-Sharing Program Operations: A Case Study of Mobike in Beijing, China


School of Economics and Management, Beijing University of Posts and Telecommunications, Beijing 100876, China
*
Author to whom correspondence should be addressed.
Sustainability 2019, 11(6), 1601; https://0-doi-org.brum.beds.ac.uk/10.3390/su11061601
Submission received: 9 February 2019
/
Revised: 8 March 2019
/
Accepted: 10 March 2019
/
Published: 16 March 2019
(This article belongs to the Section Economic and Business Aspects of Sustainability)
Abstract
:In China, dockless bike-sharing programs (DBSPs) have changed people’s travel modes, alleviated urban traffic congestion, and reduced carbon emissions. However, a number of DBSPs have experienced financial crises since 2018. This means that research on DBSPs must be considered not only in terms of the environment and technology, but also in the operation of the program. In this paper, we modeled the DBSP operations in a certain area using a system dynamics simulation approach. The main purpose was to explore the dynamics of the program’s operation process and evaluate possible improvement strategies for maximizing the revenue of the overall DBSP. Specifically, the analysis focused on the economic profits of DBSPs in an environment of competition and government regulation. The research findings revealed that the dockless bike-sharing industry has great economic profits, but in the current environment, the market needs to be regulated by the local government. If a DBSP does not introduce new technologies or find new profit channels, it will be difficult to develop sustainably by only relying on riding profits. In addition, we provide a case study of Mobike’s operations in Beijing to support these findings and validate the developed model. Finally, we discuss Mobike’s possible improvement strategies.
1. Introduction
The history of shared bikes can be traced back to the 1960s, and the first “shared” concept bike was born in Amsterdam, the Netherlands [1]. In recent years, dockless bike-sharing programs (DBSPs) have developed rapidly, thanks to the characteristics of the mobile Internet so that borrowing and returning can occur at any time and any place. Bikes can be unlocked and paid for using a smartphone and then picked up and left anywhere at users’ convenience. DBSPs have spread to hundreds of cities around the world with more than 200 million users worldwide and more than $4 billion in financing [2]. The essence of DBSPs is the online to offline bike rental business. Through this program, urban dwellers can ease the travel problem of “the last mile”, improve the efficiency of urban travel, and achieve a low-carbon lifestyle. More and more people believe that the development of DBSPs is a means to facilitate sustainable urban travel and reduce carbon emissions.
Furthermore, the rapid rise of the DBSP industry cannot be merely attributed to environmental factors as huge economic profits are also crucial [3]. This can be summarized as follows. (1) A DBSP is easily supported by the local government and is provided with many conveniences. (2) There is a great market demand for DBSPs, of which the profits from the user riding are lucrative and the user deposit collected by the DBSP forms a deposit pool. (3) The public opinion is optimistic to the industry and therefore can easily obtain financial support. (4) A large amount of the user’s registration information and daily riding data can be obtained.
However, a few DBSPs around the world were exposed to financial problems in 2018. People are gradually losing faith in the DBSP industry. In April, Mobike was acquired by Meituan due to its debt crisis [4]. In July, Ofo announced the closure of its Australian operations [5]. In August, Ofo announced its withdrawal from the US Seattle market [6]. In September, Mobike decided to give up the Manchester market [7]. In December, Ofo fell into a bankruptcy crisis [8]. Faced with the operating crisis of DBSPs, managers now have to reflect on the existing business and industrial models and ask: Are there any problems with the existing model and how can it be improved?
Several authors have conducted research on DBSPs and have focused mainly on big data and machine learning applications (e.g., the scheduling efficiency of DBSPs [9,10,11], user travel forecast [12,13], electronic fence planning [14,15,16], and changes of travel mode [17,18]); user behavior [19,20]; environmental benefits [21,22]; and the overall development of the industry [23,24,25]. Note that these studies add complexity to this field. However, there is a lack of analysis of the DBSP operations at the system level. In the current social environment and technology, how to sustain the operation of a DBSP and how to improve the business model has become a common concern of all DBSPs. In order to better assess the DBSP operations and business model, we needed to analyze this issue from the perspective of system, which was the reason for conducting this research.
In this paper, our main objective was to model the main factors that affected the DBSP operations under the environment of fierce competition and government restriction, and to propose and evaluate potential effective improvement strategies. The research focused on DBSP operations and sustainment strategies. To address this objective, a system dynamics (SD) simulation model of the DBSP was developed [26]. The selection of a SD approach for this study was based on its ability to model complex systems using visual representation that can be converted into mathematical formulas by software. Complex systems generally have the characteristics of a complex structure, numerous influencing factors, delays in system behavior, and parameters that change with time [27]. This simulation approach enables the modeling of factors, operations processes, and policies to consider in the DBSP operations as well as the evaluation of effective sustainment strategies aimed at improving the performance of the system.
A case study was conducted to validate the developed model for DBSPs and to further support the findings. The findings obtained from the simulation analysis can be accessed through the case study. In addition, some of the data and information collected from the DBSP are useful for selecting the variables and determining the relationships among them. Therefore, we collected as much information and data as possible of the Mobike DBSP in Beijing. Mobike values the technology development and its patent application covers multiple core technologies in the bike-sharing field. The number of cities which have launched this program has exceeded 200 [28].
The paper is organized as follows. The literature review is introduced in the next section. In Section 3, the SD simulation model of the DBSPs is developed. In Section 4, the simulation results of the model are presented. The contribution and implications are described in Section 5. Finally, our conclusions are given.
2. Literature Review
The sharing economy was introduced in consumption by Marcus Felson and Joel Spaeth in 1978, who also proposed the concept of “collaborative consumption” [29], as they believed that the joint consumption of goods or services was a category of collaborative consumption. In recent years, with the development of Internet technology, this concept has been further supplemented and developed. The emergence of the sharing economy will bring huge changes to the current consumption pattern as the sharing economy has created a “zero marginal cost economy” and brought about new consumers through overcapacity and shared platforms [30,31].
The sharing economy can be considered to be driven by several factors: the development of information technology and the network society; the increase in the proportion of urbanization; the expansion of the income gap; and the impact of the financial crisis [32]. The sharing economy has a certain impact on many industries and has changed traditional business models. More and more scholars are engaging in research on the sharing economy where some have analyzed the reasons for the success and failure of some shared platforms from the perspective of business model profitability, and discussed the pricing strategies, financing models, and crowdfunding methods of enterprises [33,34,35]. Demary and Wallsten studied the issue of competition in the sharing economy [36,37]. Kumar et al. clarified a strategic framework for sharing economic business models and studied the issue of resource allocation [38]. A study by Plewnia et al. found that a shared economic system could be described in four dimensions: shared goods or services, market structure, market orientation, and the industry sector [39]. Hawlitschek et al. studied how blockchain technology could be applied to the shared economy to solve the trust problem [40]. Zhang et al. analyzed the price competition problem in the shared economy [41]. All of the above-mentioned research considers the various problems in the sharing economy from the holistic perspective of operations management. In contrast, there has been no targeted analysis of the problems of a specific shared economic industry. However, it has inspired many of the ideas of system construction in this study.
At the same time, many studies have shown that the sharing economy should be regulated by the government. Some scholars have analyzed the role of government in the sharing of economic business models from a macro level [42,43,44]. Richardson et al. studied how the government changed its role in traditional business models and shared economic business models [45]. Martin et al. proposed a democratic platform governance model to regulate programs [46]. Hong et al. compared the sharing economic policies of 47 cities in the United States and believed that political competition had a significant impact on the government’s policy of regulating the sharing economy [47]. Ma et al. analyzed the government regulation model and proposed corresponding improvement strategies through the DBSP situation in Shanghai [48]. Therefore, the analysis of DBSP from a system perspective should consider the regulation of government.
In the study of the operation of a specific sharing economic industry, Bardhi et al. conducted a case study of the shared transportation program Zipcar. They believe that shared platforms play an important role in the business model of the sharing economy [49]. Henten et al. studied the Airbnb pricing strategy and argued that the type of property rights, the number of comments and location had important implications for shared resources [50]. Phua et al. analyzed customer service, technical challenges, and customer trust in Airbnb [51]. Li et al. studied the operation strategy of a dock bike-sharing program based on game theory, and provided an optimal strategy to maximize the revenue of the program [52,53]. However, few studies have considered the problems of the DBSP operations from the perspective of system. This paper aims to bridge the research gap and intends to identify the influence relationships among the variables of a DBSP in order to undertake a comparison between the reality and the dynamic behavior of the model which represents the whole system.
3. System Modeling
Maintaining a balance between revenue and expenditure is the key to the sustainable development of a DBSP in a certain area. Hence, the revenue and expenditure of the DBSP should be fully considered in this system. The system model description is first given in Section 3.1. Next, the corresponding relationship between the parameters and variables can be represented by the mathematical equations in Section 3.2 in order to run various simulations and analyze the dynamic behavior of the system. The validation process of the obtained model is presented in Section 3.3.
3.1. Model Description
For the sake of convenience, the main variables used throughout the models are shown in Table 1, and the rest of the variable descriptions are shown in Table A1 of Appendix A. This study focused on the operation of DBSPs from the perspective of system, ignoring the impact of several additional factors on some of the variables. As the scope of these factors is too wide, the variables associated with real-world system dynamics, such as collection time and maintenance effort were considered as exogenous variables.
Several assumptions were made throughout this analysis to simplify and facilitate the modeling process by helping focus on the most important factors. The assumptions can be summarized as follows. (1) Since every bike is equipped with GPS, maintenance personnel can collect all damaged bikes according to the state information of bikes in every period. (2) The competing factors between the DBSPs mainly include the number of bikes supplied, the riding fee, the deposit, the quality of bikes, etc. As the riding fee of each DBSP in a certain area is similar, this factor was not considered. According to the 2017 Bike-Sharing User Behavior Analysis [54] and 2018 China Bike-Sharing Industry Development Analysis Report [55], the most important factor for users is the number of bikes supplied. In addition, most users only register with one DBSP. The number of active users and bike rides of each DBSP can be considered to be determined only by the number of bikes supplied, which was also evidenced in the subsequent case study. (3) The number of bikes delivered in the market in the period of time will not exceed the amount of bike inventory, which means that shortage is not allowed (e.g., Yang et al. [56] and Balali et al. [57]).
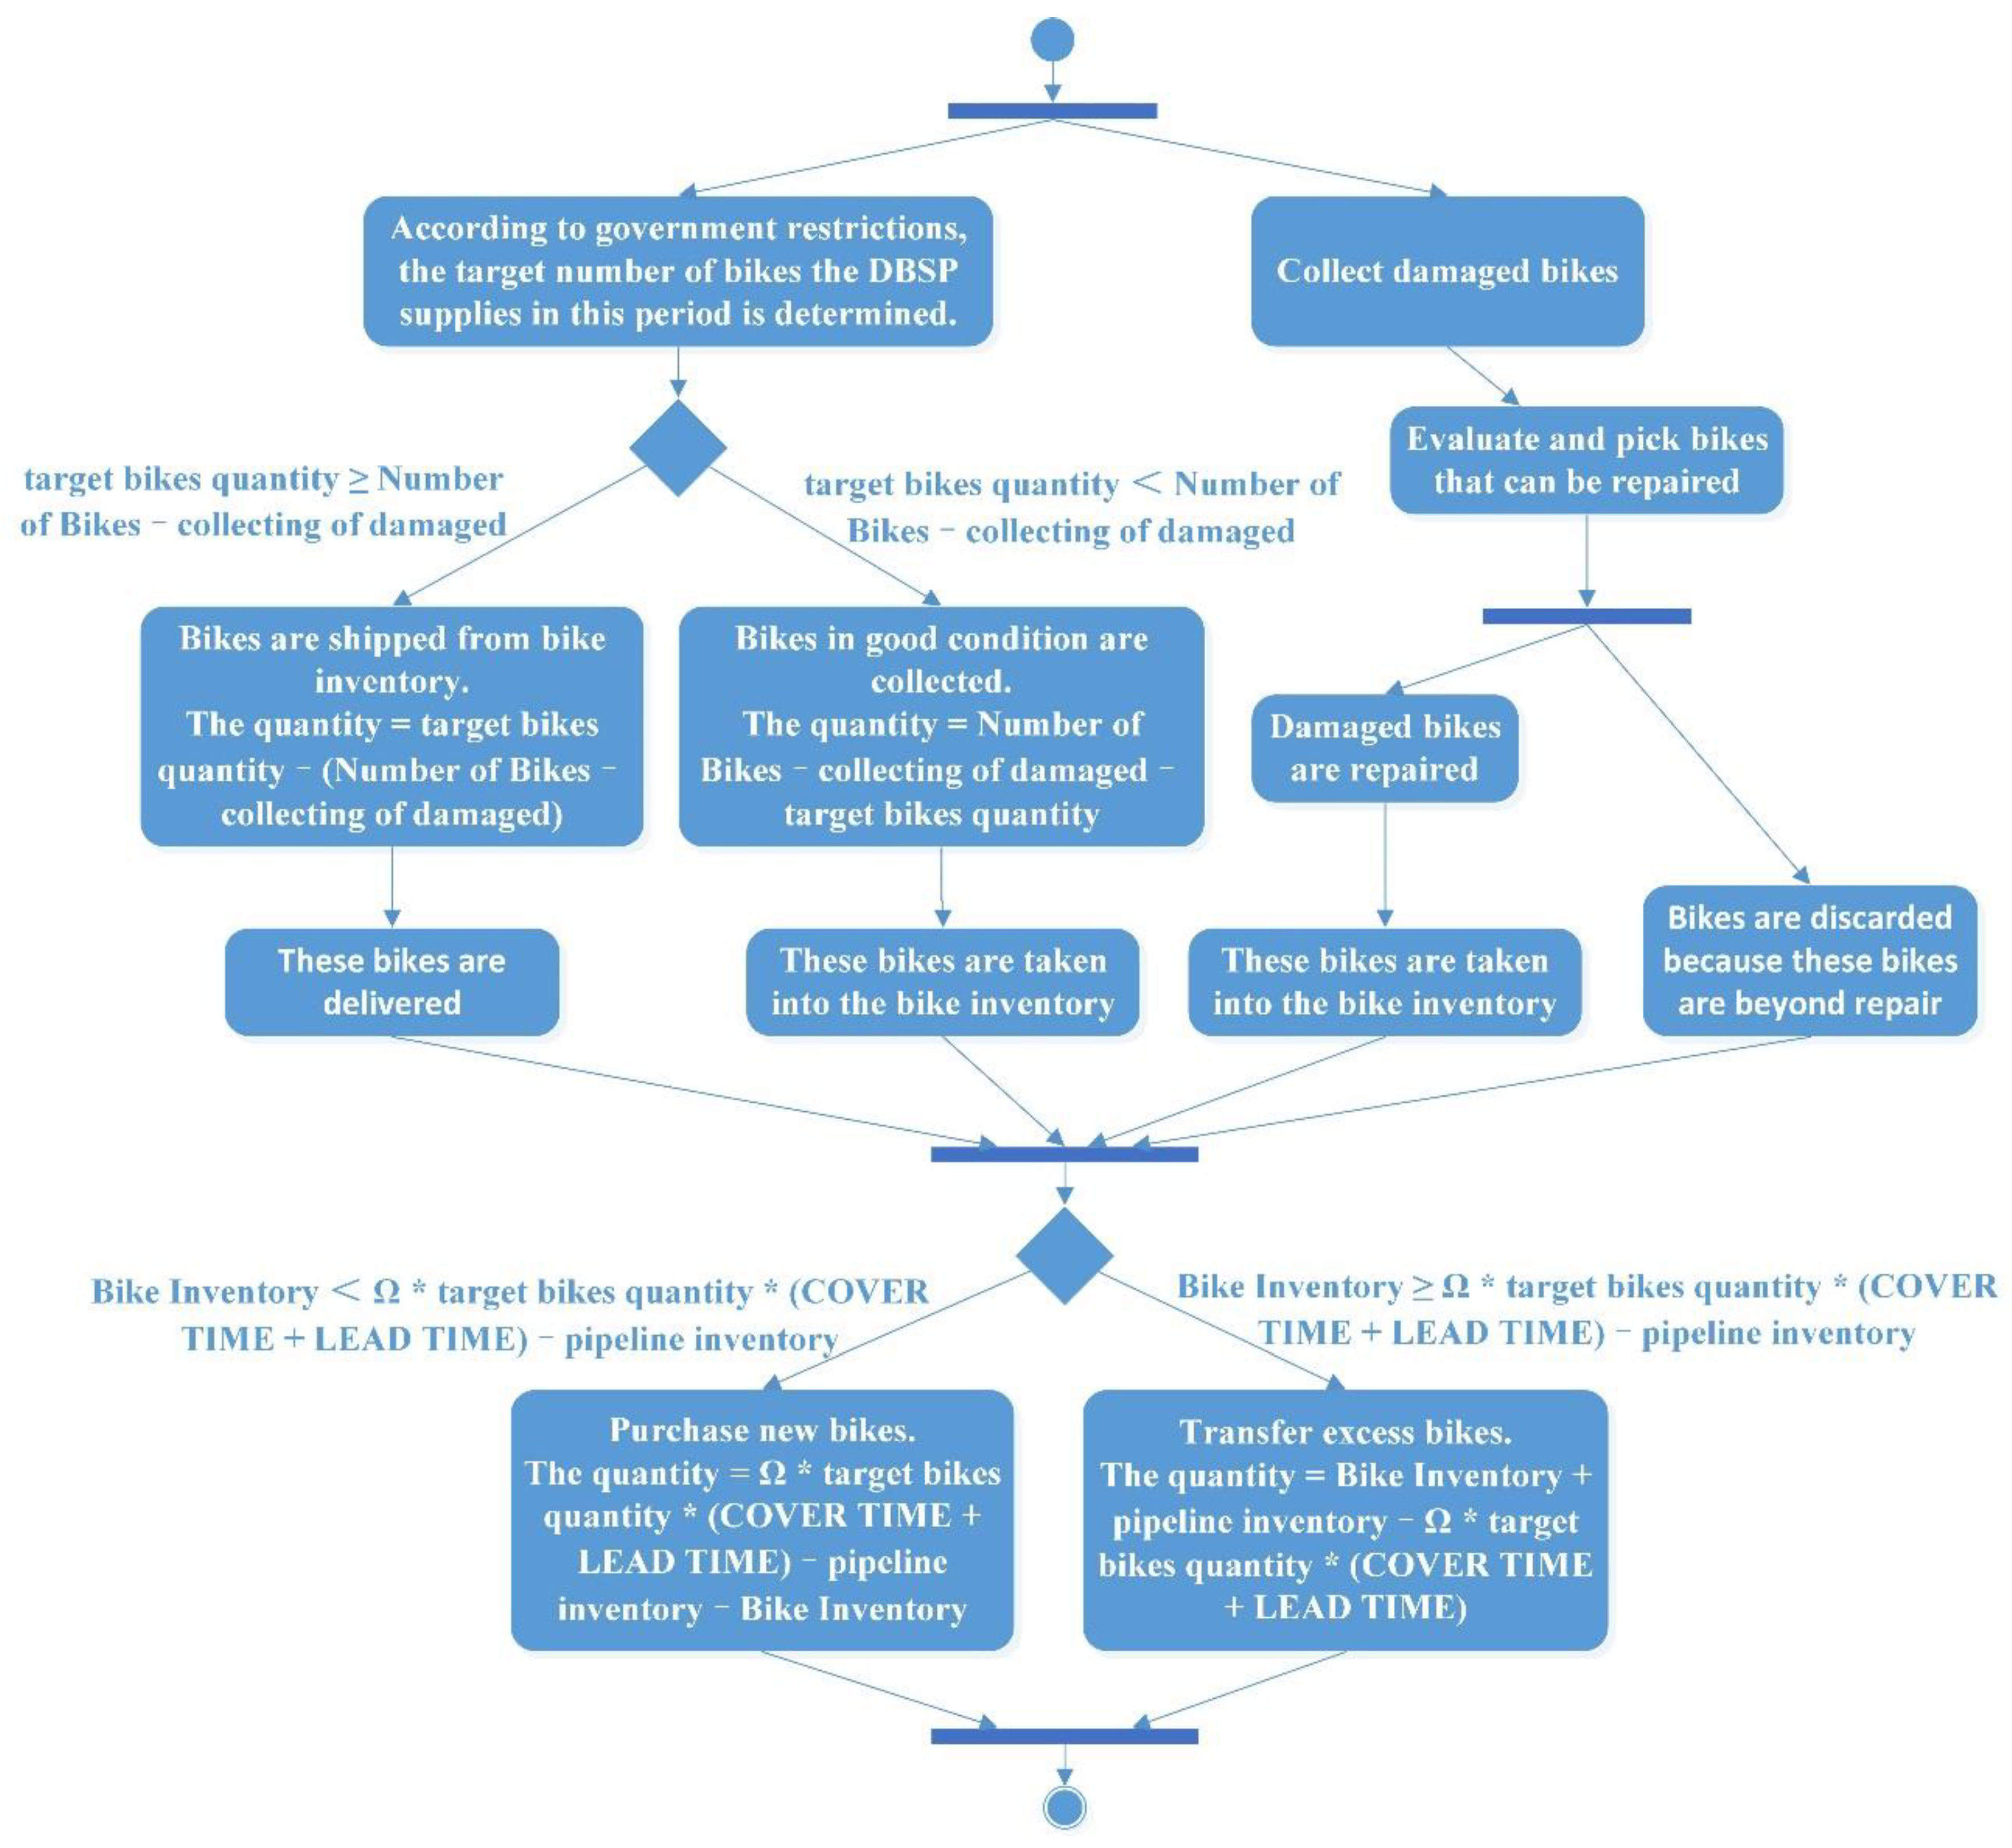
For most DBSPs, the operation and maintenance activities of the program in a period of time are shown in Figure 1. The DBSP determines the quantity to be delivered or collected based on the target number of bikes the program supplies in a period of time. At the same time, the program collects damaged bikes according to the GPS information, and repairs and discards the seriously damaged bikes [58]. Afterward, the number of bikes purchased (or transferred) is determined by the program’s inventory strategy. Without loss of generality, the traditional installation-stock policy was used in this study [59]. Ω is the stock coefficient, defined as the ratio of the inventory to be maintained to the target number of bikes in this period.
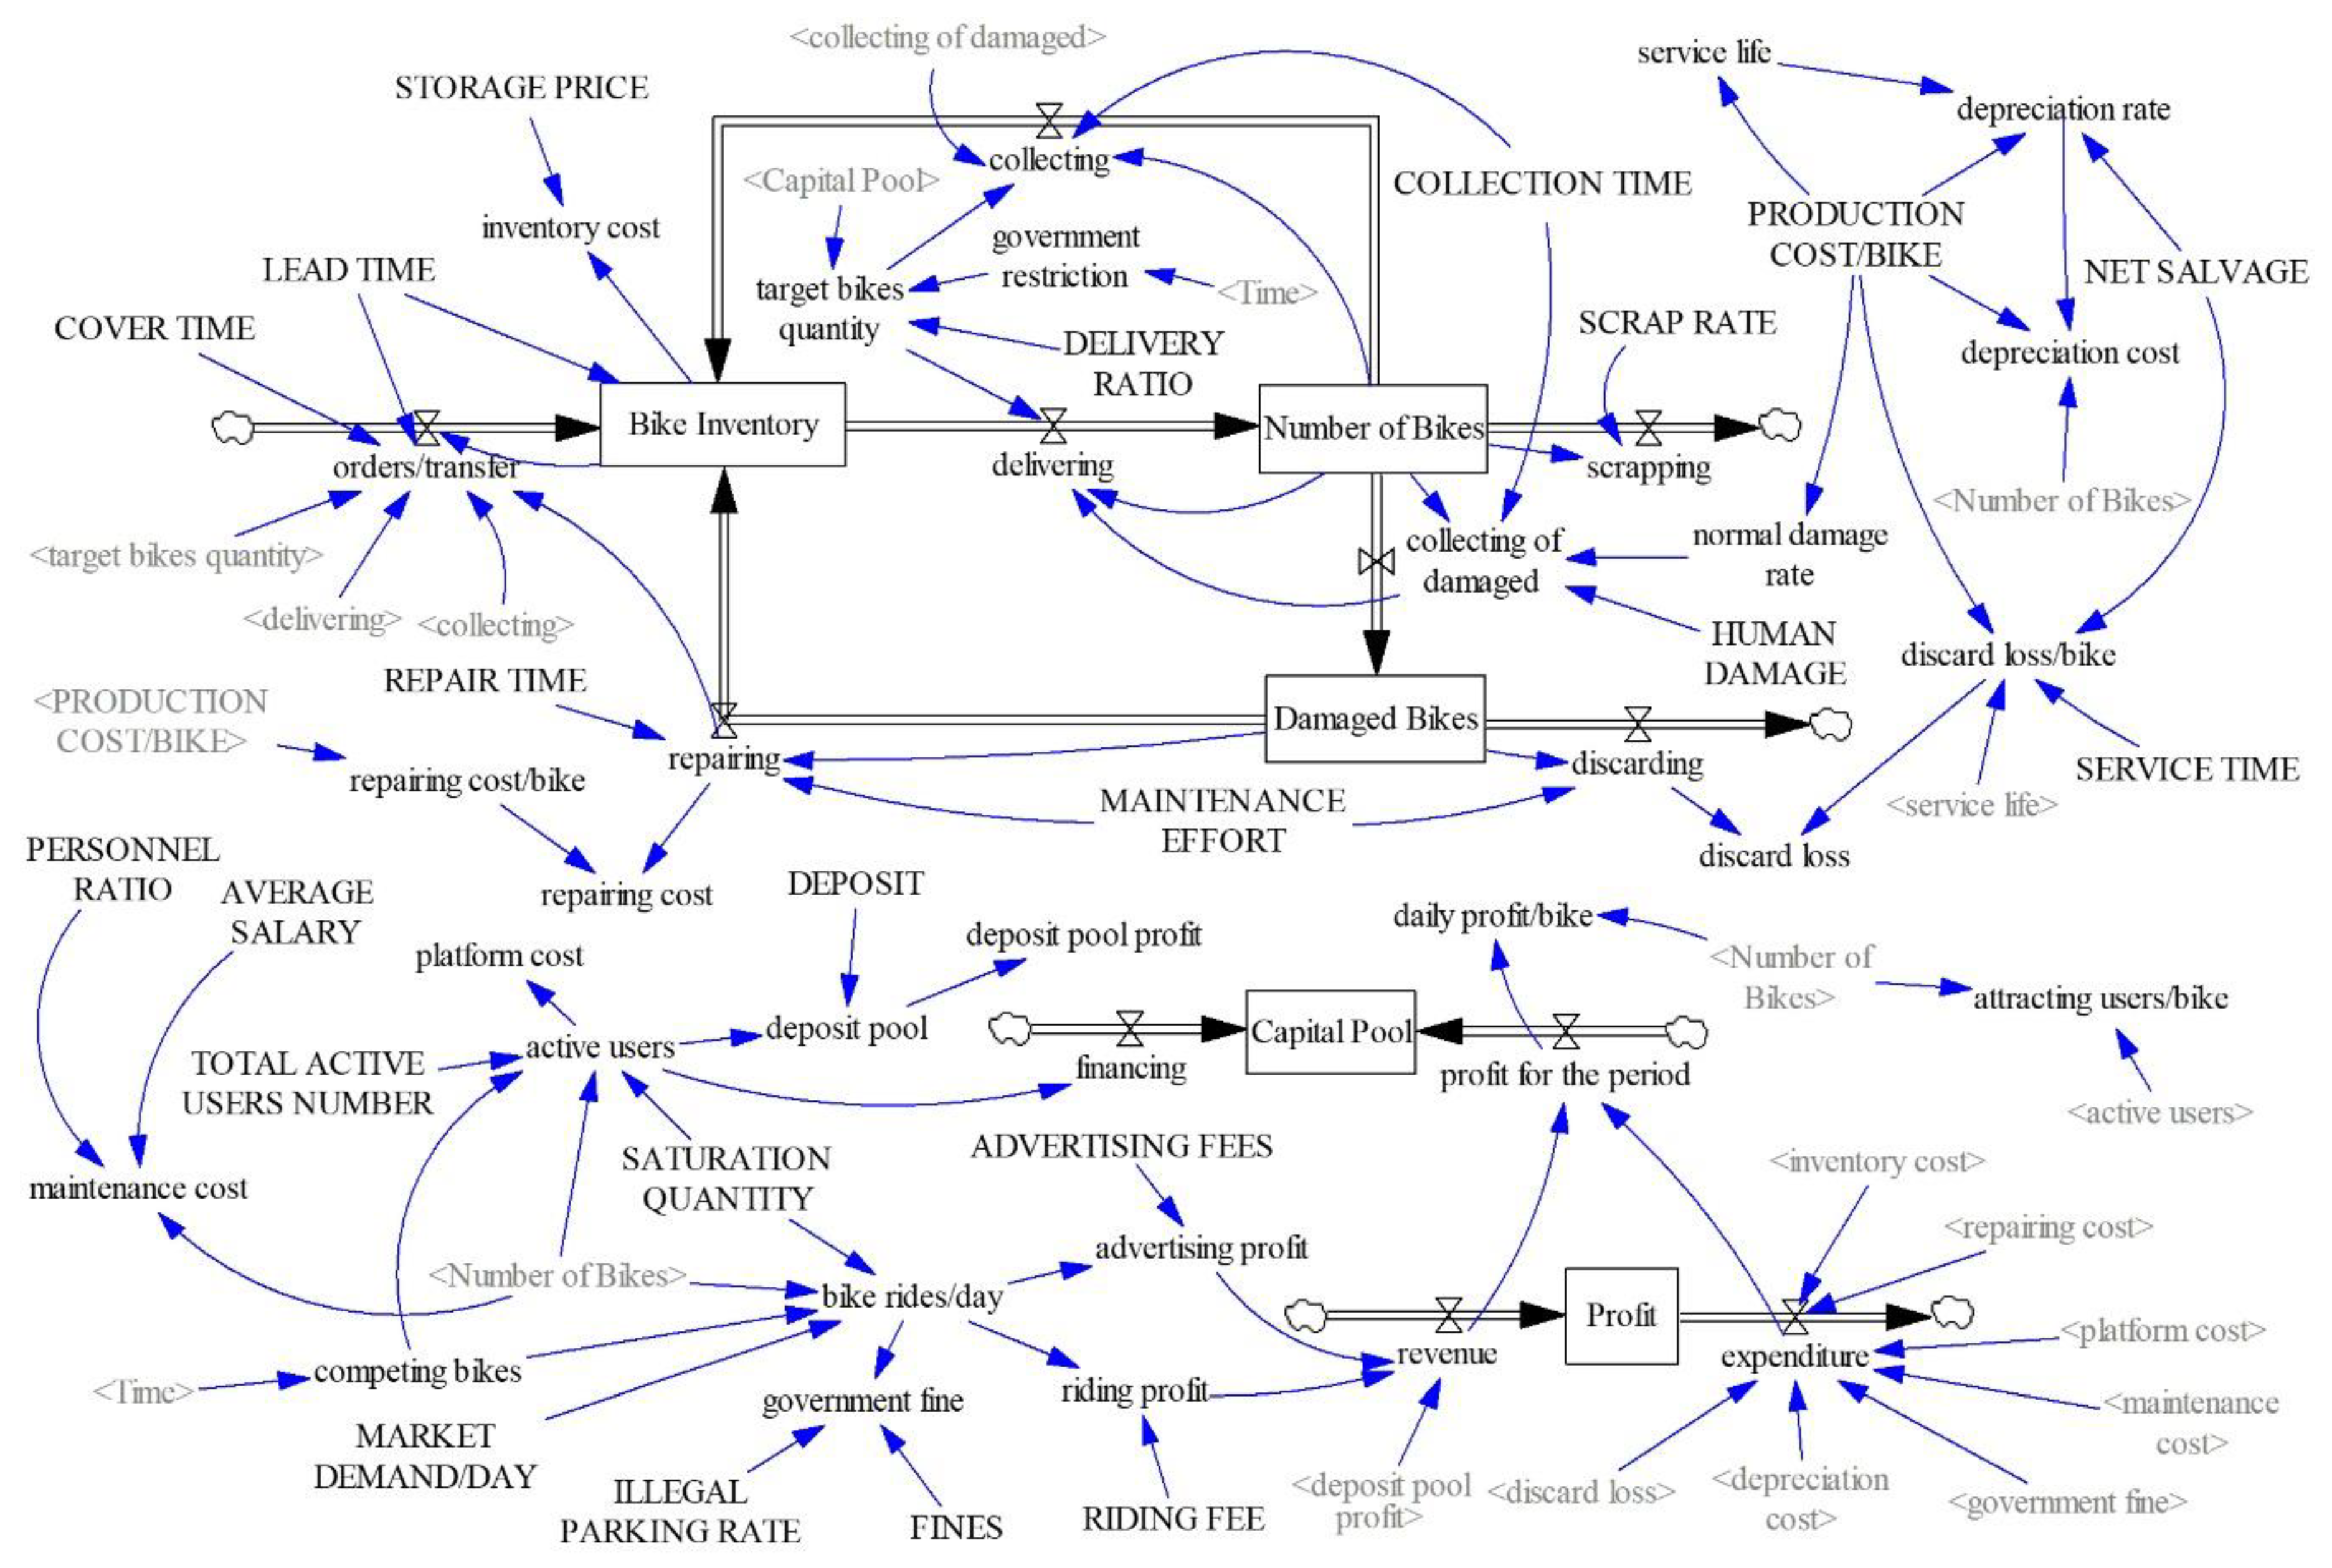
All business and social systems contain a host of assets, which can be viewed as stock or the accumulation of resources that change according to their physical inflows and outflows [60]. A system dynamics simulation model in the form of a stock and flow diagram (SFD) can be created by capturing the stock and flow structure of the systems. The SFD of a DBSP is shown in Figure 2. The rectangles represent level variables showing the cumulative results. The valves represent the rate variables showing the physical flows of items feeding into or depleting. The diagram presents the variables used for modeling the DBSP and the causal relationships or links among them.
The model description begins with the DBSP’s operation and maintenance activities. The DBSP first determines the target number of bikes (target bikes quantity) in this area based on the local government restriction. The operation of the DBSP should be carried out under government regulation to maintain traffic order [48]. After that, considering that the bikes have a certain percentage of damage (HUMAN DAMAGE and normal damage rate) in each period, the DBSP determines the number of bikes delivered and collected (delivering and collecting) to ensure that the total number of bikes the DBSP supplies (Number of Bikes) satisfies the target bikes quantity in the period. At the same time, the DBSP needs to spend COLLECTION TIME to collect all of the damaged bikes (collecting of damaged).
Maintenance effort is expressed as the proportion of repairs to the damaged bikes. It takes an amount of time (REPAIR TIME) and repairing cost for the repair of damaged bikes. Several bikes (discarding) are beyond repair and these bikes will be discarded. The loss caused by discarding a bike is represented by the discard loss/bike. The higher the production cost per bike (PRODUCTION COST/BIKE), the greater the cost of repair per bike (repairing cost/bike), and the greater the discard loss/bike [61]. The discard loss is generated by the NET SALVAGE of a bike, the discarding and the discard loss/bike.
The number of bikes in good condition are stored as Bike Inventory. Assume that the installation-stock policy is used by the DBSP. In other words, the target Bike Inventory is computed by extending the demand forecasts over the LEAD TIME plus the inventory COVER TIME [59]. When the sum of the on-hand inventory and the pipeline inventory is lower than the target Bike Inventory, orders need to be issued to ensure that there are enough bikes to be delivered in the next period. When the sum of the on-hand inventory and the pipeline inventory is greater than the target Bike Inventory, a certain number of excess bikes need to be transferred to other areas. At the same time, the Bike Inventory leads to the inventory cost, which is influenced by the price of the warehouse (STORAGE PRICE).
After that, due to the daily use and maintenance of bikes, several important expenditures will be incurred. These are the maintenance cost, the government fine, and the depreciation cost. One factor that affects the maintenance cost is the labor cost. This factor can be expressed as the AVERAGE SALARY of the maintenance personnel. The ratio between the number of maintenance personnel required and the total number of bikes the DBSP supplies is the PERSONNEL RATIO. However, due to traffic disturbance caused by illegal parking, the local government will control this phenomenon in the area by fining (government fine) the DBSP.
The life of the bike (service life) is directly related to the production cost per bike (PRODUCTION COST/BIKE). As the bikes can be considered as fixed assets of the DBSP [62], the depreciation rate of the bikes is determined by the PRODUCTION COST/BIKE, the service life, and the NET SALVAGE of the bikes [63]. Then, the depreciation cost of the bike in each period can be generated. The DBSP scraps the bikes that have reached the end of their service life. The SCRAP RATE is defined as the percentage of bikes whose service life has expired in the quantity being supplied.
Next, the DBSP’s revenues are described. In a competitive environment, the DBSP’s market share can be expressed by the number of active users and the total number of bike rides per day (bike rides/day) in a certain area. In order to model the competitive activity, the Selten Fair Reward Combination [64] was applied to obtain these values.
In Equation (1), represent the number of bikes (Number of Bikes) supplied by each DBSP in a certain area. can represent the number of active users or the number of bike rides/day for each DBSP. If the sum of Number of Bikes for all DBSPs is greater than or equal to the saturation quantity of bikes required by users (SATURATION QUANTITY) in the area, the sum of is the total number of active users (TOTAL ACTIVE USERS NUMBER) or the total number of the market demand bike rides per day (MARKET DEMAND/DAY). Otherwise, the sum of will be reduced by the ratio of the sum of the Number of Bikes for all DBSPs to the SATURATION QUANTITY.
Each active user needs to register and pay a DEPOSIT, which forms a deposit pool. The deposit pool was used by the DBSP for some financial investment and wealth management activities to obtain the deposit pool profit. The platform cost increases as the number of active users increases. At the same time, the number of active users is used as a measure of investment, which is positively correlated to the financing the DBSP receives. The financing flows into the Capital Pool. The user is required to pay the RIDING FEE when using the bike, and the DBSP obtains the riding profit. Furthermore, the DBSP can add some advertising in the application to obtain the advertising profit.
Finally, the DBSP’s revenue includes deposit pool profit, advertising profit, and riding profit. The DBSP’s expenditure includes inventory cost, maintenance cost, discard loss, repairing cost, platform cost, government fine, and depreciation cost. The DBSP’s profit is controlled by revenue and expenditure, and the Profit is used to measure the program’s overall profitability. The daily profit per bike (daily profit/bike) and the number of users attracted per bike (attracting users/bike) are used to observe the average profitability of each bike. The Capital Pool is controlled by financing and the profit of the DBSP in the period of time (profit for the period). When the Capital Pool collapses, the DBSP will withdraw from the regional market, which means that the target bikes quantity is equal to zero.
3.2. Mathematical Formulation
The mathematical equations followed the conventions of the software Vensim DSS v5.6a (Ventana Systems Inc.), which was used to implement our simulation. The main formulas and significant functional relationships of the SFD are enumerated as follows. The expressions for the rest of the basic formulas in the model are given in Appendix B.
The dynamic behavior of the level variables Bike Inventory, Number of Bikes, Damaged Bikes, Capital Pool, and Profit is represented by a time integral of the net inflows minus the net outflows. For example, Bike Inventory (BI) is defined by a time integral of the net inflow orders/transfer (o), collecting (col), and repairing (rep) minus the net outflow delivering (del). Negative values indicate the opposite direction of flow. The number of bikes purchased or transferred is available for storage in BI after a period of time from the issue (LEAD TIME (LT)). In order to model this process, the function DELAY1 was used. This function returns the value of the inputs o delayed by the LT:
A similar equation defines the total number of bikes the DBSP supplies (Number of Bikes (NB)) in the model. NB is defined by a time integral of the net inflow delivering (del) minus the net outflow collecting (col), collecting of damaged (cod), and scrapping (scr):
An IF THEN ELSE function is used to define the target bikes quantity (tbq) in the process. When the Capital Pool (CP) is less than or equal to 0, the DBSP will be forced to withdraw from the market. That means that the tbq is equal to 0. Otherwise, tbq is equal to the government restriction (gor) multiplied by the DELIVERY RATIO (DER), 0 < DER < 1, so that the tbq cannot be greater than the gor:
In order to formulate the delivering (del), the function is used again:
The repairing (rep) is formulated using Damaged Bikes (DB), MAINTENANCE EFFORT (MAE), and REPAIR TIME (RET). The DBSP lays down the MAE. The MAE is often determined by a number of parameters such as the technique of inspecting and repairing damaged bikes [61]. Furthermore, the DELAY1 function is used due to the time (RET) required to repair the bike:
The straight-line depreciation method was applied to compute the depreciation rate (dep). This method not only considers the bike service life (sel) and PRODUCTION COST/BIKE (PRC), but also considers the residual value of bike waste recycling and the cleaning costs that must be paid when it is discarded [63]. The sum of these two values is the bike NET SALVAGE (NES):
Then, the depreciation cost (dco) is formulated using the PRC, Number of Bikes (NB), and dep:
The bike rides/day (bir) can be represented as a function of Number of Bikes (NB), competing bikes (cob), SATURATION QUANTITY (SAQ), and MARKET DEMAND/DAY (MAD). Specifically, in this case, the Selten Fair Reward Combination [64] is used to more accurately define the bir in the process. However, only when the sum of the NB of each DBSP is greater than or equal to the SAQ, the sum of the bir of each DBSP is equal to the MAD. At this time, the market is saturated. This means that even if the sum of the NB of each DBSP is increasing, the sum of the bir remains the same. Otherwise, the ratio of the sum of the bir to the MAD is equal to the ratio of the sum of the NB to the SAQ. This is the reason for introducing the IF THEN ELSE function. In order to make readers understand better, Equations (9) and (10) were not further simplified:
A similar function defines the number of active users (acu) of the DBSP. The acu can be formulated using the NB, cob, SAQ, and TOTAL ACTIVE USERS NUMBER (TAU):
3.3. Model Validation
A series of tests were used to validate the simulation model before conducting any analysis with the model. Following the rules proposed by Barlas [65], structure-oriented behavior tests were used to validate the model, i.e., structural validation was performed using sensitivity analysis. Based on the result of the sensitivity analysis, we identified that the changes in the dynamic behavior patterns of the model resulting from changes in the value of particular parameters fairly accurately corresponded to the available knowledge of real-world systems. Accordingly, the model can be considered suitable for evaluating the potential improvement strategies of the system through a simulation of scenarios. These scenarios involve changes in the value of the parameters to which the model’s dynamic behavior patterns were found to be sensitive in the sensitivity analysis. These parameters were PRODUCTION COST/BIKE, DELIVERY RATIO, competing bikes, and government restriction.
4. Model Simulation
In order to assess the universality and robustness of the developed generic model, a case study of a DBSP was adopted in this study. Moreover, we proposed some potential improvement strategies to make the DBSP sustainable through this case study. The DBSP’s behaviors in an area were given realistic data for specific exogenous variables. The DBSP employed as a case study was Mobike in the selected area of Beijing. The reasons for choosing Beijing were as follows: (1) There is fierce competition in this area where the focus is on business and large-scale investment by each DBSP; (2) Beijing is the capital of China so the DBSPs are under strict government regulation; and (3) most of the real data for this area is given. The purpose of simulating this model was to find the rules of the bike-sharing market that can be applied to many other bike-sharing markets around the world. The Beijing bike-sharing market description is first given in Section 4.1. Next, the corresponding different strategies are analyzed and discussed in Section 4.2.
4.1. Situation of the Beijing Bike-Sharing Market
Mobike was founded in 2015. Over the next three years, this DBSP has grown rapidly, and its total financing amounted to 17.1 billion yuan [66]. However, it relied too much on financing and did not find a corresponding profit model. This DBSP was acquired by Meituan in April 2018. The total daily loss was as high as 15.65 million yuan, and the average daily loss per bike was 2.2 yuan [67]. This DBSP entered the Beijing market in September 2016 and its main competitor is Ofo. About 90% of shared bikes in Beijing are delivered by these two DBSPs [68]. The ratio of Mobike to Ofo bikes delivered is about 0.71. The ratio of active users is about 0.63 [69]. The ratio of monthly bike rides is about 0.65 [70]. These data support assumption (2) to some extent.
The data collected were mainly regarding the operation of Mobike in Beijing from September 2017 to June 2018. Since the large-scale delivery of shared bikes in Beijing in April 2016, the number of shared bikes reached 2.35 million in September 2017. The government began to regulate the number of deliveries of shared bikes by setting a ceiling of 1.91 million for the number of shared bikes [68]. At the same time, because Meituan applied for listing in June 2018, a large number of Mobike’s operation data flowed out. All of these factors contributed to the selection of this time period.
In addition, the Beijing government also regulates the DBSPs as follows: (1) The user deposit is deposited in the designated bank account and the interest generated is not attributed to the DBSP [71]; (2) The ratio of maintenance personnel to the number of deliveries shall not be less than 5‰ [72]; (3) Bike body advertising is prohibited [73]; (4) The government scraps shared bikes that have been in use for three years [74]; and (5) The government penalizes illegal parking [75].
The parameters required for the model and the source of the initial values came mainly from the National Information Center, Beijing Statistics Bureau, Beijing Planning Institute, reports from relevant data agencies, government announcements, and Meituan. This information included a lot of numerical data associated with Beijing’s bike-sharing market such as the market demand, the saturation quantity of shared bikes, and other relevant information, which helped this study to develop a comprehensive and accurate system model. The simulation time was set for nine months and the simulation cycle was set to 0.5. Moreover, two lookup functions were introduced into the model to formulate the variables government restriction and the competing bikes, which assumes that the change between months is linear and the total number of shared bikes supplied by each DBSP is adjusted in the same proportion. The simulation analysis involved the use of several assumptions related to the values of the model parameters. The selection of the assumed values corresponded as much as possible to meaningful concepts in the real world. Nevertheless, these parameter values are not as important as an understanding of the changes in the behavior of the system under different scenarios. Table A2 presents the initial values of the simulation used in the SD model, which is shown in Appendix C.
4.2. Analysis and Discussion
(1) Factor of government regulation for government restriction (gor) and competing bikes (cob)
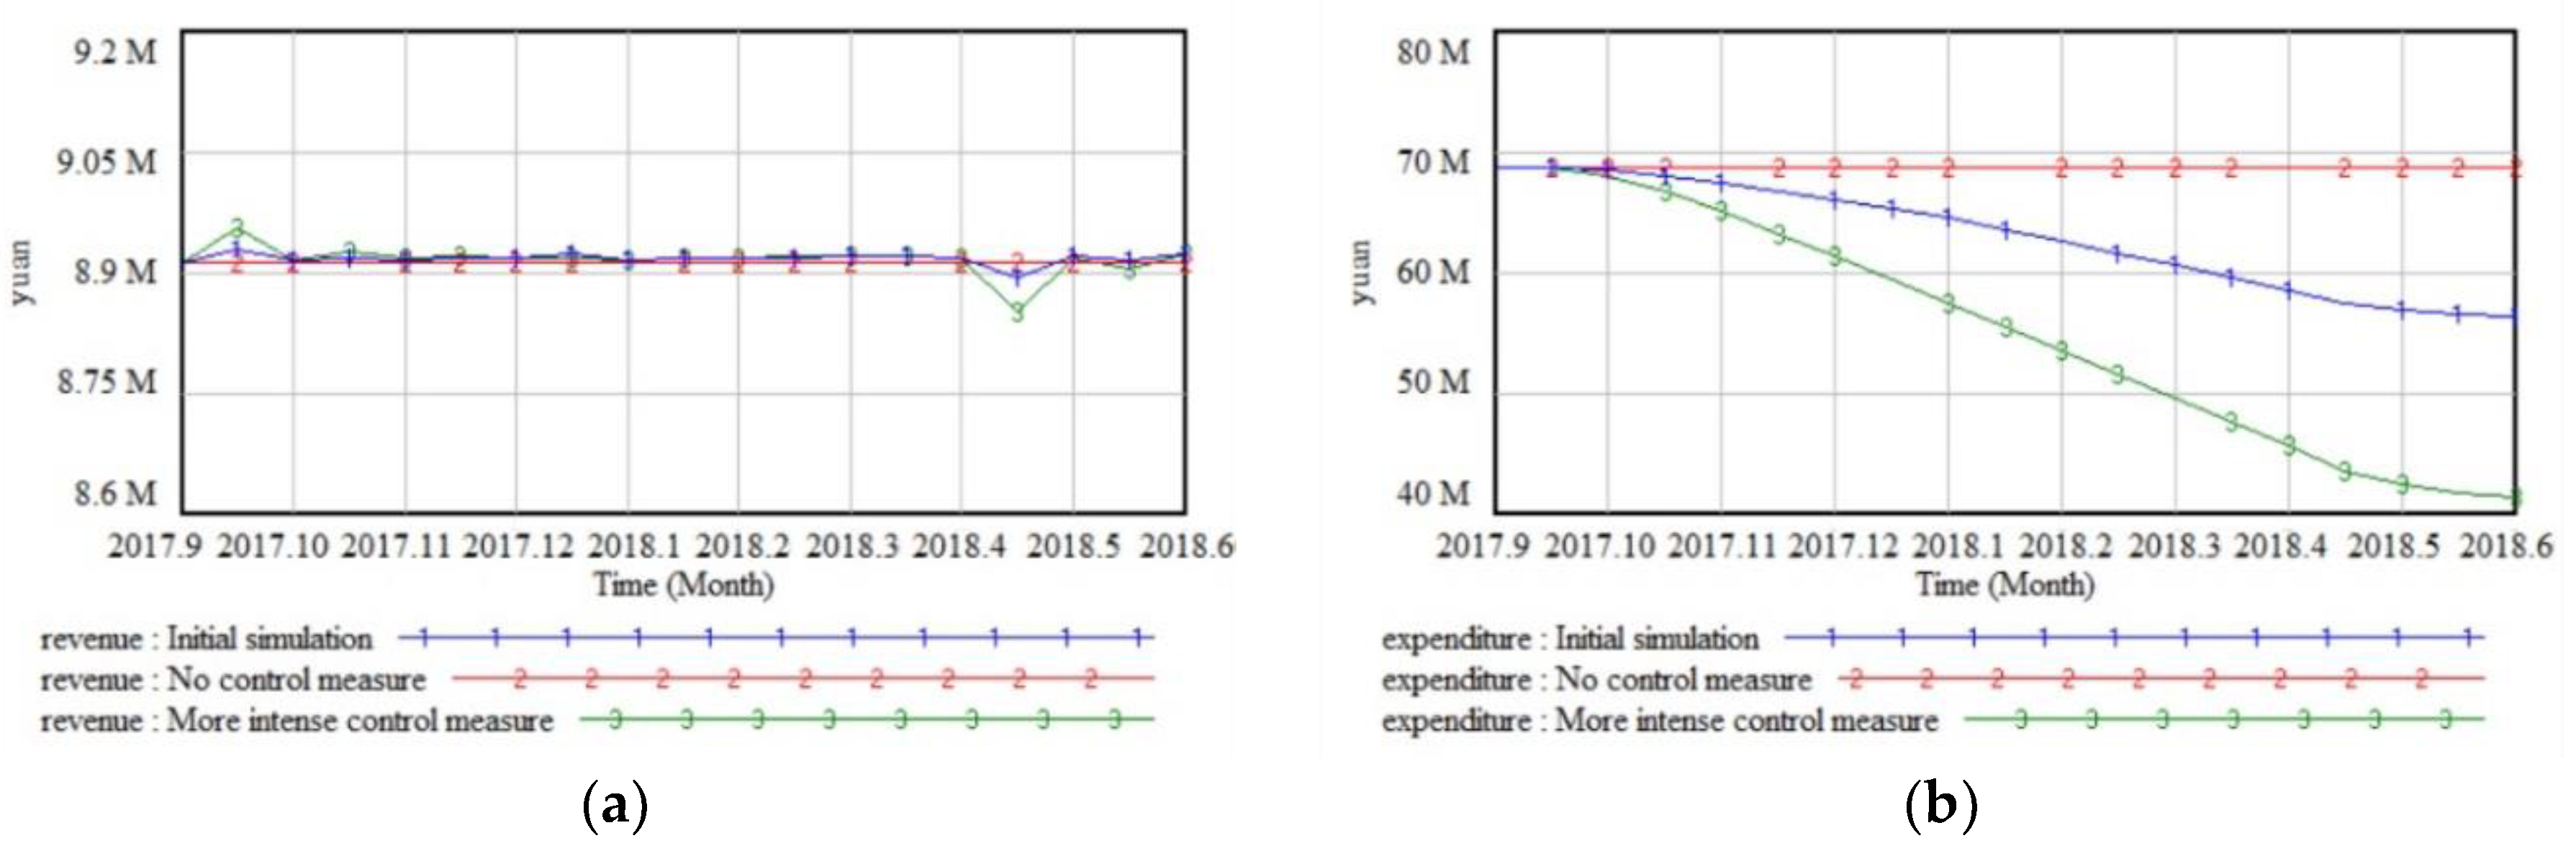
In the following simulation, we changed the value of the government regulation factor for the DBSPs in this situation. The value of government restriction (gor) was set up as per III and V of Appendix C. The value of competing bikes (cob) was set up as per IV and VI of Appendix C. In other words, the Beijing government began to regulate the industry in September 2017, and the maximum number of shared bikes was determined in April 2018. III and IV correspond to the government not implementing any control measures. V and VI correspond to the government taking more intense control measures to ensure that the total number of shared bikes in the market is equal to the SATURATION QUANTITY. We ran the simulation respectively and obtained the results. The curves of the revenue and expenditure of different values of gor and cob are shown in Figure 3. According to Figure 3, the revenue of the DBSP remained basically unchanged. However, the expenditure of the DBSP was 56.3, 68.7, and 41.4 million yuan in June 2018 when the government adopted different policies.
From the simulation results, we can draw the following implication. For a highly competitive bike-sharing market, the government cannot allow itself to compete on its own. The government needs to adopt a series of controls on the market to prevent market efficiency losses. The reason is that the DBSPs will not generate more market demand even if they deliver more shared bikes after the number of shared bikes in the market reaches the SATURATION QUANTITY. On the contrary, there will be additional costs for all DBSPs. It also causes a waste of social resources and traffic safety issues. The results verified the conclusions of the extant literature [48].
(2) Factor of PRODUCTION COST/BIKE (PRC)
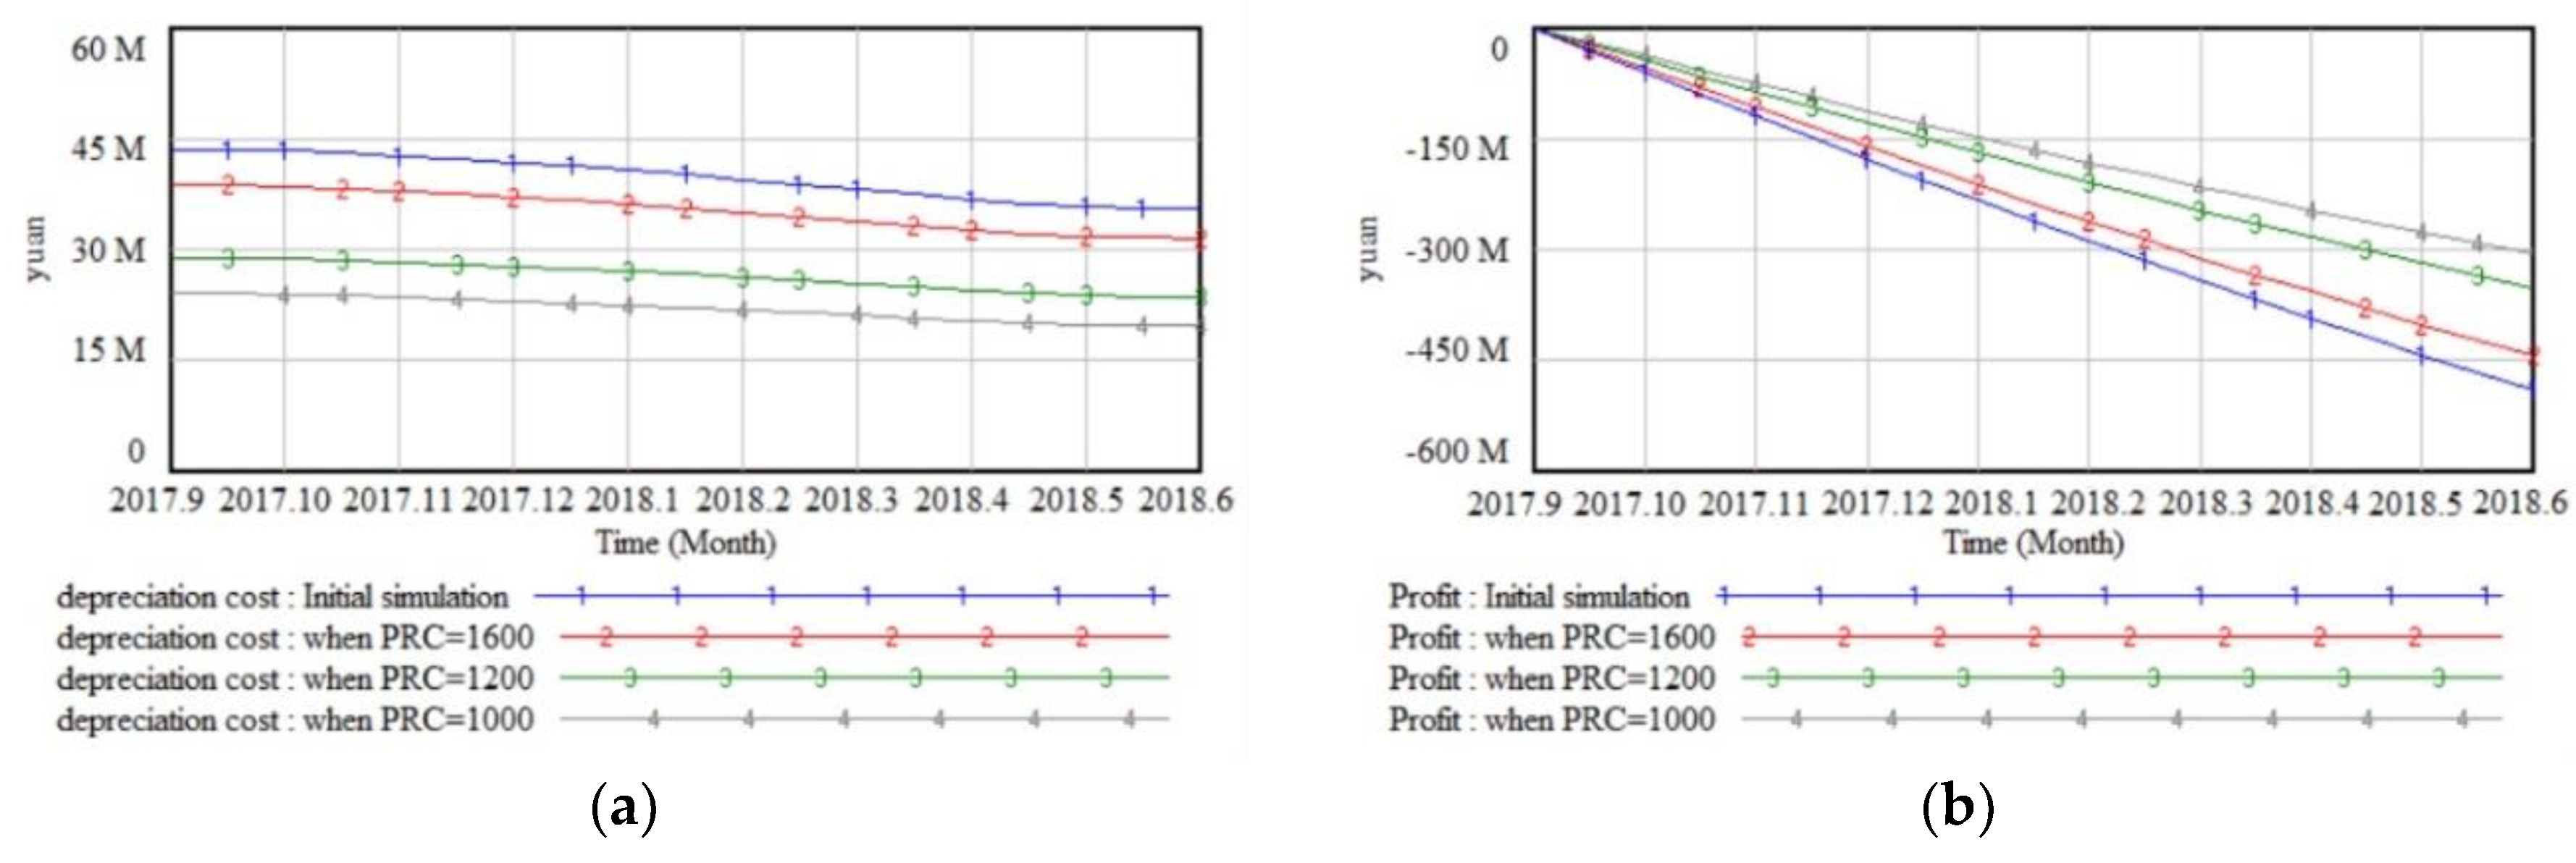
In the following simulation, we changed the value of the factor PRODUCTION COST/BIKE (PRC). The value was set as 1600, 1200, and 1000. The reason for choosing these values is that the latest shared bike production cost of Mobike has been reduced to 1000 yuan while the service life and the normal damage rate has remained the same. This means that the DBSP’s average shared bike production cost will gradually decrease. Again, we ran the simulation respectively and obtained the results. The curves of the depreciation cost and Profit of different values of PRC are shown in Figure 4. According to Figure 4, the depreciation cost of the DBSP was 35.5, 31.6, 23.6, and 19.6 million yuan in June 2018 when the value of PRC was 1800, 1600, 1200, and 1000, respectively. The Profit was -490.3, -444.4, -352.9, and -307.0 million yuan, respectively.
From the simulation results, we can draw the following implication. For a DBSP, the depreciation cost of the shared bike is a huge expense. This cost can account for 63% of the total expenditure each month and is directly determined by PRC. The DBSP should maintain continuous research and development of new materials and techniques for sharing bikes. This allows the DBSP to reduce the PRC of the shared bike while maintaining the same quality. At the same time, the DBSP’s PRC should be adapted to the local government’s requirements for bike life limitations. For example, the shared bike life superior limit set by the Beijing government is three years. Excessive PRC can lead to unnecessary costs. Therefore, the changing values of PRC have important impact effects on the Profit.
(3) Factor of DELIVERY RATIO (DER)
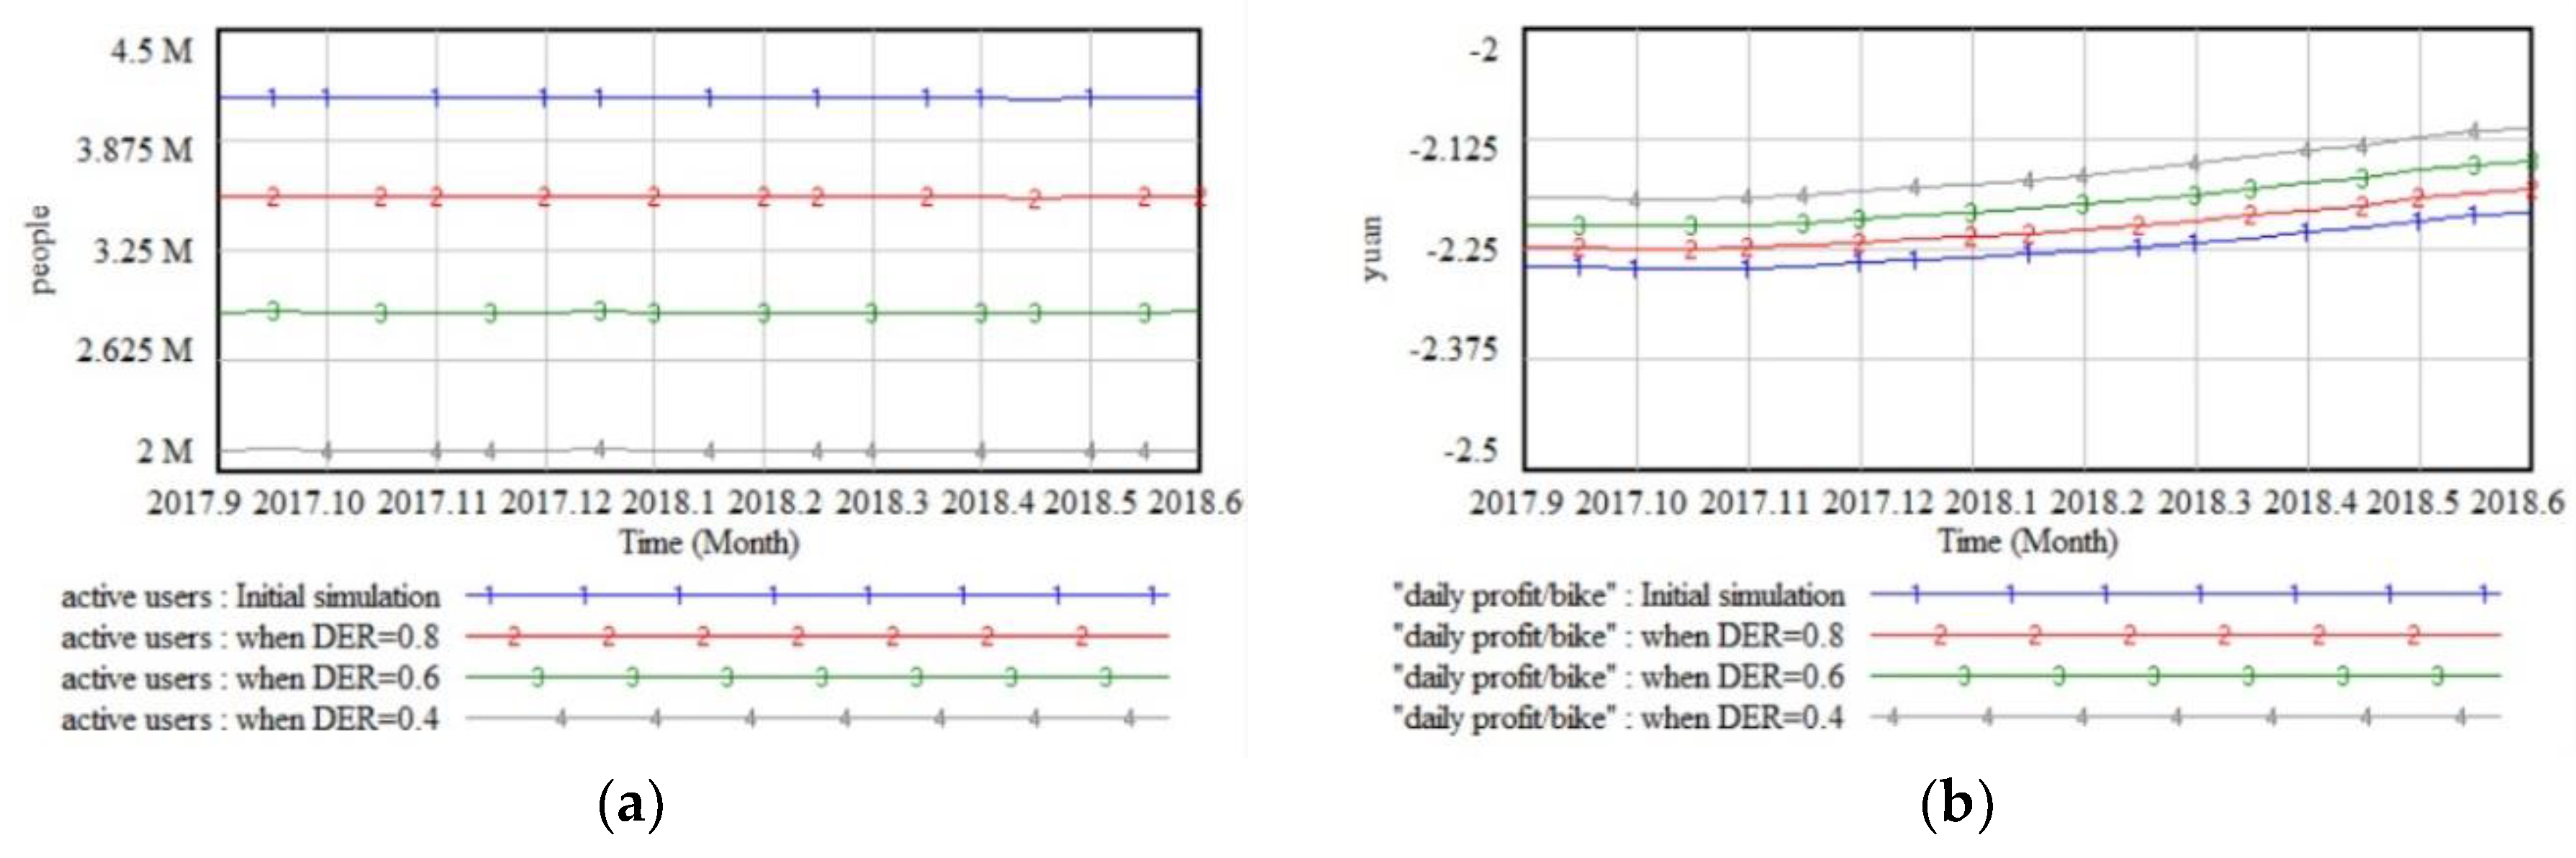
In the following simulation, we changed the value of the factor DELIVERY RATIO (DER). The value was set as 0.8, 0.6, and 0.4. The initial values of the level variables were modified accordingly. In other words, the DBSP did not deliver the shared bikes to the market to the greatest extent. We ran the simulation respectively and obtained the results. Each of the daily profit/bike values were obtained in each simulation. The curves of the active users and daily profit/bike of different values of DER are shown in Figure 5. According to Figure 5, the active users of the DBSP was 4.1, 3.6, 2.9, and 2.1 million people in June 2018 when the value of DER was 1, 0.8, 0.6, and 0.4, respectively. However, the daily profit/bike was −2.20, −2.18, −2.15, and −2.11 yuan, respectively. The more active users the DBSP has, the lower daily profit/bike the DBSP becomes.
From the simulation results, we can draw the following implication. Even if a DBSP occupies a sufficient market share, its operating costs will not be significantly reduced and the marginal cost of adding more active users will not decrease. This is unlike other shared economic industries [30,31]. Additionally, as there is fierce competition in the market, the DBSP’s average cost will increase in order to keep the user scale growing. Therefore, the DBSP should look for new profit channels or reduce expenses to reduce the average cost. For example, the DBSP can take advantage of this vast amount of user data combined with other services on the platform to generate revenue and apply big data and machine learning technologies in their operations to reduce costs. If the DBSP only pursues the growth of the user scale, it will not make the DBSP sustainable.
5. Contribution and Implications
5.1. Research Contribution
First, no systematic mechanism has been developed to evaluate DBSPs. The construction of an operational model for DBSPs helps researchers explore current and future DBSP predicaments by simulating various factors. The model also provides researchers with an in-depth understanding of the government regulation factor that contributes to prevent market efficiency losses. The simulation results can be used to conduct further analyses on the change in various factors after the DBSP has introduced new technology. Researchers can compare the simulated results for various factors to evaluate potential improvement strategies [76]. This evaluation method can assist DBSPs in evaluating the effectiveness of improvement strategies, thus helping them avoid potential crises. The model of DBSPs constructed by this study could be used as a research basis for researchers carrying out future DBSP studies, thereby improving their comprehensiveness. Finally, as the model combined related theories with practices in reality as the main entry point, it could also enhance the sophistication of the DBSP research field.
Second, many DBSP studies have explored the key factors that could affect their performance. However, most of these studies have been single-level approaches exploring the impacts on one factor. For example, the difference between of the dockless bike-sharing industry and other shared economic industries has not been comprehensively examined. To address this gap, the systematic DBSP model constructed in this study considered many different levels including the market competition level, government restriction level, cost and profit computation level, and DBSP operation level. These levels were integrated to construct the model that covered them all. Furthermore, this type of integrated systematic model (compared with single-level studies of influential factors) has the added benefit of considering more important dimensions of DBSPs. It also integrates the influential factors of more dimensions that might impact their performance. Hence, this simulation approach takes a more extensive perspective on the exploration of the influential factors, thereby developing a more comprehensive DBSP model.
5.2. Managerial Implications
First, the SD simulation model of DBSPs developed in this study aimed to bridge the gap between theory and practice. It started from the point of practice by collecting large amounts of data and information to gain an understanding of the DBSP operations. We then combined related theories with DBSP practices to construct a systematic DBSP model, the purpose of which was to establish a set of management guidelines that could assist DBSP managers and regulators with DBSP implementation. This information could be used as a basis of implementation, thus enabling DBSP managers and regulators to obtain management skills and implementation knowledge. It could also guide managers as they invest resources in the most key factors for improving the performance of the system, which would allow DBSPs to maintain a balance between revenue and expenditure.
Second, many DBSPs around the world have exposed financial problems. Consequently, the effective formulation of sustainment strategies in the current social and industry environment is a focal point of interest for DBSPs. The DBSP system proposed in this study explored the key factors impacting performance, thus it could assist DBSP managers in focusing their resources on the most critical factors during implementation, thereby reducing unnecessary investments in blind pursuit of market share. Therefore, this system can help improve the performance of DBSPs and reduce the likelihood of ineffective investments.
6. Conclusions
The dockless bike-sharing industry has developed rapidly in recent years. However, issues of unsustainability have long plagued DBSPs and governments. This study examined the difficulties experienced by DBSPs in exploring the key factors affecting the sustainable development of the program. A simulation approach was conducted to model the factors, operations processes, and policies of DBSPs to assist DBSP managers and regulators in the effective management of DBSPs in the current social and industry environment. As much data and information as possible of the DBSPs involved in real-life operation activities were collected to determine the status of the business and analyze their current condition in an attempt to explore their current predicament and bottleneck [77]. The analyses showed that current DBSP difficulties have three causes: (1) high normal damage and human damage rate; (2) high production costs; and (3) increased competition due to the rapid influx of capital. This study was intended to help DBSPs grasp survival opportunities in adverse conditions: technological innovation can improve performance, look for new profit channels, reduce expenses to reduce the average cost, and facilitate the creation of new business value. Blind pursuit of market share is not conducive in enhancing competitive strength.
Therefore, in order to study the operation of DBSPs and evaluate potential improvement strategies, this study analyzed the key influencing factors that can impact the performance of a DBSP, and established a SD model for the DBSP. Systems thinking and non-linear logic analysis concepts of system dynamics were applied to construct the SFD of the DBSPs’ operational difficulties that reflected the actual situation. This can be used to identify the most effective solution, which could be applied in combination with policy simulation tests to address the DBSPs’ difficulties and performance issues. According to the simulation of the model with the case of the Mobike operation in Beijing, we found that the government needs to intervene in the bike-sharing market to improve the allocation efficiency of market resources. Allowing free competition in the market will bring adverse results to many parties. The average cost of production per bike is another influential key factor as many costs are greatly affected by this factor. Finding new profit channels or reducing expenses is important to make DBSPs sustainable. This requires the program to continuously introduce new technologies. Through the application of the model in the Beijing bike-sharing market, the model can be applied in other markets of sharing economies in cities similar to Beijing. This may also provide some implications to the program and the government for creating policies. To improve this study’s DBSP system, we recommend incorporating more data from other sectors as well as continued corrections and reinforcement of the model and the identified influential factors.
This paper notes some limitations that need to be improved upon. First, some real data were not available, so some assumptions were made in this study. Second, it focused on the operation of DBSPs from the perspective of system. The impact of several additional factors on some variables was ignored and a few variables were considered as exogenous variables. Future research could follow three avenues. First, more realistic factors such as consumer preference and environment could be considered to generate a more scientific and accurate simulation of the DBSPs operations. Second, researchers could study the comparison between DBSPs and dock bike-sharing programs to find out which of the two business models would be more competitive. Third, the proposed model could be put through repeated analyses and parameter adjustments in a continuous improvement process to produce the most widely applicable systematic model. We will continue to study the ways in which to maintain a balance between revenue and expenditure for DBSPs in the future.
Author Contributions
T.Y. and Y.L. conceived and designed the experiments; Y.L. and S.Z. performed the experiments; T.Y. and S.Z. analyzed the data; and Y.L. wrote the paper.
Funding
This research was funded by the National Natural Science Foundation of China (No. 71001010).
Conflicts of Interest
The authors declare no conflict of interest.
Appendix A

Table A1.
Variable list.
| Variable | |
|---|---|
| Rate Variable | |
| financing | The financing from the market in a certain area |
| revenue | The revenue of the DBSP |
| expenditure | The expenditure of the DBSP |
| Auxiliary Variable | |
| service life | The service life of bikes |
| discard loss/bike | The average discard loss per damaged bike |
| normal damage rate | The normal damage rate of bikes |
| repairing cost/bike | The average repairing cost per damaged bike |
| daily profit/bike | The daily profit per bike |
| attracting users/bike | The number of users attracted per bike |
| Exogenous Variable | |
| COVER TIME | The parameter that determines the amount of inventory held |
| LEAD TIME | The time between issuing the order and receiving bikes |
| SERVICE TIME | The average service time of the discarded damaged bikes |
| STORAGE PRICE | The price of the warehouse used for storing bikes |
| COLLECTION TIME | The time the DBSP spends on collecting bikes |
| SCRAP RATE | The percentage of the bike service life expiration |
| HUMAN DAMAGE | The percentage of the bikes damaged by humans |
| PERSONNEL RATIO | The ratio of the number of maintenance personnel to the total number of bikes the DBSP supplies |
| REPAIR TIME | The time required to repair the damaged bikes |
| AVERAGE SALARY | The average salary of the maintenance personnel |
| ILLEGAL RATE | The percentage of illegal parking |
| FINES | The punishment by the local government |
| DEPOSIT | The deposit paid by the user at the time of registration |
| ADVERTISING FEE | The average advertising fee (cost per one thousand impressions) |
| RIDING FEE | The average riding bike fee |
Appendix B
All the formulas (italics represent the specific data) of SD are as follows:
- advertising profit = “bike rides/day” * ADVERTISING FEES
- “attracting users/bike” = Active Users/Number of Bikes
- Capital Pool = INTEG (financing + profit for the period, Initial Value)
- collecting = IF THEN ELSE ((Number of Bikes - collecting of damaged) > target bikes quantity, DELAY1(Number of Bikes - collecting of damaged - target bikes quantity, COLLECTION TIME), 0)
- collecting of damaged = DELAY1(Number of Bikes * (HUMAN DAMAGE + normal damage rate), COLLECTION TIME)
- “daily profit/bike” = profit for the period/Number of Bikes/ Days
- Damaged Bikes = INTEG (collecting of damaged – repairing - discarding, Initial Value)
- deposit pool = Active Users * DEPOSIT
- deposit pool profit = deposit pool * Rate of Return
- discard loss = discarding * “discard loss/bike”
- “discard loss/bike” = “PRODUCTION COST/BIKE” *SERVICE TIME/service life-NET SALVAGE
- discarding = Damaged Bikes * (1-MAINTENANCE EFFORT)
- expenditure = platform cost + inventory cost + maintenance cost + repairing cost+ depreciation cost + discard loss + government fine
- financing = Financing Coefficient * Active Users
- government fine = “bike rides/day” * ILLEGAL PARKING RATE * FINES * Days
- inventory cost = Bike Inventory/Quantity Per Square Meter * STORAGE PRICE
- maintenance cost = AVERAGE SALARY * Number of Bikes * PERSONNEL RATIO
- normal damage rate = Damaged Parameter/“PRODUCTION COST/BIKE”
- orders/transfer = Ω * target bikes quantity * (LEAD TIME + COVER TIME) + delivering – repairing – Bike Inventory - collecting
- platform cost = Active Users/Number of users served by one employee * Average salary of employees
- Profit = INTEG (revenue - expenditure, Initial Value)
- profit for the period = revenue - expenditure
- repairing = DELAY1(Damaged Bikes * MAINTENANCE EFFORT, REPAIR TIME)
- repairing cost = repairing * “repairing cost/bike”
- “repairing cost/bike” = “PRODUCTION COST/BIKE” * Repaired Coefficient
- revenue = riding profit + advertising profit + deposit pool profit
- riding profit = “bike rides/day” * RIDING FEE * Days
- service life = Life Coefficient * “PRODUCTION COST/BIKE”
- scrapping = SCRAP RATE * Number of Bikes
Appendix C
The initial values of the simulation are shown in Table A2.
Table A2.
Initial values of the simulation.
| Parameter | Value | Unit | Remark |
|---|---|---|---|
| advertising profit | 0 | yuan | No ads in the application |
| AVERAGE SALARY | 3835 | yuan/month | [78] |
| COLLECTION TIME | 0.5 | month | Assumption |
| competing bikes | I 1 | bikes | Logical inference from [67,68,79,80] |
| COVER TIME | 0.5 | month | Assumption |
| DELIVERY RATIO | 1 | Logical inference from [68,79] | |
| DEPOSIT | 299 | yuan | [81] |
| deposit pool profit | 0 | yuan | [71] |
| FINES | 2.5 | yuan | Logical inference from [82] |
| government restriction | II 1 | bikes | Logical inference from [67,68,79,80] |
| HUMAN DAMAGE | 2.5% | Logical inference from [83] | |
| ILLEGAL PARKING RATE | 2.5% | [84] | |
| LEAD TIME | 0.5 | month | Logical inference from [80] |
| MAINTENANCE EFFORT | 0.975 | Logical inference from [83] | |
| PERSONNEL RATIO | 5‰ | [72] | |
| MARKET DEMAND/DAY | 1420000 | times | [85] |
| NET SALVAGE | 12 | yuan | Logical inference from [86] |
| normal damage rate | 7.5% | Logical inference from [83,87] | |
| PRODUCTION COST/BIKE | 1800 | yuan | [88] |
| REPAIR TIME | 0.5 | month | Assumption |
| RIDING FEE | 0.56 | yuan/time | [67] |
| SATURATION QUANTITY | 1380000 | bikes | [89] |
| SCRAP RATE | 0% | Logical inference from [90] | |
| stock coefficient Ω | 0.1 | Assumption | |
| service life | 36 | months | [74,90] |
| SERVICE TIME | 18 | months | Assumption |
| STORAGE PRICE | 30 | yuan/m2/month | [91] |
| TOTAL ACTIVE USERS NUMBER | 11000000 | people | [92] |
| Italics of Appendix B | |||
| Damaged Bikes Initial Value | 87800 | bikes | Logical inference from [83,87] |
| Days | 30 | days | Calculated at 30 days a month |
| Quantity Per Square Meter | 4 | bikes | Assumption |
| Capital Pool Initial Value | 500000000 | yuan | Assumption |
| Profit Initial Value | 0 | yuan | Direct determination |
| Bike Inventory Initial Value | 87800 | bikes | Assumption |
| Financing Coefficient | 8.8 | yuan/month/user | Logical inference from [4,67] |
| Repaired Coefficient | 2.5% | [93] | |
| Average salary of employees | 12000 | yuan/month | [78] |
| Number of users served by one employee | 60125 | people | Logical inference from [67,94] |
| Number of Bikes Initial Value | 878000 | bikes | Logical inference from [67,68,80] |
1 The lookup functions are below the table.
- I. ([(0,0)-(9,2350000)], (0,1472000), (1,1464000), (2,1438000), (3,1408000), (4,1374000), (5,1331000), (6,1286000), (7,1241000), (8,1207000), (9, 1198000))
- II. ([(0,0)-(9,2350000)], (0,878000), (1,859000), (2,841000), (3,822000), (4,795000), (5,768000), (6,741000), (7,714000), (8,714000), (9,714000))
- III. ([(0,0)-(9,2350000)], (0,878000), (9, 878000))
- IV. ([(0,0)-(9,2350000)], (0,1472000), (9, 1472000))
- V. ([(0,0)-(9,2350000)], (0,878000), (1,826000), (2,775000), (3,723000), (4,671000), (5,619000), (6,568000), (7,516000), (8,516000), (9,516000))
- VI. ([(0,0)-(9,2350000)], (0,1472000), (1,1450000), (2,1379000), (3,1296000), (4,1211000), (5,1124000), (6,1037000), (7,951000), (8,886000), (9,869000))
References
- DeMaio, P. Bike-sharing: History, impacts, models of provision, and future. J. Public Transp. 2009, 12, 3. [Google Scholar] [CrossRef]
- Sina Finance. Shared Bikes Report: Global Users Have Reached 227 Million. Available online: http://finance.sina.com.cn/roll/2018-03-07/doc-ifxyahxt7133568.shtml (accessed on 7 March 2018).
- Shi, J.-G.; Si, H.; Wu, G.; Su, Y.; Lan, J. Critical factors to achieve dockless bike-sharing sustainability in China: A stakeholder-oriented network perspective. Sustainability 2018, 10, 2090. [Google Scholar] [CrossRef]
- Sina Finance. A Picture to See Meituan Acquire Mobike. Available online: http://finance.sina.com.cn/chanjing/gsnews/2018-04-07/doc-ifyteqtq5141525.shtml (accessed on 7 April 2018).
- Ifeng News. Ofo Evacuation from Australia: Sydney Users Average 0.3 Times a Day. Available online: http://news.ifeng.com/a/20180711/59119593_0.shtml (accessed on 11 July 2018).
- Sina Finance. US media: Ofo Will Fully Withdraw from the Seattle mArket, Only $3 per Car. Available online: http://finance.sina.com.cn/chanjing/gsnews/2018-08-16/doc-ihhvciiv9270159.shtml (accessed on 11 August 2018).
- Sina Finance. Encounter Extensive Destruction and Theft, Mobike Decided to Give Up the Manchester Market. Available online: http://finance.sina.com.cn/stock/usstock/c/2018-09-06/doc-ihitesuy8832978.shtml (accessed on 6 September 2018).
- Sina Tech. Lawyer Interpretation: If Ofo Declares Bankruptcy, the User Deposit Cannot be Refunded. Available online: https://tech.sina.com.cn/i/2018-12-21/doc-ihqhqcir8796974.shtml (accessed on 21 December 2018).
- Mooney, S.J.; Hosford, K.; Howe, B.; Yan, A.; Winters, M.; Bassok, A.; Hirsch, J.A. Freedom from the station: Spatial equity in access to dockless bike share. J. Transp. Geogr. 2019, 74, 91–96. [Google Scholar] [CrossRef]
- Ai, Y.; Li, Z.; Gan, M.; Zhang, Y.; Yu, D.; Chen, W.; Ju, Y. A deep learning approach on short-term spatiotemporal distribution forecasting of dockless bike-sharing system. Neural Comput. Appl. 2018, 1–13. [Google Scholar] [CrossRef]
- Shen, Y.; Zhang, X.; Zhao, J. Understanding the usage of dockless bike sharing in Singapore. Int. J. Sustain. Transp. 2018, 1–15. [Google Scholar] [CrossRef]
- Li, Y.; Shuai, B. Origin and destination forecasting on dockless shared bicycle in a hybrid deep-learning algorithms. Multimed. Tools Appl. 2018, 1–12. [Google Scholar] [CrossRef]
- Liu, Y.; Jia, R.; Xie, X.; Liu, Z. A Two-Stage Destination Prediction Framework of Shared Bicycle Based on Geographical Position Recommendation. IEEE Intell. Transp. Syst. Mag. 2018. [Google Scholar] [CrossRef]
- Xie, S.; Li, Y.; Xu, Q.; Fang, F.; Li, L. Image-based Parking Place Identification for Regulating Shared Bicycle Parking. In Proceedings of the 2018 15th International Conference on Control, Automation, Robotics and Vision (ICARCV), Singapore, 18–21 November 2018; pp. 1709–1714. [Google Scholar]
- Gao, Y.; Tao, J.; Xu, Y.; Wu, H.; Baah, N.K. Collaborative Route Plan for Parking Sites Selection in Bike-Sharing Systems. In Proceedings of the 2018 IEEE 22nd International Conference on Computer Supported Cooperative Work in Design ((CSCWD)), Granada, Spain, 25–27 April 2018; pp. 814–819. [Google Scholar]
- Zhang, Y.; Lin, D.; Mi, Z. Electric fence planning for dockless bike-sharing services. J. Clean. Prod. 2019, 206, 383–393. [Google Scholar] [CrossRef]
- Jin, F.; Cheng, Y.; Li, X.; Hu, Y.J. The Effect of Dockless Bike-Sharing on Public Transportation: An Empirical Study. HEC Paris Res. Pap. 2018, 18–81. [Google Scholar] [CrossRef]
- Sun, Y. Sharing and Riding: How the Dockless Bike Sharing Scheme in China Shapes the City. Urban Sci. 2018, 2, 68. [Google Scholar] [CrossRef]
- Li, X.; Zhang, Y.; Sun, L.; Liu, Q. Free-Floating Bike Sharing in Jiangsu: Users’ Behaviors and Influencing Factors. Energies 2018, 11, 1664. [Google Scholar] [CrossRef]
- Wang, Y.; Douglas, M.A.; Hazen, B.T.; Dresner, M. Be green and clearly be seen: How consumer values and attitudes affect adoption of bicycle sharing. Transp. Res. Part F: Traffic Psychol. Behav. 2018, 58, 730–742. [Google Scholar] [CrossRef]
- Zhang, Y.; Mi, Z. Environmental benefits of bike sharing: A big data-based analysis. Appl. Energy 2018, 220, 296–301. [Google Scholar] [CrossRef]
- Zhang, Y.; Brussel, M.J.; Thomas, T.; van Maarseveen, M.F. Mining bike-sharing travel behavior data: An investigation into trip chains and transition activities. Comput. Environ. Urban Syst. 2018, 69, 39–50. [Google Scholar] [CrossRef]
- Zhao, N.; Zhang, X.; Banks, M.S.; Xiong, M. Bicycle Sharing In China: Past, Present, And Future. In Proceedings of the Southern Association for Information Systems Conference, Atlanta, GA, USA, 23–24 March 2018. [Google Scholar]
- Parkes, S.D.; Marsden, G.; Shaheen, S.A.; Cohen, A.P. Understanding the diffusion of public bikesharing systems: evidence from Europe and North America. J. Transp. Geogr. 2013, 31, 94–103. [Google Scholar] [CrossRef] [Green Version]
- Gu, T.; Kim, I.; Currie, G. To be or not to be dockless: Empirical analysis of dockless bikeshare development in China. Transp. Res. Part A: Policy Pract. 2019, 119, 122–147. [Google Scholar] [CrossRef]
- Forrester, J.W. Industrial dynamics. J. Oper. Res. Soc. 1997, 48, 1037–1041. [Google Scholar] [CrossRef]
- Poles, R. System Dynamics modelling of a production and inventory system for remanufacturing to evaluate system improvement strategies. Int. J. Prod. Econ. 2013, 144, 189–199. [Google Scholar] [CrossRef]
- Mobike cities. Available online: https://mobike.com/cn/cities/ (accessed on 14 January 2019).
- Felson, M.; Spaeth, J.L. Community structure and collaborative consumption: A routine activity approach. Am. Behav. Sci. 1978, 21, 614–624. [Google Scholar] [CrossRef]
- Rifkin, J. The Zero Marginal Cost Society: The Internet of Things, the Collaborative Commons, and the Eclipse of Capitalism; St. Martin’s Press: New York, NY, USA, 2014. [Google Scholar]
- Chase, R. Peers Inc: How People and Platforms are Inventing the Collaborative Economy and Reinventing Capitalism; PublicAffairs: New York, NY, USA, 2015. [Google Scholar]
- Botsman, R.; Rogers, R. What’s Mine Is Yours: How Collaborative Consumption Is Changing the Way We Live; Collins: London, UK, 2011. [Google Scholar]
- Cohen, B.; Kietzmann, J. Ride on! Mobility business models for the sharing economy. Organ. Environ. 2014, 27, 279–296. [Google Scholar] [CrossRef]
- Sigala, M. Collaborative commerce in tourism: implications for research and industry. Curr. Issues Tour. 2017, 20, 346–355. [Google Scholar] [CrossRef]
- Martin, C.J. The sharing economy: A pathway to sustainability or a nightmarish form of neoliberal capitalism? Ecol. Econ. 2016, 121, 149–159. [Google Scholar] [CrossRef]
- Demary, V. Competition in the Sharing Economy; IW policy paper: Cologne, Germany, 2015. [Google Scholar]
- Wallsten, S. The competitive effects of the sharing economy: how is Uber changing taxis. Technol. Policy Inst. 2015, 22. [Google Scholar]
- Kumar, V.; Lahiri, A.; Dogan, O.B. A strategic framework for a profitable business model in the sharing economy. Ind. Market. Manag. 2018, 69, 147–160. [Google Scholar] [CrossRef]
- Plewnia, F.; Guenther, E. Mapping the sharing economy for sustainability research. Manag. Decis. 2018, 56, 570–583. [Google Scholar] [CrossRef]
- Hawlitschek, F.; Notheisen, B.; Teubner, T. The limits of trust-free systems: A literature review on blockchain technology and trust in the sharing economy. Electron. Commer. Res. Appl. 2018, 29, 50–63. [Google Scholar] [CrossRef]
- Zhang, T.C.; Jahromi, M.F.; Kizildag, M. Value co-creation in a sharing economy: The end of price wars? Int. J. Hosp. Manag. 2018, 71, 51–58. [Google Scholar] [CrossRef]
- Cannon, S.; Summers, L.H. How Uber and the sharing economy can win over regulators. Harv. Bus. Rev. 2014, 13, 24–28. [Google Scholar]
- Bond, A.T. An app for that: Local governments and the rise of the sharing economy. Notre Dame Law Rev. Online 2014, 90, 77. [Google Scholar]
- Koopman, C.; Mitchell, M.; Thierer, A. The sharing economy and consumer protection regulation: The case for policy change. J. Bus. Entrep. Law 2014, 8, 529. [Google Scholar] [CrossRef]
- Richardson, L. Performing the sharing economy. Geoforum 2015, 67, 121–129. [Google Scholar] [CrossRef] [Green Version]
- Martin, C.J.; Upham, P.; Klapper, R. Democratising platform governance in the sharing economy: An analytical framework and initial empirical insights. J. Clean. Prod. 2017, 166, 1395–1406. [Google Scholar] [CrossRef]
- Hong, S.; Lee, S. Adaptive governance, status quo bias, and political competition: Why the sharing economy is welcome in some cities but not in others. Gov. Inf. Q. 2018. [Google Scholar] [CrossRef]
- Ma, Y.; Lan, J.; Thornton, T.; Mangalagiu, D.; Zhu, D. Challenges of Collaborative Governance in the Sharing Economy: The case of free-floating bike sharing in Shanghai. J. Clean. Prod. 2018. [Google Scholar] [CrossRef]
- Bardhi, F.; Eckhardt, G.M. Access-based consumption: The case of car sharing. J. Consum. Res. 2012, 39, 881–898. [Google Scholar] [CrossRef]
- Hansen Henten, A.; Maria Windekilde, I. Transaction costs and the sharing economy. Info 2016, 18, 1–15. [Google Scholar] [CrossRef] [Green Version]
- Phua, V.C. Perceiving Airbnb as sharing economy: the issue of trust in using Airbnb. Curr. Issues Tour. 2018, 1–5. [Google Scholar] [CrossRef]
- Li, L.; Shan, M. Bidirectional incentive model for bicycle redistribution of a bicycle sharing system during rush hour. Sustainability 2016, 8, 1299. [Google Scholar] [CrossRef]
- Li, L.; Shan, M.; Li, Y.; Liang, S. A Dynamic Programming Model for Operation Decision-Making in Bicycle Sharing Systems under a Sustainable Development Perspective. Sustainability 2017, 9, 895. [Google Scholar] [CrossRef]
- China Industrial Information Network. 2017 Bike-Sharing User Behavior Analysis. Available online: http://www.chyxx.com/industry/201705/523611.html (accessed on 8 May 2017).
- 2018 China Bike-Sharing Industry Development Analysis Report; Trustdata Consultation Group: Beijing, China, 2018.
- Yang, P.-C.; Wee, H.-M. A single-vendor and multiple-buyers production–inventory policy for a deteriorating item. Eur. J. Oper. Res. 2002, 143, 570–581. [Google Scholar] [CrossRef]
- Balali, M.H.; Nouri, N.; Nasiri, A.; Seifoddini, H. Development of an economical model for a hybrid system of grid, PV and Energy Storage Systems. In Proceedings of the 2015 International Conference on Renewable Energy Research and Applications (ICRERA), Palermo, Italy, 22–25 November 2015; pp. 1108–1113. [Google Scholar]
- Govindan, K.; Soleimani, H.; Kannan, D. Reverse logistics and closed-loop supply chain: A comprehensive review to explore the future. Eur. J. Oper. Res. 2015, 240, 603–626. [Google Scholar] [CrossRef] [Green Version]
- Hoberg, K.; Bradley, J.R.; Thonemann, U.W. Analyzing the effect of the inventory policy on order and inventory variability with linear control theory. Eur. J. Oper. Res. 2007, 176, 1620–1642. [Google Scholar] [CrossRef]
- Morecroft, J.D. Strategic Modelling and Business Dynamics: A Feedback Systems Approach; John Wiley & Sons: Hoboken, NJ, USA, 2015. [Google Scholar]
- Wu, K.-J.; Liao, C.-J.; Tseng, M.-L.; Chiu, A.S. Exploring decisive factors in green supply chain practices under uncertainty. Int. J. Prod. Econ. 2015, 159, 147–157. [Google Scholar] [CrossRef]
- Badger, E. Share Everything: Why the Way We Consume Has Changed Forever; Cittylab. Recuperado en julio de: Washington, DC, USA, 2016. [Google Scholar]
- Green, C.D.; Grinyer, J.R.; Michaelson, R. A Possible Economic Rationale for Straight-Line Depreciation. Abacus 2002, 38, 91–120. [Google Scholar] [CrossRef]
- Selten, R. Models of Strategic Rationality; Springer Science & Business Media: Berlin, Germany, 2013; Volume 2. [Google Scholar]
- Barlas, Y. Formal aspects of model validity and validation in system dynamics. Syst. Dyn. Rev. J. Syst. Dyn. Soc. 1996, 12, 183–210. [Google Scholar] [CrossRef]
- Times Finance. Mobike and Uber, the Reenactment of the Capital Spell. Available online: http://www.sohu.com/a/227769268_100019684 (accessed on 10 April 2018).
- Sina Tech. Mobike’s Financial Data Exposure in April: Revenue of 150 Million Yuan, Loss of 480 Million Yuan. Available online: https://tech.sina.com.cn/i/2018-09-04/doc-ihiqtcap2969121.shtml (accessed on 4 September 2018).
- Chinese People’s Broadcasting. The Total Number of Shared Bicycles in Beijing Has Dropped by 20% Compared with 2017. The Current Total is Controlled at 1.9 Million Vehicles. Available online: http://www.cnr.cn/bj/jrbj/20180525/t20180525_524246469.shtml (accessed on 25 May 2018).
- Communication World Network. QM, iiMedia Research, iResearch and Cheetah Data, Four Major Data Organizations: Ofo Ranks First in the Industry, Overlooking Mobike. Available online: http://www.cww.net.cn/article?id=419693&ulu-rcmd=0_24ap_ap_0_03e8e555b6be46129f98624345126f63 (accessed on 30 October 2017).
- iResearch: User Activity, Ofo Ranked First for 7 cOnsecutive Months. Available online: http://www.sohu.com/a/210267200_564549 (accessed on 13 December 2017).
- Tech Web. The Shared Bike Deposit Must be Deposited with the Bank’s Designated Account. Available online: http://www.techweb.com.cn/it/2017-05-22/2526313.shtml (accessed on 22 May 2017).
- Sina Tech. Shared Bicycle Maintenance Personnel: Even If Work 6 Days a Week, the Bikes Can’t be All Repaired. Available online: https://tech.sina.com.cn/roll/2017-03-29/doc-ifycsukm4074402.shtml (accessed on 29 March 2017).
- Ifeng Tech. After the Body Can’t be Advertised, What About These Shared Bikes that are Expected to be Profitable? Available online: http://tech.ifeng.com/a/20170919/44689313_0.shtml (accessed on 19 September 2017).
- 163 Auto. Shared Bikes are Required to be Scrapped for Three Years. Available online: http://auto.163.com/17/0930/07/CVIIVMJS000884NK.html (accessed on 30 September 2017).
- New Blue Net. Beijing Thousands of Shared Bikes were Cleared, and the Penalty Rules will be Clearly. Available online: http://n.cztv.com/news/12469563.html (accessed on 27 March 2017).
- Arbolino, R.; De Simone, L.; Carlucci, F.; Yigitcanlar, T.; Ioppolo, G. Towards a sustainable industrial ecology: Implementation of a novel approach in the performance evaluation of Italian regions. J. Clean. Prod. 2018, 178, 220–236. [Google Scholar] [CrossRef]
- Yigitcanlar, T.; Edvardsson, I.R.; Johannesson, H.; Kamruzzaman, M.; Ioppolo, G.; Pancholi, S. Knowledge-based development dynamics in less favoured regions: insights from Australian and Icelandic university towns. Eur. Plan. Stud. 2017, 25, 2272–2292. [Google Scholar] [CrossRef]
- Bike-Sharing Industry Employment Research Report; National Information Center: Beijing, China, 2017.
- Xinhua Net. The Proportion of Bicycle Trips in Beijing Rose for the First Time. The Total Number of Shared Bicycles Reached 2.2 Million. Available online: http://www.xinhuanet.com//2018-02/12/c_1122404804.htm (accessed on 12 February 2018).
- China Bike-Sharing Industry Development Report; China Communications Institute: Beijing, China, 2018.
- Sina Watch. The 299 Yuan Deposit Can Finally be Retired! Available online: http://k.sina.com.cn/article_2208273904_839f95f0019009bfl.html (accessed on 6 July 2018).
- Ifeng News. Mobike Illegal Parking Twice Will be Deducted 5 Yuan. Available online: http://news.ifeng.com/a/20180727/59433459_0.shtml (accessed on 27 July 2018).
- Tencent Tech. Why is the Merger Not the Necessary Ending of the Mobike and Ofo War? Available online: http://tech.qq.com/a/20170317/003755.htm (accessed on 17 March 2017).
- 2017 China City Bike-Sharing Credit System Evaluation Report; CreditChina: Beijing, China, 2018.
- ChinaIRN. Shared Bike Control Plan: Beijing Will Limit the Number of Shared Bike Development to 1.91 Million. Available online: http://www.chinairn.com/news/20180803/113330671.shtml (accessed on 3 August 2018).
- Ifeng Finance. Resource Recycling Price is Not Cost-Effective, How to Eliminate the Shared Bike. Available online: https://finance.ifeng.com/a/20180821/16461610_0.shtml (accessed on 21 August 2018).
- Sina Finance. There is a Problem with Shared Bikes: High Loss Rate, Profit Model Remains to be Explored. Available online: http://finance.sina.com.cn/roll/2016-12-24/doc-ifxyxury8334921.shtml (accessed on 24 December 2016).
- Southern Metropolis Daily. Mobike was Acquired: Won the Market and Lost to Capital. Available online: http://epaper.oeeee.com/epaper/A/html/2018-04/05/content_20272.htm (accessed on 5 April 2018).
- Xinhua Net. Retired Shared Bike, It is a Bit Difficult to Recycle at a High Price. Available online: http://www.xinhuanet.com/info/2018-08/21/c_137406433.htm (accessed on 21 August 2018).
- 163 Finance. Losing 500 Million a Month, Can Meituan-Controlled Mobike Make Money in the Future? Available online: http://money.163.com/18/0911/07/DRDHQHLP00258105.html (accessed on 11 September 2018).
- Beijing Warehouse Rental Price. Available online: https://bj.58.com/cangkucf/ (accessed on 14 January 2019).
- Finance. How Many Shared Bikes does Beijing Need? Available online: http://money.163.com/17/0818/07/CS3UEDT2002580T4.html (accessed on 18 August 2017).
- Kejixun Finance. The Cost of Repairing Mobike Bikes in Various Cities is Far Worse than the Cost of Repairs. Available online: http://www.kejixun.com/article/170523/329804.shtml (accessed on 23 May 2017).
- Linkedin. Mobike. Available online: https://www.linkedin.com/company/mobike/ (accessed on 14 January 2019).
Figure 1.
A generic form of the dockless bike-sharing program (DBSP) operation and maintenance activities.
Figure 1.
A generic form of the dockless bike-sharing program (DBSP) operation and maintenance activities.

Figure 2.
The stock and flow diagram (SFD) of the DBSP.

Figure 3.
The simulation results of the different government control measures: (a) revenue; (b) expenditure.
Figure 3.
The simulation results of the different government control measures: (a) revenue; (b) expenditure.

Figure 4.
The simulation results of the different values of PRC: (a) depreciation cost; (b) Profit.

Figure 5.
The simulation results of the different values of DER: (a) active users; (b) daily profit/bike.
Figure 5.
The simulation results of the different values of DER: (a) active users; (b) daily profit/bike.

Table 1.
Nomenclature list.
| Nomenclature | |
|---|---|
| Level Variable | |
| Bike Inventory | The amount of bike inventory that is used to supply the market |
| Number of Bikes | The total number of bikes the DBSP supplies in a certain area |
| Damaged Bikes | The total number of damaged bikes that have been collected |
| Capital Pool | The capital reserve of the DBSP in a certain area |
| Profit | The total profit of the DBSP |
| Rate Variable | |
| orders/transfer | The number of bikes purchased or transferred |
| delivering | The number of bikes delivered to the market in the period of time |
| collecting | The number of bikes in good condition collected from the market |
| discarding | The number of damaged bikes discarded due to beyond repair |
| scrapping | The number of bikes scrapped due to their service life expiration |
| collecting of damaged | The number of damaged bikes collected in the period of time |
| repairing | The number of bikes that have been repaired |
| profit for the period | The profit of the DBSP in the period of time |
| Auxiliary Variable | |
| inventory cost | The cost of storing bikes |
| maintenance cost | The cost of maintaining bikes |
| depreciation cost | The cost of bike depreciation |
| discard loss | The loss of discarding damaged bikes |
| repairing cost | The cost of repairing damaged bikes |
| platform cost | The cost of platform operations |
| government fine | The local government fines due to illegal parking of bikes |
| riding profit | The profit from riding bikes |
| advertising profit | The profit from various advertisements |
| deposit pool profit | The profit from using the deposit pool to invest |
| deposit pool | The total number of deposits paid by all users |
| depreciation rate | The depreciation rate of bikes |
| bike rides/day | The total number of DBSP bike rides per day in a certain area |
| active users | The number of active users of the DBSP in a certain area |
| competing bikes | The total number of bikes competing DBSPs supply |
| target bikes quantity | The target number of bikes the DBSP supplies in the period of time |
| government restriction | The maximum number of bikes the DBSP supplies under the local government regulation |
| Exogenous Variable | |
| DELIVERY RATIO | The ratio of the target number of bikes to the maximum number |
| NET SALVAGE | The residual value minus the disposal cost after the bike expiration |
| TOTAL ACTIVE USERS NUMBER | The total number of active users in a certain area |
| MAINTENANCE EFFORT | The ratio of the number of repaired bikes to the total number of damaged bikes |
| PRODUCTION COST/BIKE | The average cost of production per bike |
| SATURATION QUANTITY | The saturation quantity of bikes required by users in a certain area |
| MARKET DEMAND/DAY | The total number of the market demand bike rides per day in a certain area |
© 2019 by the authors. Licensee MDPI, Basel, Switzerland. This article is an open access article distributed under the terms and conditions of the Creative Commons Attribution (CC BY) license (http://creativecommons.org/licenses/by/4.0/).
Share and Cite
MDPI and ACS Style
Yang, T.; Li, Y.; Zhou, S. System Dynamics Modeling of Dockless Bike-Sharing Program Operations: A Case Study of Mobike in Beijing, China. Sustainability 2019, 11, 1601. https://0-doi-org.brum.beds.ac.uk/10.3390/su11061601
AMA Style
Yang T, Li Y, Zhou S. System Dynamics Modeling of Dockless Bike-Sharing Program Operations: A Case Study of Mobike in Beijing, China. Sustainability. 2019; 11(6):1601. https://0-doi-org.brum.beds.ac.uk/10.3390/su11061601
Chicago/Turabian StyleYang, Tianjian, Ye Li, and Simin Zhou. 2019. "System Dynamics Modeling of Dockless Bike-Sharing Program Operations: A Case Study of Mobike in Beijing, China" Sustainability 11, no. 6: 1601. https://0-doi-org.brum.beds.ac.uk/10.3390/su11061601
Note that from the first issue of 2016, this journal uses article numbers instead of page numbers. See further details here.