Executive Compensation, Sustainability, Climate, Environmental Concerns, and Company Financial Performance: Evidence from Indonesian Commercial Banks


Abstract
:1. Introduction
2. Literature Review
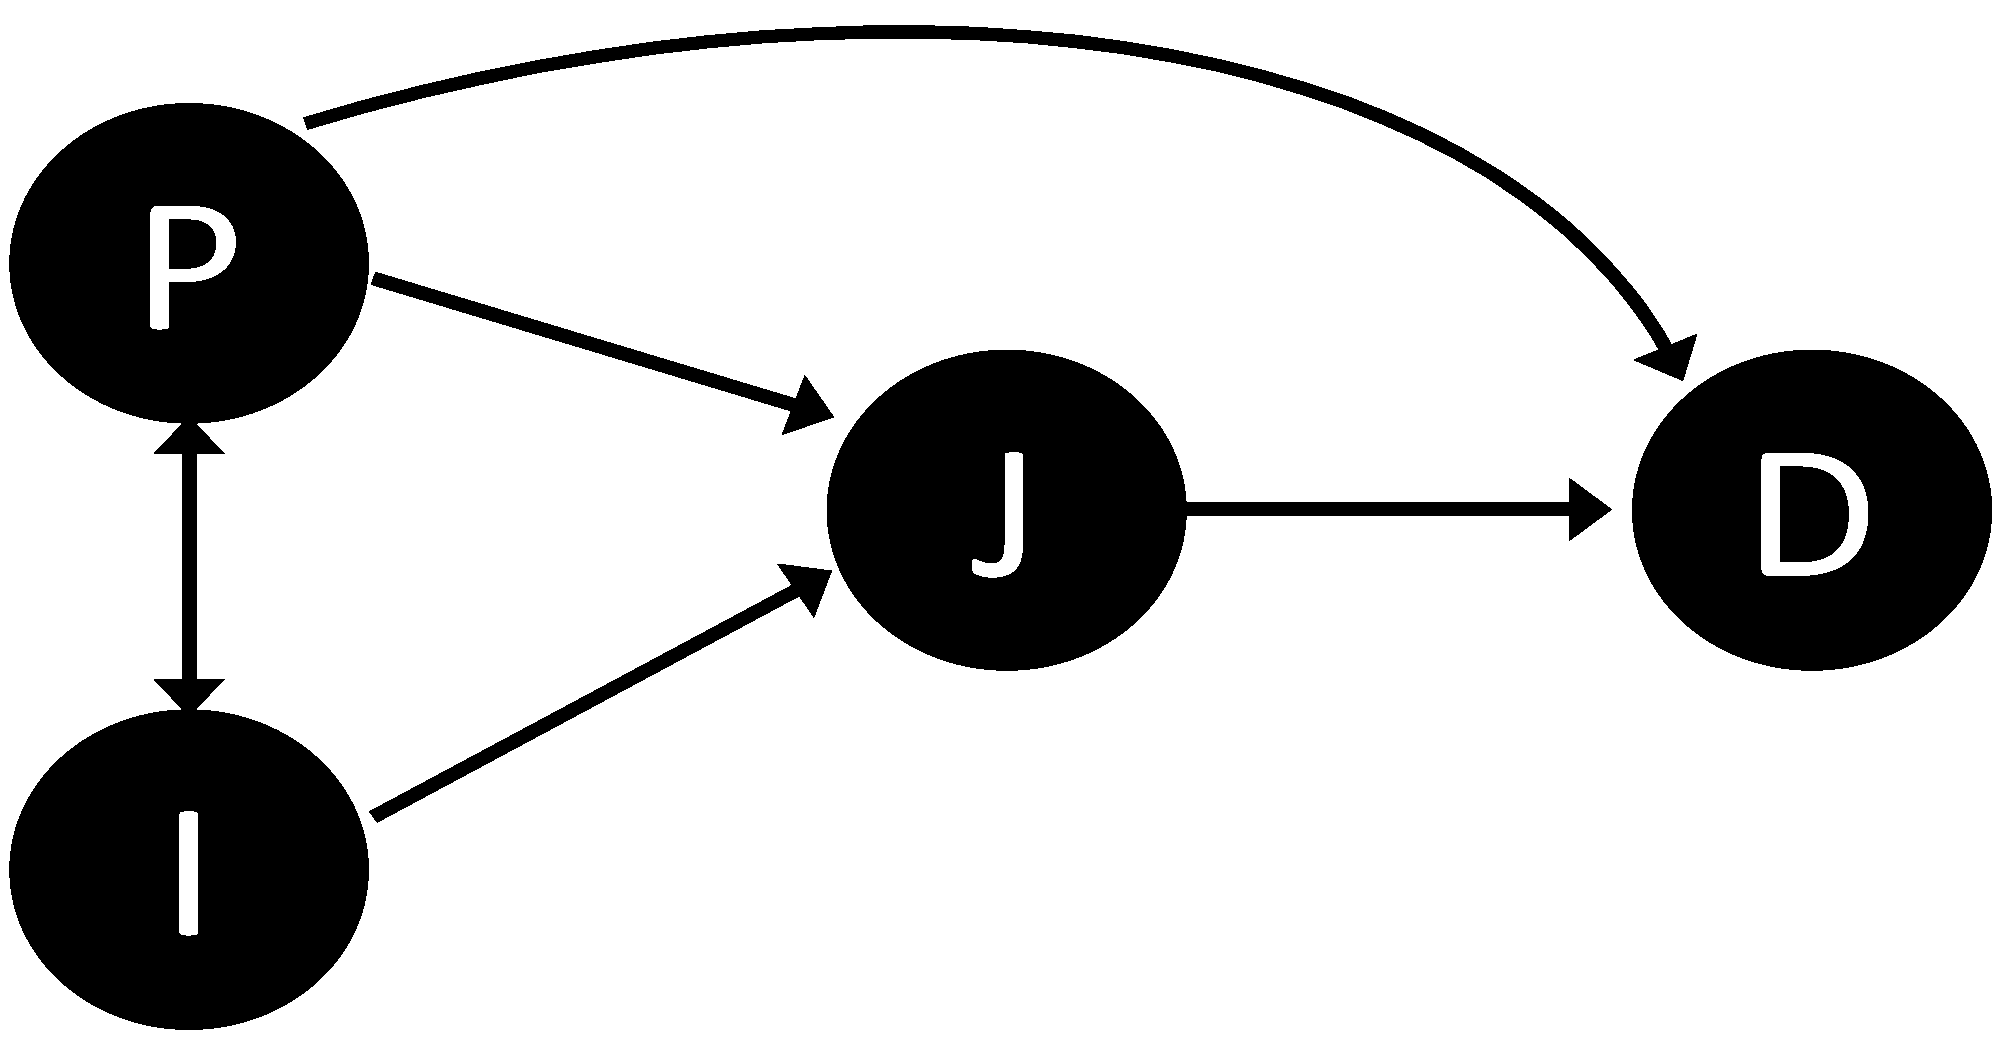
2.1. The Throughput Model Framework on Executive Compensation
- P→D agency theoretic position (or ethical egoism)
- P→J→D rule-based (or deontology)
- I→J→D principle-based (or utilitarian)
- I→P→D relativist-based
- P→I→J→D virtue ethics-based
- I→P→J→D stakeholders’ perspective (or ethics of care)
2.2. The Terminology of Corporate Sustainability
2.3. The Relationship between Executive Compensation and Corporate Sustainability
2.4. The Relationship between Executive Compensation and Company Financial Performance
2.5. The Relationship between Corporate Sustainability and Company Financial Performance
3. Data and Methodology
3.1. Sample and Data
3.2. The Methodology
- (1)
- Economic performance (EC), which consists of nine indicators;
- (2)
- Environment performance (EN), which consists of 16 indicators;
- (3)
- Social performance (SOC), which consists of four parts of valuation performance:
- (a)
- Human rights performance (HR), which consists of six indicators;
- (b)
- Labour practices and decent work performance (LA), which consists of 11 indicators;
- (c)
- Product responsibility performance (PR), which consists of five indicators; and
- (d)
- Society performance (SO), which consists of seven indicators.
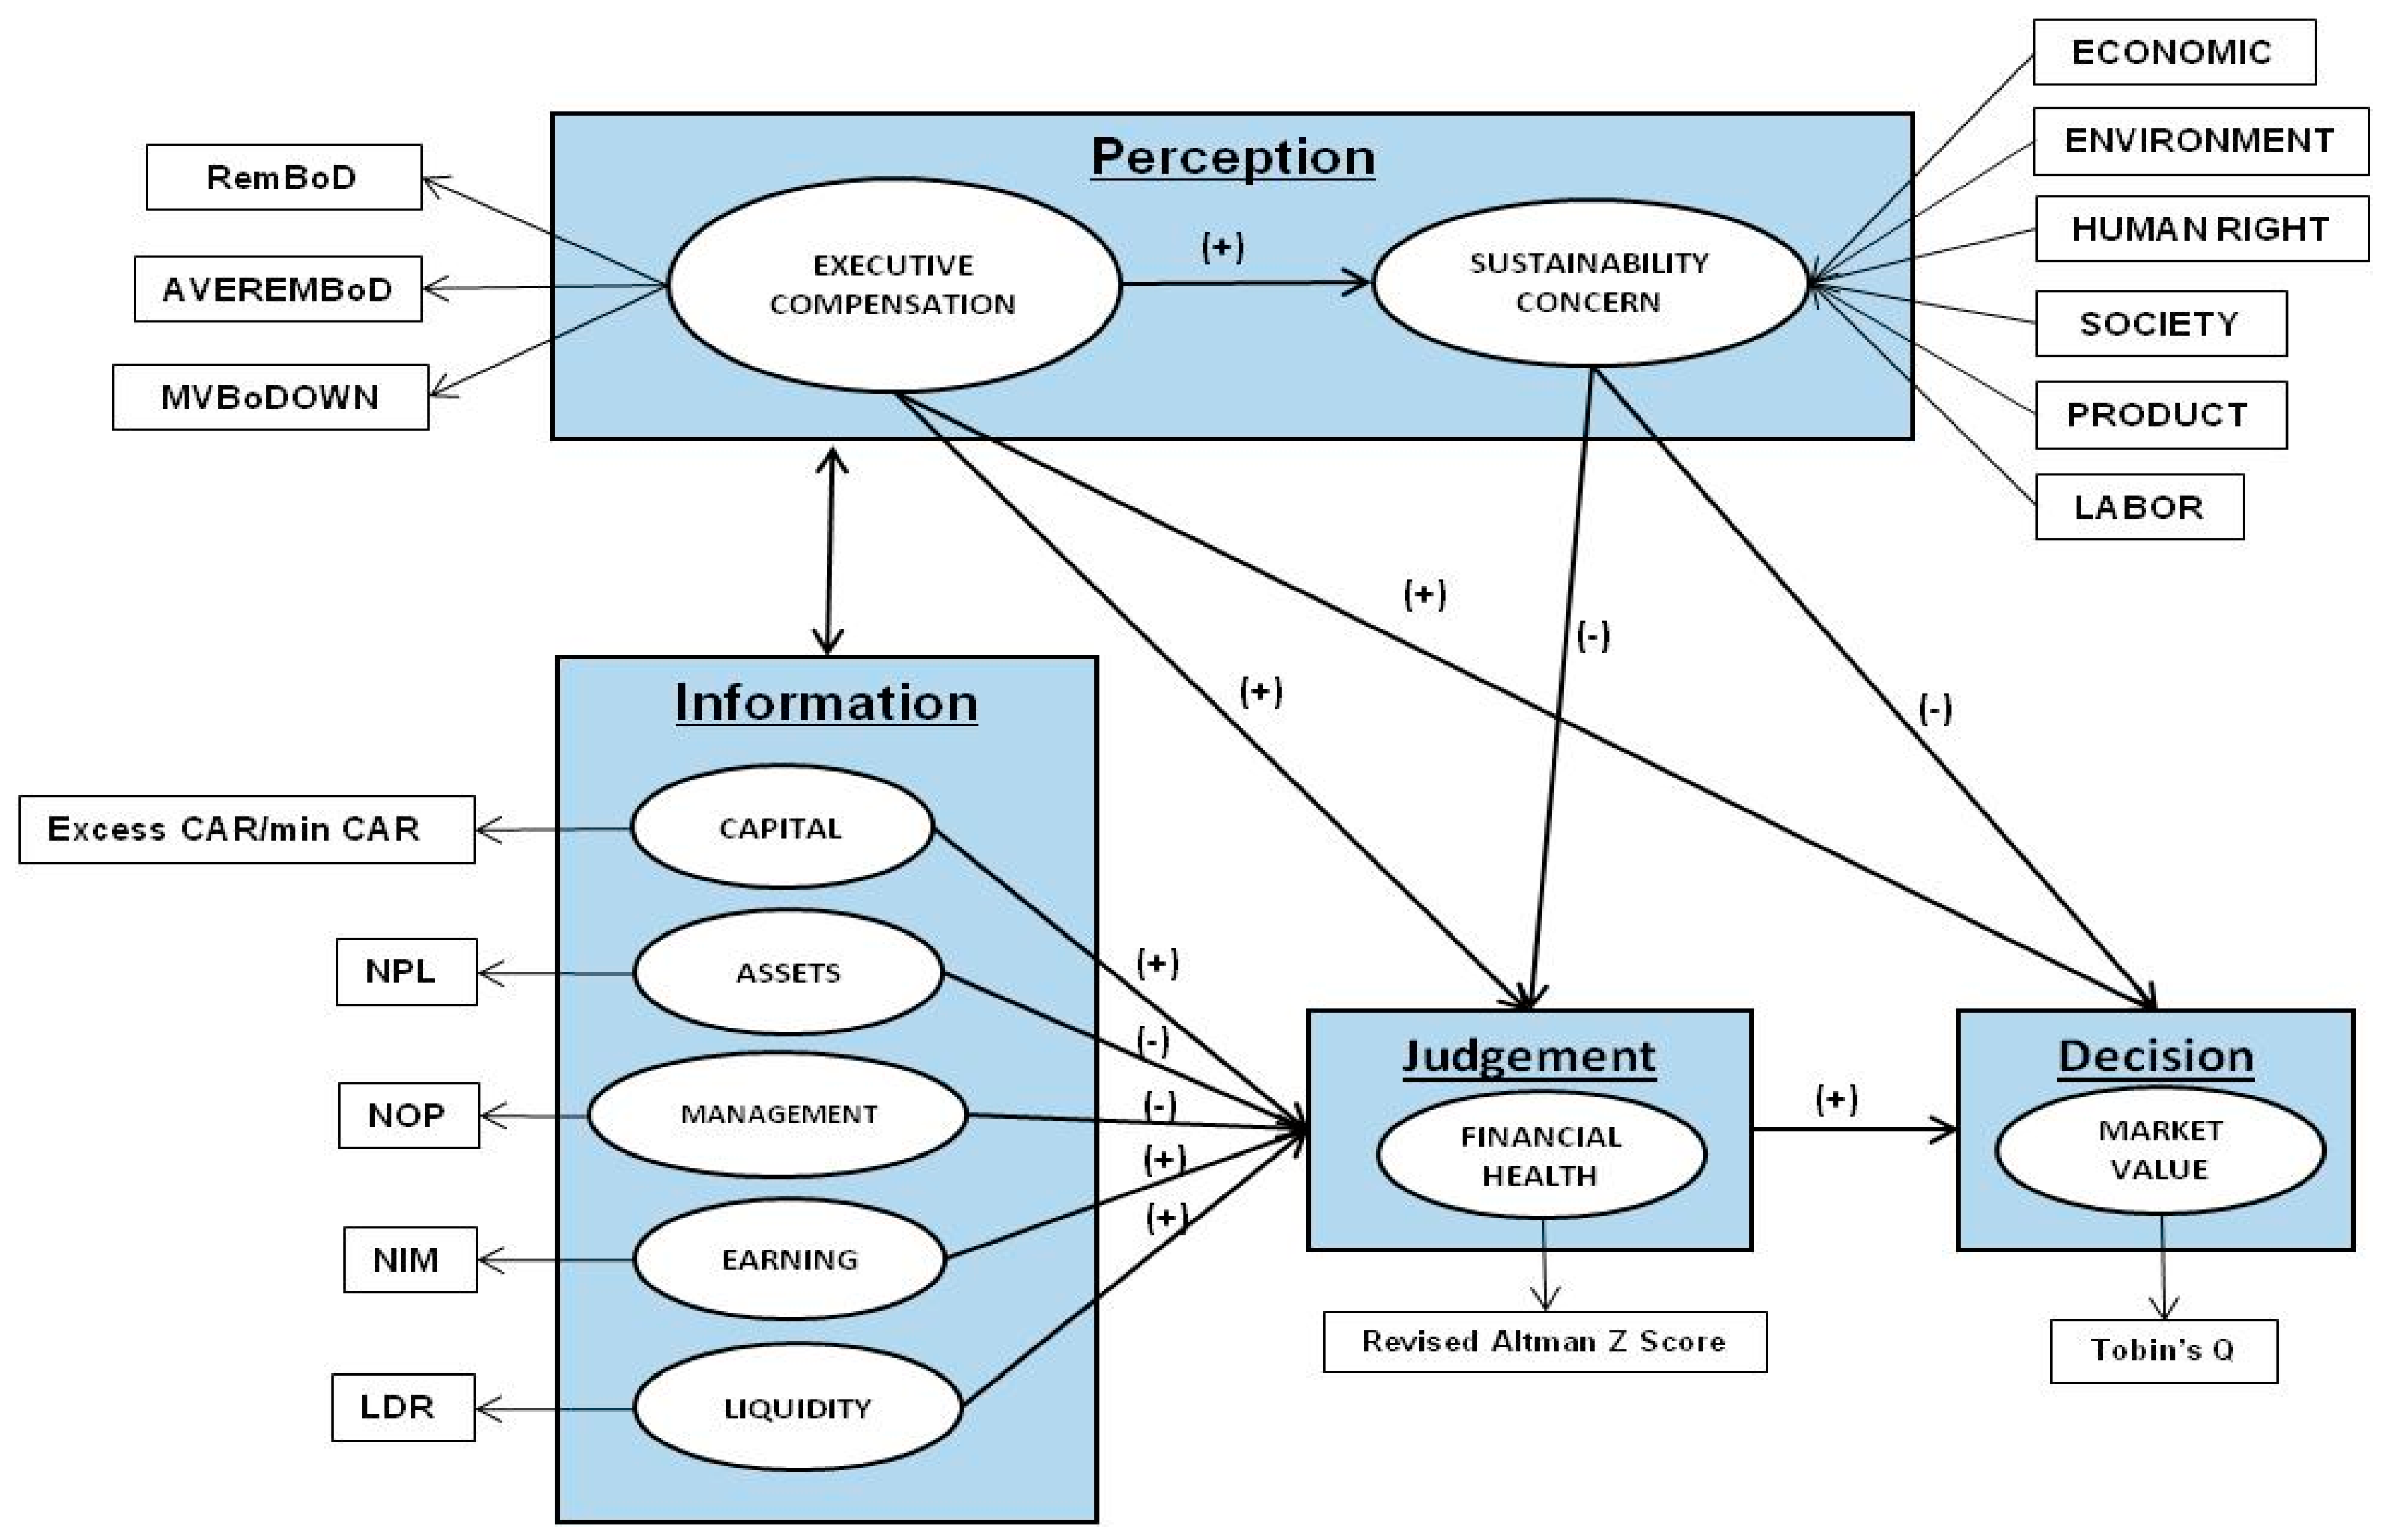
- Executive compensation, which consists of three reflective indicators, as follows:
- AveRemBoD is the average cash compensation received by executive per head, measured from the total cash executive compensation divided by a total number of executives [78].
- MVBoDOWn is the market value of stock held by executives as compensation, measured by total amount of stock outstanding held by executive multiplied by market value of stock [79].
- Company financial health, which consists of one reflective indicator using the Altman revision Z score model, is a score that indicates a distressed company condition for non-manufacturing companies in emerging countries [82], where Z” Scores below 1.10 indicate a distressed condition, with the following formula:where X1 = working capital/total assets, X2 = retained earnings/total assets, X3 = earnings before interest and taxes/total assets, and X4 = market value equity/book value of total liabilities.Z” = 6.56 (X1) + 3.26 (X2) + 6.72 (X3) + 1.05 (X4),
- Company market value, which consists of one reflective indicator from Tobin’s Q, is the ratio of the market value of equity and the book value of liabilities, scaled by the book value of assets [70].
- The banks’ financial information consists of five constructs, with one reflective indicator each, which are as follows:
- CAR (capital adequacy ratio) is the ratio between capital in excess of regulatory requirements over the minimum capital requirements.
- NOP (net open position) is the net sum of all foreign currency assets and liabilities of a bank or financial institution inclusive of all of its spot and forward transactions and off-balance-sheet items in that foreign currency.
- NPL (non-performing loan) is a sum of borrowed money upon which the debtor has not made his or her scheduled payments for at least 90 days. A nonperforming loan is either in default or close to being in default.
- NIM (net interest margin) is the ratio of the difference of investment return with interest expenses divided by average earning assets.
- LDR (loan debt ratio) is the ratio of bank liquidity to cover of unforeseen fund requirements.
- Corporate sustainability concerns (see Table 1).
4. Empirical Findings
4.1. Descriptive Statistics
4.2. The Structural Model Assessment
5. Discussion
6. Conclusions
Author Contributions
Funding
Conflicts of Interest
References
- van Essen, M.; Otten, J.; Carberry, E.J. Assessing managerial power theory: A meta-analytic approach to understanding the determinants of CEO compensation. J. Manag. 2015, 41, 164–202. [Google Scholar] [CrossRef]
- Liu, J.; Taylor, D. Legitimacy and corporate governance determinants of executives’ remuneration disclosures. Corp. Gov. 2008, 8, 59–72. [Google Scholar] [CrossRef]
- Gomez-Mejia, L.R.; Larraza-Kintana, M.; Makri, M. The determinants of executive compensation in family-controlled public corporations. Acad. Manag. J. 2003, 46, 226–237. [Google Scholar]
- Bebchuk, L.A.; Fried, J.M. Executive compensation as an agency problem. J. Econ. Perspect. 2003, 17, 71–92. [Google Scholar] [CrossRef]
- Main, B.G.; O’ Relly, C.A.; Wade, J. The CEO, the board of directors and executive compensation: Economic and psychological perspectives. Ind. Corp. Chang. 1995, 4, 293–332. [Google Scholar] [CrossRef]
- Adams, C.; Zutshi, A. Corporate Social Responsibility: Why Business Should Act Responsibly and Be Accountable. Aust. Account. Rev. 2004, 14, 31–39. [Google Scholar] [CrossRef]
- Campbell, J.L. Why would corporations behave in socially responsible ways? An institutional theory of corporate social responsibility. Acad. Manag. Rev. 2007, 32, 946–967. [Google Scholar] [CrossRef]
- Carroll, A.B. The Pyramid of Corporate Social Responsibility: Toward the Moral Management of Organizational Stakeholders; Elsevier Inc.: Greenwich, CT, USA, 1991; Volume 34, pp. 39–48. [Google Scholar]
- Fleming, P.; Jones, M.T. The End of Corporate Social Responsibility: Crisis and Critique, 1st ed.; Smy, K., Ed.; SAGE Publication Ltd.: London, UK, 2012. [Google Scholar]
- Hancock, J. Investing in Corporate Social Responsibility: A Guide to Best Practice, Business Planning & the UK’s Leading Companies; Hancock, J., Ed.; Kogan Page Publishers: London, UK, 2005. [Google Scholar]
- Rodgers, W. Throughput Modeling: Financial Information Used by Decision Makers; JAI Press: Greenwich, CT, USA, 1997. [Google Scholar]
- Foss, K.; Rodgers, W. Enhancing information usefulness by line managers’ involvement in cross-unit activities. Organ. Stud. 2011, 32, 683–703. [Google Scholar] [CrossRef]
- Rodgers, W.; Housel, T.J. The Effects of Information and Cognitive Processes on Decision Making. Account. Bus. Res. 1987, 18, 67–74. [Google Scholar] [CrossRef]
- Rodgers, W.; Simon, J.; Gabrielsson, J. Combining experiential and conceptual learning in accounting education: A review with implications. Manag. Learn. 2017, 48, 187–205. [Google Scholar] [CrossRef]
- Rodgers, W.; Fayi, S.A. Ethical pathways of internal audit reporting lines. Account. Forum 2018. [Google Scholar] [CrossRef]
- Rodgers, W.; Söderbom, A.; Reid, G. Enhancing Sustainability in Finance: Throughput Model focused decisions. In Proceedings of the 9th International Forum on Knowledge Asset Dynamics (IFKAD), Matera, Italy, 11–13 June 2014; pp. 2540–2545. [Google Scholar]
- Guiral, A.; Rodgers, W.; Ruiz, E.; Gonzalo-Angulo, J.A. Can expertise mitigate auditors’ unintentional biases? J. Int. Account. Audit. Tax. 2015, 24, 105–117. [Google Scholar] [CrossRef]
- Rodgers, W.; Guiral, A.; Gonzalo, J.A. Different Pathways That Suggest Whether Auditors’ Going Concern Opinions Are Ethically Based. J. Bus. Ethics 2009, 86, 347–361. [Google Scholar] [CrossRef]
- Nutt, P.C. Framing strategic decisions. Organ. Sci. 1998, 9, 195–216. [Google Scholar] [CrossRef]
- Giroud, X.; Mueller, H.M. Corporate governance, product market competition, and equity prices. J. Financ. 2011, 66, 563–600. [Google Scholar] [CrossRef]
- Coles, J.L.; Li, Z.; Wang, A.Y. Industry tournament incentives. Rev. Financ. Stud. 2017, 31, 1418–1459. [Google Scholar] [CrossRef]
- Core, J.; Guay, W. The use of equity grants to manage optimal equity incentive levels. J. Account. Econ. 1999, 28, 151–184. [Google Scholar] [CrossRef] [Green Version]
- Li, Z.F. Mutual monitoring and corporate governance. J. Bank. Financ. 2014, 45, 255–269. [Google Scholar]
- Bundy, J.; Shropshire, C.; Buchholtz, A.K. Strategic cognition and issue salience: Toward an explanation of firm responsiveness to stakeholder concerns. Acad. Manag. Rev. 2013, 38, 352–376. [Google Scholar] [CrossRef]
- Narayanan, V.; Zane, L.J.; Kemmerer, B. The cognitive perspective in strategy: An integrative review. J. Manag. 2011, 37, 305–351. [Google Scholar] [CrossRef]
- Mitchell, R.K.; Agle, B.R.; Wood, D.J. Toward a theory of stakeholder identification and salience: Defining the principle of who and what really counts. Acad. Manag. Rev. 1997, 22, 853–886. [Google Scholar] [CrossRef]
- Li, F.; Li, T.; Minor, D. A Test of Agency Theory: CEO Power, Firm Value, and Corporate Social Responsibility. Int. J. Manag. Financ. 2016, 12, 611–628. [Google Scholar] [CrossRef]
- World Commission on Environment and Development. Our Common Future; Oxford University Press: Oxford, UK, 1987. [Google Scholar]
- Van Marrewijk, M.; Werre, M. Multiple levels of corporate sustainability. J. Bus. Ethics 2003, 44, 107–119. [Google Scholar] [CrossRef]
- Jensen, M.C.; Meckling, W.H. Theory of firm-managerial behavior, agency cost and ownership structure. J. Financ. Econ. 1976, 3, 305–360. [Google Scholar] [CrossRef]
- Jones, T.M. Instrumental Stakeholder Theory: A Synthesis of Ethics and Economics. Acad. Manag. Rev. 1995, 20, 404–437. [Google Scholar] [CrossRef]
- Arora, A.; Alam, P. CEO Compensation and Stakeholders’ Claims. Contemp. Account. Res. 2005, 22, 519–547. [Google Scholar] [CrossRef]
- Callan, S.J.; Thomas, J.M. Relating CEO Compensation to Social Performance and Financial Performance: Does the Measure of Compensation Matter? Corp. Soc. Responsib. Environ. Manag. 2014, 21, 202–227. [Google Scholar] [CrossRef]
- Frye, M.B.; Nelling, E.; Webb, E. Executive compensation in socially responsible firms. Corp. Gov. Int. Rev. 2006, 14, 446–455. [Google Scholar] [CrossRef]
- Callan, S.J.; Thomas, J.M. Executive compensation, corporate social responsibility, and corporate financial performance: A multi-equation framework. Corp. Soc. Responsib. Environ. Manag. 2011, 18, 332–351. [Google Scholar] [CrossRef]
- Mahoney, L.S.; Thorne, L. Corporate social responsibility and long-term compensation: Evidence from Canada. J. Bus. Ethics 2005, 57, 241–253. [Google Scholar] [CrossRef]
- Mahoney, L.S.; Thorne, L. An examination of the structure of executive compensation and corporate social responsibility: A Canadian investigation. J. Bus. Ethics 2006, 69, 149–162. [Google Scholar] [CrossRef]
- Miles, P.C.; Miles, G. Corporate social responsibility and executive compensation: Exploring the link. Soc. Responsib. J. 2013, 9, 76–90. [Google Scholar] [CrossRef]
- Cai, Y.; Jo, H.; Pan, C. Vice or virtue? The impact of corporate social responsibility on executive compensation. J. Bus. Ethics 2011, 104, 159–173. [Google Scholar] [CrossRef]
- Berrone, P.; Gomez-Mejia, L.R. Environmental performance and executive compensation: An integrated agency-institutional perspective. Acad. Manag. J. 2009, 52, 103–126. [Google Scholar] [CrossRef]
- Cordeiro, J.J.; Sarkis, J. Does explicit contracting effectively link CEO compensation to environmental performance? Bus. Strategy Environ. 2008, 17, 304–317. [Google Scholar] [CrossRef]
- Stanwick, P.A.; Stanwick, S.D. CEO compensation: Does it pay to be green? Bus. Strategy Environ. 2001, 10, 176–182. [Google Scholar] [CrossRef]
- Zou, H.L.; Zeng, S.X.; Xie, L.N.; Zeng, R.C. Are Top Executives Rewarded for Environmental Performance? The Role of the Board of Directors in the Context of China. Hum. Ecol. Risk Assess. Int. J. 2015, 21, 1542–1565. [Google Scholar] [CrossRef]
- Dunbar, C.G.; Li, Z.F.; Shi, Y. Corporate Social Responsibility and CEO Risk-Taking Incentives. SSRN Electron. J. 2017. [Google Scholar] [CrossRef]
- Banker, R.D.; Darrough, M.N.; Huang, R.; Plehn-Dujowich, J.M. The Relation between CEO Compensation and Past Performance. Account. Rev. 2013, 88, 1–30. [Google Scholar] [CrossRef]
- Matolcsy, Z.P. Executive Cash Compensation and Corporate Performance During Different Economic Cycles. Contemp. Account. Res. 2000, 17, 671–692. [Google Scholar] [CrossRef]
- Ozkan, N. CEO compensation and firm performance: An empirical investigation of UK panel data. Eur. Financ. Manag. 2011, 17, 260–285. [Google Scholar] [CrossRef]
- Ozkan, N. Do corporate governance mechanisms influence CEO compensation? An empirical investigation of UK companies. J. Multinatl. Financ. Manag. 2007, 17, 349–364. [Google Scholar] [CrossRef]
- Kato, T.; Kim, W.; Lee, J.H. Executive compensation, firm performance, and chaebols in Korea: Evidence from new panel data. Pac.-Basin Financ. J. 2007, 15, 36–55. [Google Scholar] [CrossRef]
- Firth, M.; Fung, P.M.; Rui, O.M. Corporate performance and CEO compensation in China. J. Corp. Financ. 2006, 12, 693–714. [Google Scholar] [CrossRef]
- Tosi, H.L.; Werner, S.; Katz, J.P.; Gomez-Mejia, L.R. How much does performance matter? A meta-analysis of CEO pay studies. J. Manag. 2000, 26, 301–339. [Google Scholar] [CrossRef]
- Abdullah, S.N. Directors’ remuneration, firm’s performance and corporate governance in Malaysia among distressed companies. Corp. Gov. 2006, 6, 162–174. [Google Scholar] [CrossRef]
- Gomez-Mejia, L.R.; Wiseman, R.M. Reframing executive compensation: An assessment and outlook. J. Manag. 1997, 23, 291–374. [Google Scholar] [CrossRef]
- O’Reilly, C.A.; Main, B.G. Economic and psychological perspectives on CEO compensation: A review and synthesis. Ind. Corp. Chang. 2010, 19, 675–712. [Google Scholar] [CrossRef]
- Bebchuk, L.A.; Fried, J.M. Pay without performance: Overview of the issues. J. Appl. Corp. Financ. 2005, 17, 8–23. [Google Scholar] [CrossRef]
- Mirrlees, J. The optimal structure of incentives and authority within an organization. Bell J. Econ. 1976, 7, 105–131. [Google Scholar] [CrossRef]
- Bebchuk, L.A.; Fried, J.M.; Walker, D.I. Managerial Power and Rent Extraction in the Design of Executive Compensation; National Bureau of Economic Research: Cambridge, MA, USA, 2002. [Google Scholar]
- Hong, B.; Li, Z.; Minor, D. Corporate governance and executive compensation for corporate social responsibility. J. Bus. Ethics 2016, 136, 199–213. [Google Scholar] [CrossRef]
- Conyon, M.J.; He, L. Executive compensation and corporate governance in China. J. Corp. Financ. 2011, 17, 1158–1175. [Google Scholar] [CrossRef] [Green Version]
- Kato, T.; Long, C. Executive compensation, firm performance, and corporate governance in China: Evidence from firms listed in the Shanghai and Shenzhen Stock Exchanges. Econ. Dev. Cult. Chang. 2006, 54, 945–983. [Google Scholar] [CrossRef]
- Margolis, J.D.; Elfenbein, H.A.; Walsh, J.P. Does it pay to be good? A meta-analysis and redirection of research on the relationship between corporate social and financial performance. Ann Arbor 2007, 1001, 48109–41234. [Google Scholar]
- Wu, M.W.; Shen, C.H. Corporate social responsibility in the banking industry: Motives and financial performance. J. Bank. Financ. 2013, 37, 3529–3547. [Google Scholar] [CrossRef]
- Baron, D.P. Private politics, corporate social responsibility, and integrated strategy. J. Econ. Manag. Strategy 2001, 10, 7–45. [Google Scholar] [CrossRef]
- Ikram, A.; Li, Z.F.; Minor, D. CSR-contingent executive compensation contracts. J. Bank. Financ. Forthcom. 2019. [Google Scholar] [CrossRef]
- Brammer, S.; Millington, A. Does It Pay to Be Different? An Analysis of the Relationship between Corporate Social and Financial Performance. Strateg. Manag. J. 2008, 29, 1325–1343. [Google Scholar] [CrossRef]
- McWilliams, A.; Siegel, D. Corporate Social Responsibility and Financial Performance: Correlation or Misspecification? Strateg. Manag. J. 2000, 21, 603–609. [Google Scholar] [CrossRef]
- Sen, S.; Bhattacharya, C.B.; Korschun, D. The Role of Corporate Social Responsibility in Strengthening Multiple Stakeholder Relationships: A Field Experiment. J. Acad. Mark. Sci. 2006, 34, 158–166. [Google Scholar] [CrossRef]
- Griffin, J.J.; Mahon, J.F. The Corporate Social Performance and Corporate Financial Performance Debate Twenty-Five Years of Incomparable Research. Bus. Soc. 1997, 36, 5–31. [Google Scholar] [CrossRef]
- Margolis, J.D.; Walsh, J.P. Misery Loves Companies: Rethinking Social Initiatives by Business. Adm. Sci. Q. 2003, 48, 268–305. [Google Scholar] [CrossRef]
- Rodgers, W.; Choy, H.L.; Guiral, A. Do investors value firm’s commitment to social activities? J. Bus. Ethics 2013, 113. [Google Scholar] [CrossRef]
- Barnett, M.L.; Salomon, R.M. Beyond dichotomy: The curvilinear relationship between social responsibility and financial performance. Strateg. Manag. J. 2006, 27, 1101–1122. [Google Scholar] [CrossRef]
- Dang, C.; Li, Z.F.; Yang, C. Measuring firm size in empirical corporate finance. J. Bank. Financ. 2018, 86, 159–176. [Google Scholar] [CrossRef]
- Al-Tuwaijri, S.A.; Christensen, T.E.; Hughes Ii, K. The Relations among Environmental Disclosure, Environmental Performance, and Economic Performance: A Simultaneous Equations Approach. Account. Organ. Soc. 2004, 29, 447–471. [Google Scholar] [CrossRef]
- Beattie, V.; Thomson, S.J. Lifting the lid on the use of content analysis to investigate intellectual capital disclosures. Account. Forum 2007, 31, 129–163. [Google Scholar] [CrossRef]
- Gray, R.; Kouhy, R.; Lavers, S. Constructing a research database of social and environmental reporting by UK companies. Account. Audit. Account. J. 1995, 8, 78–101. [Google Scholar] [CrossRef]
- Rodgers, W.; Guiral, A. Potential model misspecification bias: Formative indicators enhancing theory for accounting researchers. Int. J. Account. 2011, 46, 25–50. [Google Scholar] [CrossRef]
- Hair, J.F.; Hult, G.T.M.; Ringle, C.; Sarstedt, M. A primer on Partial Least Squares Structural Equation Modeling (PLS-SEM); SAGE Publications, Inc.: Thousand Oaks, CA, USA, 2014. [Google Scholar]
- Unite, A.A.; Sullivan, M.J.; Brookman, J.; Majadillas, M.A.; Taningco, A. Executive pay and firm performance in the Philippines. Pac.-Basin Financ. J. 2008, 16, 606–623. [Google Scholar] [CrossRef]
- Brick, I.E.; Palmon, O.; Wald, J.K. CEO compensation, director compensation, and firm performance: Evidence of cronyism? J. Corp. Financ. 2006, 12, 403–423. [Google Scholar] [CrossRef] [Green Version]
- Core, J.E.; Holthausen, R.W.; Larcker, D.F. Corporate governance, chief executive officer compensation, and firm performance. J. Financ. Econ. 1999, 51, 371–406. [Google Scholar] [CrossRef]
- Conyon, M.J. Corporate governance and executive compensation. Int. J. Ind. Organ. 1997, 15, 493–509. [Google Scholar] [CrossRef]
- Altman, E.; Hartzell, J.; Peck, M.; Levich, R.; Mei, J. Future of Emerging Market Flows; Salomon Brothers, Inc.: New York, NY, USA, 1995. [Google Scholar]
- Galbreath, J. Drivers of Corporate Social Responsibility: The Role of Formal Strategic Planning and Firm Culture. Br. J. Manag. 2010, 21, 511–525. [Google Scholar] [CrossRef]
- Belkaoui, R.-A. Executive compensation, organizational effectiveness, social performance and firm performance: An empirical investigation. J. Bus. Financ. Account. 1992, 19, 25–38. [Google Scholar] [CrossRef]


| ECONOMIC PERFORMANCE INDICATORS | |
|---|---|
| EC1 | Direct economic value generated and distributed, including revenues, operating costs, employee compensation, donations and other community investments, retained earnings, and payments to capital providers and governments. |
| EC2 | Financial implications and other risks and opportunities for the organization’s activities due to climate change. |
| EC3 | Coverage of the organization’s defined benefit plan obligations. |
| EC4 | Significant financial assistance received from government |
| EC5 | Range of ratios of standard entry level wage compared to local minimum wage at significant locations of operation. |
| EC6 | Policy, practices, and proportion of spending on locally-based suppliers at significant locations of operation. |
| EC7 | Procedures for local hiring and proportion of senior management hired from the local community at significant locations of operation. |
| EC8 | Development and impact of infrastructure investments and services provided primarily for public benefit through commercial, in-kind, or pro bono engagement. |
| EC9 | Understanding and describing significant indirect economic impacts, including the extent of impacts. |
| ENVIRONMENT PERFORMANCE INDICATORS | |
| EN1 | Materials used by weight or volume. |
| EN2 | Percentage of materials used that are recycled input materials |
| EN3 | Direct energy consumption by primary energy source. |
| EN4 | Indirect energy consumption by primary source. |
| EN5 | Energy saved due to conservation and efficiency improvements. |
| EN6 | Initiatives to provide energy-efficient or renewable energy-based products and services, and reductions in energy requirements as a result of these initiatives. |
| EN7 | Initiatives to reduce indirect energy consumption and reductions achieved. |
| EN8 | Total water withdrawal by source. |
| EN9 | Water sources significantly affected by withdrawal of water. |
| EN10 | Percentage and total volume of water recycled and reused. |
| EN11 | Strategies, current actions, and future plans for managing impacts on biodiversity. |
| EN12 | Total water discharge by quality and destination. |
| EN13 | Total weight of waste by type and disposal method. |
| EN14 | Initiatives to mitigate environmental impacts of products and services, and extent of impact mitigation. |
| EN15 | Significant environmental impacts of transporting products and other goods and materials used for the organization’s operations, and transporting members of the workforce. |
| EN16 | Total environmental protection expenditures and investments by type. |
| SOCIAL PERFORMANCE INDICATORS | |
| HUMAN RIGHT PERFORMANCE INDICATORS | |
| HR1 | Percentage and total number of significant investment agreements that include human rights clauses or that have undergone human rights screening. |
| HR2 | Percentage of significant suppliers and contractors that have undergone screening on human rights and actions taken. |
| HR3 | Total hours of employee training on policies and procedures concerning aspects of human rights that are relevant to operations, including the percentage of employees trained. |
| HR4 | Total number of incidents of discrimination and actions taken. |
| HR5 | Operations identified in which the right to exercise freedom of association and collective bargaining may be at significant risk, and actions taken to support these rights. |
| HR6 | Percentage of security personnel trained in the organization’s policies or procedures concerning aspects of human rights that are relevant to operations. |
| LABOR PRACTICES and DECENT WORK PERFORMANCE INDICATORS | |
| LA1 | Total workforce by employment type, employment contract, and region. |
| LA2 | Total number and rate of employee turnover by age group, gender, and region. |
| LA3 | Benefits provided to full-time employees that are not provided to temporary or part-time employees, by major operations. |
| LA4 | Percentage of employees covered by collective bargaining agreements. |
| LA5 | Rates of injury, occupational diseases, lost days, and absenteeism, and total number of work-related fatalities by region. |
| LA6 | Health and safety topics covered in formal agreements with trade unions.Health and safety topics covered in formal agreements with trade unions. |
| LA7 | Average hours of training per year per employee by employee category. |
| LA8 | Programs for skills management and lifelong learning that support the continued employability of employees and assist them in managing career endings. |
| LA9 | Percentage of employees receiving regular performance and career development reviews. |
| LA10 | Ratio of basic salary of men to women by employee category. |
| LA 11 | Return to work and parental leave, by gender |
| PRODUCT RESPONSIBILITY PERFORMANCE | |
| PR1 | Practices related to customer satisfaction, including results of surveys measuring customer satisfaction. |
| PR2 | Programs for adherence to laws, standards, and voluntary codes related to marketing communications, including advertising, promotion, and sponsorship. |
| PR3 | Total number of incidents of non-compliance with regulations and voluntary codes concerning marketing communications, including advertising, promotion, and sponsorship, by type of outcomes. |
| PR4 | Total number of substantiated complaints regarding breaches of customer privacy and losses of customer data. |
| PR5 | Monetary value of significant fines for non-compliance with laws and regulations concerning the provision and use of products and services |
| SOCIETY PERFORMANCE INDICATORS | |
| SO1 | Nature, scope, and effectiveness of any programs and practices that assess and manage the impacts of operations on communities, including entering, operating, and exiting. |
| SO2 | Percentage of employees trained in organization’s anti-corruption policies and procedures. |
| SO3 | Actions taken in response to incidents of corruption. |
| SO4 | Total value of financial and in-kind contributions to political parties, politicians, and related institutions by country. |
| SO5 | Monetary value of significant fines and total number of non-monetary sanctions for compliance with laws and regulations |
| SO6 | Operations with significant potential or actual negative impacts on local communities. |
| SO7 | Prevention and mitigation measures implemented in operations with signifi cant potential or actual negative impacts on local communities |
| Indicators | Min | Max | Mean | Std. Dev | VIF |
|---|---|---|---|---|---|
| TobinQ | 0.87 | 1.61 | 1.09 | 0.13 | 1.00 |
| ZScore | −2.9 | 3.45 | 1.15 | 0.69 | 1.00 |
| BoDComp | 867 | 254915 | 37682.45 | 46845.24 | 18.28 |
| AVGBoD | 289 | 25492 | 4497.48 | 4474.76 | 18.11 |
| MV_BDOWN | 0 | 517755 | 30192.58 | 79356.70 | 1.8 |
| CAR | −2.38 | 9.94 | 1.15 | 0.98 | 1.00 |
| NPL | 0.00 | 0.18 | 0.02 | 0.02 | 1.00 |
| NOP | −0.02 | 1.32 | 0.03 | 0.09 | 1.00 |
| NIM | 0.00 | 0.1664 | 0.06 | 0.02 | 1.00 |
| LDR | 0.09 | 1.13 | 0.78 | 0.15 | 1.00 |
| SO | 0.14 | 0.93 | 0.41 | 0.15 | 1.89 |
| PR | 0.00 | 0.80 | 0.29 | 0.20 | 2.32 |
| LA | 0.00 | 0.95 | 0.24 | 0.21 | 4.40 |
| HR | 0.00 | 0.92 | 0.08 | 0.15 | 4.08 |
| EN | 0.00 | 0.75 | 0.09 | 0.16 | 6.34 |
| EC | 0.06 | 0.94 | 0.23 | 0.19 | 6.20 |
| Valid N (listwise) | 252 | ||||
| Indicators | 1 | 2 | 3 | 4 | 5 | 6 | 7 | 8 | 9 | 10 | 11 | 12 | 13 | 14 | 15 | 16 |
|---|---|---|---|---|---|---|---|---|---|---|---|---|---|---|---|---|
| Tobin’ Q (1) | 1 | |||||||||||||||
| ZScore (2) | 0.47** | 1 | ||||||||||||||
| BoDComp (3) | 0.29** | 0.27** | 1 | |||||||||||||
| AVGBoD (4) | 0.30** | 0.25** | 0.97** | 1 | ||||||||||||
| MV_BDOWN (5) | 0.42** | 0.26** | 0.66** | 0.66** | 1 | |||||||||||
| CAR (6) | 0.23** | 0.46** | −0.15* | −0.17** | −0.03 | 1 | ||||||||||
| NPL (7) | −0.12 | −0.48** | −0.26** | −0.27** | −0.21** | −0.24** | 1 | |||||||||
| NOP (8) | −0.03 | −0.45** | −0.07 | −0.08 | −0.08 | −0.09 | 0.235** | 1 | ||||||||
| NIM (9) | 0.25** | 0.37** | 0.22** | 0.21** | 0.23** | −0.00 | −0.03 | −0.15* | 1 | |||||||
| LDR (10) | 0.02 | 0.10 | 0.12 | 0.14* | −0.15* | −0.17** | 0.03 | −0.04 | 0.28** | 1 | ||||||
| SO (11) | 0.05 | 0.12 | 0.57** | 0.54** | 0.26** | −0.16* | −0.28** | −0.09 | 0.15* | 0.18** | 1 | |||||
| PR (12) | −0.04 | −0.03 | 0.61** | 0.60** | 0.19** | −0.19** | −0.06 | 0.02 | 0.09 | 0.21** | 0.53** | 1 | ||||
| LA (13) | 0.01 | 0.18** | 0.64** | 0.61** | 0.21** | −0.08 | −0.16* | −0.09 | 0.17** | 0.27** | 0.64** | 0.70** | 1 | |||
| HR (14) | 0.02 | 0.15* | 0.50** | 0.47** | 0.15* | −0.05 | −0.15* | −0.07 | 0.11 | 0.17** | 0.64** | 0.66** | 0.77** | 1 | ||
| EN (15) | −0.01 | 0.14* | 0.62** | 0.58** | 0.19** | −0.09 | −0.17** | −0.05 | 0.07 | 0.18** | 0.62** | 0.73** | 0.83** | 0.85** | 1 | |
| EC (16) | 0.03 | 0.11 | 0.66** | 0.64** | 0.32** | −0.10 | −0.16** | −0.04 | 0.13* | 0.18** | 0.62** | 0.72** | 0.85** | 0.82** | 0.88** | 1 |
| Constructs | 1 | 2 | 3 | 4 | 5 | 6 | 7 | 8 | 9 |
|---|---|---|---|---|---|---|---|---|---|
| EXECOM (1) | 1.00 | ||||||||
| CSC (2) | 0.67*** | 1.00 | |||||||
| CAPITAL (3) | −0.13** | −0.17*** | 1.000 | ||||||
| ASSET (4) | −0.27*** | −0.20*** | −0.24*** | 1.00 | |||||
| MANAGEMENT (5) | −0.084 | −0.045 | −0.09 | 0.23*** | 1.00 | ||||
| EARNING (6) | 0.24*** | 0.15*** | −0.01 | −0.03 | −0.15*** | 1.00 | |||
| LIQUIDITY (7) | 0.060 | 0.21*** | −0.18*** | 0.03 | −0.04 | 0.28*** | 1.00 | ||
| FIN_HEALTH (8) | 0.28*** | 0.081 | 0.46*** | −0.48*** | −0.45*** | 0.37*** | 0.10 | 1.00 | |
| FIRMVALUE (9) | 0.35*** | 0.022 | 0.23*** | −0.12* | −0.03 | 0.25*** | 0.02 | 0.47*** | 1.00 |
| Constructs | Proposed Effect | Loadings/ Weights | Observed t-Value | CR | AVE | Significant-Level One-Tailed |
|---|---|---|---|---|---|---|
| EXECOMP (Reflective) | 0.94 | 0.85 | ||||
| BoDComp | + | 0.972 | 252.15 | 0.00 | ||
| AVGBoD | + | 0.971 | 197.81 | 0.00 | ||
| MV_BDOWN | + | 0.806 | 17.86 | 0.00 | ||
| CSC (Formative) | ||||||
| EC | + | 0.796 | 3.75 | 0.00 | ||
| EN | + | 0.010 | 0.04 | 0.485 | ||
| HR | − | −0.515 | 2.83 | 0.00 | ||
| LA | + | 0.155 | 0.93 | 0.18 | ||
| PR | + | 0.215 | 1.711 | 0.04 | ||
| SO | + | 0.394 | 4.544 | 0.00 |
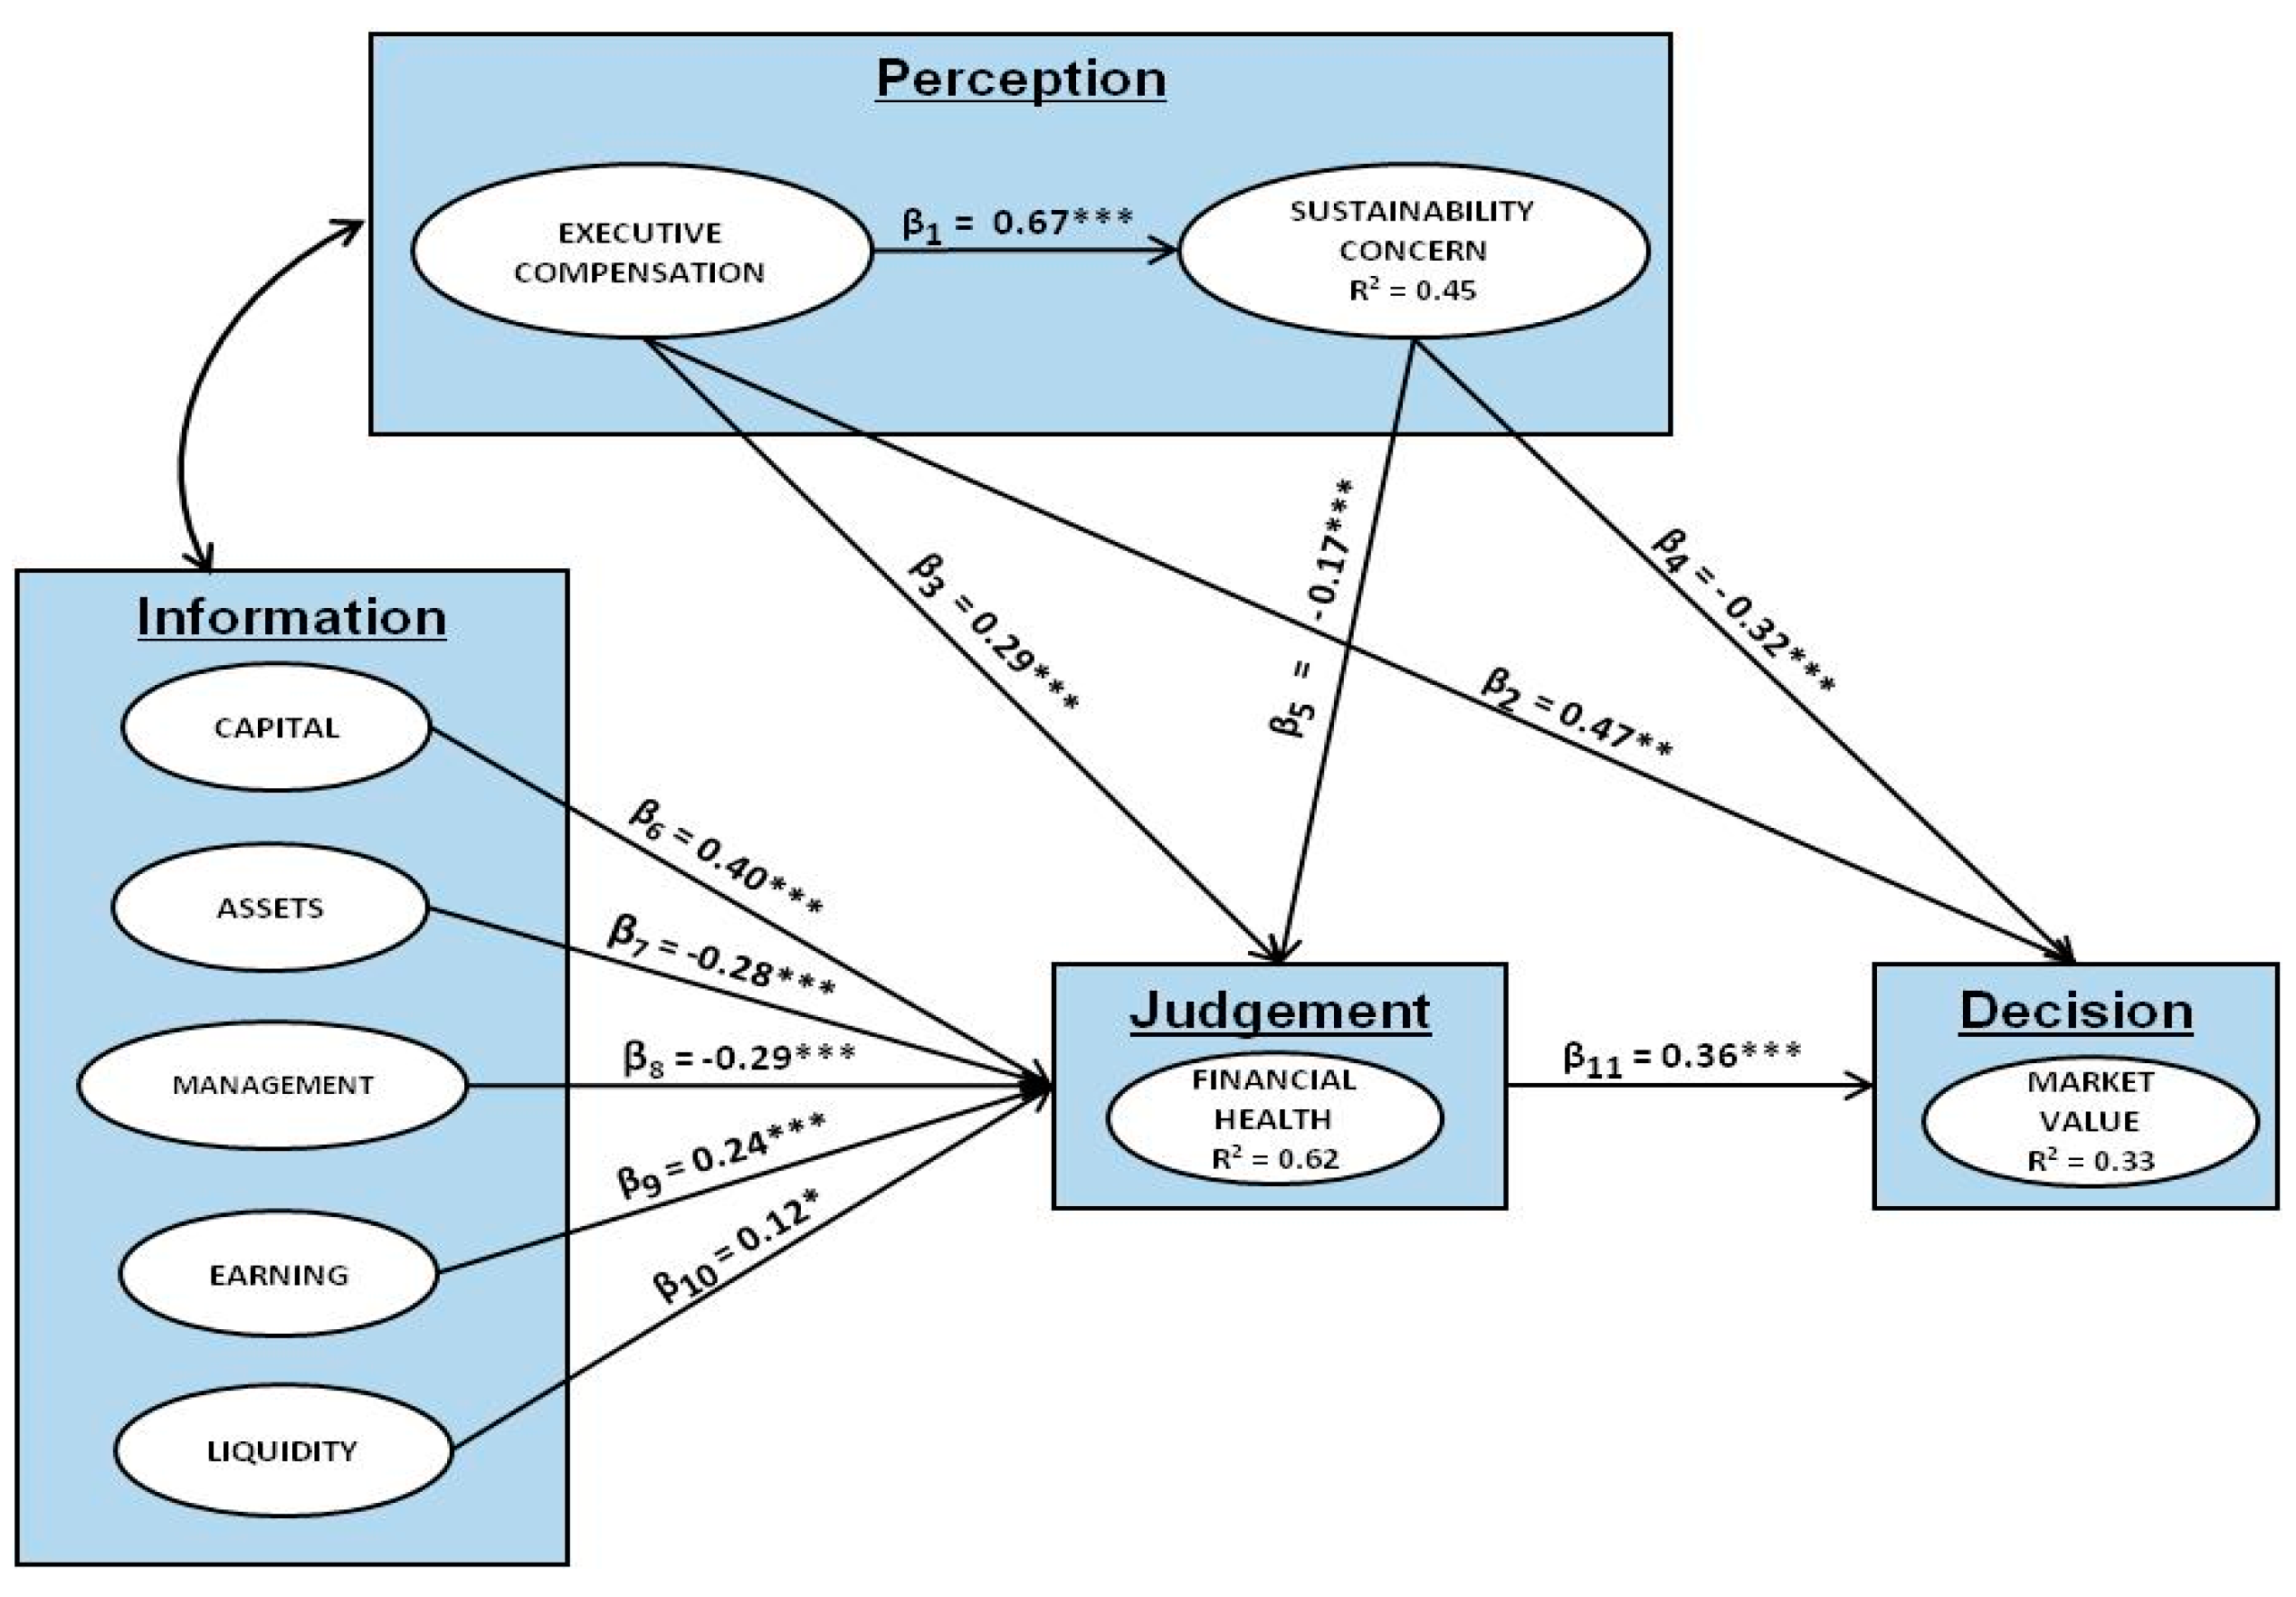
| Pathways | MODEL 1 | MODEL 2 |
|---|---|---|
| Executive Compensation → Sustainability Concern (β1) | 0.67*** | - |
| (P→D) Executive Compensation → Firm’s Market Value (β2) (P→J) Executive Compensation → Firm’s Financial Health (β3) | 0.47** 0.29*** | 0.27*** 0.16*** |
| (P→D) Sustainability Concern → Firm’s Market Value (β4) | −0.32*** | −0.08 |
| (P→J) Sustainability Concern → Firm’s Financial Health (β5) | −0.17*** | 0.16** |
| (I→J) Capital → Financial Health (β6) | 0.40*** | 0.40*** |
| (I→J) Asset → Financial Health (β7) | −0.28*** | −0.24*** |
| (I→J) Management → Financial Health (β8) | −0.29*** | −0.27*** |
| (I→J) Earning → Financial Health (β9) | 0.24*** | 0.26*** |
| (I→J) Liquidity → Financial Health (β10) | 0.12* | 0.08* |
| (J→D) Financial Health → Firm’s Market Value (β11) | 0.36*** | 0.41*** |
| Executive Compensation * Sustainability Concern → Firm’s Financial Health (β12) | − | −0.13** |
| Executive Compensation * Sustainability Concern → Firm’s Market Value (β13) | − | −0.007 |
| Multiple R2 (explained variance): Sustainability Concern | 0.45 | − |
| Financial Health | 0.62 | 0.63 |
| Firm’s Market Value | 0.33 | 0.30 |
© 2019 by the authors. Licensee MDPI, Basel, Switzerland. This article is an open access article distributed under the terms and conditions of the Creative Commons Attribution (CC BY) license (http://creativecommons.org/licenses/by/4.0/).
Share and Cite
Kartadjumena, E.; Rodgers, W. Executive Compensation, Sustainability, Climate, Environmental Concerns, and Company Financial Performance: Evidence from Indonesian Commercial Banks. Sustainability 2019, 11, 1673. https://0-doi-org.brum.beds.ac.uk/10.3390/su11061673
Kartadjumena E, Rodgers W. Executive Compensation, Sustainability, Climate, Environmental Concerns, and Company Financial Performance: Evidence from Indonesian Commercial Banks. Sustainability. 2019; 11(6):1673. https://0-doi-org.brum.beds.ac.uk/10.3390/su11061673
Chicago/Turabian StyleKartadjumena, Eriana, and Waymond Rodgers. 2019. "Executive Compensation, Sustainability, Climate, Environmental Concerns, and Company Financial Performance: Evidence from Indonesian Commercial Banks" Sustainability 11, no. 6: 1673. https://0-doi-org.brum.beds.ac.uk/10.3390/su11061673