Article

Food Preservative Capabilities of Grape (Vitis vinifera) and Clementine Mandarin (Citrus reticulata) By-products Extracts in South Africa

1
Department of Food Science, Faculty of AgriSciences, Stellenbosch University, Private Bag X1, Matieland, Stellenbosch 7602, South Africa
2
Postharvest Technology Research Laboratory, South African Research Chair in Postharvest Technology, Department of Horticultural Sciences, Faculty of AgriSciences, Stellenbosch University, Private Bag X1, Matieland, Stellenbosch 7602, South Africa
3
Postharvest Technology Research Laboratory, South African Research Chair in Postharvest Technology, Department of Food Science, Faculty of AgriSciences, Stellenbosch University, Private Bag X1, Matieland, Stellenbosch 7602, South Africa
4
Department of Animal Sciences, Faculty of AgriSciences, Stellenbosch University, Private Bag X1, Matieland, Stellenbosch 7602, South Africa
*
Author to whom correspondence should be addressed.
Sustainability 2019, 11(6), 1746; https://0-doi-org.brum.beds.ac.uk/10.3390/su11061746
Submission received: 15 February 2019 / Revised: 15 March 2019 / Accepted: 19 March 2019 / Published: 22 March 2019
(This article belongs to the Collection Food Additives and Sustainability)

Abstract

:
The drive towards sustainable food systems coupled with increased consumer sophistication have prompted innovation in waste valorization. Grape and citrus processing by-products, abundant in the Mediterranean and tropical regions, respectively, are expanding and are sustainable sources of bioactive phytochemicals that can be used as natural preservatives for foods. Phytochemical composition, antioxidant, and antimicrobial properties of extracts from grape pomace (GPE), seeds (GSE), and clementine mandarin peel and pulp (MPE) grown in South Africa were analyzed. Total phenols and carotenoids were highest in GPE followed by GSE and MPE (p ≤ 0.05). Flavonoids and anthocyanins were higher (p ≤ 0.05) in GPE and GSE compared to MPE. The GSE had the highest proanthocyanidins content followed by GPE and MPE (p ≤ 0.05). Ascorbic acid was only detected in MPE, which also had the highest titratable acidity and lowest pH values (p ≤ 0.05). The GSE had the highest antioxidant potency composite index followed by GPE and MPE (p ≤ 0.05). The order of antimicrobial activity of the extracts was MPE > GSE > GPE (p ≤ 0.05). Current findings show that GSE is a potential antioxidant while MPE holds promise as an antimicrobial for the food industry.

1. Introduction

Globally, about 1.6 billion tons of food are lost or wasted annually [1]. In South Africa, for example, annual postharvest food losses and wastes amount to 10 million tons [2], with about 95% of the food wastage occurring along the value chains prior to reaching the consumer. Food spoilage due to oxidative degradation and microbial action is an important contributor to wastage through reduction in quality and shelf-life, which in turn result in reductions in nutrition value, safety, and healthfulness of foods [3]. These degradative processes are exacerbated by particular food processing steps such as comminution, which increases surface area of foods and promotes interaction between pro-oxidants, enzymes, lipids, and proteins [4]. Synthetic preservatives are commonly used to inhibit and or delay these processes and enhance the quality, safety, and shelf stability of foods [3]. Consumer health concerns and sentiments against synthetic preservatives have, however, renewed fear and avoidance of foods containing these preservatives [5]. For example, cancer has historically been associated with nitrate and nitrites used in processed foods [5], while the use of benzoates has been linked to hyperactive behavior in children, allergies, asthma, and skin rashes [4,6,7]. Access of such information to the public influences their purchasing behavior towards trust and preference of foods preserved with natural preservatives [5,8]. These developments have prompted researchers to pursue natural preservatives mainly derived from plants, viewed as nutritious, safe, healthful, and promote sustainable food systems [3].
The global fruit processing industry creates large amounts of waste usually composed of stems, skin, peels, pulp, seed, and oilseed meals [9]. For example, at least 40% of the 1 million tons of mandarin produced annually in South Africa are channeled to juice production with waste accounting for 50% to 70% of the fresh weight comprising of peels (60%–65%), pulp (30%–35%), and seeds (<10%) [10]. In addition, 1.5 million tons of grapes are produced for wine production with pomace making up 20% to 25% (w/w) of the pressed grapes on dry matter basis [11]. Grape pomace is made up of stalks (~2%), seeds (~47%), skin, and pulp (~51%) [12,13]. Citrus and grape by-products are largely treated as waste and generally disposed of in landfills [14]. The high moisture and organic contents of these fruit by-products upon putrefaction, poses a significant risk to the environment through production of greenhouse gasses and contamination of water bodies [14]. In addition, transportation to disposal sites is a significant economic cost to the fruit processing industry [14].
Citrus and grape by-products are sustainable sources of valuable bioactive phytochemicals including ascorbic acid, tocopherols, tocotrienols, carotenoids, and several phenolic compounds [15,16]. Bioactive phytochemicals play an important role in preserving food quality by retaining flavor, color, texture, and nutrients, while reducing the chance of contracting a foodborne illness and potentially contributing in the prevention of chronic diseases due to their antioxidant properties [17]. In that regard, valorization of citrus and grape wastes has potential to unlock new value chains for the fruit processing industry and contribute immensely towards sustainable food systems. In South Africa, systematic research investigating preservative capabilities of extracts from grape and citrus by-products of local varieties is missing. In vitro studies with plant extracts rich in phenolic compounds have shown synergistic effects in antioxidant and antimicrobial tests because of their mixture of metabolites, which present multiple points of intervention [18,19]. For successful adoption of fruit by-product-based natural preservatives in sustainable food systems, key parameters such as photochemical composition, antioxidant and antimicrobial efficacy, safety, and stability during food processing should be known [7]. The objective of the current research was, therefore, to determine the phenolic composition, antioxidant, and antimicrobial properties of extracts from clementine mandarin peel and pulp, grape pomace, and seeds.

2. Materials and Methods

2.1. Chemicals and Reagents

Folin-Ciocalteau reagent, sodium carbonate, aluminium chloride, dimethyl sulfoxide (DMSO), butylated hydroxytoluene (BHT), hexane, sodium nitrite, and sodium hydroxide (Merck, Darmstadt, Germany); the standards gallic acid, catechins, L-ascorbic acid, (±)-6-hydroxy-2,5,7,8-tetramethylchromane-2-carboxylic acid (Trolox), and β-carotene, the reagents polyvinylpyrrolidone, 2,2-diphenyl-1-picryl-hydrazyl (DPPH), 2,4,6-Tris(2-pyridyl)-s-triazine (TPTZ), fluorescein sodium salt, 2,2′-azobis (2-methylpropionamidine) dihydrochloride (AAPH), sodium tetraborate, boric acid, xylenol orange, linoleic acid, 15-lipoxygenase enzyme, nordihydroguaiaretic acid (NDGA), Mueller-Hinton agar, Mueller Hinton broth, iodonitrotetrazolium chloride (INT), sodium metabisulphite, and tetracycline used in the current study were purchased from Sigma-Aldrich (Steinheim, Germany).

2.2. Sample Preparation

The fruit by-products used in the current study were grape pomace, grape seed, and clementine mandarin peel and pulp. Fresh grape (Vitis vinifera cv. Pinotage) pomace was obtained in January 2017 from Stellenbosch University’s Welgevallen Cellar (Stellenbosch, South Africa; S 33°56′22.38″ E 018°52′1.92″). Grape seed was a donation from Brenn-O-Kem Pty Ltd. (Wolseley, South Africa; 33.4181° S, 19.2385° E). Clementine mandarin (Citrus reticulata) peel and pulp were sourced in September 2017 from Citrusdal (Western Cape, South Africa; 32°34′41.2″ S, 19°00′36.2″ E). Before drying, the mandarin peel and pulp was washed. All fruit by-products were collected in batches over six consecutive days (6 batches). Each collection day, approximately eight tons of grape and about 10 tons of mandarin were processed and a representative sample (2 kg) of fresh by-product collected (n = 6 pressings). The sample from each day’s pressing for each fruit by-product was further divided into three 500 g fractions. Samples were oven dried at 60 °C for 72 h and then ground into fine powders using a Wiley mill (Model 4, Thomas Scientific, Swedesboro, NJ, USA) to pass through a 1-mm sieve. These were then stored at −20 °C, pending extraction.

2.3. Polyphenol Extraction

Solid–liquid extraction of the three fruit by-products was performed using the modified method of Yilmaz and Toledo [20] at Brenn-O-Kem (Pty) Ltd., Wolseley, South Africa. The ground samples were defatted by a washing step in hot water before extraction using 62% ethanol (1:10, w/v). The extracts were recovered using a filter press (Model KFP639/20, Schenk, South Africa) and the filtrate was vacuum-dried using a single-stage, liquid ring vacuum pump (Model MHF-150, Nash, WI, USA) to eliminate the solvent. The dried extracts were then ground (0.1 µm) into a powder. Before the determination of phytochemicals, the powdered extracts were separately weighed and re-suspended in 62% ethanol.

2.4. Phytochemical Analyses

2.4.1. Determination of Total Phenols and Tannins

Total phenolics and tannins of the extracts were determined by the Folin-Ciocalteu colorimetric method [21]. Absorbance was read at 725 nm using a UV-visible spectrophotometer (Thermo Scientific Technologies, Madison, WI, USA). Tannin content was calculated as the difference between the total phenolics before and after polyvinylpyrrolidone treatment. Measurement was carried out in triplicate and calculated from a calibration curve obtained with gallic acid as the standard. The content of total phenolics was expressed as g gallic acid equivalents (GAE)/100 g extract dry matter (DM).

2.4.2. Determination of Total Flavonoids

Total flavonoid content of the extracts was determined with the procedure described by Yang et al. [22]. Briefly, a 0.25 mL aliquot of extracts (1:10 dilution) was mixed with 1.25 mL of deionized water and added to 0.075 mL of 5% sodium nitrite solution. This was allowed to react for 5 min after which 0.15 mL of 10% aluminum chloride was added. After 6 min, a 0.5 mL volume of 1 M sodium hydroxide was added to stop the reaction. Final mixture volume was then brought to 3 mL by adding deionized water. Absorbance of the mixture was immediately measured at a 510 nm against a prepared blank using a UV-visible spectrophotometer. The total flavonoid content was determined by a catechin standard curve and expressed as g of catechin equivalents (CE)/100 g extract DM.

2.4.3. Total Monomeric Anthocyanins

Total monomeric anthocyanin content was determined using the pH-differential method described by Giusti and Wrolstad [23]. Extracts were mixed thoroughly with 0.025 M potassium chloride buffer pH 1 in a 1:2 ratio of extract to buffer. Similarly, extracts were mixed with a sodium acetate buffer pH 4.5. Absorbance was read at 510 and 700 nm using a Thermo Scientific Technologies spectrophotometer against a buffer blank at pH 1.0 and 4.5. Readings were converted to total milligrams of cyanidin 3-glucoside (C3G). The anthocyanin content was calculated as follows
T o t a l   m o n o m e r i c   a n t h o c y a n i n s   ( g 100 g ) = Δ A   × M W   ×   1000 ε   × C
Δ A = ( A 510   A 700 ) p H 1.0   ( A 510   A 700 ) p H 4.5
where A is absorbance, MW is the molecular weight for C3G (449.2), ε is the molar absorptivity of C3G (26,900), and C is the concentration of extract in grams per milliliter. The total monomeric anthocyanin content was expressed as cyanidin-3-glucoside equivalent (g/100 g extract DM).

2.4.4. Proanthocyanidins

Determination of proanthocyanidins was performed according to the method of Porter et al. [24]. Resuspended samples of extracts were diluted with distilled water, followed by addition of a 3.0 mL volume of butanol–HCl (95:5) and 0.1 mL ferric reagent. The mixtures were vortexed, held in a boiling water bath for 60 min, and then cooled to room temperature. Absorbance was recorded at 550 nm using a UV-visible spectrophotometer (Thermo Scientific Technologies, Madison, WI, USA). Proanthocyanidin concentration was expressed as cyanidin equivalent (g CyE/100 g extract DM).

2.4.5. Total Carotenoids

Total carotenoids were determined following the method of De Carvalho et al. [25]. The absorbance of the samples was measured at 470 nm using a UV-visible spectrophotometer (Thermo Scientific Technologies, Madison, WI, USA), against an ethanol: hexane, BHT blank. Estimates were calculated from a calibration curve obtained with β-carotene as the standard and expressed in g/100 g extract DM.

2.4.6. Ascorbic Acid

Ascorbic acid content of extracts was determined using a colorimetric method as described by Mphahlele et al. [26]. Estimations were calculated from a calibration curve obtained with ascorbic acid as the standard and the content expressed as g ascorbic acid (AA)/100 g extract DM.

2.5. Titratable Acidity and pH

Titratable acidity of extract samples was determined using an automatic titrator (Metrohm Compact Titrosampler, Herisau, Switzerland). Triplicate samples (2 g) were diluted with 70 mL of deionized water and titrated against 0.1 M sodium hydroxide solution until the end-point pH of 8.1 was reached. The results were expressed as tartaric acid equivalent (%, g/100 g solids). The pH of extract samples was measured in triplicate with a standard pH meter after calibration with pH 4.0 and 7.0 buffers.

2.6. Antioxidant Activity Assays

Multiple antioxidant evaluation assays namely; 2,2-diphenyl-1-picrylhydrazyl radical scavenging activity (DPPH), ferric reducing antioxidant power (FRAP), oxygen radical absorbance capacity (ORAC) and lipoxygenase (15-LOX) inhibition were employed to sufficiently evaluate the antioxidant activity of the fruit by-product extracts. The DPPH and FRAP assays are electron transfer-based assays, while the ORAC and lipoxygenase (15-LOX) assays are hydrogen atom transfer reaction assays.

2.6.1. 2,2-Diphenyl-1-Picrylhydrazyl (DPPH) Radical Scavenging Activity

The assay was performed according to the method of Tolic et al. [27], based on the reduction of stable DPPH radical in the presence of antioxidants. Absorbance measurements were made at 517 nm against a methanol blank using a UV-visible spectrophotometer (Thermo Scientific Technologies, Madison, WI, USA). Absorption of a sample containing the same amount of methanol and DPPH solution acted as a negative control, while L-ascorbic acid was used as positive control. The EC50 for each treatment, sample concentration providing 50% of antioxidant activity [28], was calculated and the result expressed in mg/mL, for comparison against ascorbic acid, and as Trolox equivalents (TE)/g extract.

2.6.2. Determination of Ferric Reducing Antioxidant Power (FRAP)

The FRAP assay was conducted according to Benzie and Strain [29]. The method is based on the reduction of the Fe3+-2,4,6-tripyridyl-s-triazine (TPTZ) complex to the ferrous form at low pH. This reduction is monitored by measuring the absorbance change at 595 nm. A standard curve was prepared using different concentrations (0–1800 µM) of Trolox. FRAP values were calculated according to the calibration curve and they were expressed as Molar Trolox equivalents (M TE)/g extract.

2.6.3. Oxygen Radical Absorbance Capacity (ORAC)

The assay was performed according to Gillespie et al. [30] and measures the free radical oxidation of a fluorescent probe through the change in its fluorescent intensity. Fluorescence kinetic readings were measured with an excitation wavelength of 485 nm and an emission wavelength of 530 nm. Readings were taken using a Tecan Spark 10 M multimode microplate reader (Männedorf, Switzerland). The assay temperature was kept at 37 °C and duration was 1 h. The ORAC values were calculated using the area under the curve (AUC) for the standard and samples. A standard curve was obtained by plotting the Trolox standards against the average AUC. The half maximal effective concentration (EC50) for each treatment was calculated and the result expressed in µg/mL, also for comparison against ascorbic acid, and as Trolox equivalents (TE)/g extract.

2.6.4. 15-Lipoxygenase (15-LOX) Inhibition Assay

The 96-well microplate-based ferrous oxidation-xylenol (FOX) assay was carried out according to the method described by Waslidge and Hayes [31]. Extract samples were reconstituted in 10% dimethyl sulfoxide (DMSO) and filtered. Concentration range of the extracts ranged from 2.44 × 10⁻³–80 µg/mL. Blank wells were prepared by adding 70 µL of assay buffer (borate buffer, 0.2 M) in triplicate. Positive control wells contained 50 µL of 960 U/mL LOX and 20 µL of nordihydroguaiaretic acid (NDGA), which was used as the positive control inhibitor in the assay. 100% initial activity (IA) wells were prepared by adding 50 µL of LOX and 20 µL of 10% DMSO. Sample wells (inhibitor) contained 50 µL of LOX and 20 µL of extract. The reaction was then initiated by adding 50 µL of substrate (Linoleic acid; 356 µM) to all the wells of a 96-well plate with further incubation for 10 min after which 100 µL of FOX was added to each well to terminate the reaction. The Fe3+-dye complex was allowed to develop for 30 min at room temperature and the absorbance read at 570 nm on a 96-well Multiskan Microplate Photometer (Thermo Scientific, Shanghai, China). All data points were measured in triplicate and the results are presented as mean ± SD. The percent lipoxygenase inhibition for each extract was determined as follows:
I n h i b i t i o n = [ 1   I A I n h i b i t o r I A ] × 100
The IC50 values for each extract were calculated and the result expressed in µg/mL of solvent.

2.7. Antimicrobial Susceptibility Testing

2.7.1. Culture of Microorganisms and Suspension Preparation

Antibacterial activity was tested against three Gram-positive bacteria (Listeria monocytogenes ATCC 7644, Enterococcus faecalis ATCC 29212, and Staphylococcus aureus ATCC 29213), two Gram-negative bacteria (Escherichia coli ATCC 25922, Pseudomonas aeruginosa ATCC 27853) and one yeast (Candida albicans ATCC 14053) obtained from ThermoFisher Scientific (Johannesburg, South Africa). Each strain was separately grown on Muller-Hinton (MH) agar (24 h at 35 °C for bacteria, and 48 h at 25 °C for yeast), after which a fresh working suspension was then prepared by suspending in 0.85% saline solution. Regulation of the initial suspension turbidity for the microbes was conducted by comparison of microbial suspension in sterile 0.85% saline with 0.5 McFarland’s standard. The adjustment standard is equivalent to concentrations of 1–5 × 10⁸ and 1–5 × 10⁷ cfu/mL for bacteria and fungi, respectively. In addition, 1:100 dilutions of the regulated suspensions were made in sterile MH broth to result in a final inoculum of approximately 1.5 × 10⁶ cfu/mL for bacteria and 1.5 × 10⁵ cfu/mL for fungi.

2.7.2. Minimum Inhibitory Concentration

Minimum inhibitory concentration (MIC) of the extracts were determined using a modified broth microdilution method as described by Eloff [32] and Oliveira et al. [33]. Tetracycline was used as the positive control while sodium metabisulphite is a commercial antimicrobial preservative used in meat and other foods in South Africa. Test plates were covered with parafilm and incubated at 35 °C for 22 ± 2 h for bacteria and 28 °C for 48 h for yeast. Microbial growth was detected after incubation by addition of 40 µL of an iodonitrotetrazolium (INT) ethanolic solution (0.2 mg/mL). The trays were again incubated at 35 °C for 1 h, and in those wells, where microbial growth occurred, INT changed from yellow to purple. The MIC values were defined as the lowest concentration of each natural product, which completely inhibited microbial growth. The results were expressed in milligrams per milliliter.

2.8. Data Analyses

The EC50 values for DPPH, ORAC, and IC50 values for lipoxygenase were calculated from the logarithmic non-linear regression curve derived from the plotted data using GraphPad Prism software version 4.03 (GraphPad Software, Inc., San Diego, CA, USA). For each of the antioxidant method, an antioxidant index score of the sample was calculated according to the formula:
A n t i o x i d a n t   I n d e x   s c o r e = [ ( S a m p l e   s c o r e B e s t   s c o r e ) × 100 ]
For DPPH and ORAC, two scores were calculated based on EC50 and Trolox equivalence values. Antioxidant potency composite (APC) index was then calculated as the average of the antioxidant index score of each method [34]. The extracts’ overall antioxidant activities were ranked based on the APC index.
Data for phenolic composition, antioxidant, and antimicrobial activity were analyzed using a general linear model (GLM) procedure of SAS (SAS Institute Inc., Cary, NC, USA). The total number of observations for phenolic content and antioxidant activity data were 54 (3 fruit by-products × 6 pressings × 3 replications). After averaging the replications, the remaining 18 observations were subjected to analysis of variance using the following model:
y i j =   μ   +   t i +   ε i j
where   y i j is the response variable (phenolic content, antioxidant activity, and antimicrobial activity), µ is the overall mean, ti is the effect of the ith type of type of fruit by-product (GPE, GSE, and MPE), and ɛij is the error term. Treatment means were generated using the LSMEANS option and separated using Tukey’s multiple comparison test. Differences were declared at the p ≤ 0.05 significance level. Furthermore, principal component analysis was used to determine the relationships between the phenolic content with antioxidant and antimicrobial activities using the XLSTAT version 2018.5 (Addinsoft, Boston, USA).

3. Results and Discussion

3.1. Phytochemical Content, pH, and Titratable Acidity

Phenolic content, pH, and titratable acidity data are shown in Table 1. Total phenolic content of the extracts was significantly (p ≤ 0.05) influenced by type of fruit by-product. Total phenolic content was highest in GPE with intermediate and lowest contents in GSE and MPE, respectively (p ≤ 0.05). The observation that type of fruit by-product had an effect on the phenolic content is consistent with literature showing that the primary source of variation emanates from species differences [35].
The observed differences in phenolic content between GPE and GSE mainly stem from tissue differences. In response to fluctuating environmental conditions and developmental stage, fruits synthesize and localize phenolic compounds differently in various internal structures (i.e., cells, organelles) depending on function and need, which then becomes important when the fruit by-products are collected for the retrieval of phenolics [34,36]. These findings pertaining to differences in the localization of phenolics also agree with Veberic [35], who reports that diverse plant organs or tissues can be characterized by different phenolic composition.
The total phenolic content of GPE observed in this study is similar to that reported by Katalinic et al. [37] and slightly higher than that reported by Xu et al. [38], which had a content in the range of 5.55–15.4 g GAE/100 g. The observed GSE phenolic content was within the range of 2.13–16.5 g CE/100 g DW reported by Rockenbach et al. [39] and higher than the range of 2.12–6.77 g GAE/100 g reported by Tseng and Zhao [40]. The difference of observed values from the latter was attributed to the solvent system of 70% acetone /0.1% HCl /29.9% water (v/v/v) at a solvent to pomace powder ratio of 4:1 (v/w) employed for extraction by Xu et al. [38]. The observed phenolic content of MPE was in the range of 0.67–19.62 g CE/100 g from a variety of cultivars reported by M’hiri et al. [15].
The GPE had higher (p ≤ 0.05) tannin content than GSE and MPE, with no significant difference between the latter two (p > 0.05). The tannin content observed for GPE was similar to that reported by Xu et al. [38], while that for GSE was in the range reported by Ky et al. [41]. Since citrus fruits are not known to contain tannins [42], it can be speculated that the observed value could have come from the reaction of Folin–Ciocalteau reagent with melanoidins formed during drying of mandarin extract [15].
Compared to MPE, flavonoid content was higher (p ≤ 0.05) in GPE and GSE, with no significant difference between the latter two (p > 0.05). The total flavonoid contents observed for GPE and GSE were consistent with previous studies [38,43]. According to Yang et al. [22], grape berry flavonoids such as the anthocyanins and flavanols (quercetin), are mainly localized in the skins while the flavan-3-ols (catechins) are present both in the skins and in the seeds. That partly explains why the content of flavonoids in the GPE and GSE was not significantly different. The MPE had total flavonoid content in the range reported by M’hiri et al. [15].
Proanthocyanidin content was highest in GSE, followed by GPE and MPE, in that order (p ≤ 0.05). According to Yu and Ahmedna [44], proanthocyanidins found in GSE are soluble in the organic solvent used in the extraction process as they are small compounds which are mainly monomeric and oligomeric in nature. In contrast, GPE proanthocyanidins are of a high-molecular weight and represent what is termed the non-extractable polyphenols [12,44]. These non-extractable polyphenols remain complexed within the cellular matrix to proteins or cell wall polysaccharides rendering them insoluble and requiring hydrolysis to release them [12]. The low proanthocyanidin content of MPE could be that they exist in the citrus genus in an un-extractable form or that there is low to none, as reported by Hellstro et al. [42]. The MPE had lower (p ≤ 0.05) anthocyanin content compared to GPE and GSE that had no significant (p > 0.05) difference in anthocyanin content. This finding agrees with M’hiri et al. [15] who reported that anthocyanins are minor compounds in citrus fruits with further evidence provided by Butelli et al. [45].
Grape seed extract had the highest content of total carotenoids, with moderate levels in GSE and the lowest for MPE (p ≤ 0.05). The variation between GSE and GPE could be ascribed to tissue differences as explained earlier for phenolic compounds. There was no ascorbic acid detected in the GPE and GSE extracts. This is in contrast to previous research by Sousa et al. [46] who found GPE to have 26.3 mg of acid ascorbic/100 g. The contrast can be attributed to the difference in grape cultivars used, with Sousa et al. [46] having used grapes from the Vitis vinifera L. Benitaka variety. Ascorbic acid values for MPE were consistent with range given by M’hiri et al. [15].
All the extracts were acidic, with pH ranging from 3.41 to 4.26. The extracts followed the order of MPE > GPE > GSE in decreasing acidity (p ≤ 0.05; Table 1). This order was also true for titratable acidity, with MPE, GPE, and GSE having the highest, intermediate, and lowest titratable acidity, respectively (p ≤ 0.05).

3.2. In Vitro Antioxidant Activity

In this section we tested the hypothesis that red grape pomace (Vitis vinifera L. var. Pinotage), grape seed, and clementine mandarin peel and pulp (Citrus reticulata) extracts do not have in vitro antioxidant capacity. The results for antioxidant activity are presented in Table 2. The GSE exhibited the strongest radical scavenging activity (DPPH) followed by GPE and MPE in decreasing order. Ascorbic acid had the lower EC50 values compared to the three fruit extracts (p ≤ 0.05). A similar trend for antioxidant activity of the extracts was observed for the FRAP assay (GSE > GPE > MPE; p ≤ 0.05). These findings could be attributed to anthocyanins, flavonoids, and proanthocyanidins contents of the respective extracts. This is supported by negative correlations between DPPH EC50 values with anthocyanin and flavonoid contents, suggesting low effective concentration (i.e., high potency) in samples with high contents of anthocyanin and flavonoid, albeit non-significant (p > 0.05). Similarly, there was a positive correlation between the reducing power (FRAP) and anthocyanin content in the investigated samples (Table 3; Figure 1). Xu et al. [38] found similar results showing that the antioxidant activity is highly correlated with anthocyanins, flavonoids, and proanthocyanidins, which act as hydrogen and electron donors, free radical scavengers, non-radical scavengers of reactive oxygen species, chelators of transitional metal ions, and enzyme inhibitors [47]. The electron-donating ability of these flavonoid derivatives is based on their structure, which allows hydrogen or electron donation capacity, ability to stabilize and delocalize the unpaired electron, and their potential to chelate transition metal. While the DPPH assay lacks the presence of oxygen radicals present in nature, it retains relevance based on the assumption that extract antioxidant capacity is equal to electron donating capacity or reducing power demonstrated [27]. In the same manner, the FRAP assay results are interpreted based on the assumption that capability of antioxidants to reduce ferric ions, reflects their ability to reduce reactive oxygen species [29]. Both methods, therefore, demonstrate that extracts from fruit by-products have antioxidant properties performing greater than ascorbic acid used commercially.
With regards to ORAC assay, GSE exhibited the greatest antioxidant capacity as shown by the lowest EC50 and Trolox equivalents values, followed by MPE and GPE with ascorbic acid having the lowest capacity. This was also the trend in the lipoxygenase (LOX) assay, where the order of antioxidant activity was GSE > MPE > GPE (p ≤ 0.05). The extracts, however, had much higher IC50 compared to NDGA, a known inhibitor of 15-lipoxygenase enzyme. The ORAC and lipoxygenase assays had a strong correlation with total phenols and total tannins (Table 3; Figure 1). The high radical quenching ability, as well as lipoxygenase inhibition of GSE, agrees with previous research by Yilmaz and Toledo [20], who attributed the high antioxidant capacity of GSE to the hydrogen donating activity of dimeric, trimeric, oligomeric, and/or polymeric procyanidins. Guitard et al. [48] report that in procyanidins, the bonding of the pyrogallol and gallolyl moieties drastically reduces the bond dissociation enthalpy which greatly favors transfer of the phenolic hydrogen to free radicals as is demonstrated in hydrogen atom-transfer assays. These free radicals are most often in the form of reactive oxygen species which are known to result in unrestricted oxidation of DNA, proteins, and membrane lipids [30].
The observed high-antioxidant capacity of GSE is also attributed to its proanthocyanidin fraction, which has a structure that allows them to trap more radicals per molecule of antioxidant, giving them greater antioxidant activity [48]. Brewer [49] also points out that proanthocyanidins contain multiple hydroxyl groups that can donate hydrogen, quench oxygen radicals, and chelate metals.
The greater ORAC and lipoxygenase antioxidant activity of MPE compared to GSE could have been from the high ascorbic acid content of OPE. The ascorbic acid antioxidant mechanism is through quenching of reactive oxygen species and enzyme reduction [36]. Overall, GSE had the most antioxidant activity of all the extract across all the assays employed as seen by its rank according to the calculated APC index in Table 2. It is, therefore, suggested that GSE could be regarded for application in the food matrix as an antioxidant based on its in vitro performance.

3.3. In Vitro Antimicrobial Activity

The hypothesis that red grape pomace (Vitis vinifera L. var. Pinotage), grape seed, and clementine mandarin peel and pulp (Citrus reticulata) extracts do not have in vitro antimicrobial capacity was tested. Results obtained indicate that antimicrobial activity varied significantly (p ≤ 0.05) amongst the investigated extracts (Table 4). Overall, the order of antibacterial activity for the extracts MPE > GSE > GPE. Both the positive control and the commercial preservative exhibited strong inhibitory activity, greater than that of the extracts, against Listeria monocytogenes, Enterococcus faecalis, Staphylococcus aureus, Escherichia coli, Pseudomonas aeruginosa, and Candida albicans in line with previous studies [50].
In terms of the extracts, MPE had the greatest antimicrobial activity as observed by the low MIC across all the microorganisms tested (p ≤ 0.05). The antimicrobial activity of MPE could be due to its high acidity levels. This is indicated by the strong negative correlation between MPE, ascorbic acid, acidity levels with S. aureus, P. aeruginosa, and E. coli microbial MIC (Table 3; Figure 1). The antimicrobial activity of organic acids involves the un-dissociated organic acids entering the bacterial cell, causing membrane disruption (leakage, transport mechanisms), inhibition of essential metabolic reactions such as glycolysis, stress on intracellular pH homeostasis, accrual of toxic anions, and energy stress response to restore homeostasis.
The inhibitory effect of the extracts against S. aureus, E. coli, and P. aeruginosa was highly correlated with flavonoid, anthocyanin, and proanthocyanidins content (Table 3; Figure 1), in agreement with the results of Wu et al. [51] and Peixoto et al. [28]. Hydroxylated flavonoids such as kaempferol were observed by Wu et al. [51] to have an inhibitory effect on E. coli, with a strong correlation between the DNA gyrase enzyme inhibition IC50 and antibacterial MIC values indicating the importance of bacterial enzyme inhibition effect. As such, Wu et al. [51] concluded that an important mechanism in the antimicrobial activity of flavonoids is the inhibition of microbial enzyme. An example of such is DNA gyrase which is involved in the transcription, replication of DNA, and chromosome segregation process [51]. The correlations between flavonoid, anthocyanin, and proanthocyanidins groups with bacterial inhibition are in support of previous research findings by Lee and Paik [7]. Their work highlighted that the phenolic profile, as opposed to individual phenolics, is essential in giving strong antimicrobial effect as different phenolics present multiple mechanisms.
Overall, the extracts were found to be more effective against the Gram-positive bacteria (S. aureus, E. faecalis, and L. monocytogenes) and yeast than against the Gram-negative (P. aeruginosa and E. coli). This is consistent with studies done by Jayaprakasha et al. [52] and Peixoto et al. [28] showing that Gram-positive bacteria are more susceptible to plant phenolic extracts than Gram-negative bacteria.
The presence of a unique liposaccharide cell wall [38], deactivation and metabolism of phenolic compounds such as hydroxycinnamic acids, as well as presence of efflux pumps on organisms like E. coli [53], are reported as the mechanisms of reduced susceptibility by Gram-negative bacteria. However, the antimicrobial activity demonstrated by MPE has positive implications in that it presents a viable substitute to sulphites, thereby reducing the allergenic risk posed by the use of the synthetic preservative [53].

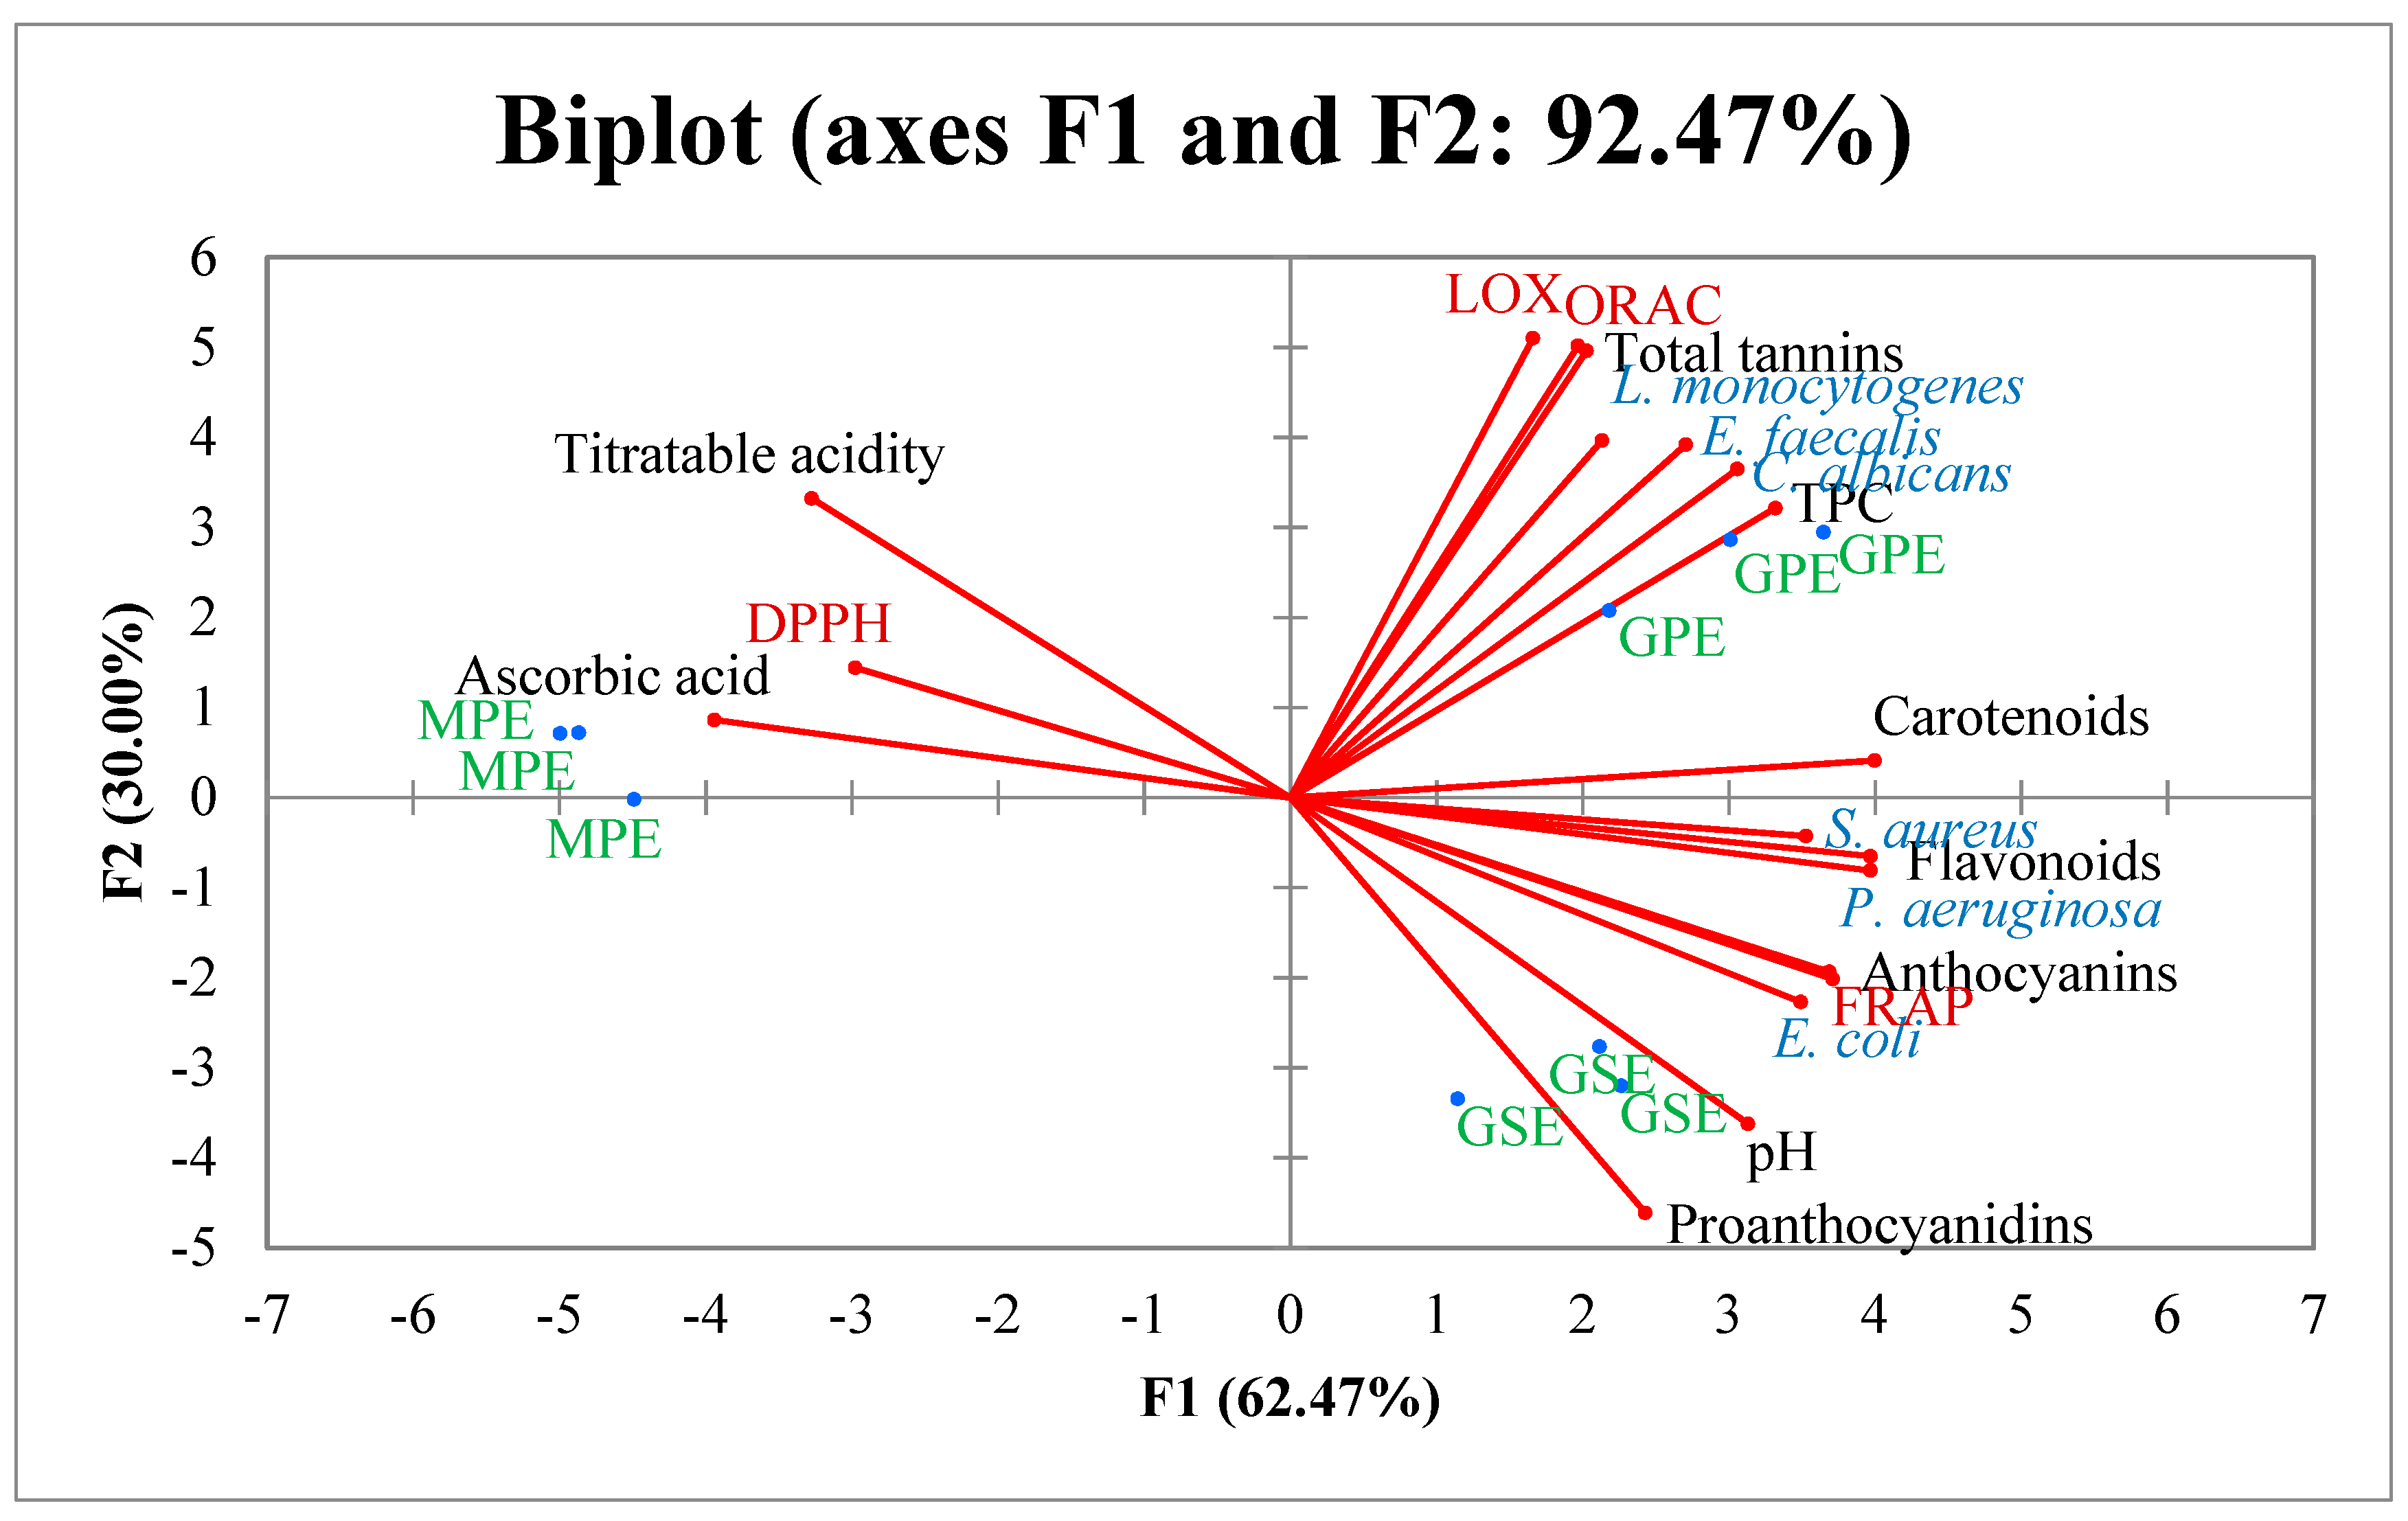
3.4. Principal Component Analysis

Principal component analysis was performed as an exploratory data analysis tool to visualize and differentiate the three extracts based on the composition and bioactivity profiles. The score plot of the PCA analysis showed that 92.5% of the variability was explained by the first two components, which accounted for 62.5% and 30.0% of the total variance, respectively. The factor of analysis showed that the variables with higher contribution for the separation of the treatments on PC1 were total tannins, flavonoids, anthocyanins, carotenoids, ascorbic acid, pH, titratable acidity, S. aureus, P. aeruginosa, E. coli, C. albicans, DPPH, and FRAP. Along PC1, ascorbic acid, titratable acidity, and DPPH contributed to negative scores. For PC2, the variables that contributed on the separation were total tannins, proanthocyanidins, ORAC, and LOX. Based on the separations obtained in PC1 and PC2, it was observed that the source of extract (type of fruit by-product) was the factor that contributed more to the phytochemical composition and level of bioactivity. The level of ascorbic acid was the main factor that influenced the pH level, titratable acidity, and antimicrobial activity. On the other hand, the amount of proanthocyanidins, which makes up a large proportion of total tannins influenced the level of radical quenching (ORAC) and enzyme inhibition (LOX).
Based on the observed in vitro performance, it is suggested that GSE and MPE could be regarded for application in the food matrix as natural antioxidants and antimicrobials, respectively. Utilization of bioactive-rich citrus and winery by-products could provide an efficient, inexpensive, easily available, and environmentally friendly platform for the production of natural and sustainable food preservatives. Purification of the extracts can possibly increase bioactivity of these extracts [54]. In-depth analysis of the phenolic profile of the extracts using methods such as HPLC, to understand composition and isolation of active ingredients, is important. In addition, research is also necessary to establish bioavailability and real benefits of these extracts obtained from fruit by-products in a food matrix. Further studies to validate the safety and efficacy of such products for human use are also warranted.

4. Conclusions

The highest contents of total phenols, tannins, and carotenoids were found in GPE while GSE contained the highest content of proanthocyanidins and MPE had the greatest content of ascorbic acid. The GSE showed the best antioxidant activity whereas MPE had the greatest antimicrobial potential. Thus, GSE and MPE extracts can be considered for potential food matrix application either individually or in combination as excellent sources of antioxidant and antimicrobial, respectively. Valorization of these fruit by-products as natural food preservatives has potential to unlock new value chains for the fruit processing industry and contribute immensely towards sustainable food systems.

Author Contributions

T.M.P. wrote the manuscript with inputs and editorial assistance of C.M., O.A.F., and M.M., while P.A.G. and U.L.O. provided laboratory space and reviewed the manuscript. C.M. conceptualized the study and acquired funding. All authors read and approved the final manuscript.

Funding

Authors acknowledge Research and Technology Funds from National Research Foundation (RTF-NRF) Grant No: 98700, NRF Competitive Programme for Rated Researchers (NRF-CPRR) Grant No: 105977 for research funding and Red Meat Research and Development South Africa (RMRD SA) Grant No: S005609. Pfukwa acknowledges NRF-CPRR (Grant No: 105977) and NRF Freestanding, Innovation and Scarce kills Development Fund (Grant Ref: SFH170705248685) for his bursary.

Acknowledgments

Authors are grateful to Cape Fruit Processors (Citrusdale, Western Cape, South Africa) for the provision of clementine mandarin peels and pulp. Brenn-O-Kem (Wolseley, Western Cape, South Africa) is highly acknowledged for the provision of GSE and extraction of GPE and MPE.

Conflicts of Interest

The authors declare that there is no conflict of interest.

References

  1. FAO Food Wastage Footprint: Impacts on Natural Resources—Summary Report. Available online: http://www.fao.org/docrep/018/i3347e/i3347e.pdf (accessed on 22 June 2018).
  2. WWF-South Africa Food Loss and Waste: Facts and Futures Taking Steps towards a more Sustainable Food Future (FOOD 2017 Report). Available online: http://awsassets.wwf.org.za/downloads/WWF_Food_Loss_and_Waste_WEB.pdf (accessed on 5 June 2018).
  3. Kumar, Y.; Yadav, D.N.; Ahmad, T.; Narsaiah, K. Recent trends in the use of natural antioxidants for meat and meat products. Compr. Rev. Food Sci. Food Saf. 2015, 14, 796–812. [Google Scholar] [CrossRef]
  4. Hugo, C.J.; Hugo, A. Current trends in natural preservatives for fresh sausage products. Trends Food Sci. Technol. 2015, 45, 12–23. [Google Scholar] [CrossRef]
  5. Bedale, W.; Sindelar, J.J.; Milkowski, A.L. Dietary nitrate and nitrite: Benefits, risks, and evolving perceptions. Meat Sci. 2016, 120, 85–92. [Google Scholar] [CrossRef] [PubMed]
  6. Bateman, B.; Warner, J.O.; Hutchinson, E.; Dean, T.; Rowlandson, P.; Gant, C.; Grundy, J.; Fitzgerald, C.; Stevenson, J.; Warner, J. The effects of a double blind, placebo controlled, artificial food colourings and benzoate preservative challenge on hyperactivity in a general population sample of preschool children. Arch. Dis. Child. 2004, 89, 506–511. [Google Scholar] [CrossRef] [PubMed] [Green Version]
  7. Lee, N.; Paik, H. Status, antimicrobial mechanism, and regulation of natural preservatives in livestock food systems. Korean J. Food Sci. Anim. Resour. 2016, 36, 547–557. [Google Scholar] [CrossRef] [PubMed]
  8. Hung, Y.; de Kok, T.M.; Verbeke, W. Consumer attitude and purchase intention towards processed meat products with natural compounds and a reduced level of nitrite. Meat Sci. 2016, 121, 119–126. [Google Scholar] [CrossRef]
  9. Djilas, S.; Čanadanović-Brunet, J.; Ćetković, G. By-products of fruits processing as a source of phytochemicals. Chem. Ind. Chem. Eng. Q. 2009, 15, 191–202. [Google Scholar] [CrossRef]
  10. Sharma, K.; Mahato, N.; Cho, M.H.; Lee, Y.R. Converting citrus wastes into value-added products: Economic and environmently friendly approaches. Nutrition 2017, 34, 29–46. [Google Scholar] [CrossRef]
  11. SAWIS. SA Wine Industry Statistics NR 40 2016; South African Wine Industry Statistics: Paarl, South Africa, 2016. [Google Scholar]
  12. Beres, C.; Costa, G.N.S.; Cabezudo, I.; da Silva-James, N.K.; Teles, A.S.C.; Cruz, A.P.G.; Mellinger-Silva, C.; Tonon, R.V.; Cabral, L.M.C.; Freitas, S.P. Towards integral utilization of grape pomace from winemaking process: A review. Waste Manag. 2017, 68, 581–594. [Google Scholar] [CrossRef]
  13. Zhang, N.; Hoadley, A.; Patel, J.; Lim, S.; Li, C. Sustainable options for the utilization of solid residues from wine production. Waste Manag. 2017, 60, 173–183. [Google Scholar] [CrossRef]
  14. Siles, J.A.; Vargas, F.; Gutiérrez, M.C.; Chica, A.F.; Martín, M.A. Bioresource technology integral valorisation of waste orange peel using combustion, biomethanisation and co-composting technologies. Bioresour. Technol. 2016, 211, 173–182. [Google Scholar] [CrossRef] [PubMed]
  15. M’hiri, N.; Ioannou, I.; Ghoul, M.; Mihoubi Boudhrioua, N. Phytochemical characteristics of Citrus peel and effect of conventional and nonconventional processing on phenolic compounds: A review. Food Rev. Int. 2017, 33, 587–619. [Google Scholar] [CrossRef]
  16. Pourcel, L.; Routaboul, J.-M.; Cheynier, V.; Lepiniec, L.; Debeaujon, I. Flavonoid oxidation in plants: From biochemical properties to physiological functions. Trends Plant Sci. 2007, 12, 29–36. [Google Scholar] [CrossRef] [PubMed]
  17. Stintzing, F.C.; Carle, R. Functional properties of anthocyanins and betalains in plants, food, and in human nutrition. Trends Food Sci. Technol. 2004, 15, 19–38. [Google Scholar] [CrossRef]
  18. Gyawali, R.; Ibrahim, S.A. Natural products as antimicrobial agents. Food Control 2014, 46, 412–429. [Google Scholar] [CrossRef]
  19. Khasawneh, M.A.; Elwy, H.M.; Hamza, A.A.; Fawzi, N.M.; Hassan, A.H. Antioxidant, anti-lipoxygenase and cytotoxic activity of Leptadenia pyrotechnica (Forssk.) Decne Polyphenolic Constituents. Molecules 2011, 16, 7510–7521. [Google Scholar] [CrossRef] [PubMed]
  20. Yilmaz, Y.; Toledo, R.T. Major flavonoids in grape seeds and skins: Antioxidant capacity of catechin, epicatechin, and gallic acid. J. Agric. Food Chem. 2004, 52, 255–260. [Google Scholar] [CrossRef]
  21. Makkar, H.P.S. Quantification of Tannins in Tree Foliage: A Laboratory Manual; Kluwer Academic Publishers: Vienna, Austria, 2000. [Google Scholar]
  22. Yang, J.; Martinson, T.E.; Liu, R.H. Phytochemical profiles and antioxidant activities of wine grapes. Food Chem. 2009, 116, 332–339. [Google Scholar] [CrossRef]
  23. Giusti, M.M.; Wrolstad, R.E. Characterization and measurement of anthocyanins by UV—Visible spectroscopy. Curr. Protoc. Food Anal. Chem. 2001, 00, F1.2.1–F1.2.13. [Google Scholar] [CrossRef]
  24. Porter, L.J.; Hrstich, L.N.; Chan, B.G. The Conversion of procyanidins and prodelphinidins to cyanidin and delphinidin. Phytochemistry 1986, 25, 223–230. [Google Scholar] [CrossRef]
  25. De Carvalho, L.M.J.; Gomes, P.B.; De Oliveira Godoy, R.L.; Pacheco, S.; Do Monte, P.H.F.; De Carvalho, J.L.V.; Nutti, M.R.; Neves, A.C.L.; Vieira, A.C.R.A.; Ramos, S.R.R. Total carotenoid content, α-carotene and β-carotene, of landrace pumpkins (Cucurbita moschata Duch): A preliminary study. Food Res. Int. 2012, 47, 337–340. [Google Scholar] [CrossRef] [Green Version]
  26. Mphahlele, R.R.; Stander, M.A.; Fawole, O.A.; Opara, U.L. Effect of fruit maturity and growing location on the postharvest contents of flavonoids, phenolic acids, vitamin C and antioxidant activity of pomegranate juice (cv. Wonderful). Sci. Hortic. 2014, 179, 36–45. [Google Scholar] [CrossRef]
  27. Tolic, M.T.; Jurcevic, I.L.; Krbavcic, I.P.; Markovic, K.; Vahcic, N. Phenolic content, antioxidant capacity and quality of chokeberry (Aronia melanocarpa) products. Food Technol. Biotechnol. 2015, 53, 171–179. [Google Scholar] [CrossRef] [PubMed]
  28. Peixoto, C.M.; Dias, M.I.; Alves, M.J.; Calhelha, R.C.; Barros, L.; Pinho, S.P.; Ferreira, I.C.F.R. Grape pomace as a source of phenolic compounds and diverse bioactive properties. Food Chem. 2018, 253, 132–138. [Google Scholar] [CrossRef]
  29. Benzie, I.F.F.; Strain, J.J. The ferric reducing ability of plasma (FRAP) as a measure of “Antioxidant Power”: The FRAP assay. Anal. Biochem. 1996, 239, 70–76. [Google Scholar] [CrossRef] [PubMed]
  30. Gillespie, K.M.; Chae, J.M.; Ainsworth, E.A. Rapid measurement of total antioxidant capacity in plants. Nat. Protoc. 2007, 2, 867–870. [Google Scholar] [CrossRef]
  31. Waslidge, N.B.; Hayes, D.J. A colorimetric method for the determination of lipoxygenase activity suitable for use in a high throughput assay format. Anal. Biochem. 1995, 231, 354–358. [Google Scholar] [CrossRef]
  32. Eloff, J.N. A sensitive and quick microplate method to determine the minimal inhibitory concentration of plant extracts for bacteria. Planta Med. 1998, 64, 711–713. [Google Scholar] [CrossRef] [PubMed]
  33. Oliveira, D.A.; Salvador, A.A.; Smânia, A.; Smânia, E.F.A.; Maraschin, M.; Ferreira, S.R.S. Antimicrobial activity and composition profile of grape (Vitis vinifera) pomace extracts obtained by supercritical fluids. J. Biotechnol. 2013, 164, 423–432. [Google Scholar] [CrossRef]
  34. Wang, Y.; Qian, J.; Cao, J.; Wang, D.; Liu, C.; Yang, R.; Li, X.; Sun, C. Antioxidant capacity, anticancer ability and flavonoids composition of 35 citrus (Citrus reticulata Blanco) varieties. Molecules 2017, 22, 1114. [Google Scholar] [CrossRef] [PubMed]
  35. Veberic, R. The impact of production technology on plant phenolics. Horticulturae 2016, 2, 8. [Google Scholar] [CrossRef]
  36. Butelli, E.; Garcia-Lor, A.; Licciardello, C.; Las Casas, G.; Hill, L.; Recupero, G.R.; Keremane, M.L.; Ramadugu, C.; Krueger, R.; Xu, Q.; et al. Changes in anthocyanin production during domestication of citrus. Plant Physiol. 2017, 173, 2225–2242. [Google Scholar] [CrossRef] [PubMed]
  37. Kalt, W. Effects of production and processing factors on major fruit and vegetable antioxidants. J. Food Sci. 2005, 70, 11–19. [Google Scholar] [CrossRef]
  38. Katalinić, V.; Možina, S.S.; Skroza, D.; Generalić, I.; Abramovič, H.; Miloš, M.; Ljubenkov, I.; Piskernik, S.; Pezo, I.; Terpinc, P.; et al. Polyphenolic profile, antioxidant properties and antimicrobial activity of grape skin extracts of 14 Vitis vinifera varieties grown in Dalmatia (Croatia). Food Chem. 2010, 119, 715–723. [Google Scholar] [CrossRef]
  39. Xu, Y.; Burton, S.; Kim, C.; Sismour, E. Phenolic compounds, antioxidant, and antibacterial properties of pomace extracts from four Virginia-grown grape varieties. Food Sci. Nutr. 2016, 4, 125–133. [Google Scholar] [CrossRef] [PubMed]
  40. Rockenbach, I.I.; Gonzaga, L.V.; Rizelio, V.M.; De Souza, E.; Gonçalves, S.; Genovese, M.I.; Fett, R. Phenolic compounds and antioxidant activity of seed and skin extracts of red grape (Vitis vinifera and Vitis labrusca) pomace from Brazilian winemaking. Food Res. Int. 2011, 44, 897–901. [Google Scholar] [CrossRef]
  41. Tseng, A.; Zhao, Y. Effect of different drying methods and storage time on the retention of bioactive compounds and antibacterial activity of wine grape pomace (Pinot Noir and Merlot). J. Food Sci. 2012, 77, 192–201. [Google Scholar] [CrossRef]
  42. Ky, I.; Lorrain, B.; Kolbas, N.; Crozier, A.; Teissedre, P.L. Wine by-products: Phenolic characterization and antioxidant activity evaluation of grapes and grape pomaces from six different French grape varieties. Molecules 2014, 19, 482–506. [Google Scholar] [CrossRef] [PubMed]
  43. Hellstro, J.K.M.; Riitta, A.; Nen, O.; Mattila, P.H. Proanthocyanidins in common food products of plant origin. J. Agric. Food Chem. 2009, 57, 7899–7906. [Google Scholar] [CrossRef]
  44. Negro, C.; Tommasi, L.; Miceli, A. Phenolic compounds and antioxidant activity from red grape marc extracts. Bioresour. Technol. 2003, 87, 41–44. [Google Scholar] [CrossRef]
  45. Yu, J.; Ahmedna, M. Functional components of grape pomace: Their composition, biological properties and potential applications. Int. J. Food Sci. Technol. 2013, 48, 221–237. [Google Scholar] [CrossRef]
  46. Sousa, E.C.; Athayde Uchôa-Thomaz, A.M.; Osvaldo, J.; Carioca, B.; Maia De Morais, S.; De Lima, A.; Martins, C.G.; Alexandrino, C.D.; Augusto, P.; Ferreira, T.; et al. Chemical composition and bioactive compounds of grape pomace (Vitis vinifera L.), Benitaka variety, grown in the semiarid region of Northeast Brazil. Food Sci. Technol. 2014, 34, 135–142. [Google Scholar] [CrossRef]
  47. Papuc, C.; Goran, G.V.; Predescu, C.N.; Nicorescu, V.; Stefan, G. Plant polyphenols as antioxidant and antibacterial agents for shelf-life extension of meat and meat products: Classification, structures, sources, and action mechanisms. Compr. Rev. Food Sci. Food Saf. 2017, 16, 1243–1268. [Google Scholar] [CrossRef]
  48. Guitard, R.; Nardello-Rataj, V.; Aubry, J.-M. Theoretical and kinetic tools for selecting effective antioxidants: Application to the protection of omega-3 oils with natural and synthetic phenols. Int. J. Mol. Sci. 2016, 17, 1220. [Google Scholar] [CrossRef]
  49. Brewer, M.S. Natural antioxidants: Sources, compounds, mechanisms of action, and potential applications. Compr. Rev. Food Sci. Food Saf. 2011, 10, 221–247. [Google Scholar] [CrossRef]
  50. Hasselmann, C.; Diseases, I. Determination of minimum inhibitory concentrations (MICs) of antibacterial agents by broth dilution. Clin. Microbiol. Infect. 2003, 9, ix–xv. [Google Scholar]
  51. Wu, T.; Zang, X.; He, M.; Pan, S.; Xu, X. Structure-activity relationship of flavonoids on their anti- Escherichia coli activity and inhibition of DNA gyrase. J. Agric. Food Chem. 2013, 61, 8185–8190. [Google Scholar] [CrossRef]
  52. Jayaprakasha, G.K.; Selvi, T.; Sakariah, K.K. Antibacterial and antioxidant activities of grape (Vitis vinifera) seed extracts. Food Res. Int. 2003, 36, 117–122. [Google Scholar] [CrossRef]
  53. García-Lomillo, J.; González-Sanjosé, M.L. Applications of wine pomace in the food industry: Approaches and functions. Compr. Rev. Food Sci. Food Saf. 2017, 16, 3–22. [Google Scholar] [CrossRef]
  54. Ignat, I.; Volf, I.; Popa, V.I. A critical review of methods for characterisation of polyphenolic compounds in fruits and vegetables. Food Chem. 2011, 126, 1821–1835. [Google Scholar] [CrossRef]
Figure 1. Biplot obtained from PCA illustrating the relationship between phenolic profile, antimicrobial activity, and antioxidant activity of grape pomace extract (GPE), grape seed extract (GSE), and clementine mandarin peel and pulp extract (MPE). DPPH—2,2-diphenyl-1-picrylhydrazyl; FRAP—ferric reducing antioxidant power; ORAC—oxygen radical absorbance capacity; LOX—15-lipoxygenase. TPC—Total phenolic content.
Sustainability 11 01746 g001
Table 1. Phenolic composition, pH, and titratable acidity (means ± standard deviation) of grape pomace extract (GPE), grape seed extract (GSE), and clementine mandarin peel and pulp extract (MPE).
AssayTreatment
GPEGSEMPE
Total phenols 1 (g GAE/100 g)17.30 ± 0.250 a9.97 ± 0.340 b6.49 ± 0.620 c
Total tannins 1 (g GAE/100 g) 11.5 ± 0.26 a3.5 ± 0.33 b4.7 ± 0.61 b
Flavonoids 2 (g CE/100 g)7.76 ± 0.036 a7.61 ± 0.610 a1.00 ± 0.017 b
Proanthocyanidins 3 (g CyE/100 g)1.04 ± 0.240 b3.54 ± 0.130 a0.13 ± 0.012 c
Anthocyanins 4 (g Cyd3E/100 g)0.173 ± 0.0200 a0.214 ± 0.0110 a0.007 ± 0.0001 b
Total carotenoids 5 (g β-CE/100 g)0.026 ± 0.0003 a0.021 ± 0.0007 b0.005 ± 0.0001 c
Ascorbic acid 6 (g AA/100 g)ND *ND *2.69 ± 0.37
pH3.82 ± 0.044 b4.26 ± 0.089 a3.41 ± 0.073 c
Titratable acidity (%)6.15 ± 0.056 b4.51 ± 0.030 c8.11 ± 0.064 a
Means followed by a different letter within a row indicate significant (p ≤ 0.05) difference among samples. Units: 1 value expressed as g Gallic Acid Equivalents/100 g extract DM; 2 value expressed as g Catechin Equivalents/100 g extract DM; 3 value expressed as g Cyanidin Equivalents/100 g extract DM; 4 value expressed as g Cyanidin-3-glycoside Equivalents/100 g extract DM; 5 value expressed as g β-carotene Equivalents/100 g extract DM; 6 value expressed as g Ascorbic acid/100 g of extract DM; * Not Detected.
Table 2. In vitro antioxidant activity (means ± standard deviation) of grape pomace (GPE), grape seed (GSE), and clementine mandarin peel and pulp (MPE) extracts.
AssaySample
GPEGSEMPEAscorbic AcidNDGA
DPPH 1EC50 (mg/mL)0.11 ± 0.020 b0.02 ± 0.005 c0.81 ± 0.330 a1.07 ± 0.046 a-
T Eq. (mM TEq/g)179.5 ± 2.70 b86.0 ± 0.72 c292.3 ± 24.01 a--
FRAP 2T Eq. (M TEq/g)4.57 ± 0.230 b4.93 ± 0.005 a3.39 ± 0.011 c--
ORAC 3EC50 (µg/mL)7.10 ± 0.560 b1.30 ± 0.140 d2.10 ± 0.210 c14.0 ± 3.40 a-
T Eq. (mM TEq/g)9.84 ± 0.079 a7.73 ± 0.018 c8.27 ± 0.100 b--
Lipoxygenase 4IC50 (µg/mL)96.87 ± 13.900 a39.20 ± 3.820 c52.06 ± 0.200 b-0.32 ± 0.065 d
APC Index 5-286.99100748.64--
Rank 6-213--
Means followed by a different letter within a row indicate significant (p ≤ 0.05) difference among treatments. 1 2,2-diphenyl-1-picrylhydrazyl (DPPH) expressed as EC50 values mg extract/mL solvent and mM Trolox Equivalents/g extract. 2 FRAP expressed as Molar Trolox Equivalents/g extract. 3 Oxygen radical scavenging capacity (ORAC) expressed as EC50 values µg extract/mL solvent and mM Trolox Equivalents/g extract. 4 Lipoxygenase expressed as IC50 values µg extract/mL solvent. 5 Antioxidant index score = [(sample score/best score) × 100], averaged for all four tests for each extract for the antioxidant potency composite (APC) index. 6 Ranked according to the APC index; the lower the index score the higher the antioxidant activity.
Table 3. Pearson correlation coefficients (r) between variables investigated in grape pomace extract (GPE), grape seed extract (GSE), and clementine mandarin peel and pulp extract (MPE).
Total Phenolic CompoundsTanninsFlavonoidsAnthocyaninsProanthocyanidinsCarotenoidsAscorbic AcidpHAcidity
DPPH 1−0.460−0.142−0.728−0.729−0.586−0.7010.803−0.7100.684
FRAP 20.5660.1480.9430.9380.8380.891−0.9530.924−0.957
ORAC 30.8920.9840.3970.190−0.3760.568−0.382−0.1470.073
LOX 40.8370.9670.3210.097−0.4490.489−0.296−0.2240.158
Staphylococcus aureus0.6450.3480.8470.7780.5780.815−0.8090.743−0.721
Listeria monocytogenes0.7640.8040.4310.198−0.2000.534−0.366−0.016−0.034
Enterococcus faecalis0.9020.8860.5510.350−0.1280.689−0.5460.081−0.150
Pseudomonas aeruginosa0.7420.3650.9880.9620.7070.977−0.9910.847−0.890
Escherichia coli0.4720.0660.8650.8760.8380.802−0.8770.903−0.919
Candida albicans0.9770.9180.6950.505−0.0460.805−0.6520.210−0.255
Values in bold statistically significant (p ≤ 0.05) 1 DPPH-2,2-diphenyl-1-picrylhydrazyl radical scavenging activity. 2 FRAP—ferric reducing antioxidant power. 3 ORAC—oxygen radical absorbance capacity. 4 LOX—lipoxygenase inhibition.
Table 4. In vitro antimicrobial activity (means ± standard deviation) of grape pomace extract (GPE), grape seed extract (GSE), and clementine mandarin peel and pulp extract (MPE) against reference microorganisms.
MicroorganismMIC (mg/mL)
GPEGSEMPESodium MetabisulphiteTetracycline
Staphylococcus aureus9.38 ± 3.608 a9.38 ± 3.608 a3.13 ± 0.001 b0.39 ± 0.001 c0.003 ± 0.0010 d
Listeria monocytogenes4.69 ± 1.804 a2.34 ± 0.902 a2.34 ± 0.902 a0.29 ± 0.113 b0.02 ± 0.030 c
Enterococcus faecalis9.38 ± 3.608 a2.34 ± 0.902 b1.56 ± 0.001 b0.39 ± 0.001 c0.02 ± 0.001 d
Pseudomonas aeruginosa12.50 ± 0.001 a12.50 ± 0.001 a6.25 ± 0.001 b1.17 ± 0.451 c0.008 ± 0.0001 d
Escherichia coli9.38 ± 3.608 a12.50 ± 0.001 a3.13 ± 0.001 b1.56 ± 0.001 c0.003 ± 0.0010 d
Candida albicans6.25 ± 0.001 a2.34 ± 0.902 b1.56 ± 0.001 b0.04 ± 0.014 c0.003 ± 0.0011 d
Means followed by a different letter within a row indicate significant (p ≤ 0.05) difference among treatments.

