Effects of Human Factors and Lean Techniques on Just in Time Benefits

 ,
,  , and
, and
Abstract
:1. Introduction
2. Literature Review and Research Hypotheses
2.1. Managerial Commitment (MAC) in JIT Implementation
- MAC1. Communication and coordination between departments and suppliers.
- MAC2. Supervisors promote teamwork by encouraging operators to cooperate and express their opinions.
- MAC3. Managers, engineers, and operators frequently interact among them.
- MAC4. Senior management culture promotes timely compliance of projects.
2.2. Suppliers (SUP)
- SUP1. SUP are integrated in the company using a pull strategy.
- SUP2. SUP deliver raw materials on time.
- SUP3. The manufacturing company holds long-term contracts with its SUP.
- SUP4. SUP are certified.
- SUP5. The company relies on a reduced number of SUP.
2.3. Human Resources Integration (HRI)
- HRI1. Human resources are trained in multifunctional tasks.
- HRI2. The company has a job rotation program.
- HRI3. Employees are hired because of their problem solving and teamwork skills.
- HRI4. The company has specific work teams to solve production-related problems.
- HRI5. Employees are rewarded when they learn new skills.
- HRI6. Employees suggest solutions to machine and equipment problems.
2.4. Production Tools and Techniques (TTP)
- TTP1. The plant is organized in manufacturing cells or technology groups.
- TTP2. Machines are small, flexible, and can be moved.
- TTP3. The company has a Kanban system for control production.
- TTP4. The company implements a Poka-Yoke system for error prevention.
- TTP5. Both JIT and MRP are used for production planning and control.
- TTP6. The production program is leveled.
- TTP7. The product manufacturing flow is continuous within the value chain.
- TTP8. Processes are standardized.
2.5. Operational Benefits of JIT (OBE)
- OBE1. Raw material inventory levels decrease.
- OBE2. Work in process (WIP) inventory levels decrease.
- OBE3. Finish product inventory levels decrease.
- OBE4. Inventory turnover increases.
- OBE5. Lead times are shorter.
- OBE6. Production flexibility increases.
- OBE7. Waste levels decrease.
3. Materials and Methods
3.1. Questionnaire Design and Administration
3.2. Data Capture, Screening, and Descriptive Analysis
- Identify missing values: the identified missing values are replaced by the median value. However, questionnaires with more than 10% missing values are removed from the analysis.
- Identify outliers: the identified outliers are replaced by the median value, since they directly affect the parameter estimation process.
3.3. Data Validation
- R-Squared (R2) and adjusted R-Squared (Adj. R2) as indicators of parametric predictive validity. Values higher than 0.2 are necessary [59].
- Q-Squared (Q2) as an indicator of non-parametric predictive validity. Values greater than 0 and similar to their corresponding R2 values are necessary [60].
- Composite reliability index and Cronbach’s alpha index as indicators of internal validity. Values higher than 0.7 are sought [61].
- Average Variance Extracted (AVE) as a measure of discriminant validity. Values higher than 0.5 are sought [62].
- Variance Inflation Factors (VIFs) as a measure of collinearity. Values lower than 3.3 are sought. However, the squared correlations between the latent variables is used for detecting multicollinearity and test discriminant validity, showing on diagonal the squared root of AVE [63].
- Also, factor cross loadings are analyzed to determine convergent validity of items into latent variables. Values higher than 0.5 are sought [64].
3.4. Model Evaluation
- Average Path Coefficient (APC) and a p value lower than 0.05 is required.
- Average R-Squared (ARS) and Average Adjusted R-Squared (AARS) as indicators of predictive validity, and p values lower than 0.05 are required.
- Average block VIF (AVIF) and Average Full collinearity VIF (AFVIF) as a measure of multicollinearity. A value lower than 3.3 is required.
- Tenenhaus Goodness of Fit (GoF) Index to measure model fit. A value higher than 0.36 is necessary.
3.4.1. Direct Effects and Effect Sizes
3.4.2. Sum of Indirect Effects and Total Effects
3.4.3. Sensitivity Analysis
- The probability of a variable occurring on a lower or higher level independently; that is, P(Z < −1) and P(Z > 1), respectively.
- The probability of each variable occurring simultaneously in its multiple possible combinations. This probability is represented by &, and the combinations are: P(Zi > 1) and P(Zd > 1), P(Zi > 1) and P(Z d < −1), P(Zi < −1) and P(Zd > 1), P(Zi < −1) and P(Zd < −1).
- The probability of the occurrence of a dependent latent variable on a certain level with respect to the variability of an independent latent variable. This is a conditional probability expressed using the word If. For each research hypothesis, four possible combinations were found: P(Zi > 1/Zd > 1), P(Zi > 1/Zd < −1), P(Zi < −1/Zd > 1) and P(Zi < −1/Zd < −1).
4. Results
4.1. Sample Characterization
4.2. Descriptive Analysis and Validation of Items
4.3. Model Testing
5. Discussion: Industrial and Managerial Implications
- MAC is the key to JIT implementation in production systems [48], since it has the highest positive direct effects on the remaining variables. Because managers make the final decisions, they have to be the most involved in the JIT implementation process, especially in aspects that involve HRI and a company’s relationship with its SUP.
- MAC has a positive direct impact on TTP. Considering that managers ultimately decide what TTP are implemented in a production system, the value of the direct effect is relatively low (β = 0.161). However, after analyzing the indirect effects (β = 0.401) that occur thanks to mediating variables SUP and HRI, we found that the relationship between MAC and TTP is much more important, since the total effects are β = 0.562. Such results imply that managers need support from both operators and SUP to implement TTP, who can train operators in the use of specific production techniques. This claim is consistent with that of Shnaiderman and Ben-Baruch [35].
- The direct effect of MAC on OBE is only β = 0.135; however, after analyzing the indirect effects that occur thanks to SUP, HRI, and TTP (β = 0.386), we found that the total effects in this relationship are β = 0.521. These results imply once more that JIT benefits can be obtained only if managers plan the JIT implementation process carefully, by properly integrating human resources (including SUP) and production machinery, techniques, and methodologies [9].
- Human Resources that are well integrated in production tools, namely lean manufacturing tools, are a key element in obtaining the desired OBE [68]. In this research, we found a relatively low positive direct effect from HRI on OBE (i.e., β = 0.097). However, the relationship is much more important when taking into account the indirect effects that occur through TTP (β = 0.144); that is, the total effects in the relationship between HRI and OBE report β = 0.242. These results demonstrate that operator knowledge, experience, and skills must be applied in TTP. Consequently, managers must promote collaborative work environments and the development of multifunctional skills, which would contribute to a correct material flow.
- SUP may be external entities, yet they do have an impact on the OBE that companies gain by implementing a JIT system. SUP are important since they supply manufacturers with raw materials, machinery, and equipment. The direct relationship between SUP and OBE has a low but still significant value of β = 0.099; however, the indirect effects caused by Production Tools and Technologies have a value of β = 0.256. In total, the relationship has a value of β = 0.355, which reveals that managers must be attentive to the technological innovations that SUP can offer them to improve the production flow along the system. This is where improvements can be made by proposing new production techniques.
- Direct and indirect effects are interesting, yet it is also important to analyze the performance of the latent variables under certain conditions. In this sense, the implications of the sensitivity analysis performed on the latent variables (see Table 8) can be discussed as follows:
- High levels of MAC are essential for the performance of all the other variables. MAC+ increases the likelihood of SUP+ by 0.350, that of HRI+ by 0.400, the likelihood of TTP+ by 0.470, and that of OBE+ by 0.283. Conversely, low MAC levels (MAC−) increase the risks of both SUP− and HRI− by 0.397, those of TTP− by 0.429, and the risks of OBE− by 0.333.
- SUP are external entities; however, as the first supply chain system component, they can facilitate the JIT implementation process. High levels in SUP (i.e., SUP+) increase the likelihood of HRI+ by 0.390 and that of TTP+ by 0.508, which is a value much higher than that of MAC+. Similarly, SUP+ increases the likelihood of OBE+ by 0.390. On the other hand, low Supplier levels (i.e., SUP−) imply risks in the other variables. Namely, it is impossible for production systems to rely on well-implemented TTP, since the value of TTP+ is 0, whereas the value of TTP− is 0.630. Likewise, SUP− does not guarantee OBE+, as the likelihood value is only 0.003, while the risks of OBE− increase by 0.439. Such results imply that SUP are the supporting base of the JIT implementation process in production systems, which is consistent with what authors Shnaiderman and Ben-Baruch [35] claim.
- Appropriate MAC and good relationships with SUP do not guarantee the success of JIT on their own. HRI is equally important. According to our analysis, HRI+ increases the likelihood of TTP+ by 0.492 and that of OBE+ by 0.338. However, HRI- guarantees neither TTP+ nor OBE+, since the likelihood values are 0.005 and 0.008, respectively. Finally, HRI− increases the risks of TTP− by 0.508 and those of OBE− by 0.424. These results demonstrate that human experience and skills are necessary to successfully implement Production Tools and Technologies in production systems, which is consistent with what authors García-Alcaraz, et al. [10] argue.
- Finally, we found that TTP+ guarantees OBE+ (0.508) and is never associated with OBE− (0.000). Nevertheless, TTP− cannot guarantee OBE+ and increases the risks of OBE− by 0.659. In conclusion, JIT must not be isolated from the Production Tools and Technologies already implemented in a production system, such as MRP [45,48], TQM y TPM [14,21], and SMED [69], to name but a few.
6. Conclusions, Limitations and Future Research
- High levels on MAC provide high levels on SUP, HRI, TTP, and guarantee OBE; however, low levels on MAC propitiate risks of obtaining low levels for these variables.
- High SUP levels promote high levels of HRI, TTP and OBE. In contrast, low SUP levels represent a risk for these variables and the entire JIT implementation process.
- High levels on HRI facilitate the attainment of high levels of TTP and OBE, and conversely, low levels of HRI pose a risk, as human resources are responsible for implementing JIT.
- Finally, high levels on TTP guarantee high levels on OBE since they support the JIT philosophy. In the same way, low TTP levels are a risk to the JIT implementation process.
- Apply the survey used in other sectors in order to find differences and effectiveness of the model, since JIT is a tool that can easily be applied in different types of industries, such as hospitality and food services, where customer satisfaction is strongly related to timely delivery.
- Generate an integral and holistic model that makes it possible to incorporate more latent variables and, in this way, increase its explanatory power and the R2 values for the dependent variables.
Supplementary Materials
Author Contributions
Funding
Acknowledgments
Conflicts of Interest
References
- Koberg, E.; Longoni, A. A systematic review of sustainable supply chain management in global supply chains. J. Clean. Prod. 2019, 207, 1084–1098. [Google Scholar] [CrossRef]
- Jean, R.J.B.; Kim, D.; Bello, D.C. Relationship-based product innovations: Evidence from the global supply chain. J. Bus. Res. 2017, 80, 127–140. [Google Scholar] [CrossRef]
- Zhou, Y.-W.; Guo, J.; Zhou, W. Pricing/service strategies for a dual-channel supply chain with free riding and service-cost sharing. Int. J. Prod. Econ. 2018, 196, 198–210. [Google Scholar] [CrossRef]
- Jadhava, A.; Orrb, S.; Malik, M. The role of supply chain orientation in achieving supply chain sustainability. Int. J. Prod. Econ. 2018, in press. [Google Scholar] [CrossRef]
- Shaaban, S.; Darwish, A.S. Production systems: Successful applications and new challenges part one—Lean, six sigma, inventory, JIT and TOC. Prod. Plan. Control 2016, 27, 539–540. [Google Scholar] [CrossRef]
- Hou, T.-H.; Hu, W.-C. An integrated MOGA approach to determine the Pareto-optimal kanban number and size for a JIT system. Expert Syst. Appl. 2011, 38, 5912–5918. [Google Scholar] [CrossRef]
- Wagner, S.; Silveira-Camargos, V. Decision model for the application of just-in-sequence. Int. J. Prod. Res. 2011, 49, 5713–5736. [Google Scholar] [CrossRef]
- Yu, Y.; Wang, J.; Ma, K.; Sun, W. Seru system balancing: Definition, formulation, and exact solution. Comput. Ind. Eng. 2018, 122, 318–325. [Google Scholar] [CrossRef]
- García-Alcaraz, J.L.; Macías, A.A.M.; Luevano, D.J.P.; Fernández, J.B.; López, A.d.J.G.; Macías, E.J. Main benefits obtained from a successful JIT implementation. Int. J. Adv. Manuf. Technol. 2016, 86, 2711–2722. [Google Scholar] [CrossRef]
- Garcia-Alcaraz, J.L.; Maldonado-Macias, A.A.; Alvarado-Iniesta, A.; Robles, G.C.; Hernández, G.A. A systematic review/survey for JIT implementation: Mexican maquiladoras as case study. Comput. Ind. 2014, 65, 761–773. [Google Scholar] [CrossRef]
- Amasaka, K. New JIT, New Management Technology Principle: Surpassing JIT. Procedia Technol. 2014, 16, 1135–1145. [Google Scholar] [CrossRef] [Green Version]
- Priestman, S. SQC and JIT: Partnership in Quality, Does Culture Make a Difference? Qual. Prog. 1985, 18, 31–35. [Google Scholar]
- Balakrishnan, R.; Linsmeier, T.J.; Venkatachalam, M. Financial Benefits from JIT Adoption: Effects of Customer Concentration and Cost Structure. Account. Rev. 1996, 71, 183–205. [Google Scholar]
- Cua, K.O.; McKone, K.E.; Schroeder, R.G. Relationships between implementation of TQM, JIT, and TPM and manufacturing performance. J. Oper. Manag. 2001, 19, 675–694. [Google Scholar] [CrossRef]
- Fullerton, R.R.; McWatters, C.S.; Fawson, C. An examination of the relationships between JIT and financial performance. J. Oper. Manag. 2003, 21, 383–404. [Google Scholar] [CrossRef]
- Maiga, A.S.; Jacobs, F.A. JIT performance effects: A research note. Adv. Account. 2009, 25, 183–189. [Google Scholar] [CrossRef]
- Inman, R.A.; Sale, R.S.; Green, K.W., Jr.; Whitten, D. Agile manufacturing: Relation to JIT, operational performance and firm performance. J. Oper. Manag. 2011, 29, 343–355. [Google Scholar] [CrossRef]
- García, J.L.; Rivera, L.; Blanco, J.; Jiménez, E.; Martínez, E. Structural equations modelling for relational analysis of JIT performance in maquiladora sector. Int. J. Prod. Res. 2014, 52, 4931–4949. [Google Scholar] [CrossRef]
- Green, K.W., Jr.; Inman, R.A.; Birou, L.M.; Whitten, D. Total JIT (T-JIT) and its impact on supply chain competency and organizational performance. Int. J. Prod. Econ. 2014, 147 Pt A, 125–135. [Google Scholar] [CrossRef]
- Singh, S.; Garg, D. JIT System: Concepts, Benefits and Motivation in Indian Industries. Int. J. Manag. Bus. Stud. 2011, 1, 26–30. [Google Scholar]
- Iqbal, T.; Huq, F.; Bhutta, M.K.S. Agile manufacturing relationship building with TQM, JIT, and firm performance: An exploratory study in apparel export industry of Pakistan. Int. J. Prod. Econ. 2018, 203, 24–37. [Google Scholar] [CrossRef]
- García-Alcaraz, J.L.; Prieto-Luevano, D.J.; Maldonado-Macías, A.A.; Blanco-Fernández, J.; Jiménez-Macías, E.; Moreno-Jiménez, J.M. Structural equation modeling to identify the human resource value in the JIT implementation: Case maquiladora sector. Int. J. Adv. Manuf. Technol. 2015, 77, 1483–1497. [Google Scholar] [CrossRef]
- Monden, Y. The relationship between mini profit-center and JIT system. Int. J. Prod. Econ. 2002, 80, 145–154. [Google Scholar] [CrossRef]
- Bányai, T.; Bányai, Á. Modelling of just-in-sequence supply of manufacturing processes. MATEC Web Conf. 2017, 112, 06025. [Google Scholar] [CrossRef]
- Helms, M.M.; Thibadoux, G.M.; Haynes, P.J.; Pauley, P. Meeting the human resource challenges of JIT through management development. J. Manag. Dev. 1990, 9, 28. [Google Scholar] [CrossRef]
- Oliver, N. Human Factors in the Implementation of Just-In-Time Production. Int. J. Oper. Prod. Manag. 1990, 10, 32–40. [Google Scholar] [CrossRef]
- Power, D.J.; Sohal, A.S. An examination of the literature relating to issues affecting the human variable in just-in-time environments. Technovation 1997, 17, 649–666. [Google Scholar] [CrossRef]
- Power, D.; Sohal, A.S. An empirical study of human resource management strategies and practices in Australian just-in-time environments. Int. J. Oper. Prod. Manag. 2000, 20, 932–958. [Google Scholar] [CrossRef]
- Yang, C.C.; Yang, K.J. An Integrated Model of the Toyota Production System with Total Quality Management and People Factors. Hum. Factors Ergon. Manuf. Serv. Ind. 2013, 23, 450. [Google Scholar] [CrossRef]
- Lytton, W.W.; Omurtag, A.; Neymotin, S.A.; Hines, M.L. Just-in-time connectivity for large spiking networks. Neural Comput. 2008, 20, 2745–2756. [Google Scholar] [CrossRef]
- Kumar, V.; Garg, D. JIT elements in Indian context: An analysis. Product. J. 2000, 41, 217–222. [Google Scholar]
- Montes, D. Elements and Benefits from JIT: A Factor Analysis. Master’s Thesis, Universiddad Autónoma de Ciudad Juárez, Ciudad Juárez, Mexico, 2014. [Google Scholar]
- Kumar, V. JIT Based Quality Management: Concepts and Implications in Indian Context. Int. J. Eng. Sci. Technol. 2010, 2, 40–50. [Google Scholar]
- Yasin, M.M.; Small, M.H.; Wafa, M.A. Organizational modifications to support JIT implementation in manufacturing and service operations. Omega 2003, 31, 213–226. [Google Scholar] [CrossRef]
- Shnaiderman, M.; Ben-Baruch, L. Control and enforcement in order to increase supplier inventory in a JIT contract. Eur. J. Oper. Res. 2016, 250, 143–154. [Google Scholar] [CrossRef]
- Chung, W.; Talluri, S.; Kovács, G. Investigating the effects of lead-time uncertainties and safety stocks on logistical performance in a border-crossing JIT supply chain. Comput. Ind. Eng. 2018, 118, 440–450. [Google Scholar] [CrossRef]
- Aksoy, A.; Öztürk, N. Supplier selection and performance evaluation in just-in-time production environments. Expert Syst. Appl. 2011, 38, 6351–6359. [Google Scholar] [CrossRef]
- Luthra, S.; Govindan, K.; Kannan, D.; Mangla, S.K.; Garg, C.P. An integrated framework for sustainable supplier selection and evaluation in supply chains. J. Clean. Prod. 2017, 140 Pt 3, 1686–1698. [Google Scholar] [CrossRef]
- Bányai, T.; Landschützer, C.; Bányai, Á. Markov-Chain Simulation-Based Analysis of Human Resource Structure: How Staff Deployment and Staffing Affect Sustainable Human Resource Strategy. Sustainability 2018, 10, 3692. [Google Scholar] [CrossRef]
- Azaranga, M.R.; Gonzalez, G.; Reavill, L. An empirical investigation of the relationship between quality improvement techniques and performance—A Mexican case. J. Qual. Manag. 1998, 3, 265–292. [Google Scholar] [CrossRef]
- Teresita, M.; Jorge Luis, G.-A.; Valeria Martínez, L.; Nadia Sofia, T.; Diego, T. Impact of Human Resources on Quality After Just-in-Time Implementation. In Handbook of Research on Manufacturing Process Modeling and Optimization Strategies; Raja, D., Mohan, P., Eds.; IGI Global: Hershey, PA, USA, 2017; pp. 235–255. [Google Scholar] [CrossRef]
- Jajja, M.S.S.; Chatha, K.A.; Farooq, S. Impact of supply chain risk on agility performance: Mediating role of supply chain integration. Int. J. Prod. Econ. 2018, 205, 118–138. [Google Scholar] [CrossRef]
- Esmaeilian, B.; Behdad, S.; Wang, B. The evolution and future of manufacturing: A review. J. Manuf. Syst. 2016, 39, 79–100. [Google Scholar] [CrossRef]
- Vitayasak, S.; Pongcharoen, P. Performance improvement of Teaching-Learning-Based Optimisation for robust machine layout design. Expert Syst. Appl. 2018, 98, 129–152. [Google Scholar] [CrossRef]
- Ho, J.C.; Chang, Y.-L. An integrated MRP and JIT framework. Comput. Ind. Eng. 2001, 41, 173–185. [Google Scholar] [CrossRef]
- Al-Tahat, M.D.; Mukattash, A.M. Design and analysis of production control scheme for Kanban-based JIT environment. J. Frankl. Inst. 2006, 343, 521–531. [Google Scholar] [CrossRef]
- David, I.; Eben-Chaime, M. How far should JIT vendor–buyer relationships go? Int. J. Prod. Econ. 2003, 81–82, 361–368. [Google Scholar] [CrossRef]
- Wang, H.; Gong, Q.; Wang, S. Information processing structures and decision making delays in MRP and JIT. Int. J. Prod. Econ. 2017, 188, 41–49. [Google Scholar] [CrossRef]
- Martínez-Jurado, P.J.; Moyano-Fuentes, J.; Jerez-Gómez, P. Human resource management in Lean Production adoption and implementation processes: Success factors in the aeronautics industry. BRQ Bus. Res. Q. 2014, 17, 47–68. [Google Scholar] [CrossRef] [Green Version]
- Jabbour, C.J.C.; Jabbour, A.B.L.d.S.; Govindan, K.; Teixeira, A.A.; Freitas, W.R.d.S. Environmental management and operational performance in automotive companies in Brazil: The role of human resource management and lean manufacturing. J. Clean. Prod. 2013, 47, 129–140. [Google Scholar] [CrossRef]
- Villa, A.; Taurino, T. From JIT to Seru, for a Production as Lean as Possible. Procedia Eng. 2013, 63, 956–965. [Google Scholar] [CrossRef]
- Chen, W.; Zou, Y. An integrated method for supplier selection from the perspective of risk aversion. Appl. Soft Comput. 2017, 54, 449–455. [Google Scholar] [CrossRef]
- Mendoza-Fong, J.; García-Alcaraz, J.; Díaz-Reza, J.; Sáenz Diez Muro, J.; Blanco Fernández, J. The Role of Green and Traditional Supplier Attributes on Business Performance. Sustainability 2017, 9, 1520. [Google Scholar] [CrossRef]
- Avelar-Sosa, L.; García-Alcaraz, J.L.; Castrellón-Torres, J.P. The Effects of Some Risk Factors in the Supply Chains Performance: A Case of Study. J. Appl. Res. Technol. 2014, 12, 958–968. [Google Scholar] [CrossRef] [Green Version]
- García, J.L.; Maldonado, A.A.; Alvarado, A.; Rivera, D.G. Human critical success factors for kaizen and its impacts in industrial performance. Int. J. Adv. Manuf. Technol. 2014, 70, 2187–2198. [Google Scholar] [CrossRef]
- Rodríguez-Méndez, R.; Sánchez-Partida, D.; Martínez-Flores, J.L.; Arvizu-BarrÓn, E. A case study: SMED & JIT methodologies to develop continuous flow of stamped parts into AC disconnect assembly line in Schneider Electric Tlaxcala Plant. IFAC Pap. 2015, 48, 1399–1404. [Google Scholar] [CrossRef]
- Abdul-Nour, G.; Lambert, S.; Drolet, J. Adaptation of jit phylosophy and kanban technique to a small-sized manufacturing firm; a project management approach. Comput. Ind. Eng. 1998, 35, 419–422. [Google Scholar] [CrossRef]
- IBM Corporation. IBM SPSS Statistics for Windows; Version 24.0; IBM Corporation: Armonk, NY, USA, 2016. [Google Scholar]
- Sartal, A.; Llach, J.; Vázquez, X.H.; de Castro, R. How much does Lean Manufacturing need environmental and information technologies? J. Manuf. Syst. 2017, 45, 260–272. [Google Scholar] [CrossRef]
- Moqbel, M.; Kock, N. Unveiling the dark side of social networking sites: Personal and work-related consequences of social networking site addiction. Inf. Manag. 2018, 55, 109–119. [Google Scholar] [CrossRef]
- Farooq, M.S.; Salam, M.; Fayolle, A.; Jaafar, N.; Ayupp, K. Impact of service quality on customer satisfaction in Malaysia airlines: A PLS-SEM approach. J. Air Transp. Manag. 2018, 67, 169–180. [Google Scholar] [CrossRef]
- Lee, C.; Hallak, R. Investigating the moderating role of education on a structural model of restaurant performance using multi-group PLS-SEM analysis. J. Bus. Res. 2017. [Google Scholar] [CrossRef]
- Aboelmaged, M. The drivers of sustainable manufacturing practices in Egyptian SMEs and their impact on competitive capabilities: A PLS-SEM model. J. Clean. Prod. 2018, 175, 207–221. [Google Scholar] [CrossRef]
- Johansson, T. Testing for control system interdependence with structural equation modeling: Conceptual developments and evidence on the levers of control framework. J. Account. Lit. 2018, 41, 47–62. [Google Scholar] [CrossRef]
- Kock, N. WarpPLS 6.0 User Manual; ScriptWarp Systems: Laredo, TX, USA, 2018. [Google Scholar]
- Díaz-Reza, J.; García Alcaraz, J.; Mendoza-Fong, J.; Martínez-Loya, V.; Jiménez-Macias, E.; Blanco-Fernández, J. Interrelations among SMED Stages: A Causal Model. Complexity 2017, 2017, 5912940. [Google Scholar] [CrossRef]
- Boon Sin, A.; Zailani, S.; Iranmanesh, M.; Ramayah, T. Structural equation modelling on knowledge creation in Six Sigma DMAIC project and its impact on organizational performance. Int. J. Prod. Econ. 2015, 168, 105–117. [Google Scholar] [CrossRef]
- Valeria Martínez, L.; Jorge Luis García, A.; José Roberto Díaz, R.; Deysi Guadalupe Marquez, G. The Impact of ICT on Supply Chain Agility and Human Performance. In Handbook of Research on Information Management for Effective Logistics and Supply Chains; George Leal, J., António Lucas, S., Cláudio Roberto Magalhães, P., Eds.; IGI Global: Hershey, PA, USA, 2017; pp. 180–198. [Google Scholar] [CrossRef]
- Chen, S.; Fan, S.; Xiong, J.; Zhang, W. The Design of JMP/SAP Based Six Sigma Management System and its Application in SMED. Procedia Eng. 2017, 174, 416–424. [Google Scholar] [CrossRef]


| Author | Findings |
|---|---|
| García-Alcaraz, et al. [22] |
|
| Monden [23] |
|
| Bányai and Bányai [24] |
|
| Helms, et al. [25] and Oliver [26] |
|
| Power and Sohal [27] |
|
| Power and Sohal [28] |
|
| Yang and Yang [29] |
|
| Lytton, et al. [30] |
|
| Industry | Years of Experience | Total | |||
|---|---|---|---|---|---|
| 1–2 | 2–5 | 5–10 | >10 | ||
| Automotive | 41 | 72 | 24 | 21 | 158 |
| Medical | 17 | 42 | 19 | 8 | 86 |
| Electrical | 7 | 25 | 12 | 11 | 55 |
| Electronics | 5 | 19 | 9 | 18 | 51 |
| Aerospace | 1 | 1 | 0 | 0 | 2 |
| Total | 71 | 159 | 64 | 45 | 352 |
| Latent Variable/Item | Median | IQR |
|---|---|---|
| MAC1 | 4.20 | 1.584 |
| MAC2 | 4.11 | 1.58 |
| MAC3 | 3.94 | 1.587 |
| MAC4 | 3.71 | 1.608 |
| HRI1 | 3.85 | 1.647 |
| HRI2 | 3.73 | 1.754 |
| HRI4 | 3.67 | 1.71 |
| HRI6 | 3.43 | 1.837 |
| HRI3 | 3.39 | 1.9 |
| HRI5 | 3.18 | 1.917 |
| TTP4 | 4.09 | 1.578 |
| TTP8 | 4.08 | 1.563 |
| TTP3 | 4.05 | 1.775 |
| TTP5 | 3.89 | 1.651 |
| TTP7 | 3.88 | 1.476 |
| TTP1 | 3.85 | 1.619 |
| TTP6 | 3.62 | 1.626 |
| TTP2 | 3.4 | 1.928 |
| SUP4 | 4.12 | 1.59 |
| SUP3 | 3.93 | 1.569 |
| SUP2 | 3.84 | 1.587 |
| SUP1 | 3.66 | 1.832 |
| SUP5 | 3.55 | 1.741 |
| OBE5 | 3.91 | 1.513 |
| OBE7 | 3.86 | 1.675 |
| OBE1 | 3.77 | 1.537 |
| OBE2 | 3.75 | 1.516 |
| OBE6 | 3.73 | 1.67 |
| OBE3 | 3.71 | 1.648 |
| OBE4 | 3.68 | 1.581 |
| Index | Latent Variable | ||||
|---|---|---|---|---|---|
| HRI | MAC | SUP | TTP | OBE | |
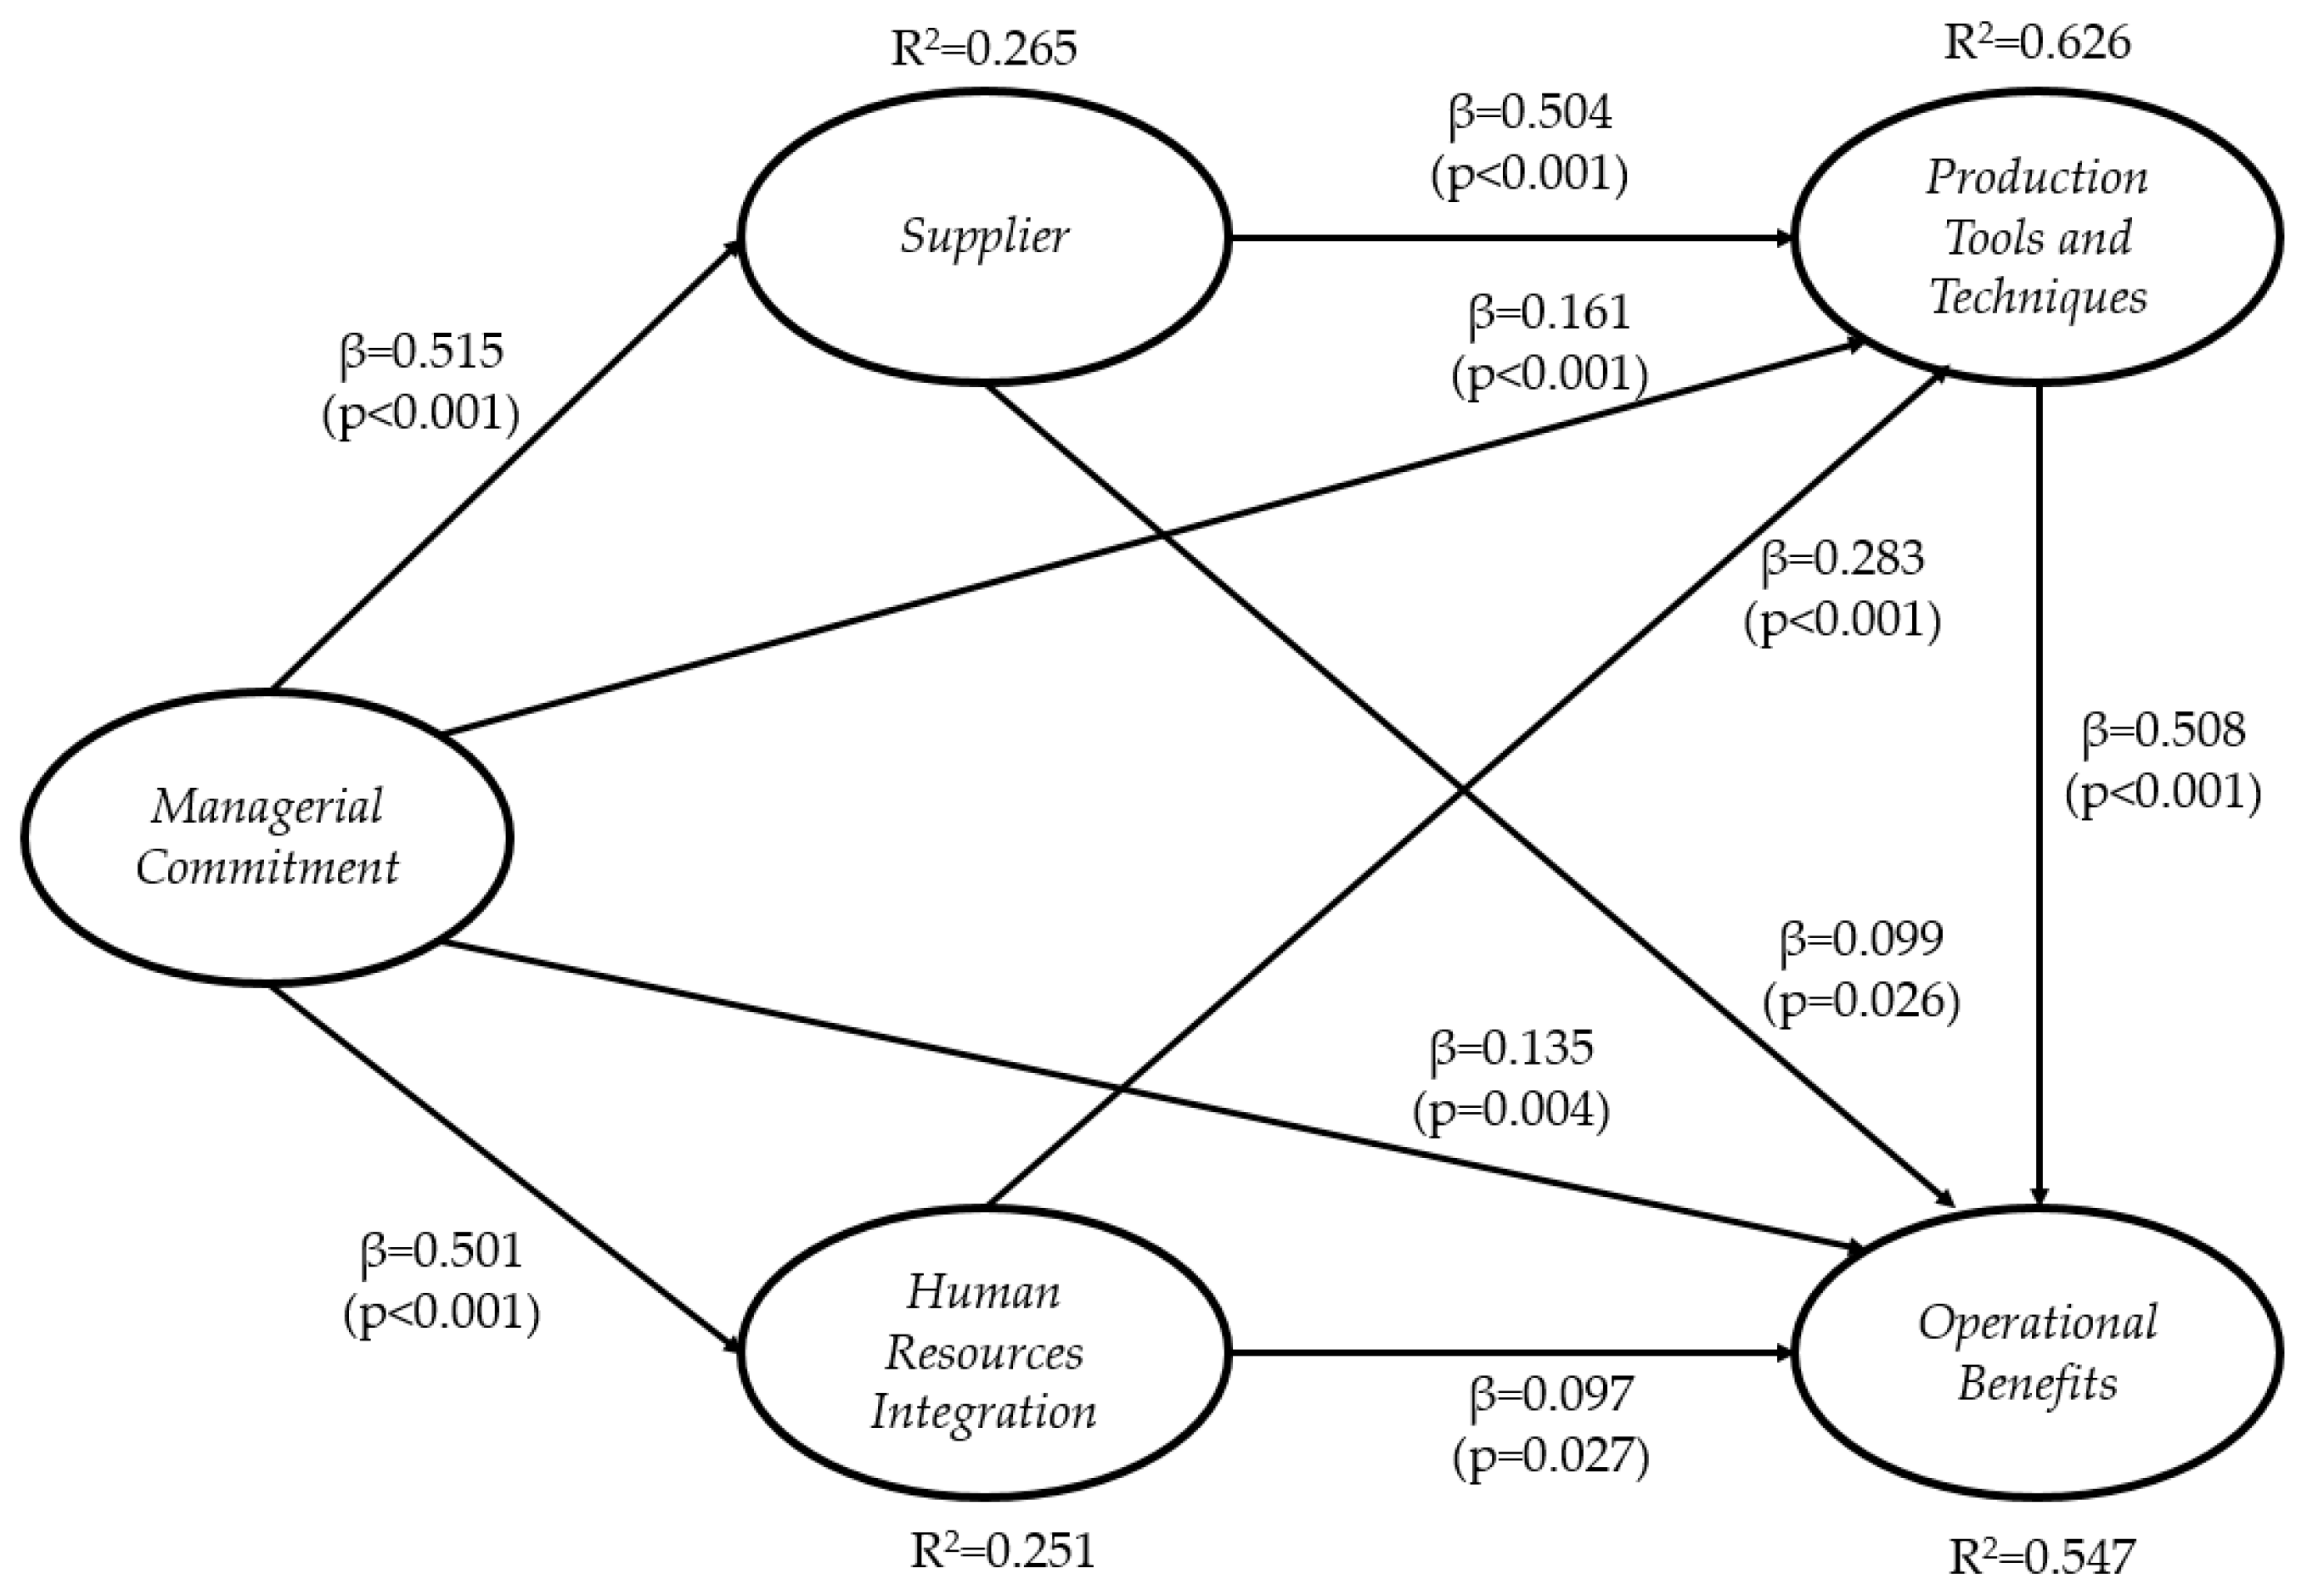
| R2 | 0.251 | 0.265 | 0.626 | 0.547 | |
| Adjusted R2 | 0.249 | 0.263 | 0.623 | 0.542 | |
| Composite reliability | 0.864 | 0.872 | 0.862 | 0.896 | 0.923 |
| Cronbach’s alpha | 0.811 | 0.804 | 0.799 | 0.867 | 0.903 |
| Average variance extracted | 0.516 | 0.631 | 0.557 | 0.519 | 0.634 |
| Variance inflation factor | 1.664 | 1.636 | 2.164 | 3.153 | 2.169 |
| Q2 | 0.251 | 0.266 | 0.625 | 0.547 | |
| Ítems | Latent Variables | ||||
|---|---|---|---|---|---|
| HRI | MAC | SUP | TTP | OBE | |
| HRI1 | 0.66 | 0.22 | −0.31 | 0.315 | −0.016 |
| HRI2 | 0.659 | −0.113 | −0.042 | 0.234 | 0.051 |
| HRI3 | 0.765 | −0.05 | 0.077 | −0.188 | −0.065 |
| HRI4 | 0.731 | −0.064 | −0.123 | −0.009 | 0.054 |
| HRI5 | 0.645 | 0.194 | 0.126 | −0.103 | 0.016 |
| HRI6 | 0.69 | −0.178 | 0.254 | −0.097 | −0.024 |
| MAC1 | −0.115 | 0.714 | −0.039 | 0.078 | −0.032 |
| MAC2 | 0.021 | 0.737 | 0.13 | −0.237 | −0.033 |
| MAC3 | 0.165 | 0.688 | −0.031 | −0.106 | 0.032 |
| MAC4 | −0.041 | 0.625 | −0.089 | 0.333 | 0.058 |
| SUP1 | 0.026 | −0.103 | 0.613 | 0.237 | 0.139 |
| SUP2 | −0.011 | −0.086 | 0.678 | 0.094 | −0.106 |
| SUP3 | 0.005 | 0.045 | 0.687 | −0.116 | −0.091 |
| SUP4 | −0.121 | 0.169 | 0.644 | 0.17 | −0.108 |
| SUP5 | 0.111 | −0.031 | 0.653 | −0.385 | 0.241 |
| TTP1 | 0.191 | −0.111 | −0.098 | 0.613 | −0.076 |
| TTP2 | 0.226 | −0.305 | −0.018 | 0.624 | −0.001 |
| TTP3 | −0.075 | −0.188 | −0.036 | 0.659 | −0.083 |
| TTP4 | −0.062 | 0.194 | −0.148 | 0.599 | 0.035 |
| TTP5 | −0.163 | −0.042 | 0.015 | 0.618 | 0.121 |
| TTP6 | 0.033 | 0.268 | −0.109 | 0.571 | 0.356 |
| TTP7 | −0.02 | 0.174 | 0.178 | 0.592 | −0.02 |
| TTP8 | −0.089 | 0.185 | 0.197 | 0.605 | −0.208 |
| OBE1 | −0.011 | 0.098 | −0.153 | 0.022 | 0.659 |
| OBE2 | −0.034 | 0 | 0.065 | −0.058 | 0.652 |
| OBE3 | −0.065 | 0.086 | −0.154 | 0.11 | 0.654 |
| OBE4 | 0.087 | −0.166 | 0.152 | −0.071 | 0.646 |
| OBE5 | −0.147 | 0.091 | 0.002 | 0.177 | 0.631 |
| OBE6 | 0.059 | −0.097 | 0.042 | −0.067 | 0.658 |
| OBE7 | 0.135 | −0.044 | 0.105 | −0.125 | 0.636 |
| Latent Variables | Latent Variables | ||||
|---|---|---|---|---|---|
| HRI | MAC | SUP | TTP | OBE | |
| HRI | 0.718 | 0.499 | 0.468 | 0.592 | 0.508 |
| MAC | 0.499 | 0.794 | 0.506 | 0.557 | 0.518 |
| SUP | 0.468 | 0.506 | 0.746 | 0.518 | 0.584 |
| TTP | 0.592 | 0.557 | 0.518 | 0.72 | 0.701 |
| OBE | 0.508 | 0.518 | 0.584 | 0.701 | 0.796 |
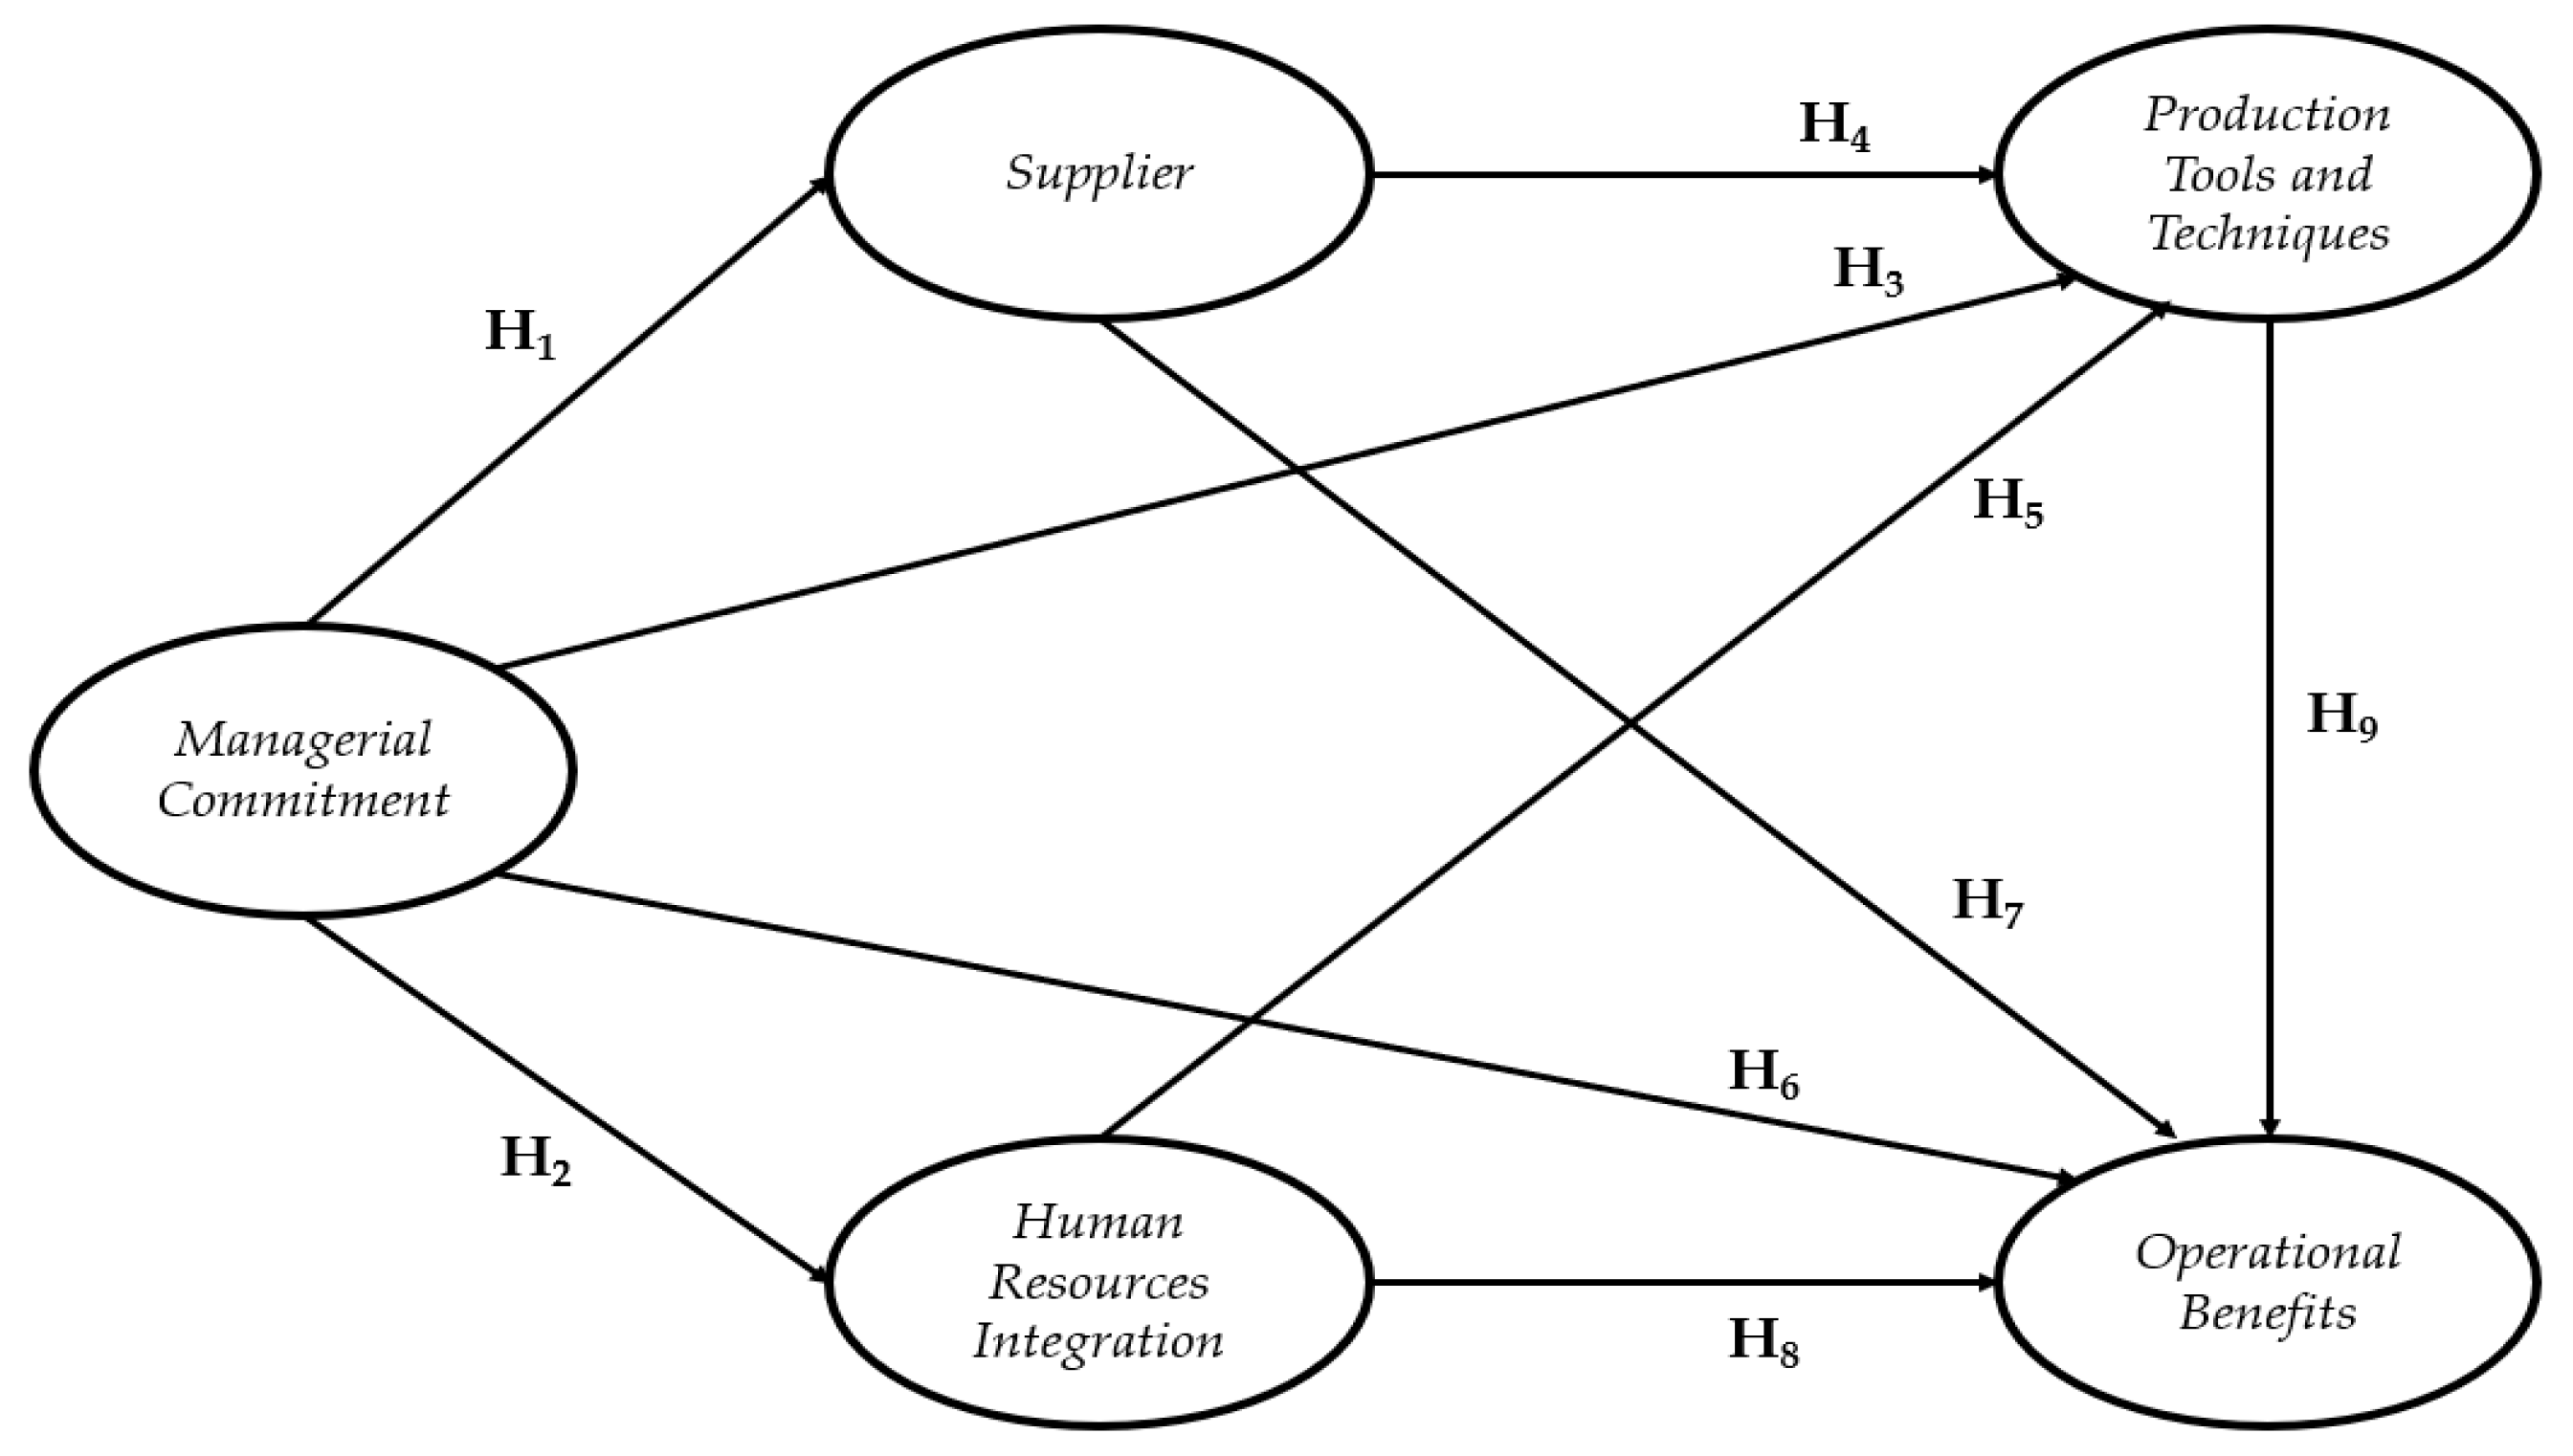
| Hi | Independent | Dependent | β Value | Conclusion |
|---|---|---|---|---|
| Variable | Variable | (p-Value) | ||
| H1 | MAC | SUP | 0.515 (p ˂ 0.001) | Accepted |
| H2 | MAC | HRI | 0.501 (p ˂ 0.001) | Accepted |
| H3 | MAC | TTP | 0.161 (p ˂ 0.001) | Accepted |
| H4 | SUP | TTP | 0.504 (p ˂ 0.001) | Accepted |
| H5 | HRI | TTP | 0.283 (p ˂ 0.001) | Accepted |
| H6 | MAC | OBE | 0.135 (p = 0.004) | Accepted |
| H7 | SUP | OBE | 0.099 (p = 0.026) | Accepted |
| H8 | HRI | OBE | 0.097 (p = 0.027) | Accepted |
| H9 | TTP | OBE | 0.508 (p ˂ 0.001) | Accepted |
| Dependent Variable | Independent Variable | R2 | |||
|---|---|---|---|---|---|
| HRI | MAC | SUP | TTP | ||
| HRI | 0.251 | 0.251 | |||
| SUP | 0.265 | 0.265 | |||
| TTP | 0.169 | 0.092 | 0.365 | 0.626 | |
| OBE | 0.051 | 0.072 | 0.059 | 0.365 | 0.547 |
| Sum of Indirect Effects | ||||
|---|---|---|---|---|
| Dependent Variable | Independent Variable | |||
| HRI | MAC | SUP | TTP | |
| TTP | 0.401(p < 0.001) ES = 0.229 | |||
| OBE | 0.144 (p < 0.001) ES = 0.074 | 0.386 (p < 0.001) ES = 0.207 | 0.256 (p < 0.001) ES = 0.151 | |
| Total Effect | ||||
| HRI | 0.501 (p < 0.001) ES = 0.251 | |||
| SUP | 0.515 (p < 0.001) ES = 0.265 | |||
| TTP | 0.283 (p < 0.001) ES = 0.169 | 0.562 (p < 0.001) ES = 0.321 | 0.504 (p < 0.001) ES = 0.365 | |
| OBE | 0.242 (p < 0.001) ES = 0.125 | 0.521 (p < 0.001) ES = 0.279 | 0.355 (p < 0.001) ES = 0.210 | 0.508 (p < 0.001) ES = 0.365 |
| Independent Latent Variables | |||||||||||
|---|---|---|---|---|---|---|---|---|---|---|---|
| MAC | SUP | HRI | TTP | ||||||||
| + | − | + | − | + | − | + | − | ||||
| 0.161 | 0.169 | 0.159 | 0.153 | 0.175 | 0.159 | 0.169 | 0.156 | ||||
| Dependent latent variables | SUP | + | 0.159 | &0.056 If 0.350 | &0.008 If 0.048 | ||||||
| − | 0.153 | &0.005 If 0.033 | &0.067 If 0.397 | ||||||||
| HRI | + | 0.175 | &0.065 If 0.400 | &0.005 If 0.032 | &0.062 If 0.390 | &0.000 If 0.000 | |||||
| − | 0.159 | &0.013 If 0.083 | &0.067 If 0.397 | &0.013 If 0.085 | &0.059 If 0.386 | ||||||
| TTP | + | 0.169 | &0.067 If 0.417 | &0.005 If 0.032 | &0.081 If 0.508 | &0.000 If 0.000 | &0.086 If 0.492 | &0.005 If 0.034 | |||
| − | 0.156 | &0.011 If 0.067 | &0.073 If 0.429 | &0.000 If 0.000 | &0.097 If 0.630 | &0.003 If 0.015 | &0.081 If 0.508 | ||||
| OBE | + | 0.148 | &0.046 If 0.283 | &0.008 If 0.048 | &0.062 If 0.390 | &0.003 If 0.018 | &0.059 If 0.338 | &0.008 If 0.051 | &0.086 If 0.508 | &0.003 If 0.017 | |
| − | 0.140 | &0.008 If 0.050 | &0.056 If 0.333 | &0.003 If 0.017 | &0.067 If 0.439 | &0.008 If 0.046 | &0.067 If 0.424 | &0.000 If 0.000 | &0.089 If 0.569 | ||
© 2019 by the authors. Licensee MDPI, Basel, Switzerland. This article is an open access article distributed under the terms and conditions of the Creative Commons Attribution (CC BY) license (http://creativecommons.org/licenses/by/4.0/).
Share and Cite
García-Alcaraz, J.L.; Realyvasquez-Vargas, A.; García-Alcaraz, P.; Pérez de la Parte, M.; Blanco Fernández, J.; Jiménez Macias, E. Effects of Human Factors and Lean Techniques on Just in Time Benefits. Sustainability 2019, 11, 1864. https://0-doi-org.brum.beds.ac.uk/10.3390/su11071864
García-Alcaraz JL, Realyvasquez-Vargas A, García-Alcaraz P, Pérez de la Parte M, Blanco Fernández J, Jiménez Macias E. Effects of Human Factors and Lean Techniques on Just in Time Benefits. Sustainability. 2019; 11(7):1864. https://0-doi-org.brum.beds.ac.uk/10.3390/su11071864
Chicago/Turabian StyleGarcía-Alcaraz, Jorge Luis, Arturo Realyvasquez-Vargas, Pedro García-Alcaraz, Mercedes Pérez de la Parte, Julio Blanco Fernández, and Emilio Jiménez Macias. 2019. "Effects of Human Factors and Lean Techniques on Just in Time Benefits" Sustainability 11, no. 7: 1864. https://0-doi-org.brum.beds.ac.uk/10.3390/su11071864