Article

Research on the Complex Characteristics of Freight Transportation from a Multiscale Perspective Using Freight Vehicle Trip Data

1
School of Transportation and Logistics, Southwest Jiaotong University, Chengdu 610031, Sichuan, China
2
Yunnan Integrated Transport Development and Regional Logistics Management Think Tank, Kunming University of Science and Technology, Kunming 650504, Yunnan, China
3
Yunnan Engineering Research Center of Modern Logistics, Kunming University of Science and Technology, Kunming 650504, Yunnan, China
*
Author to whom correspondence should be addressed.
Sustainability 2019, 11(7), 1897; https://0-doi-org.brum.beds.ac.uk/10.3390/su11071897
Submission received: 30 January 2019 / Revised: 3 March 2019 / Accepted: 14 March 2019 / Published: 29 March 2019
(This article belongs to the Special Issue Toward Sustainability: Transport Geography and Mobility)

Abstract

:
To better guide the sustainable developing of freight transport aligning with environmental objectives it is of strategic importance to capture freight transportation characteristics more realistically. This paper characterizes freight transportation by using a complex network approach from multidimensional perspectives based on freight vehicle trips data. We first build two subnetworks from prefecture-level city-scale and county-level city-scale. Subsequently, network analysis indices based on complex network theory were applied to examine the topological structure and complexity of the freight transportation networks. Furthermore, the community detection method is introduced to reveal the networks’ clustering characteristics. The findings show that the prefecture-level city-scale network and the county-level city-scale network both have obvious small-world network characteristics, but the prefecture-level city-scale network has higher operating efficiency for goods movement. Additionally, the influence of the cross-border effect on the freight transportation network was verified. In terms of the community structure, the freight network shows distinct clustering features only at the county-level city-scale.

1. Introduction

Currently, humankind’s effect on the environment has come to an irreversible stage [1]. In particular, as one of the world’s largest energy consumers and carbon dioxide emitters, China is facing more severe environmental issues (such as extreme climate). According to the BP Statistical Review of World Energy 2018, China’s energy consumption accounts for 23.2% of global consumption and 33.6% of global growth during the last year. In this atmosphere, being environmental sustainability-oriented has become a key strategy for governments.
Transport plays a key role in the functioning and development of the city. Many empirical studies have proven that transportation is the most crucial of the determinants (e.g., the economy, land use, population, and employment) of urban development because it provides mobility for people and goods and influences the growth patterns of economic activity through changing accessibility [2,3,4]. Meanwhile, it is also the main contributor of emission. According to survey data, China’s transport accounts for more than 9% of the total energy consumption and maintains an average annual growth rate of 28%. Moreover, with the significant increase in freight transportation, there is no doubt that the freight transport sector has become an important emission source [5,6,7]. Therefore, environmental sustainability-oriented policies in the freight transport sector are essential.
In fact, many countries have been making and implementing policies for environmental sustainability in the field of freight transportation and logistics. For example, intermodal transport, as an efficient and environmentally friendly mode, has been vigorously advancing in Europe [8,9]. Similarly, China has been implementing the environmental logistics policy in road freight. This policy strongly advocates reducing emissions by the application of green energy in freight vehicles and the improvement of operational efficiency [5]. Recently, sustainable supply chain management has been adopted in many logistics companies, because it allows to close and cycle resources and improve environmental sustainability [10,11].
However, the realization of the environmental sustainability goal still requires much work. One of the biggest challenges that stands in the way of achieving this goal is the lack of accuracy and realistic characteristics of freight transportation network to support freight transport planning [12]. The identification of freight transportation network features thoroughly is the foundational work, which is directly related to the formulation of freight transport planning schemes (such as freight transportation network optimal scheme, infrastructure and related freight facilities layout scheme). Although this challenge has been acknowledged by planners and policy practitioners, the most recent studies related to freight transportation still focus on the technology and approach for capturing freight features at microlevels, such as the identification of OD information [13], the individual truck’s trip chain information [14], and travel time reliability [15]. Little attention has been paid on freight transportation network. In addition, to better promote urban economic growth, the construction and development of transportation infrastructure, as a typical urbanization strategy, have been conducted in many developing countries [16,17]. However, with the implementation of this strategy, gradually, freight transportation activities are likely to become more complex in terms of patterns of travel [18,19,20,21], which increases the challenge of delineating and revealing the spatial interaction features of freight transportation. In this context, to understand the growing complexity of freight travel, there is an urgent need to thoroughly research the characteristics of freight transportation, which greatly benefits the optimization of goods and service delivery within existing transportation networks and thereby accelerates sustainable urban development and transportation.
A large number of studies have identified the characteristics of transportation networks based on massive amounts of travel data, including air passenger flow, rail passenger flow, traffic flow, and big geospatial data. Wang et al. [22], Lao et al. [23], and Dai et al. [24] explored the spatial structure of an air transportation network using aviation passenger data. Zhong et al. [25] examined the hierarchical structure of the China passenger railway transportation network and conducted a comparison analysis of the air transportation network and the railway transportation network. In addition, Wang et al. [26] identified the spatial interactions between cities and explored the community structure of the railway and air transportation networks, and they stated that the barrier effects of the administrative boundary on these two networks’ forms were different. To study traffic flow, most studies have focused on road network layout evaluation and traffic demand analysis, as well as vulnerability analysis [27,28]. There is a need to use big geospatial data because there is an increasing need to identify travel activity characteristics more effectively. For example, Liu et al. [29] used taxi trip data to explore the clustering characteristics of a person’s travel activities within a city and found that some clusters showed that the boundary scope of some clusters was not consistent with the administrative boundaries. Similar studies have been conducted by Joubert et al. [30], Zhong et al. [31], etc.
However, the existing literature on this topic has mainly focused on passenger transportation, providing few insights into freight transportation. In particular, the features of freight transportation remain largely unexplored. As noted by Allen et al. [19,32], there has been no comparable research on the spatial interaction of freight transport, although a large number of theoretical and empirical works on passenger transport have been conducted. More importantly, when depicting and revealing the characteristics of freight transportation, little attention has been paid to the impact of administrative boundaries on transportation. This is surprising, given that the urbanization trend of scope or spatial scale of freight movements is expanding and the number of cross-border freight flows is increasing [19,33,34,35]. Nevertheless, most applications treat the scope of freight movements as a “closed area” or a” static area”; i.e., the spatial interactions and transportation linkages in the outer areas of the selected study area are not usually considered [36,37,38], which leads to unrealistic results.
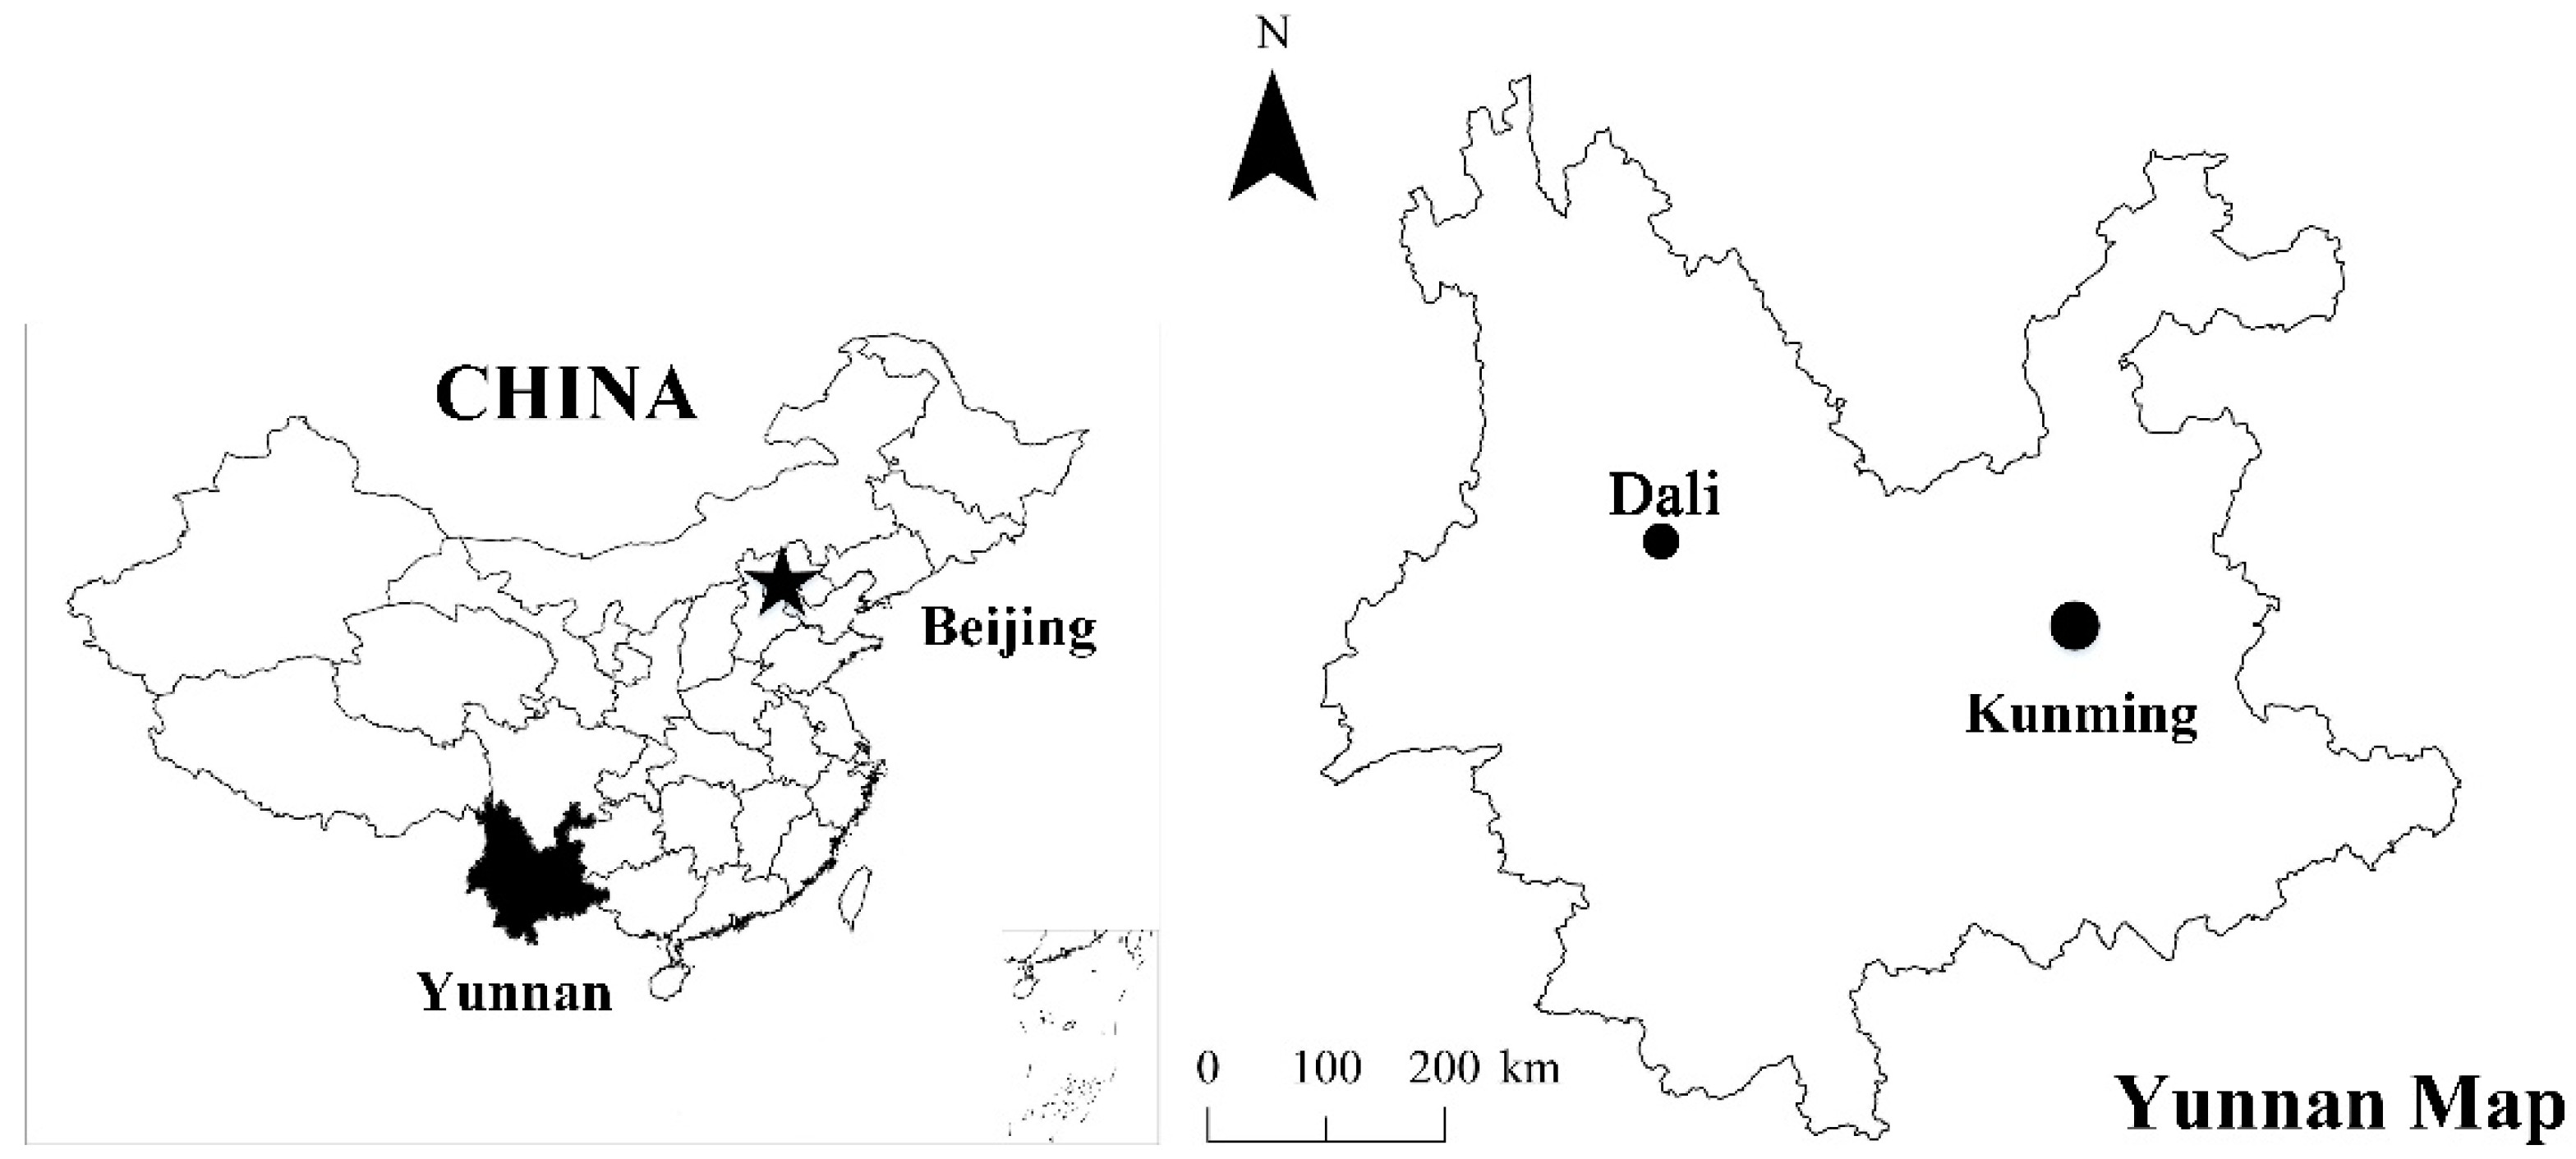
Therefore, our research objective is to characterize freight transportation from multiscale perspectives, focusing on the freight flows generated in both inner and outer urban areas as well as the influence of the cross-border effect on freight transportation networks. This research uses origin–destination freight vehicle trip data from approximately 7000 trucks in Yunnan Province, China, as an example to characterize spatial topological properties and the community structure of freight transportation.
The contributions of this work are twofold. First, we propose an improved freight network building process that depicts more realistic freight activities and spatial interactions, and it provides evidence and findings regarding the impact of the cross-border effect on the topological structure of networks in China. This study enriches the approach used for freight network building in the increasingly complex travel environment and further enhances our understanding of urban spatial structures. Second, this study uses origin–destination freight vehicle trip data that shows intercity trips and intracity trips showing that the urban structure obtained has strong relations with freight transportation applications; this finding provides novel insights regarding the development and optimization of freight transportation and urban sustainable development. The following sections describe the study area, the process used to prepare the data, introduce the study methods, and reveal the features of freight transportation from two aspects of statistical properties and clustering characteristics. The last section provides the conclusion and recommendations for future research.

2. Materials and Methods

2.1. Background of Yunnan Province

As an important node of the ‘The Belt and Road’, Yunnan Province plays the role of the logistics center of Southwest China, as well as the gateway for trade and transnational cooperation with South and Southeast Asia. According to data obtained from the Yunnan Statistical Yearbook (2016), Yunnan’s total import and export of goods was 24,527 million USD in 2015, and the share of the total import and export of Yunnan to ASEAN countries was 53.68% [39]. However, Yunnan is an underdeveloped area, which had a GDP of 1371.79 billion yuan in 2015 (ranked 23rd in China). The main mode of transporting goods is road transport. As shown in Table 1, in the Twelfth Five-Year Plan period, the contribution of the highway transportation mode to the province’s total cargo traffic was over 80%, compared to the corresponding contribution to total cargo turnover in the province, which was over 50%.
Geographically, Yunnan Province has a total area of approximately 394 thousand square kilometers consisting of 16 prefecture-level administrative units and 129 county-level administrative units. Kunming, a prefecture-level city, is the economic (capital) center and the core logistics center as well, and Dali, an autonomous prefecture, is the vice logistics center, as depicted in Figure 1. Yunnan Province is adjacent to the Chongqing municipality, Guangxi autonomous prefecture, Sichuan Province and Guizhou Province (as shown in Figure 1). Yunnan Province has good connectivity and accessibility in terms of road transport infrastructure and access to these areas mainly through five logistics channels.

2.2. Data and Data Preparation

The data were obtained from the Freight Vehicles Trip Survey of Yunnan Province conducted by the Department for Road Transportation Administration of Yunnan Province in 2015 from September 11 to 20. In this survey, vehicle owners were asked to record their activity and travel information, and vehicle attribute information was also collected. The collected data contained approximately 32,000 trips made by 6946 trucks in Yunnan. After trips with incomplete information were excluded, the final sample data include 29,099 trips. Approximately 33% of these trips occurred within Yunnan Province, and the remaining trips either originated or ended outside of Yunnan Province.
Given that we focused on the interactions between places, information on the origin and destination of each trip was extracted, as well as the corresponding freight volume. It should be noted that information on the origins and destinations refers to an address rather than more accurate coordinates, and the address is only accurate to the county-level administrative units. This means that the minimum spatial analysis unit we can use with our sample data is a county scale. In terms of the movement direction of the freight flows, the sample data contained two types of trips: trips from and to the county area. In this study, we further classified the sample data into intercity trips and intracity trips. The data were prepared as described in the following section. An intercity trip refers to a trip from one county area to another, both of which are located in the same city area (shown in Figure 2b). An intracity trip refers to a trip either from or to a county area located in a different city area (shown in Figure 2c). Of these trips, approximately 46% were intercity trips, and the remaining trips were intracity trips.

2.3. Methods

The commonly adopted analytical methods for transportation network are dynamic theoretical models of multistage graphics, including Friedman’s ‘core-periphery’ spatial model, Taft’s harbor space structure model and ‘point-axis’ spatial system theory [40]. However, these methods exist some limitations when dealing with large data volume, such as depicting the complex relations of the flows and revealing the realistic spatial interactions. Complex network approach which is a part of graph theory can reduce the difficulty in dealing with large data volume by using an abstract representation of transportation networks [41]. Also, it can offer a useful tool to analyze network structures, dynamics, and their underlying mechanisms at different spatial scales (e.g., local scale, global scale, and mesoscale) [41,42,43]. In recent years, with the increasingly availability of GPS data, the complex network has once again been embraced to capture the characteristics of networks [29,44]. Particularly, community detection, as a part of the complex network approach, has been employed to find clustering characteristics of networks and, further, to identify the complex relations between nodes [29]. Therefore, the complex network approach was introduced to analyze the freight vehicle trip data collected in Yunnan and explore the multidimensional characteristics of freight transportation.
The construction of a network directly affects the results extracted regarding the spatial organization characteristics of regional transportation connections. The scientific construction process of a network is the foundation and precondition for revealing these spatial characteristics [45,46]. Considering the important role of cross-border freight flows in this study, this study developed a modified process to establish freight networks by referring to the approach provided by Wang et al. [22,47]. Secondly, some complex network indicators were adopted to assess the spatial structure of freight network. Finally, the community detection approach was conducted to reveal the networks’ clustering characteristics. Figure 3 is the methodology of our paper.

2.3.1. Freight Network Building

For building transportation networks, the most widely used approach is to identify the nodes and edges first and then establish the relation matrix between the nodes using graph theory [22,32,47]. This approach has obvious advantages for representing pairwise relations between nodes and retains the spatial realities of the movement of freight flows and was used for our research on freight network building.
Considering that our research focused on internal and external spatial interactions, two scale networks were constructed. One is a prefecture-level city-scale network G p , and the other is a county-level city-scale network G c . These two scales were constructed by following the relevant studies [48,49], suggesting that the spatial analysis unit is appropriate for depicting actual transportation activities.
Before establishing the network model, the assumptions are proposed as below.
(1)
We used network G p to characterize the spatial interactions between cities and network G c to characterize the spatial interactions within the city.
(2)
Treating the freight network as a spatial network. In this network, the nodes represent the spatial analysis units associated with the research objective, and the edges represent the existence of relations or linkages between these nodes.
(3)
Treating the aggregated freight volume of the corresponding trips as the weight of the edge. The processes used to build networks G p and G c are as follows.
(1)
Identifying nodes and edges. For network G p , the unit refers to a prefecture-level city; for network G c , the unit refers to a county-level city. The edges refer to the trips in our sample data for networks G p and G c .
(2)
Establishing the relation matrix between nodes. We constructed a directional value matrix W = [ w 11 w 1 j w j 1 w i j ] using UCINET 6.0 software [50]. Where w i j is the aggregated freight volume, representing the weight of edge e i j from node v i to node v j . As a result, a weighted and directed network G = ( V , E , W ) composed of a node set V = { v i : i = 1 , 2 , , n } and a link set E = { e i j : v i , v j V } was formed.
For network G c , the weight w i j c can be calculated as follows
w i j c = r e i j c f i j r , r T
where f i j r is the freight volume of the r-th trip from county i to county j ; T is the set of all the trips in our sample data; e i j c is the edge from county i to county j ; and, if there is a linkage between them, e i j c = 1 , otherwise, e i j c = 0 .
For network G p , the weight w a b p can be calculated as follows
w a b p = r p e a b p w i j c , r p , r p T i n t e r , i a , j b
where w i j c , r p is the weight of the r p -th edge in network G c ; T i n t e r is the dataset comprising the intercity trips in our sample data; e a b p is the edge from prefecture a to prefecture b ; and, if there is a linkage between them, e a b p = 1 , otherwise, e a b p = 0 . i a indicates that county i belongs to the subdivision area of prefecture a ; j b indicates that county j belongs to the subdivision area of prefecture b .
Using this process, a weighted and directed network G p (shown in Figure 4b) was formed, composed of 48 nodes and 424 edges; a weighted and directed network G c (shown in Figure 4a) was formed as well, composed of 199 nodes and 2412 edges.

2.3.2. Complex Network Index for Assessing Spatial Structure of Freight Network

A complex network analysis is employed to analyze the overall freight network structure. This approach is frequently used to determine the temporal-spatial structure, including the hierarchical structure and relevance structure of the network. In general, the complex network is classified into a random network, a regular network, a small-world network, and a scale-free network based on the topological properties. Considering that the network built using the trip data of freight vehicles is a weighted network, which can reflect the strength of the linkages between the cities, the approach adopted here is that used by Lordan et al. [51]. We adopt combination property indicators—four node-level indicators and two network-level indicators—as tools for assessing the spatial structure of the freight networks. Degree and degree distributions are the most basic indices used to determine whether a network has scale-free properties, while the average shortest path length and the clustering coefficient are generally used to determine if a network has small-world properties. Below, we formally specify each of these measures.
(1) Degree and degree distribution.
An unweighted network can be transformed using UCINIET 6.0 software into a weighted network. In an unweighted network, the degree k i of node v i refers to the number of nodes that are directly connected to and is calculated by:
k i = j e i j
The degree distribution P ( k ) is the probability that any node is exactly equal to k in the network, given by
P ( k ) = n k / N
where n k is the number of nodes with a degree equal to k and N is the total number of nodes. For a scale-free network, the degree distribution P ( k ) follows a power law, namely P ( k ) k γ . Where γ is the fitted power law parameter.
However, the common approach is to use cumulative degree distribution P ( > k ) to depict a more accurate network; this approach is considered to reduce the error in relatively small and noisy datasets [40]. The cumulative degree distribution indicates the probability of nodes with degrees less than or equal to k , and is given by
P ( > k ) = k = k P ( k )
where the scale parameter γ has a relation to that of P ( k ) by γ = γ + 1 .
In the weighted network, the strength of node v i is the sum of the weighted edges that are directly connected to it and can be expressed as
s i = j = 1 n w i j
where w i j is the aggregated freight volume from unit i to unit j . Greater strength indicates that more freight activities occurred in an area to satisfy the demands of daily affairs and communications.
The strength distribution is characterized by a cumulative strength distribution P ( > s ) , which refers to the probability of nodes with strengths equal to or greater than s and is calculated as follows
P ( > s ) = s = s P ( s )
P ( s ) = n s / N
where n s is the number of nodes with strength equal to s .
(2) Average path length
The average path length L refers to the average of the distance between any two nodes in the network, i.e.,
L = 1 N ( N 1 ) i , j = 1 N d i j ( i j )
where d i j is the number of edges for the shortest path between v i and v j . A smaller L implies a smaller transit time and a lower cost.
(3) Clustering coefficient
The clustering coefficient C i is the ratio of the number of actual edges ( E i ) of node v i to the total number of possible edges, and is written as
C i = 2 E i / ( k i ( k i 1 ) )
The clustering coefficient for the whole network with all N nodes is expressed as
C = 1 N i = 1 N C i
where for a small-world network, the average path length L is shorter and the clustering coefficient C is higher than those of an identical-size random network.

2.3.3. Community Detection for Revealing the Network’s Clustering Characteristics

A community in a network is a subset of nodes with similar or identical properties, and it presents a subregion that has stronger connections within it than other subregions [52]. The identification of community structures in complex network graphs has long been a hot topic in network science since the early 20th century, and the partition methods and algorithms are developing and improving. As Rosvall and Bergstrom [53] noted, community detection can be implemented using many algorithms, such as Girvan-Newman, Walktrap, Fast-greedy Multilevel, Label Propagation, Infomap, etc.; however, among these algorithms, the Infomap algorithm enables researchers to model a weighted network using space-flow data [54]. There is evidence the Infomap algorithm fully takes into account the topological properties such as node strength, edge weight, and directions of flow, as well as high-order network data, which have significant adaptability and robust performance for real-world network community partitioning. Here, we use the community detection technique in Infomap to divide the subregions of the networks G p and G c , and then analyze the structural features of Yunnan Province as a case.
The core idea of the Infomap algorithm is that a group of nodes, among which information flows quickly and easily, can be clustered to a single well-connected module; the links between the modules capture the avenues of information flow between those modules. This algorithm considers the description length of a random walk as the optimal target function, transforming the network partition problem into a compression coding problem that minimizes the description length. More details on this technique can be found in papers written by Rosvall and Bergstrom [53].

3. Results

3.1. Statistical Properties of the Freight Network’s Topological Structure

3.1.1. Scale-Free Properties

Based on the G p networks constructed from the intercity trips in the sample data, the cumulative degree distribution P ( > k ) and the cumulative strength distribution P ( > s ) are obtained using Equations (3)–(8). The results show that P ( > k ) fits an exponential function ( P ( > k ) = 1.142 e 0.114 k , R 2 = 0.97090 ), while P ( > s ) fits a power law function ( P ( > s ) = 4.299 s 0.366 , R 2 = 0.7853 ). As noted by Clauset et al. [55], there are very few real-world networks that obey a power law function, but in many cases, they fit a power law function in a specific range of the values for degree and strength. Figure 5a shows that the P ( > k ) of network G p is segmented: the first segment of the degree has almost a horizontal distribution; the middle segment of the degree distribution fits a double power law function with the scale parameters γ c u m 1 = 0.5815 and γ c u m 2 = 1.9729 . Figure 5b shows that the fitted curve of the P ( > s ) of network G p can be treated as two lines using the scale parameters of γ c u m 1 = 1.0815 and γ c u m 2 = 5.314 . These findings imply that network G p forms a scale-free distribution at the local range level. Moreover, the exponential function of P ( > k ) can be considered as a reflection of the phenomenon shown in Figure 5a, based on prior studies [56]. Therefore, we can state that Yunnan’s freight network at the prefecture-level city-scale is in a transition and is moving from simple and random to complex and ordered, but the overall large-scale network structure has yet to be formed.
The same analysis approach is applied to the network G c , and the results show that P ( > k ) and P ( > s ) both fit a power law function ( P ( > k ) = 4.885 k 1.230 , R 2 = 0.9904 ; P ( > s ) = 7.665 s 0.496 , R 2 = 0.8964 ). The fitted curve of the degree distribution P ( > k ) (shown in Figure 6a) and the fitted curve of the strength distribution P ( > s ) (shown in Figure 6b) are composed of two lines and obey the power law distribution in the corresponding range of degree and strength. These results indicate that Yunnan’s freight network at the county-level city-scale also has scale-free properties.

3.1.2. Small-World Properties

Table 2 summarizes the statistical properties of networks G p and G c and compares these results to those of the corresponding random network with the same size nodes and edges. According to the criterion [18] that a small-world network has larger clustering coefficients and shorter average path lengths, we can infer that Yunnan’s freight network at both the prefecture-level city-scale and the county-level city-scale has small-world properties. However, the network at the prefecture-level city-scale has a shorter L P = 2.027 < 2.447 and a larger C p = 0.736 > 0.525 compared to the network at the county-level city-scale, indicating that the efficiency of freight operation on the prefecture-level city-scale is obviously better than that on the network at the county-level city-scale.

3.1.3. Comparison of the Network’s Statistical Properties without Considering a Cross-Border Effect

Our research mainly focuses on the effect of cross-border movements on freight transportation. Therefore, networks G t p and G t c are constructed by removing the nodes and edges outside Yunnan Province from networks G p and G c , respectively. Table 3 presents the statistical properties of networks G t p and G t c and the corresponding random network of the same size.
By comparing Table 2 and Table 3, we find that from network G p to G t p , L decreases from 2.027 to 1.267, and from network G c to G t c , L decreases from 2.447 to 1.991. This result indicates that cross-border freight flows reduce the overall operational efficiency of Yunnan’s freight network. Furthermore, L and C of the traditional network are compared with that of the random network. By reviewing the criteria of a small-world network, we find that the network G c is a small-world network, while network G p is not. Thus, the small-world properties disappeared from the network when it was altered from G p to G t p . These findings imply that the cross-border effect of freight transportation in the region will directly affect the spatial structure characteristics of the transportation network.

3.2. Clustering Characteristics of the Freight Network

In this section, we present a more detailed morphology of the freight network’s community structure and discuss the internal spatial interactions in the community. We first conduct community detection for networks G p and G c using the Infomap toolkit provided in the igraph R package. The results for the community detection of G p (Figure 7a) indicate that there are three communities, and the corresponding modularity value is 0.2488. High modularity for partitioning indicates that there are dense connections within communities and sparse connections across communities. In real-world networks, the value of modularity ranges from 0.3 to 0.7 [57]. The result indicates that the clustering characteristics of Yunnan’s freight network at the prefecture-level city-scale are not significant. However, G c has distinct clustering characteristics, showing eight communities, and the modularity value is 0.4383 (shown in Figure 7b). Thus, below, we discuss and analyze the detailed morphology only for G c . Figure 8 displays the community structure of network G p using ArcGIS 10.2 Desktop.
In terms of the community structure, most communities consist of spatially continuous units (i.e., counties), which indicates that intracity freight activities obey the distance decay law. Some single units located outside Yunnan Province also belong to the community because of some long distance but relatively large freight volume travels between the units and the inner region of Yunnan. This phenomenon is clearly observed in Community 3, Community 4, and Community 6. Considering that there is a strong correlation between the freight linkages and the distribution features of the goods, this view is verified through analysis [24]. Therefore, a reliable or possible explanation for this phenomenon is the spatial distribution features of the goods.
Furthermore, transportation and economic resources, as determinants of travel, are considered in our study for exploring the spatial layout features of the community. Scholars agree that the influence of transportation and economy resources on freight travel is much weaker than that on passenger travel. Moreover, the degree to which these two determinants have an impact on freight travel, or even whether they have an impact or not, requires comprehensive evaluation based on a combination of urban factors such as urban scale and urban land use. However, a close relationship between freight travel and transportation and economy resources is observed in Yunnan Province. First, Figure 8 shows that each community forms an aggregated area; the red dots are the core nodes. The red dots represent the maximum freight volume unit of each community, and they also represent the district centers with a high level of economic development. This structure indicates that the district centers dominate the local demand of freight transportation, in which the economy plays an important role. Second, the communities’ spatial distribution feature is consistent with the layout of the main roads (green lines in Figure 8), implying that Yunnan’s freight travel is related to transportation resources.
Focusing on the border of the community, it is not difficult to see that the connections within the community have overcome obstacles caused by administrative boundaries and initially formed some agglomeration areas that are mainly composed of the units located in neighboring prefecture-level city areas. In particular, in the marginal area of Yunnan Province, some units prefer to have contact with the units geographically adjacent to the outside of the province rather than units within the province, forming freight activity agglomeration areas with connections crossing provincial boundaries.
To better detect the detailed structure, we paid more attention to the freight volume of the community. As shown in Table 4, the freight demand has an imbalanced distribution, which is reflected in the following aspects. First, the difference between the maximum and minimum freight volumes of the trips in the same community is very large, indicating that freight demand is imbalanced in the community. Second, the community with a similar freight volume differs greatly in terms of size. For example, Community 2 and Community 8 cover 24 units and 54 units, respectively, and the gap between them is as high as 30 units. However, the freight volume of Community 2 is only slightly larger than Community 8, and the corresponding freight volumes are 136,102 and 117,061, respectively. This difference implies that the imbalance of the freight demand between different communities is obvious. It should be noted that for Yunnan’s logistics industry layout, Kunming is the core logistics center and Dali is the vice logistics center; the spatial structure layouts of Community 2 and Community 8 are consistent with the spatial layout of Yunnan’s logistics industry. Moreover, in terms of the interactions within the communities, some communities, such as Community 2, Community 3, and Community 5, have a single trip with a maximum freight volume that accounts for more than 50% of the sum of the freight volume for all trips of the community. From the perspective of complex network theory, the results show that large freight linkages occur between a small number of county pairs, indicating low county domain freight demand.

3.3. Sensitivity Analysis

The findings above show that the freight transportation characteristics has a tight link with the network scale. To further test the robustness of the freight network, the sensitivity analysis is performed on the parameters related to network scale (i.e., the number of nodes). Meanwhile, as an important factor, the development level of transportation determines the freight volume. The sensitivity analysis of the freight transportation to it is also conducted.

3.3.1. Number of Nodes

Based on the statistical properties of G p and G c , we tested the robustness of the freight network using deliberate attack tests (mainly by one-time destruction mode, which is simultaneous), by identifying whether the results change substantially. The network resilience [58] (i.e., coverage and connectivity indicators) and the change of freight volume are adopted to measure the variation in freight network. Table 5 shows the sensitivity analysis results of the number of nodes.
According to the comparative analysis of changing trend of coverage and connectivity index in G p and G c , the stability of the network structure is gradually decreases along with the reduction of the number of nodes. In terms of the variation in freight volume, a reduction of five nodes leads to a decrease of more than 50% of the affected freight volume in G p , while a reduction of 17 node leads to more than 50% of the affected freight volume in G c (shown in Figure 9). These findings suggest that G p is more sensitive to the network scale than G c , indicating that the key nodes play a more important role in the intercity freight activities than the intracity freight activities.

3.3.2. Development Level of Transportation Infrastructure

Considering data availability, we developed an evaluation system for the development level of transportation infrastructure (shown in Table 6) by referring the approach provided by literature [59]. Then, the entropy and Z-score method were used to determine the variables weight and data standardization. By doing so, we can calculate the weight of each variables and obtain the results of the development level of transportation infrastructure by using weighted average. The data of six indicators, including highway and freight vehicle densities, proportion of high-rank and classified highways, coverage rate of road freight stations over a second county level, and service capacity of logistics infrastructure, were obtained from the Statistical Yearbook 2016 (including Yunnan, Sichuan, Guizhou, Chongqing, Guangxi, and Guangdong) and The 2015 Annual Report of Road Transportation in Yunnan Province. Time and distance accessibility data were abstracted using ArcGIS spatial analysis technique.
Firstly, we used SPSS to analyze the correlation between the development level of transportation infrastructure and freight volume. Secondly, the variables which contribute to freight volume were applied to perform the sensitivity analysis. Table 6 and Table 7 are the results of correlation analysis and the sensitivity analysis, respectively.
Table 6 shows that the development level of transportation infrastructure has a positive effect on freight volume both in G p and G c . In G p , the main contributor of freight volume is transportation capacity; in G c , the main contributor of the freight volume is accessibility.
Table 7 presents the change results of freight volume with the parameters (related to transportation capacity and accessibility) of 10% increase and decrease of the initial parameter values. As expected, we observe that the sensitivity of freight volume to these two indicators. The results indicate that the intercity freight activities is sensitive to transportation capacity and the intracity freight activities is sensitive to accessibility.

4. Conclusions and Discussion

4.1. Conclusions

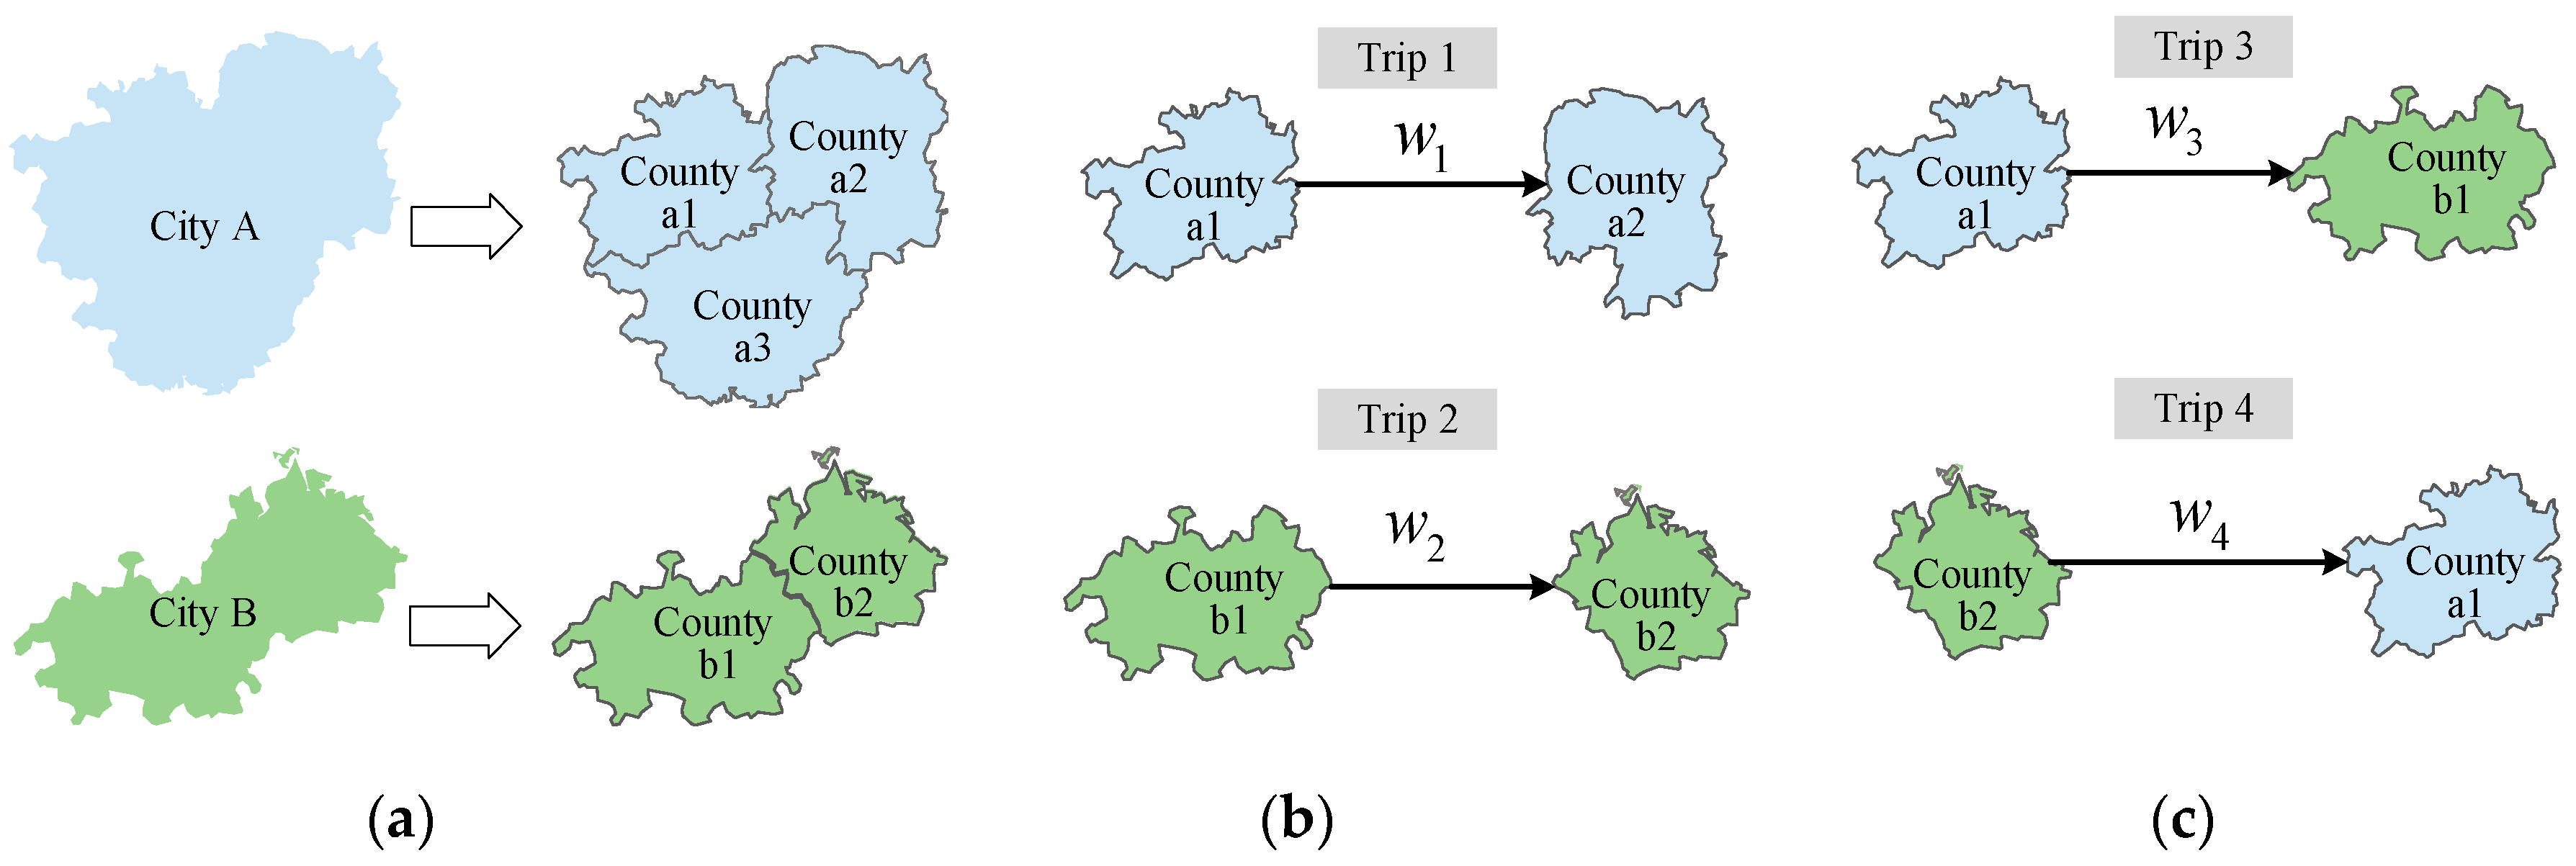
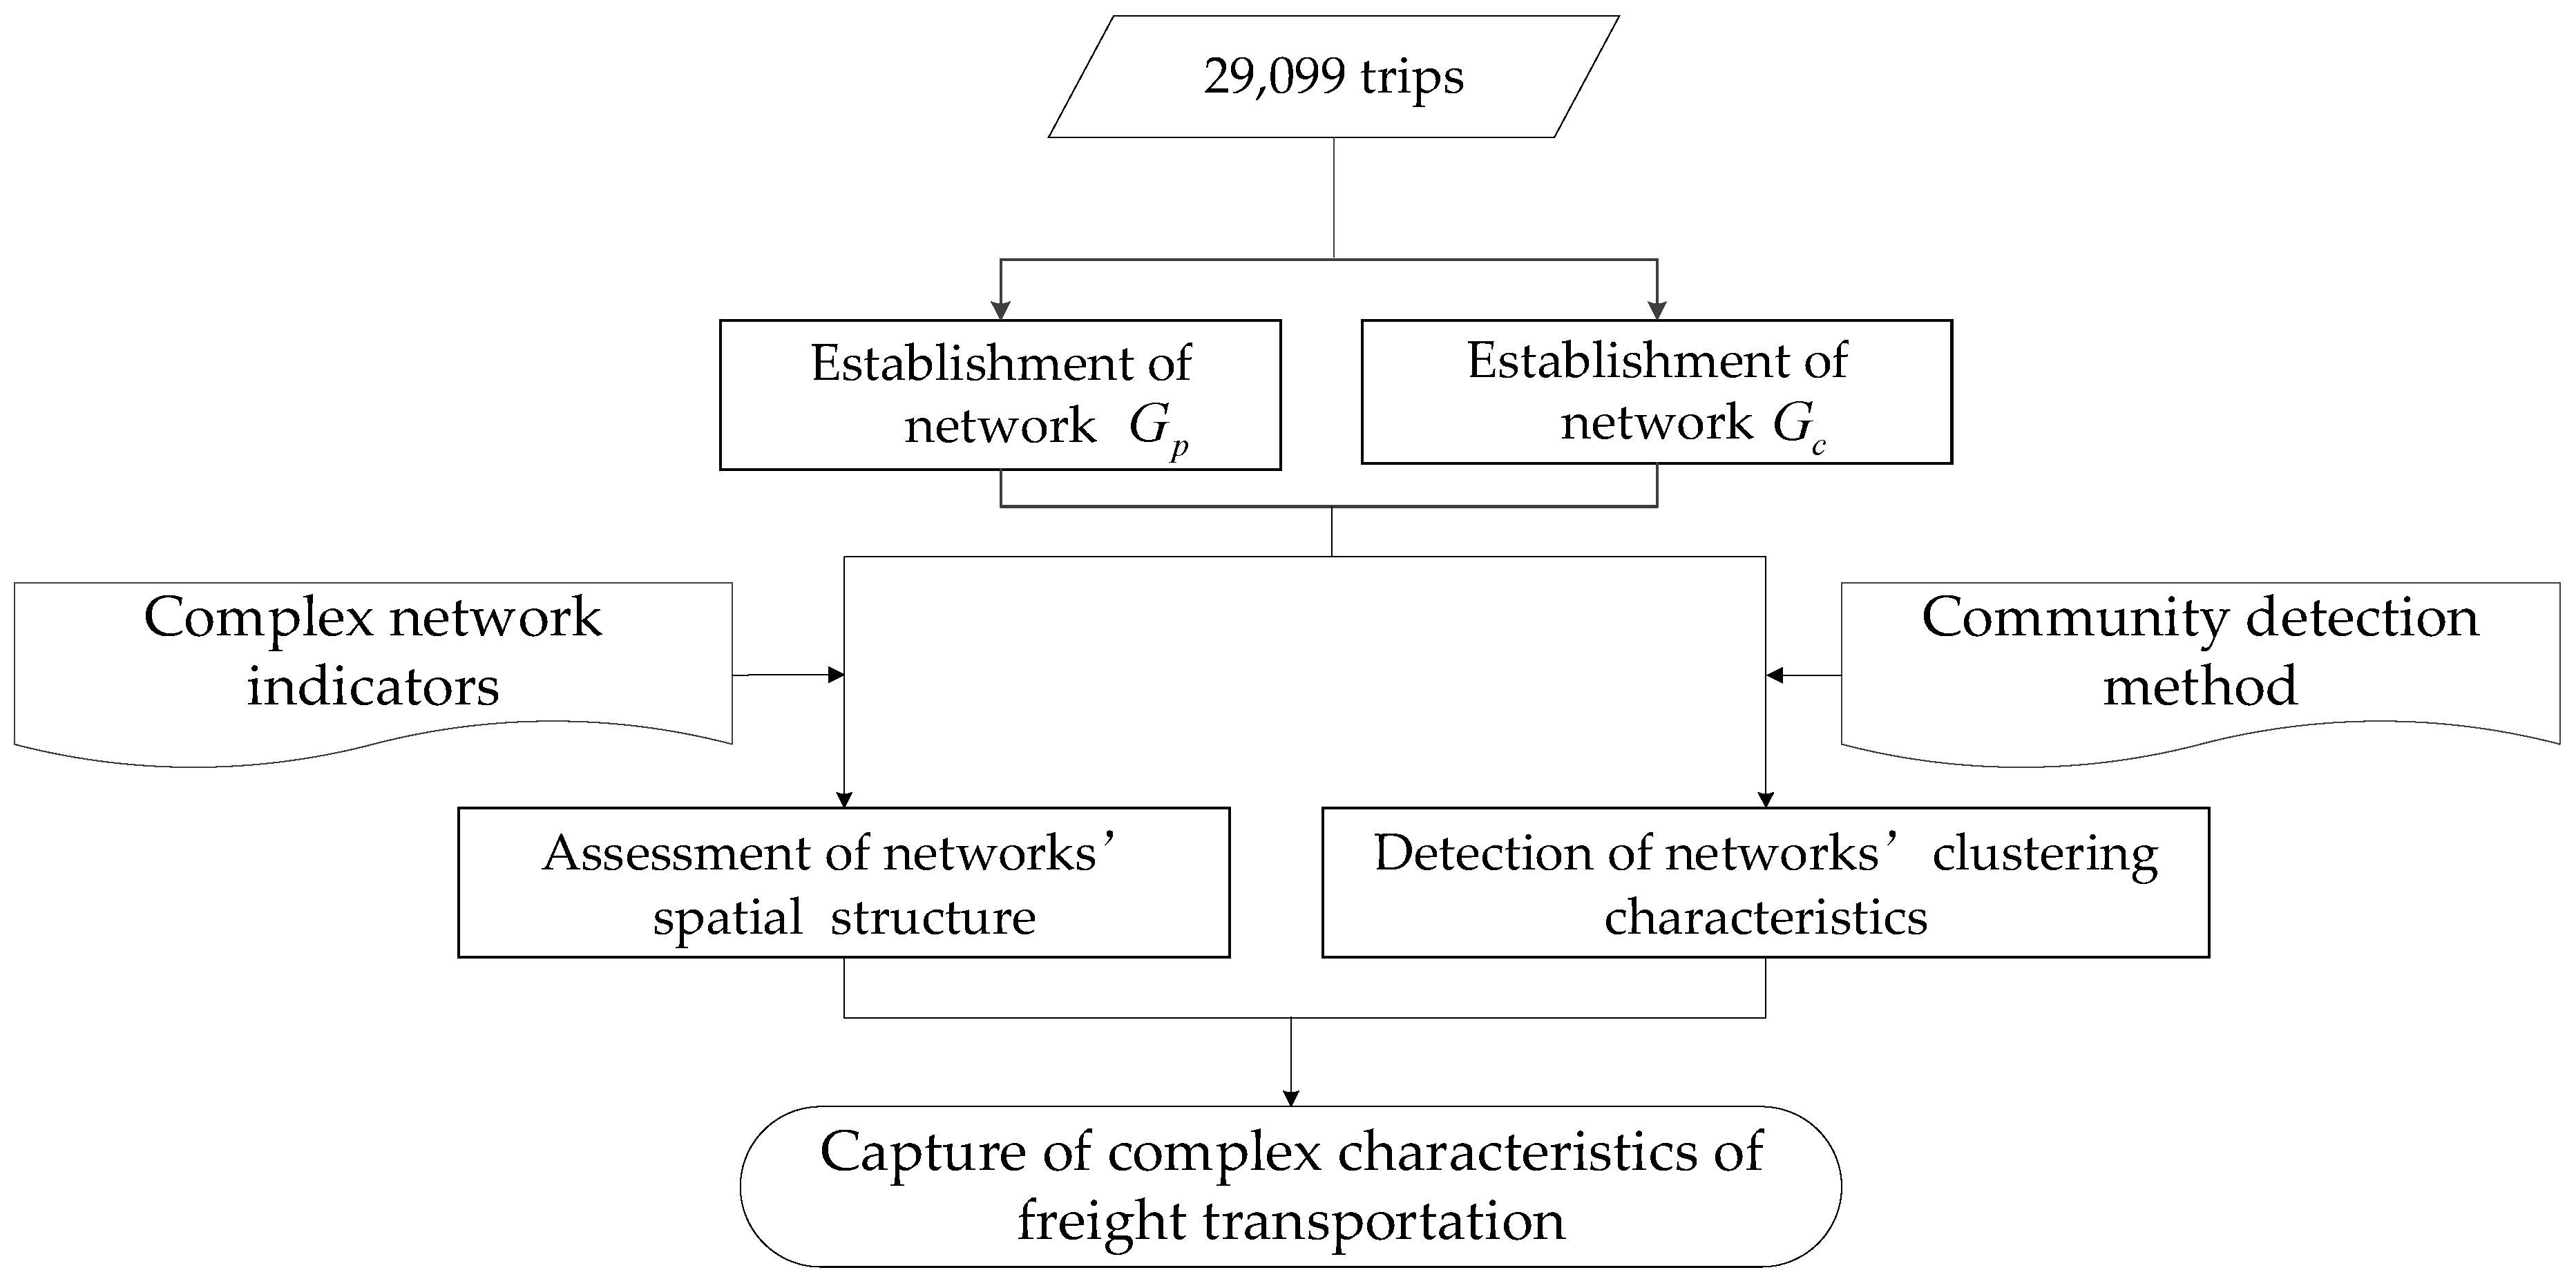
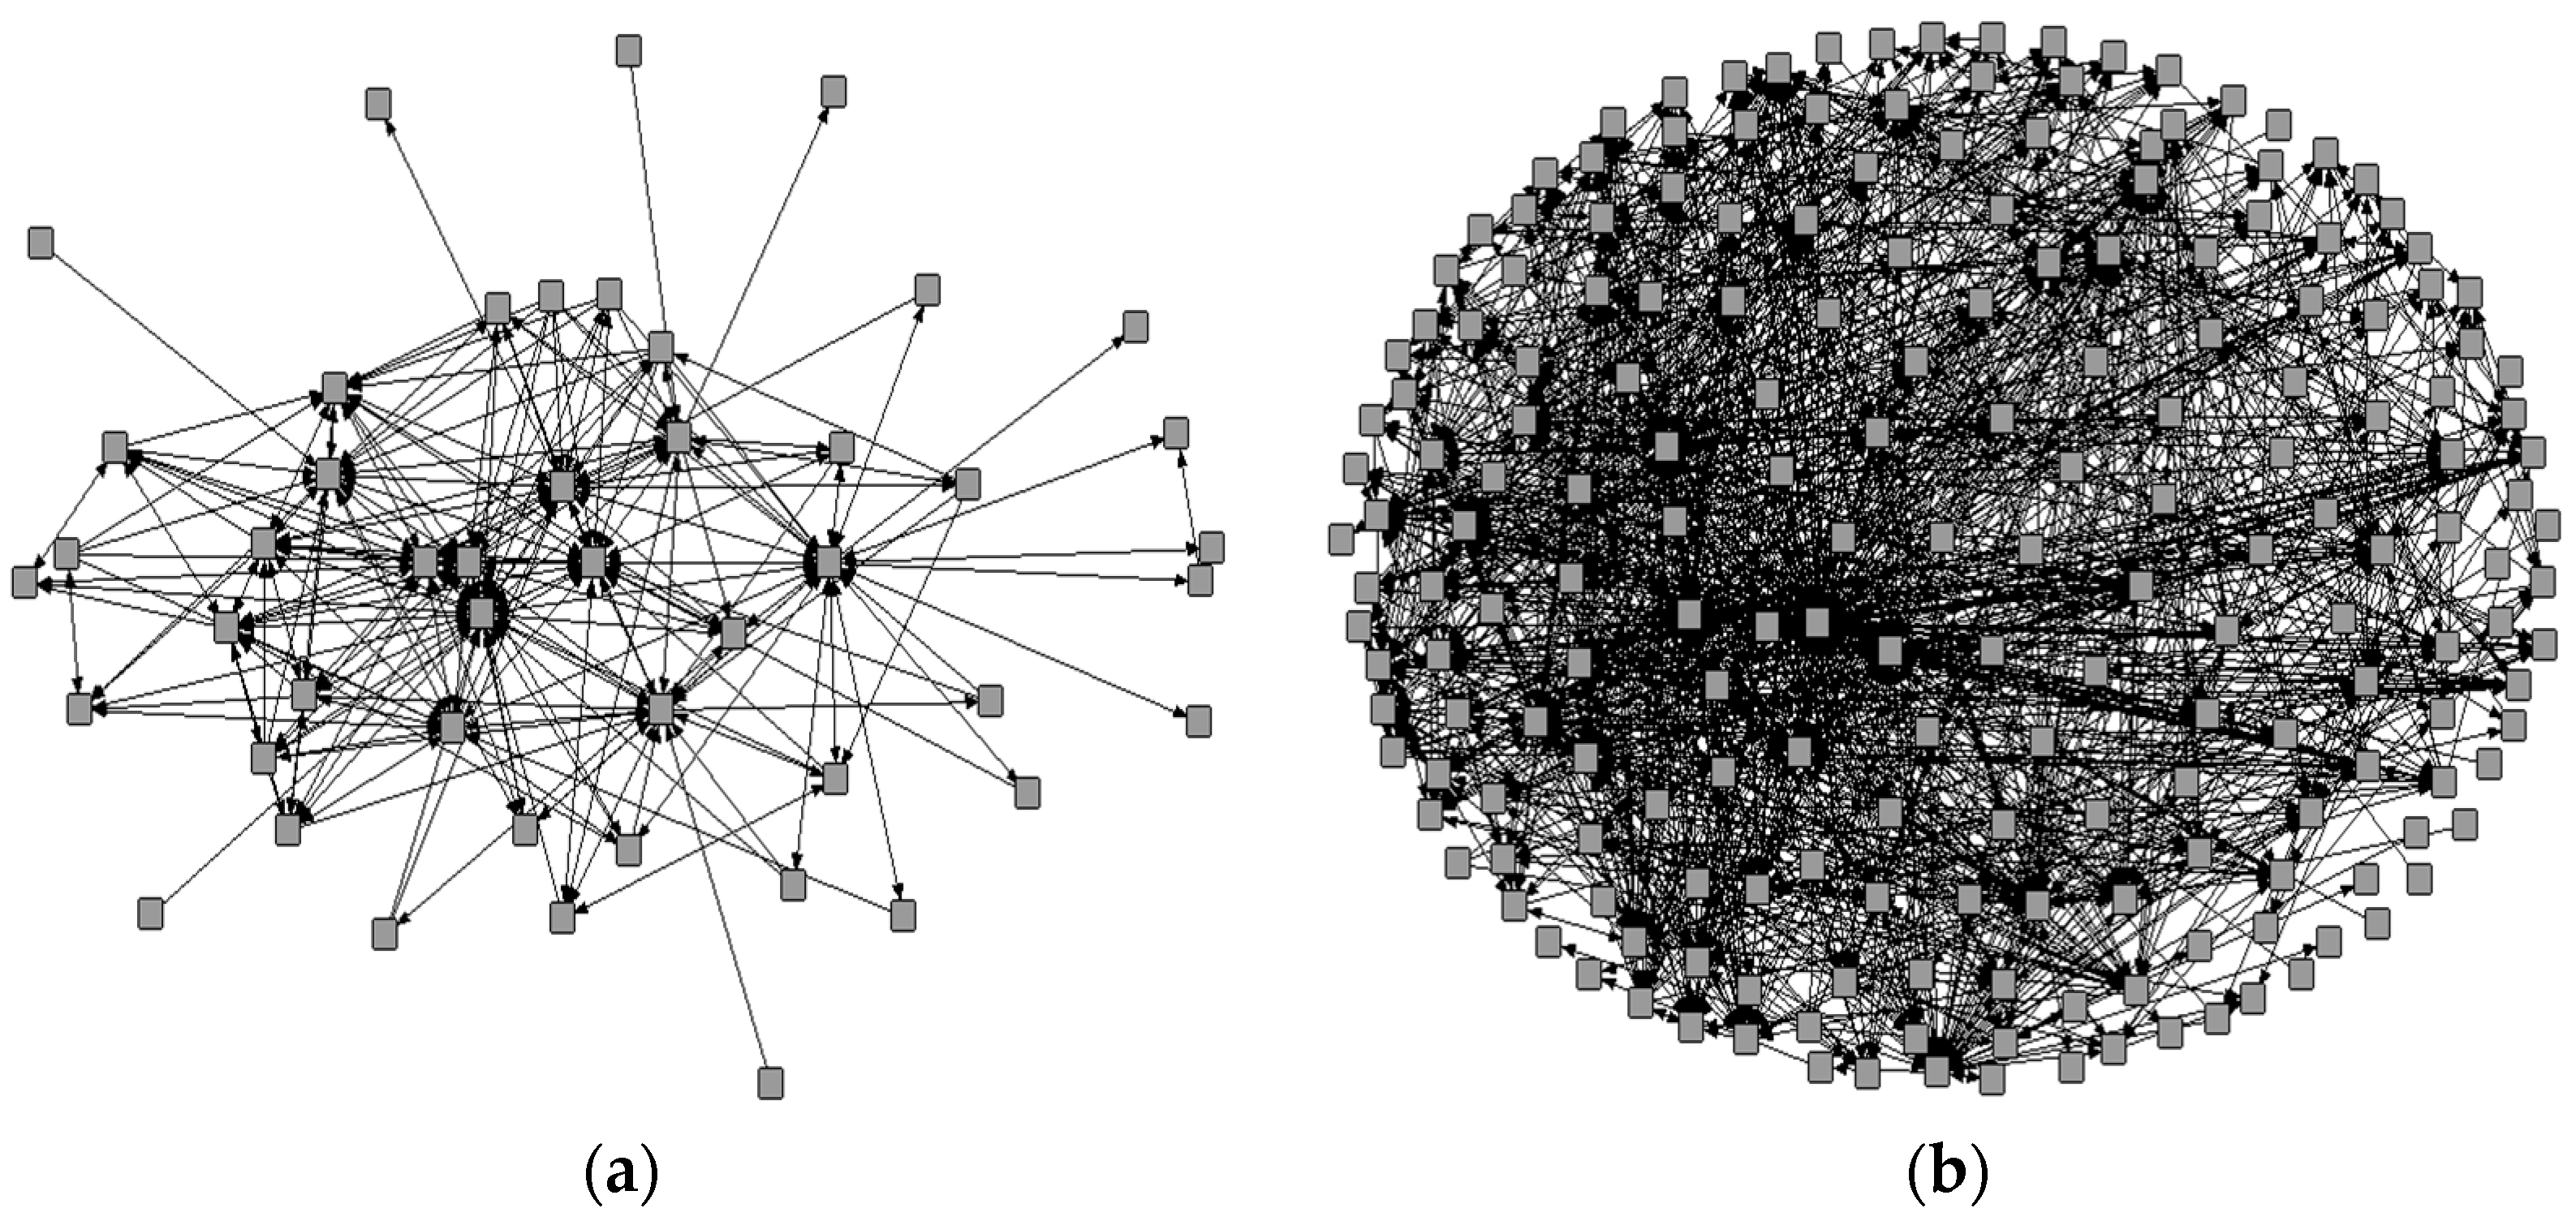
This study used truck trip data extracted from the Freight Vehicles Trip Survey of Yunnan Province to explore freight transportation. From the perspective of spatial interactions, two subnetworks, namely, a prefecture-level city-scale network and a county-level city-scale network, were built from the data using graph theory; these networks were conducted to delineate the freight activities more realistically and comprehensively. Considering the influence of the cross-border effect on freight transportation, the boundary issue that generally occurs during network formation was taken into account in the process of building the freight networks. On this basis, network analysis indices based on complex network theory were applied to examine the topological structure and complexity of the freight transportation networks. Furthermore, the community detection method was introduced to reveal the freight network’s clustering characteristics. By doing so, information on the topological and community structure of Yunnan’s freight network and the spatial interactions both between cities and within cities was obtained.
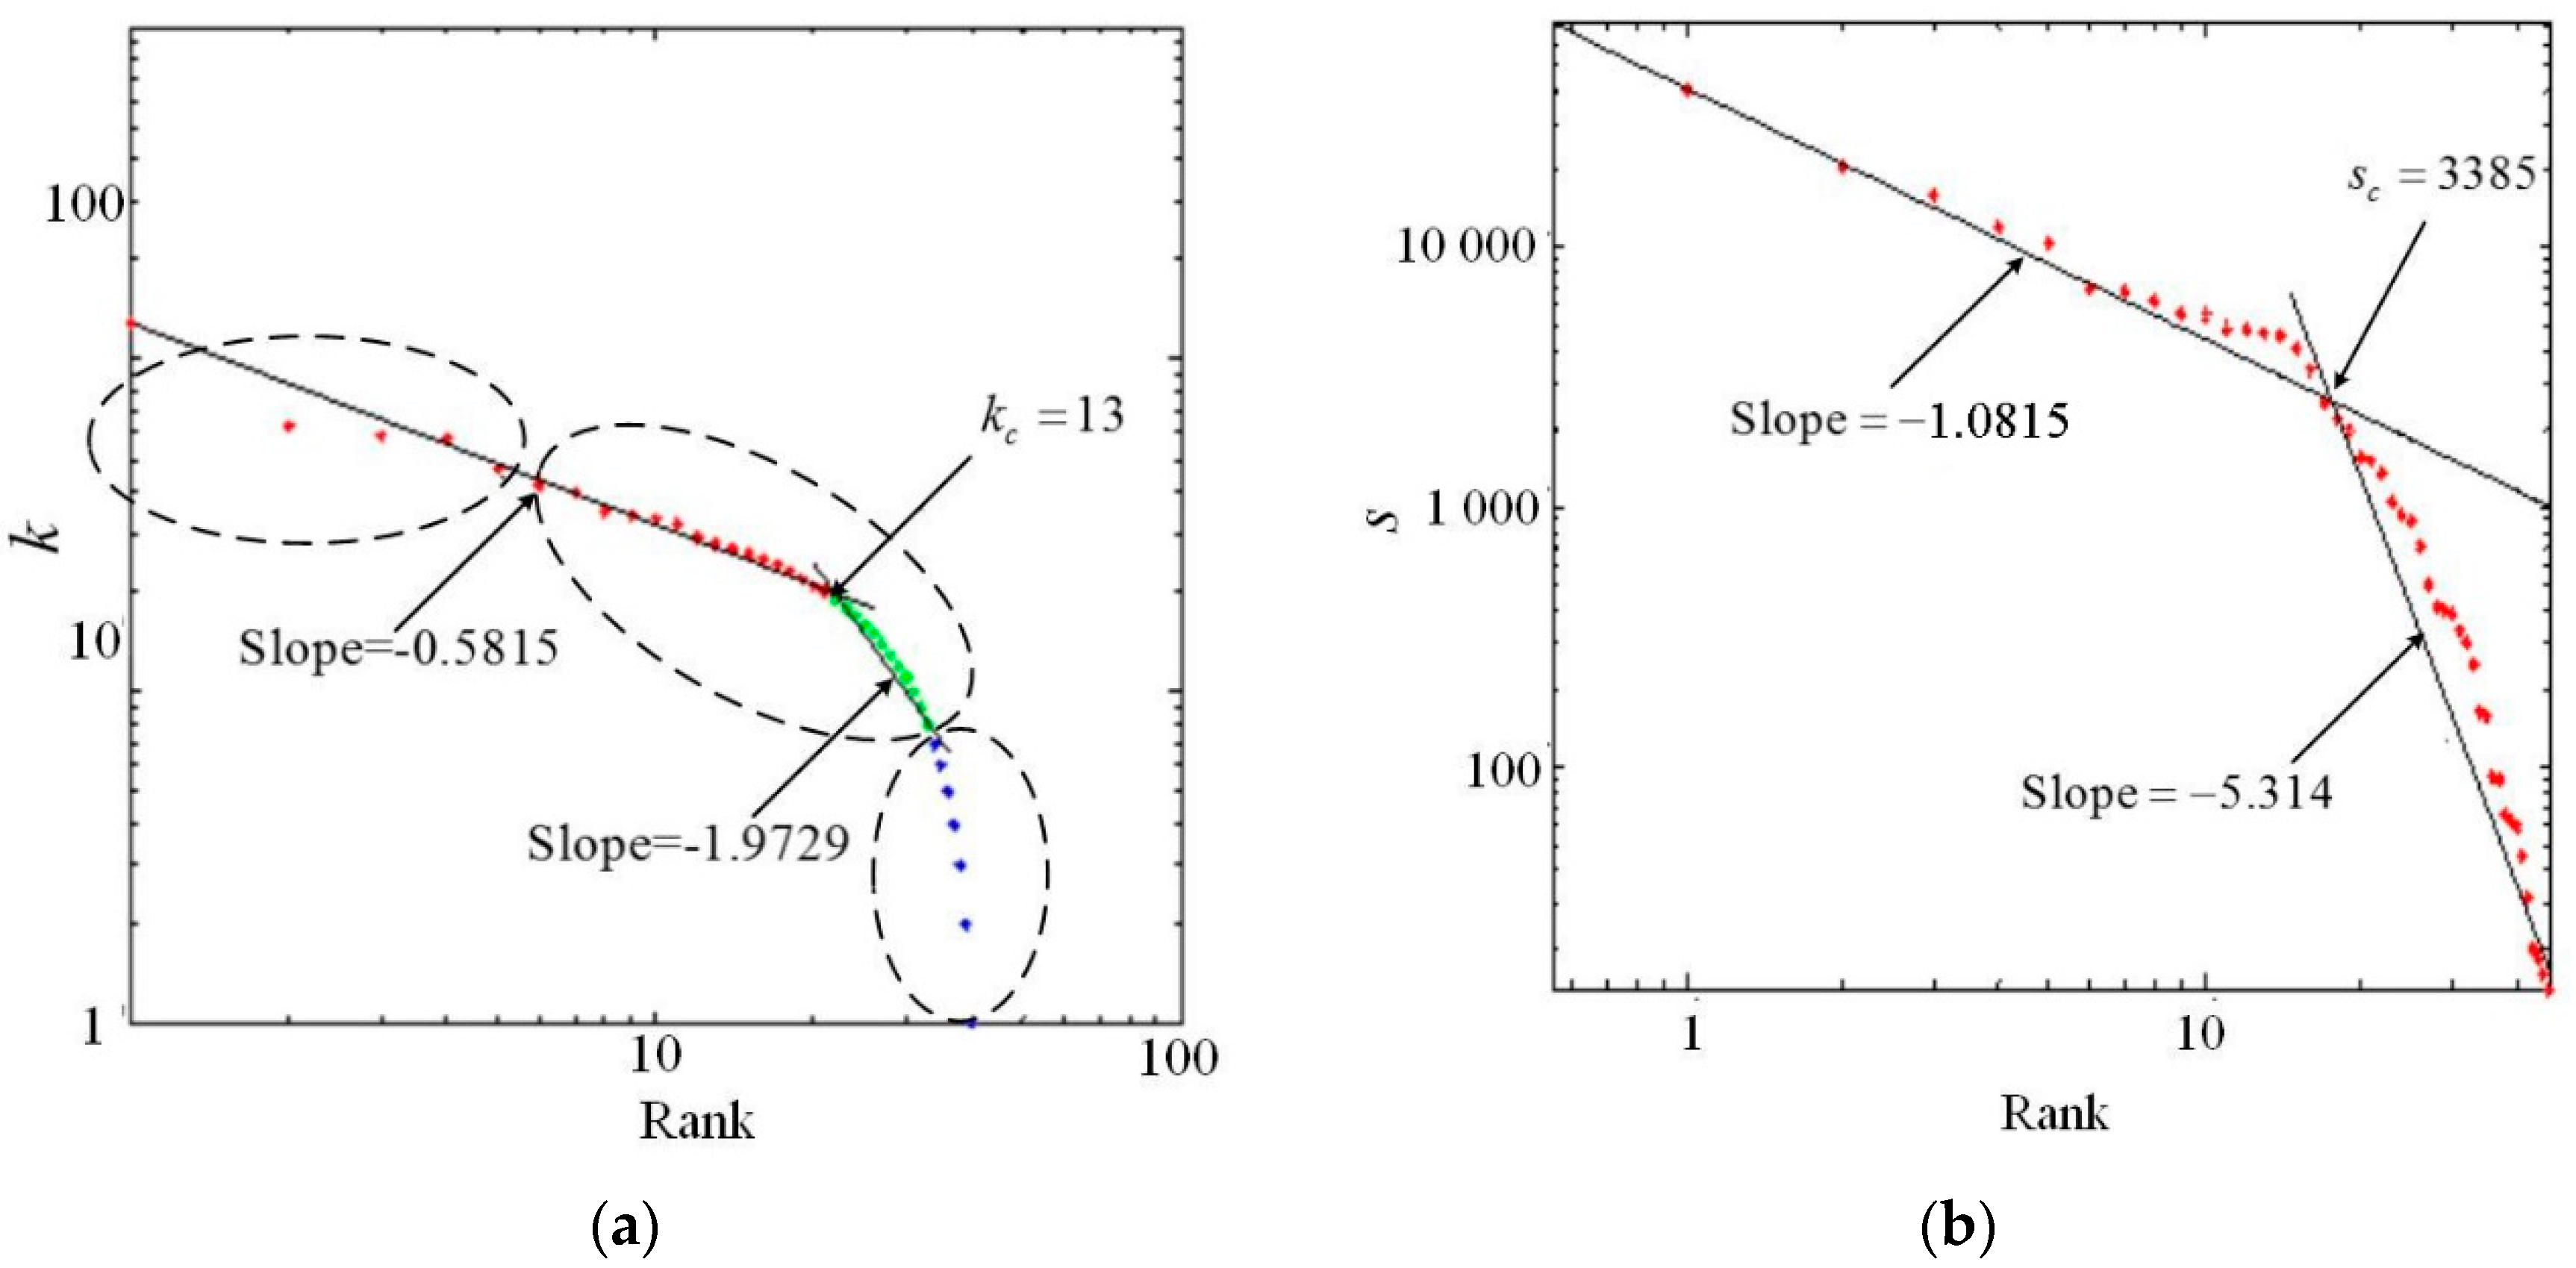
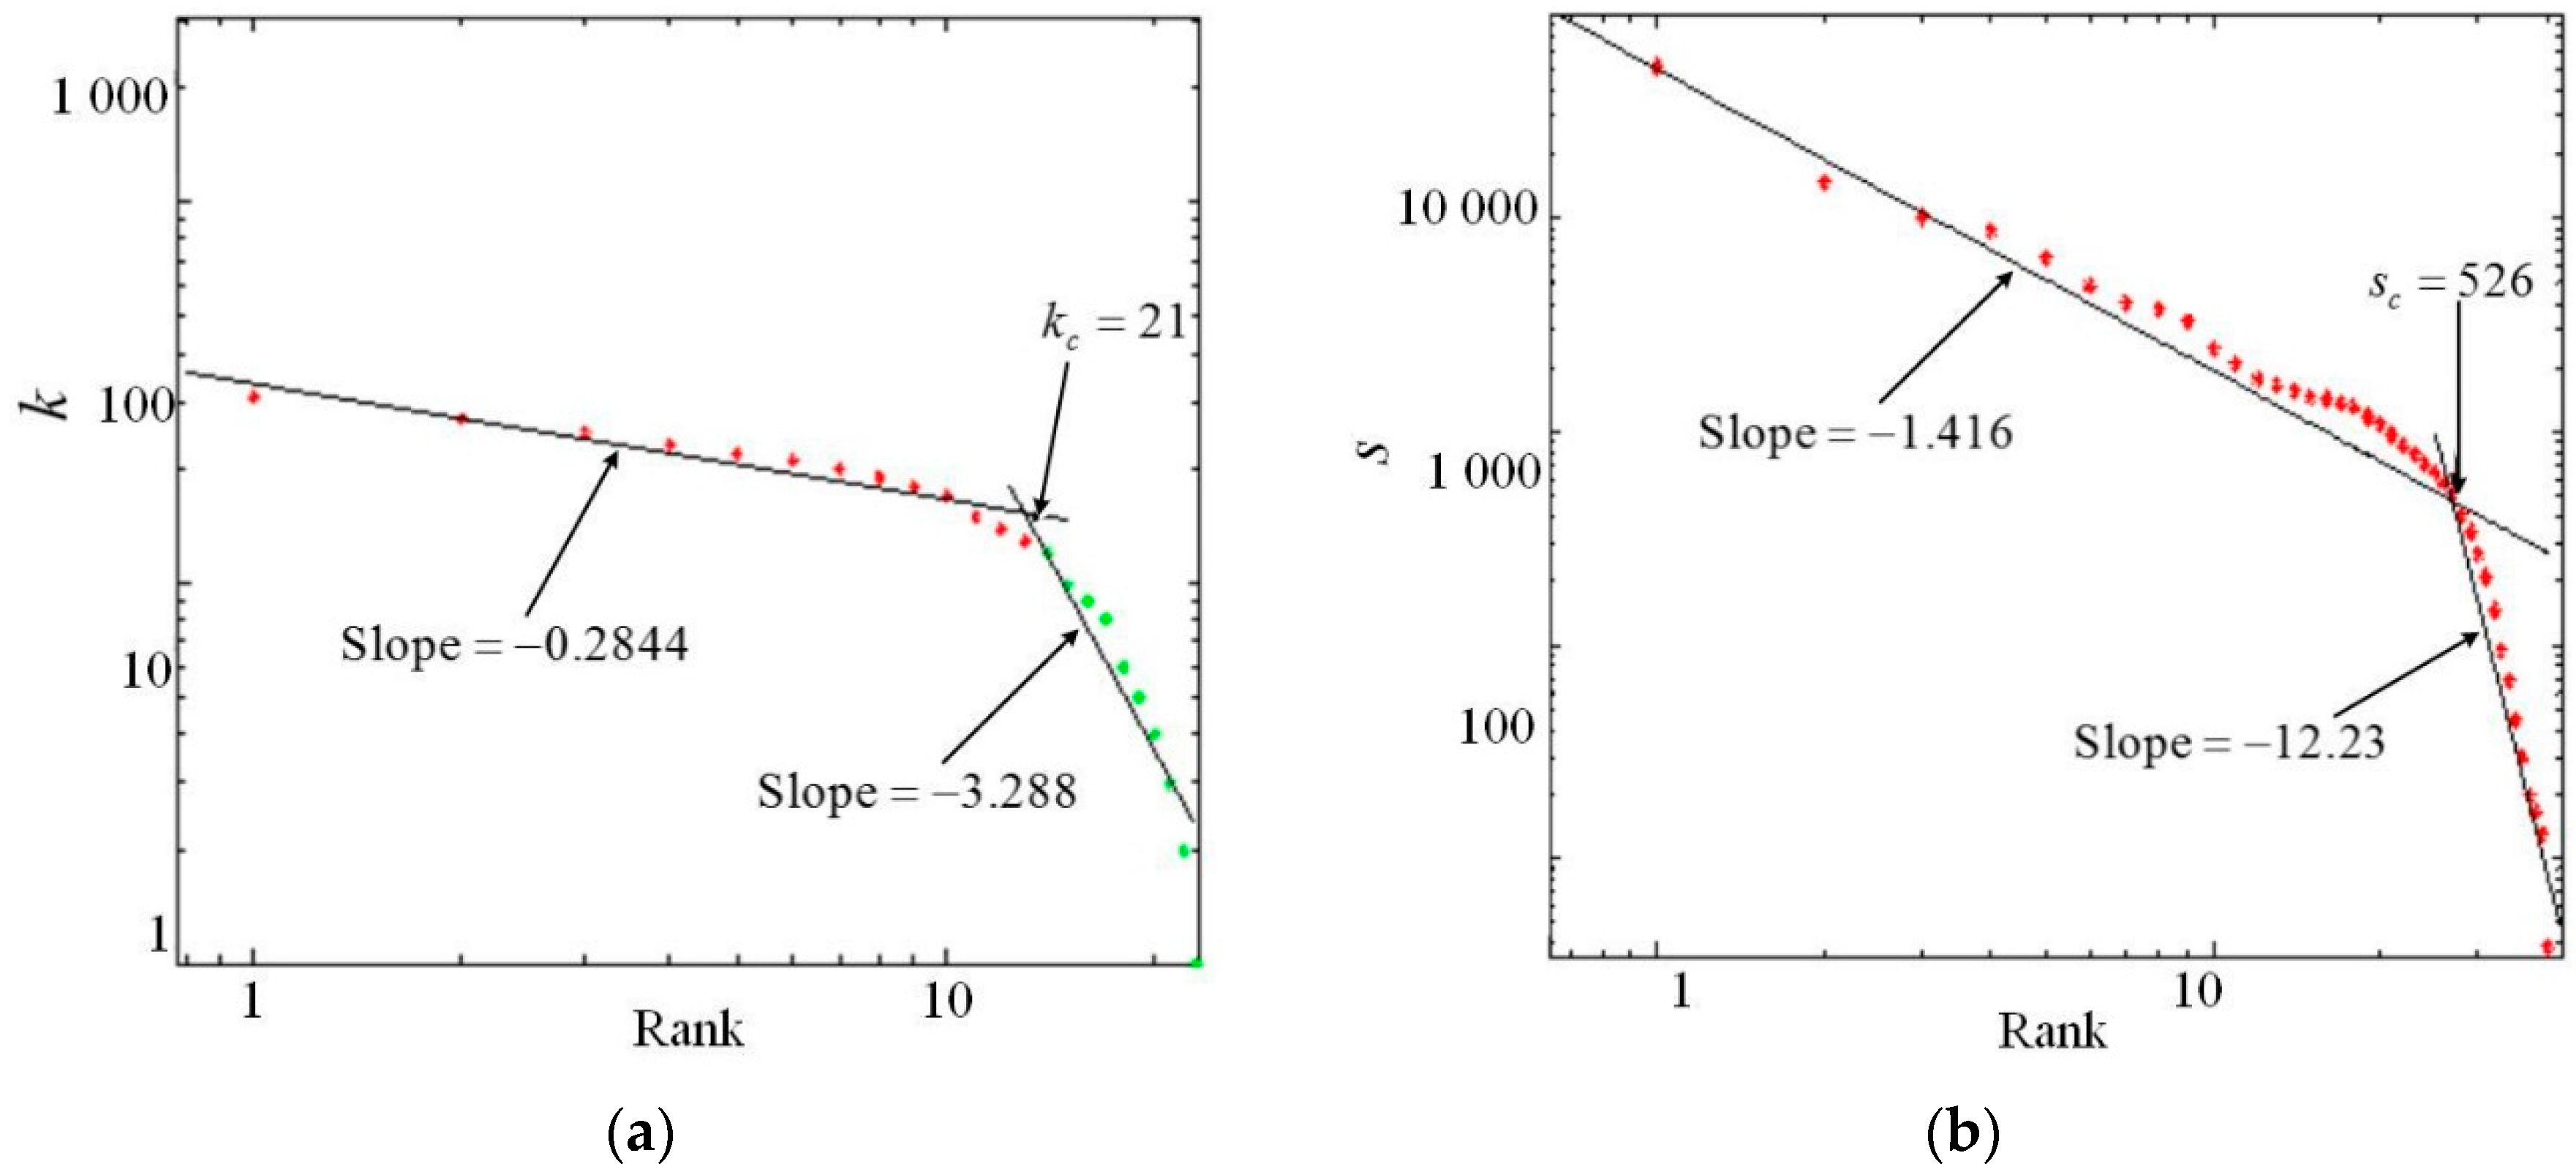
We find that the prefecture-level city-scale network has scale-free properties only at the local level because it follows an exponential degree distribution and a power law strength distribution. This finding suggests that the freight network at the prefecture-level city-scale is in a transition phase from simple and random to a complex structure, and the overall large-scale network structure has yet to be formed. However, the degree distribution and strength distribution of the county-level city-scale network both fit the power law function, indicating that it has scale-free properties. Meanwhile, the prefecture-level city-scale network and the county-level city-scale network both have obvious small-world network characteristics, but the prefecture-level city-scale network has higher operating efficiency for goods movement. Additionally, the influence of the cross-border effect on the freight transportation network was verified by comparing the changes in small-world properties of the freight network of this study to those of the traditional network. Although some empirical studies have provided evidence that the influence of the cross-border effect has been observed, little attention has been paid to the methods used to build the networks. Therefore, our study will draw scholars’ attention to this issue, especially for studies on transportation and urban structure.
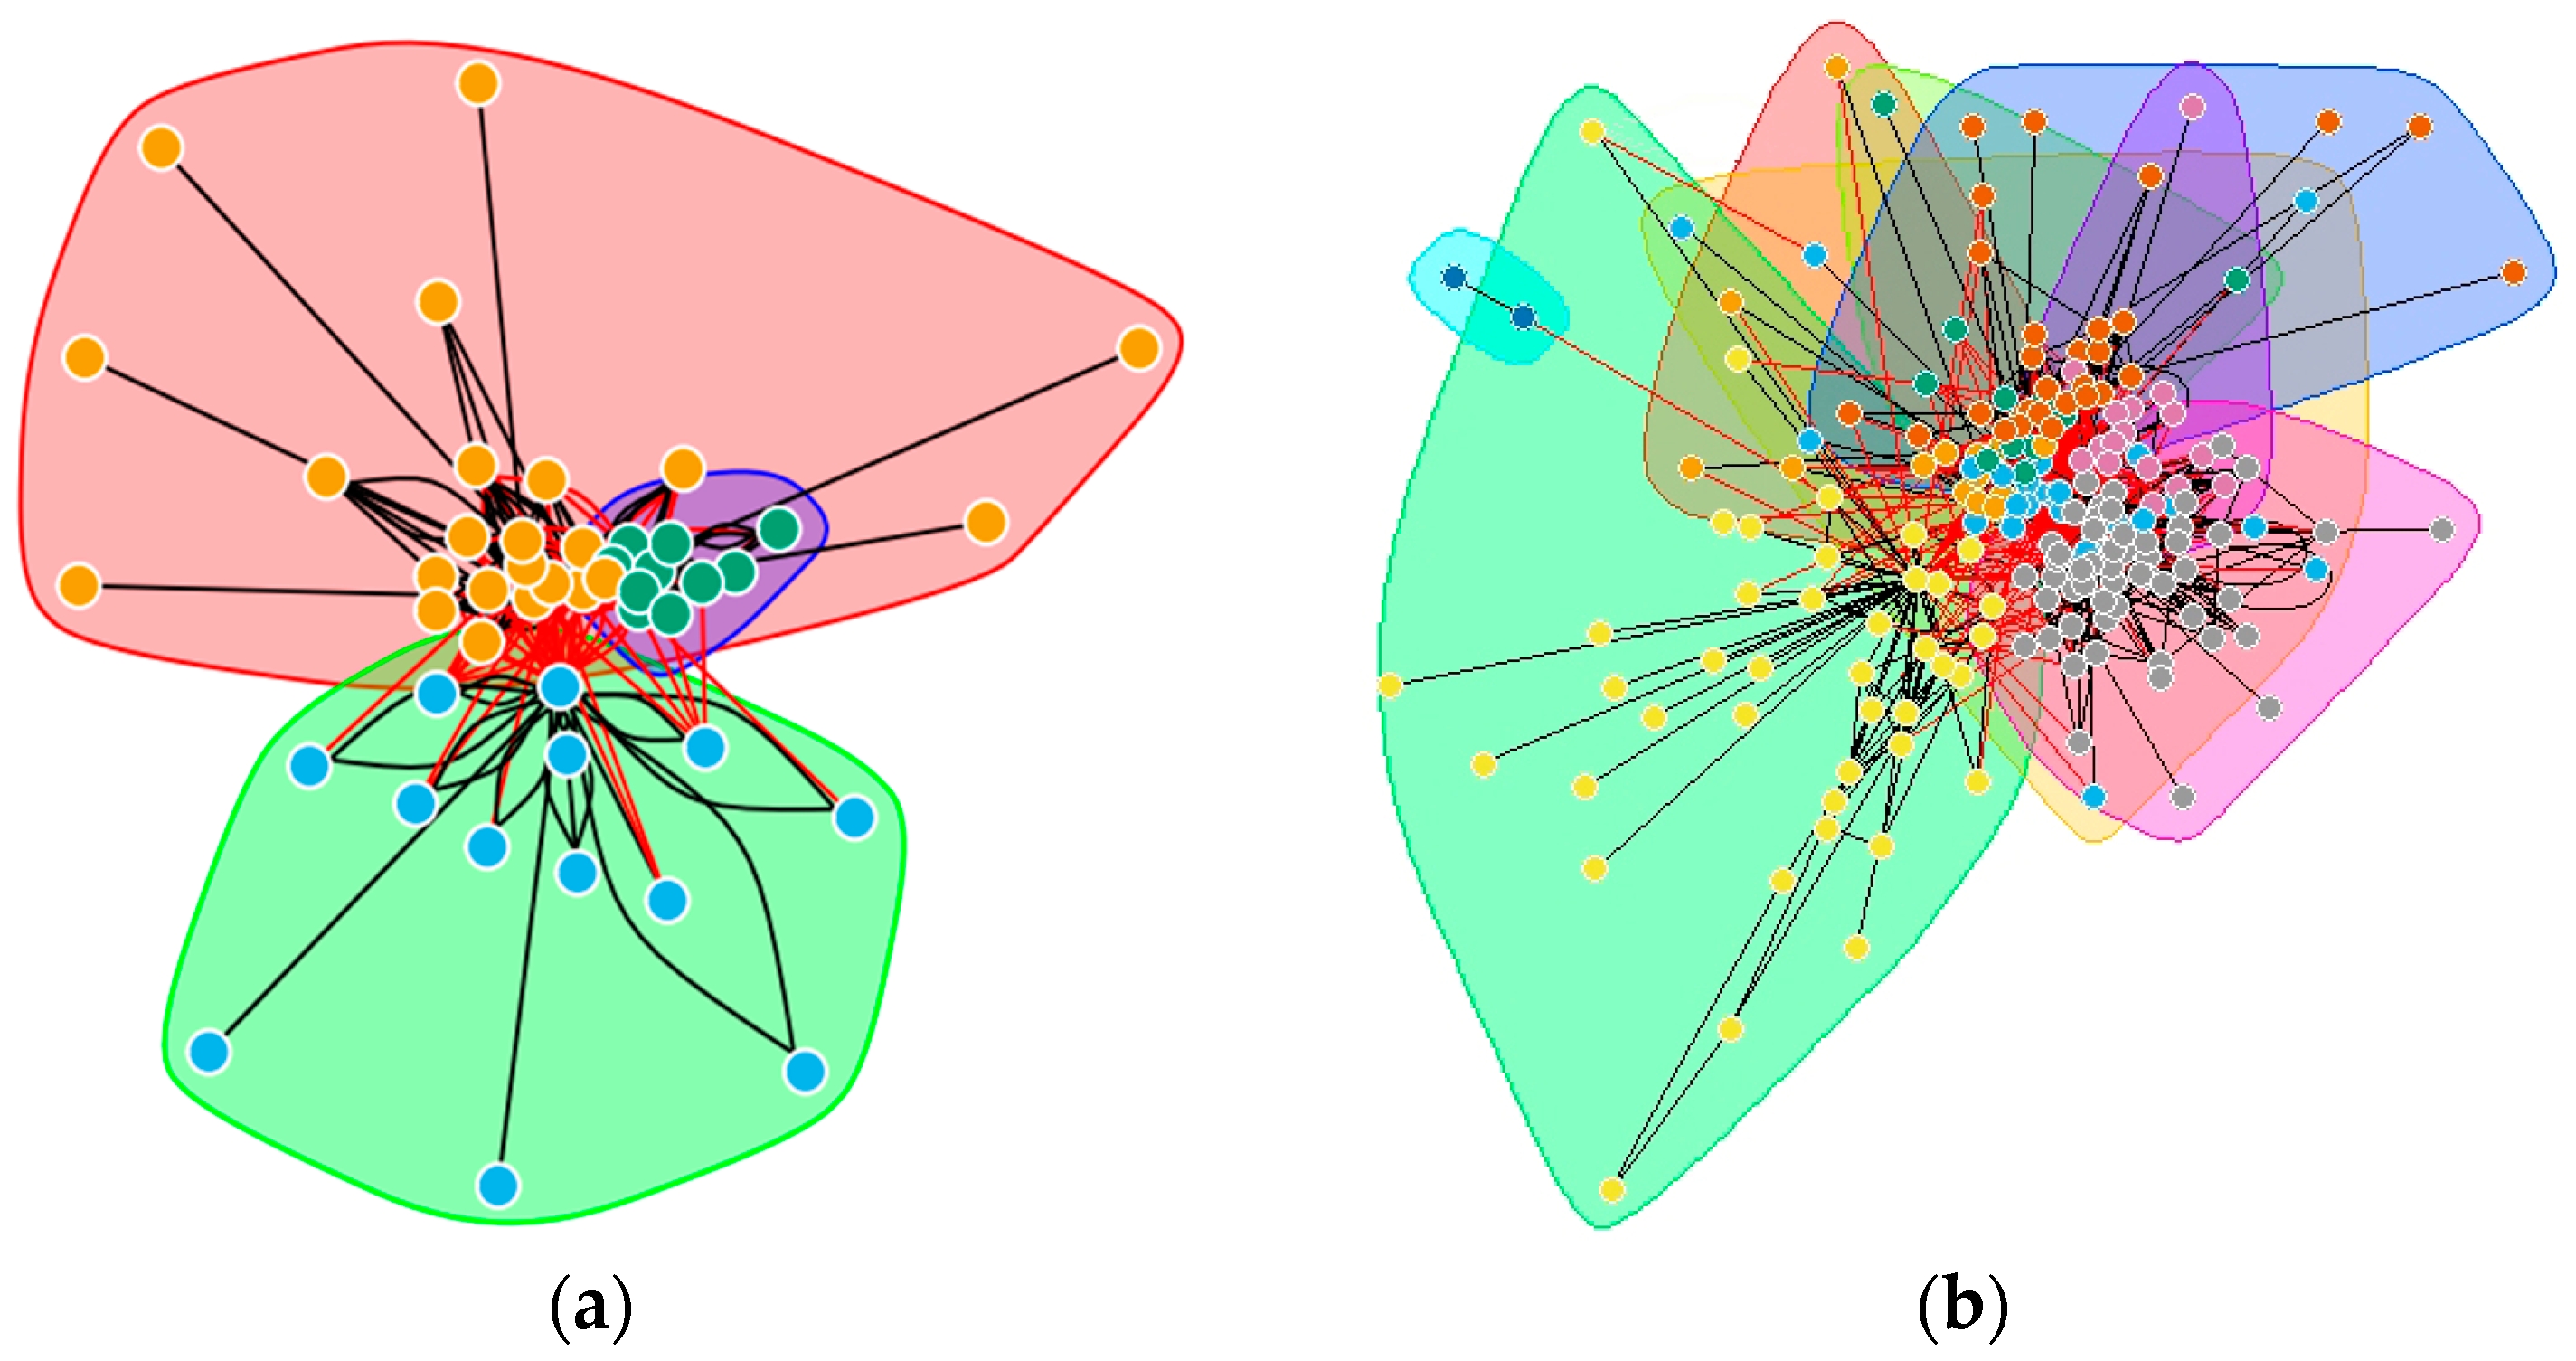
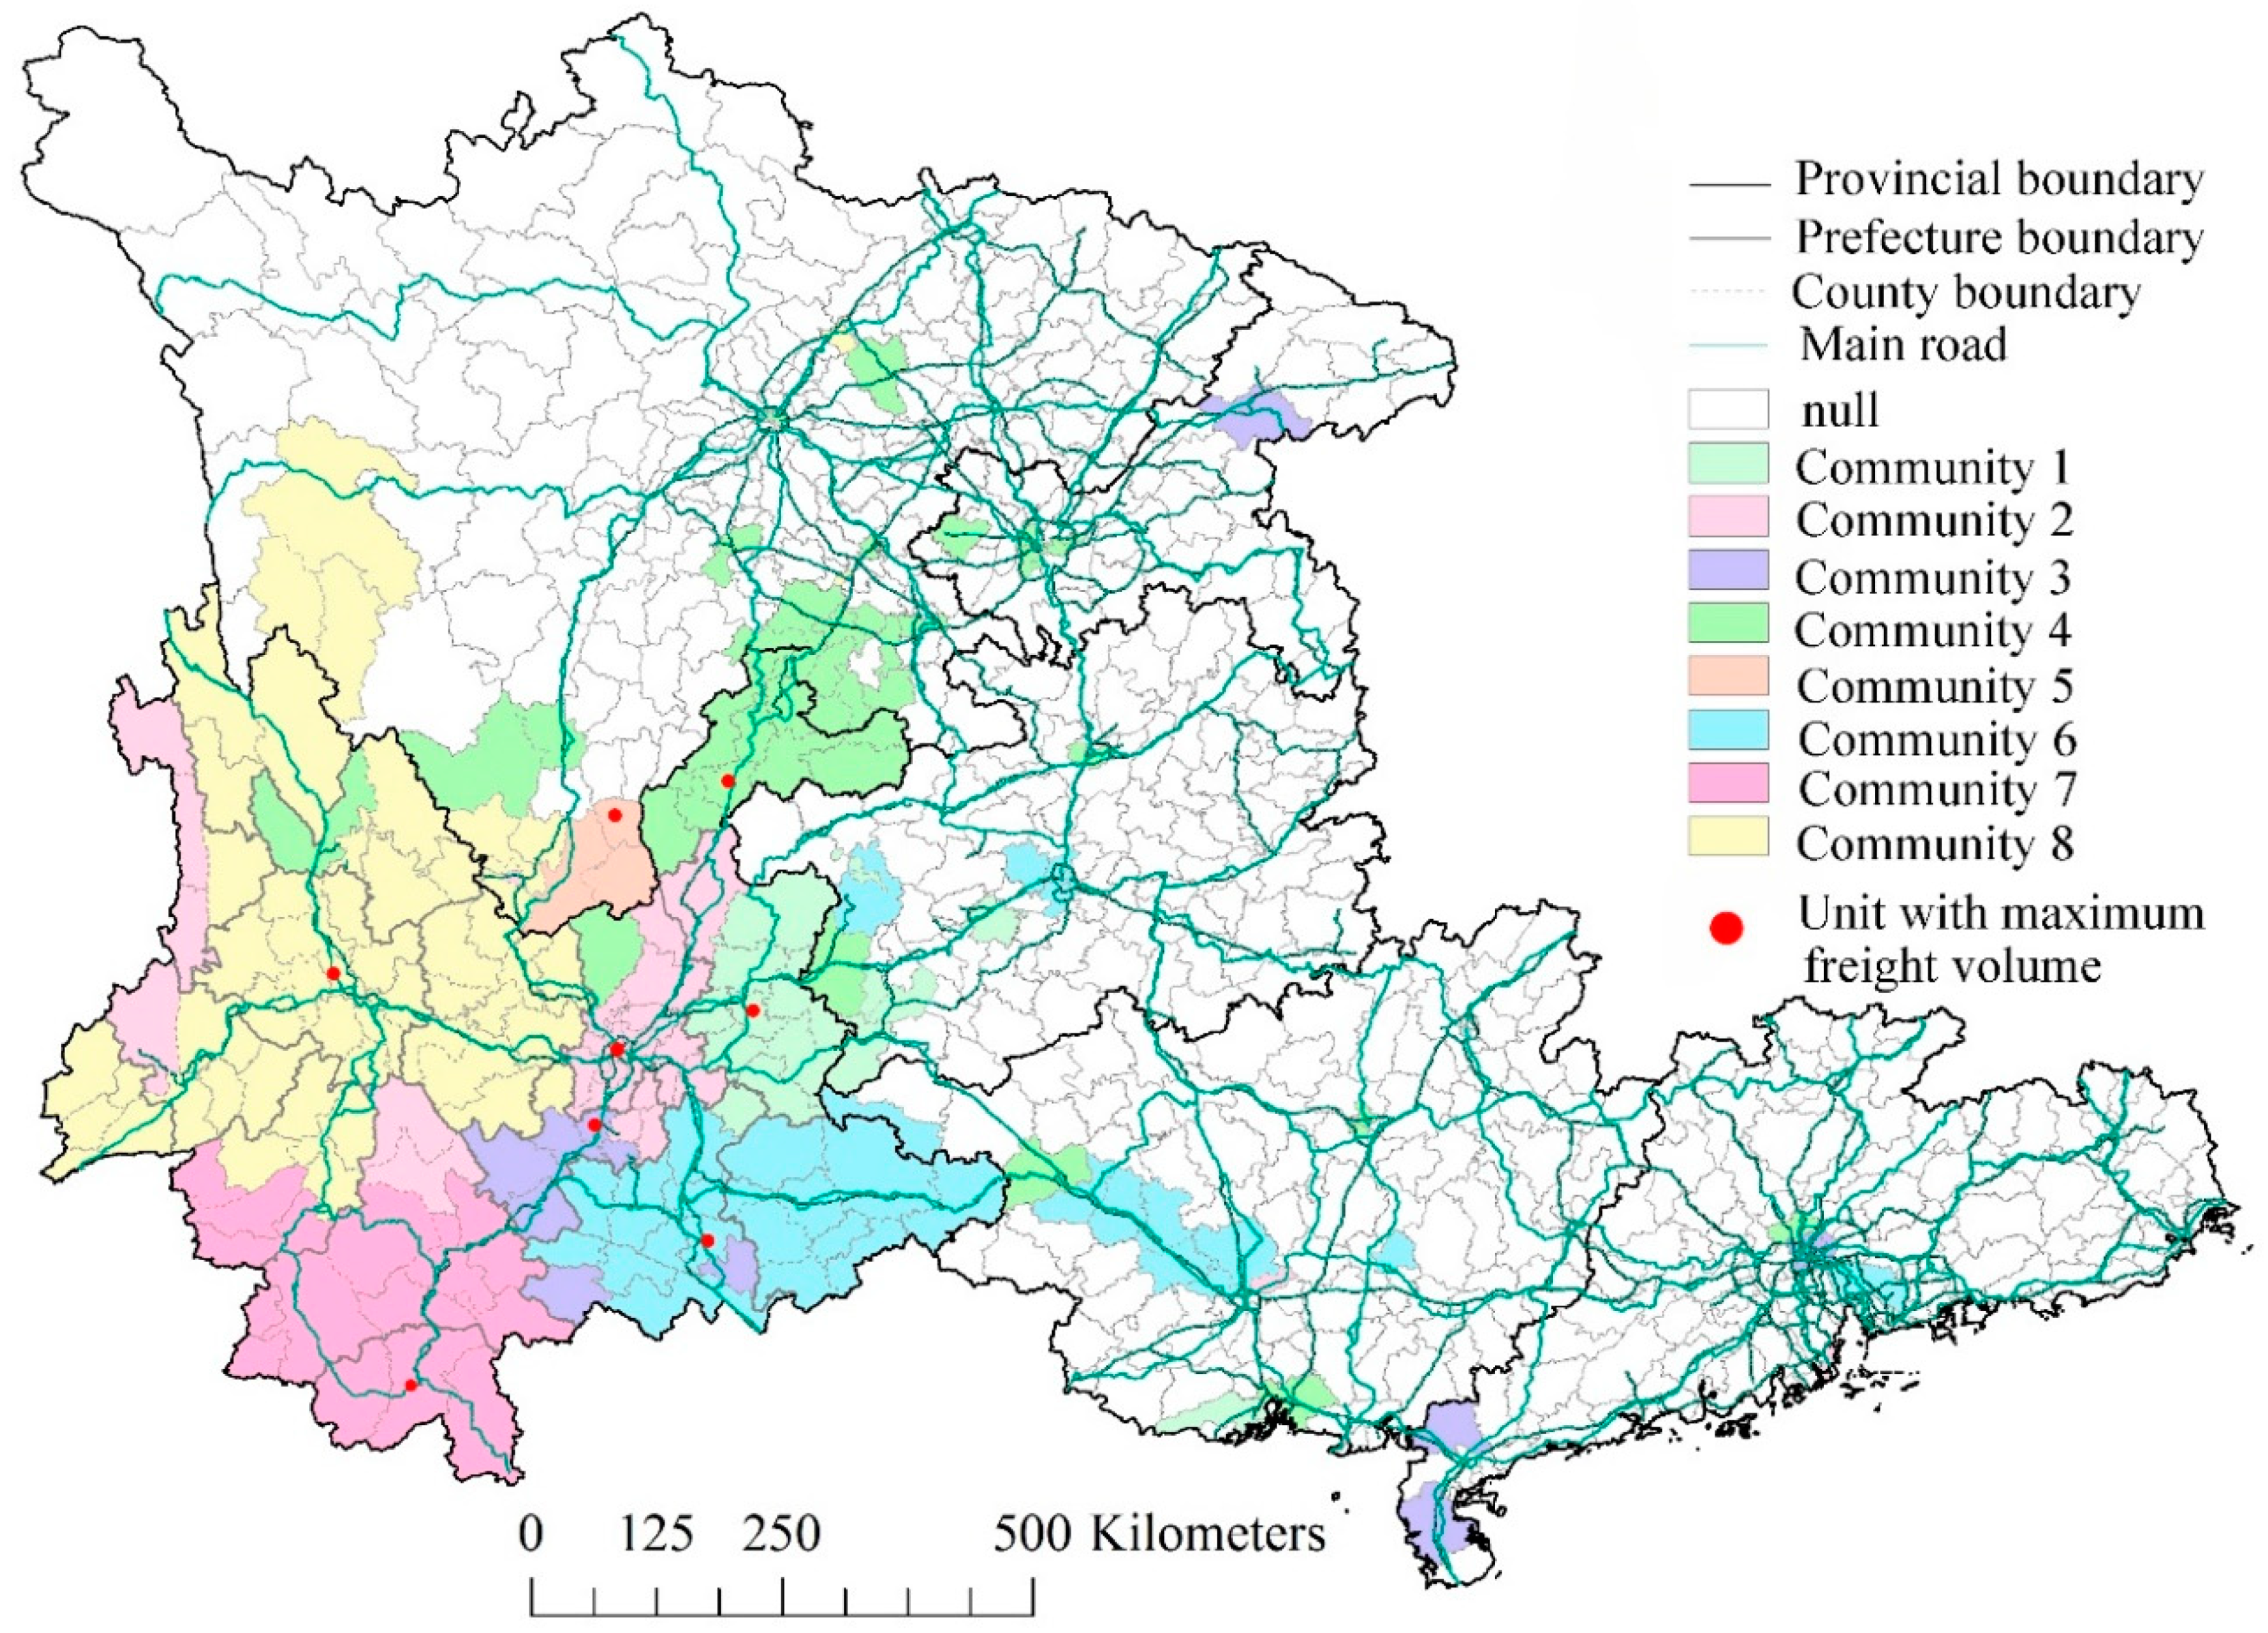
As terms of the community structure, we found that the freight network has distinctly clustering features only at the county-level city-scale. Most communities’ spatial interactions obeyed the distance decay law, and in this study, the border of each community differed from the prefecture-level city administrative boundary. Meanwhile, regardless of whether or not the freight demand was distributed within a community or between different communities, it was unbalanced. Large numbers of freight flows were generated by units that were district centers or had a relatively high level of economic development. These findings could provide some guidance for promoting the balanced and sustainable development of urban spatial structures from the perspective of transportation planning. For example, features of the community boundaries and spatial interactions not only provide insight into improving the mobility of goods, which thereby improves freight operational efficiency, but also help validate existing urban and freight transportation management policies.
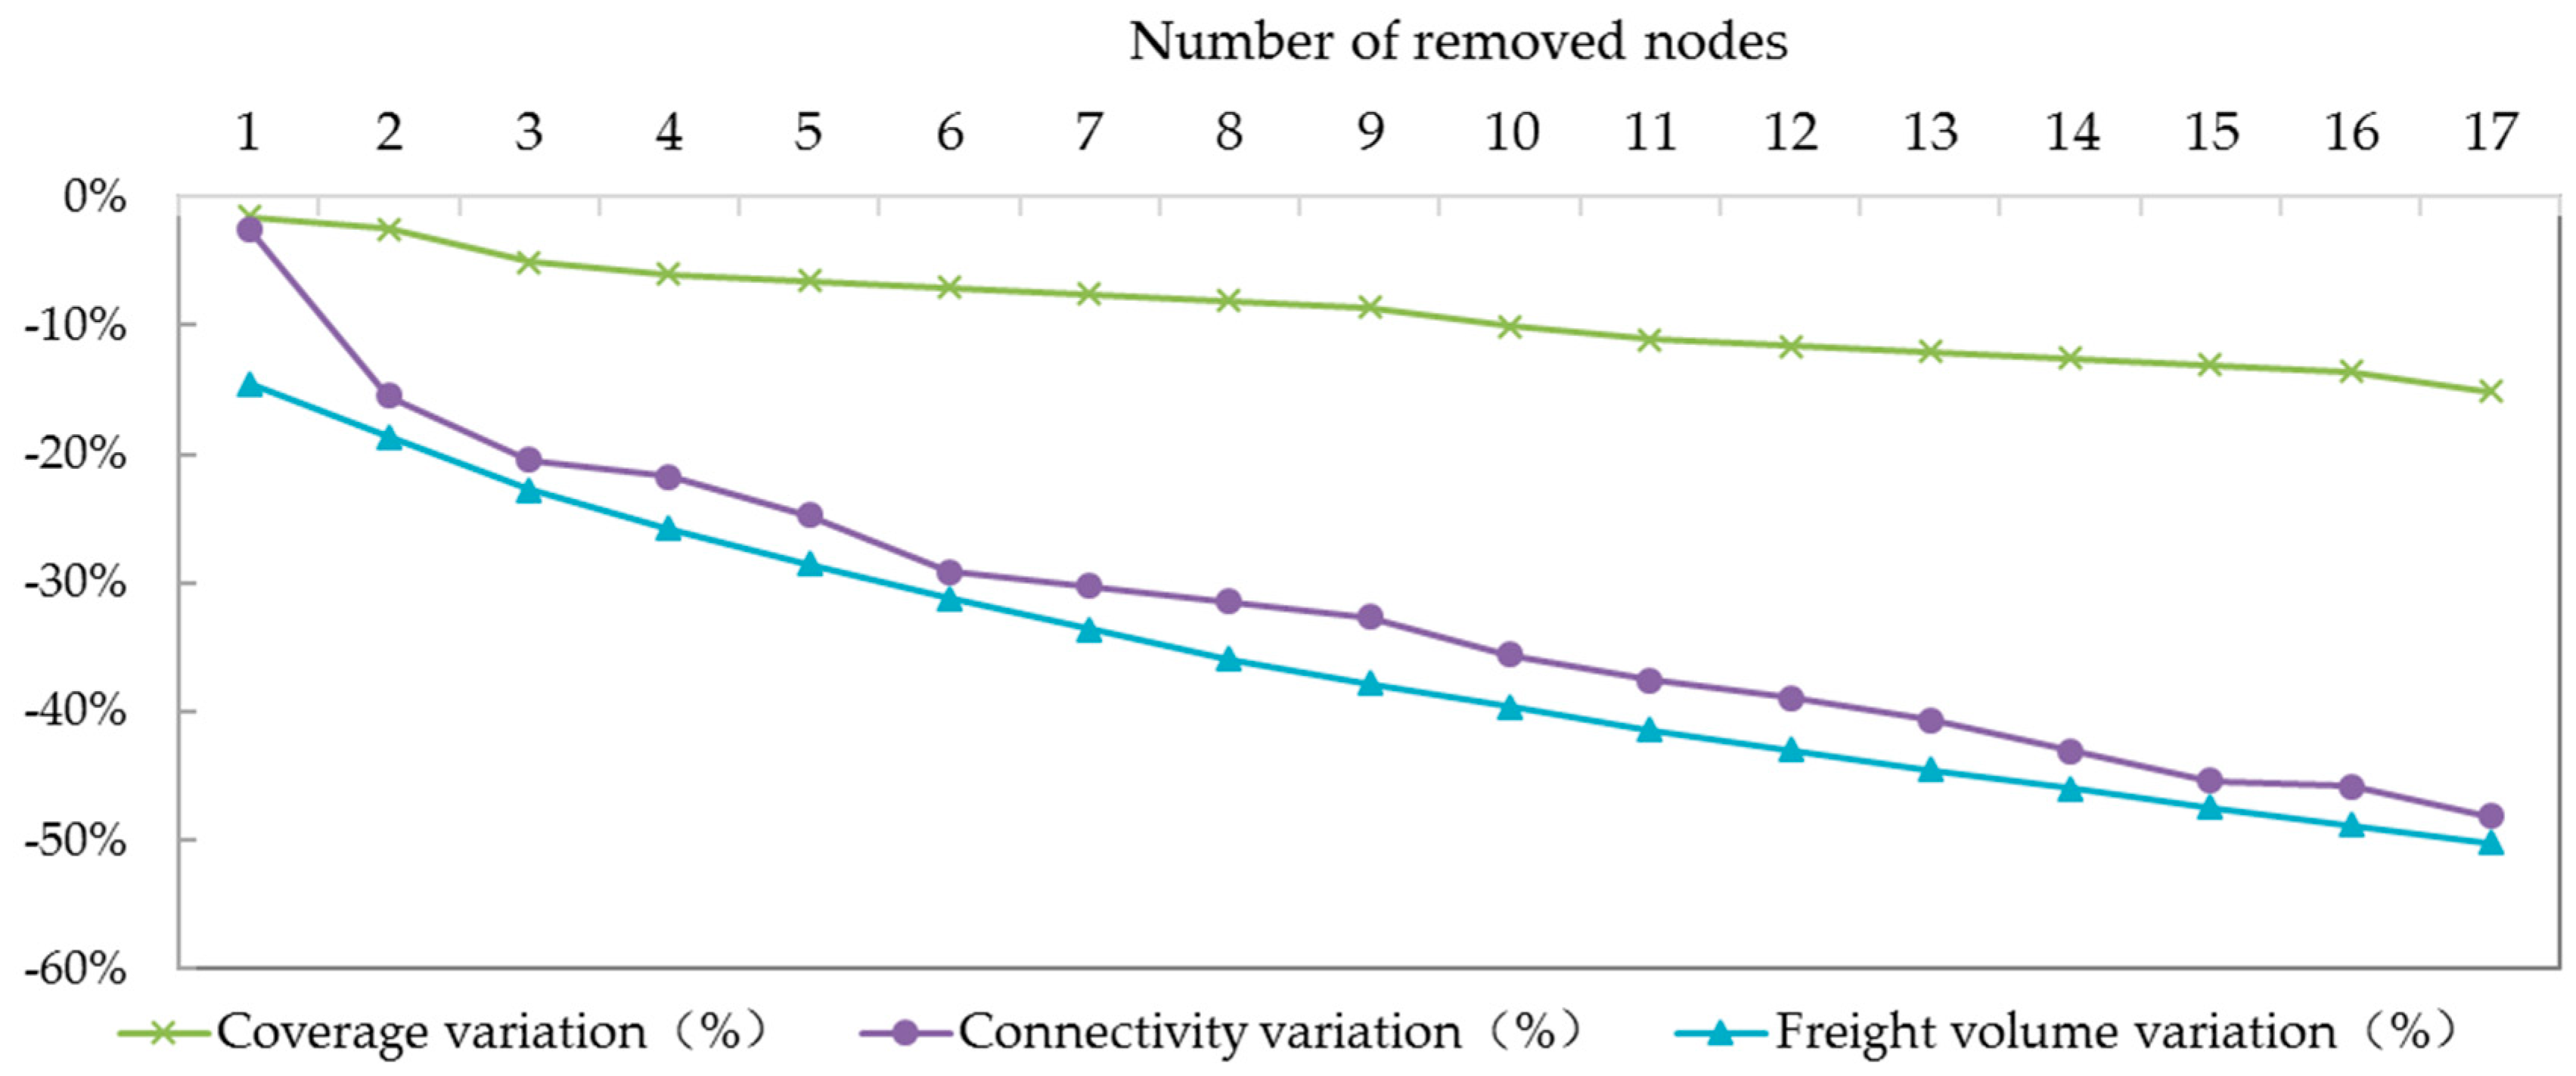
In addition, results of the sensitivity analysis illustrate that the key nodes (i.e., node with large freight volume) play a more important role in the intercity freight activities than the intracity freight activities. Regarding the transportation factor, the freight volume of G p is sensitive to transportation capacity and the freight volume of G c is sensitive to accessibility. These results can help provide a basis for regional freight transport planning. For example, in terms of Yunnan Province, the priority should be given to the optimization of intercity transportation network and the improvement of service capacity of related logistics facilities. With regard to intracity freight transport, there is an urgent need to improve the accessibility.

4.2. Implications

Based on our analytical results, this paper emphasizes the following implications.
First of all, regional freight transportation management must consider the impact of cross-border freight flows on freight network design. Our research observes that the influence of the cross-border freight flows on the freight network structure is unignored. From the space perspective, the freight network consists of nodes (i.e., administrative units) and spatial linkages (i.e., the spatial interactions), and its structure determines the strategic development direction of urban and regional freight transportation and logistics. Under the background of economic globalization and regional economic integration, the freight activities will more and more complex. Focusing on the cross-border freight flows in the guidance of freight transportation and urban space development is necessary, which will help to making a more effective and efficient planning or management policy, enabling the sustainability for freight transportation and urban development.
Secondly, for freight transport planning aligning with environmental objectives, the multidimensional perspective analytical approach of freight network is necessary. Many studies have proved that the improvement of transport efficiency is the benefit of the energy conservation and carbon emission mitigation [5,35]; however, what should be the priority and how to improve transport efficiency lack of effective approach and hamper by large regional disparities [60]. In our research, we characterize freight transportation from multidimensional perspectives and identify the most influencing factors by sensitivity analysis, which is the basis for freight transport planning. For example, the results of sensitivity analysis show that Yunnan’s freight transportation depends highly on the minority key nodes. The priority is to improve the transport efficiency of these nodes in the premise of economic sustainability. By doing so, the freight transport emission will achieve reduction substantially more easily.
Finally, it is essential for China to consider the proper spatial layout of infrastructure and the related facilities. In recent years, growing flows of freight have been an important component of contemporary changes in economic systems at national, regional, and local scales, which contribute to national economic growth. In order to adapt to the increasingly freight flows, the government blindly planed a large number of logistics facilities. On the one hand, this has intensified the increasingly prominent contradiction of urban land use, and, on the other hand, it caused the waste of logistics resources. Recent surveys and studies have documented that the increasingly emissions are nature caused by the increased mileage and the poor transportation infrastructure and freight facility [35]. In our study, we find that the different influencing factor in terms of transportation dimension determines the change of freight volume in different spatial scales. Moreover, several studies have examined that the transport infrastructure both has positive and negative effects on local freight transportation development. Therefore, there is an urgent need for the proper spatial layout of infrastructure and the related facilities so that they can offer quality service for freight transportation while ensuring a sustainable environment.

4.3. Research Limitations and Futuer Concerns

In the future, due to the acceleration of Chinese urbanization, the improvement in comprehensive transportation systems and growing transportation demand, the complexity of the freight network will also increase. Our research can provide some ideas for the precise description and exploration of transportation networks in such a context. However, it should be noted that although it is meaningful to analyze the characteristics and model by taking the transportation network of Yunnan Province as an example, the significance and value of the application still need more empirical support because of the dynamic relationship between transportation and urban development, as well as the evolution characteristics of the boundary and morphology of the freight network. Future research will focus on the dynamic evolution of freight transportation and will consider additional dimensions of the influence mechanism of urban structure.
In addition, some limitations of the freight vehicle trip data representativeness should be noted. First, freight vehicle trip data are only able to represent a part of freight activities occurred by Yunnan province. Some data, such as trip occurred by extraprovincial freight vehicle but traveled in Yunnan, is hardly obtained. Second, the freight vehicle trip data is only a sample data of 10 days, the freight activity information provided by them are only able to show freight transportation characteristics in a specific period of time. Recently, with the advancement of the information technology, truck GPS data are becoming more accessible. Truck GPS data is a more precis, objective, plentiful, and cost-effective data, which can provide an opportunity for depicting freight travels more effective; however, how to make full and reasonable use of this data and to reveal the freight transportation characteristics is still in the exploration stage. Future studies will consider combining freight vehicle trips with truck GPS data to characterize freight transportation characteristics and explore the spatial differentiation characteristics of freight characteristics by subdividing the data based on different time stages.

Author Contributions

L.Z., L.L., and X.J. contributed to the conceptual framework of the methodology; J.H. and L.Z. analyzed the data; J.H. created the figures and tables; and L.Z. wrote the paper.

Funding

This research was funded by National Natural Science Foundation of China, grant numbers 61873216 and 71563023.

Acknowledgments

We would like to express our gratitude to the Department for Road Transportation Administration of Yunnan Province for the support of data materials used for this research.

Conflicts of Interest

The authors declare no conflict of interest.

References

  1. Baydar, A.M.; Süral, H. Freight villages: A literature review from the sustainability and societal equity perspective. J. Clean. Prod. 2017, 167, 1208–1221. [Google Scholar] [CrossRef]
  2. Banister, D. Unsustainable Transport: City Transport in the New Century; Routledge: London, UK, 2005. [Google Scholar]
  3. Yang, J.; Guo, A.D.; Li, X.M.; Huang, T. Study of the impact of a high-speed railway opening on China’s accessibility pattern and spatial equality. Sustainability 2018, 10, 2943. [Google Scholar] [CrossRef]
  4. Yang, J.; Bao, Y.J.; Zhang, Y.Q.; Li, X.M.; Ge, Q.S. Impact of accessibility on housing prices in Dalian city of China based on a geographically weighted regression model. Chin. Geogra. Sci. 2018, 28, 505–515. [Google Scholar] [CrossRef]
  5. Luo, X.; Dong, L.; Dou, Y.; Liang, H.; Ren, J.; Fang, K. Regional disparity analysis of Chinese freight transport CO2 emissions from 1990 to 2007: Driving forces and policy challenges. J. Transp. Geogr. 2016, 56, 1–14. [Google Scholar] [CrossRef]
  6. Li, Y.; Bao, L.; Li, W.; Deng, H. Inventory and policy reduction potential of greenhouse gas and pollutant emissions of road transportation industry in China. Sustainability 2016, 8, 1218. [Google Scholar] [CrossRef]
  7. Dente, S.M.R.; Tavasszy, L.A. Impacts of trade related sustainability strategies on freight transportation: Modelling framework and application for France. Transp. Res. Part D 2018, 58, 308–319. [Google Scholar] [CrossRef]
  8. Mostert, M.; Limbourg, S. External costs as competitiveness factors for freight transport—A state of the art. Transp. Rev. 2016, 36, 692–712. [Google Scholar] [CrossRef]
  9. European Commission. White Paper on Transport: Roadmap to a Single European Transport Area: Towards a Competitive and Resource-Efficient Transport System; Directorate-General for Mobility and Transport, Publications Office of the European Union: Luxembourg, 2011. [Google Scholar]
  10. Shashi, R.C.; Piera, C.; Amir, S. Sustainability orientation, supply chain integration, and SMEs performance: A causal analysis. Benchmark. Int. J. 2018, 25, 3679–3701. [Google Scholar]
  11. Croom, S.; Vidal, N.; Spetic, W.; Marshall, D.; McCarthy, L. Impact of social sustainability orientation and supply chain practices on operational performance. Int. J. Oper. Prod. Man. 2018, 38, 2344–2366. [Google Scholar] [CrossRef]
  12. Mostert, M.; Caris, A.; Limbourg, S. Intermodal network design: A three-mode bi-objective model applied to the case of Belgium. Flex. Serv. Manuf. J. 2017, 3, 397–420. [Google Scholar] [CrossRef]
  13. Gingerich, K.; Maoh, H.; Anderson, W. Classifying the purpose of stopped truck events: An application of entropy to GPS data. Transp. Res. Part C 2016, 64, 17–27. [Google Scholar] [CrossRef]
  14. Ma, X.L.; Wang, Y.; McCormack, E.; Wang, Y.H. Understanding freight trip-chaining behavior using a spatial data-mining approach with GPS data. Transp. Res. Rec. 2016, 2596, 44–54. [Google Scholar] [CrossRef]
  15. Kong, X.Q.; Eisele, W.L.; Zhang, Y.L.; Cline, D.B.H. Evaluating the impact of real-time mobility and travel time reliability information on truck drivers’ routing decisions. Transp. Res. Rec. 2018, 9, 164–172. [Google Scholar] [CrossRef]
  16. Fan, S.; Chan-Kang, C. Regional road development, rural and urban poverty: Evidence from China. Transp. Policy 2008, 15, 305–314. [Google Scholar] [CrossRef]
  17. Kumar, T.R. The impact of regional infrastructure investment in India. Reg. Stud. 2002, 36, 194–200. [Google Scholar] [CrossRef]
  18. Rodrigue, J.P.; Comtois, C.; Slack, B. The Geography of Transport Systems; Routledge: London, UK, 2013. [Google Scholar]
  19. Allen, J.; Browne, M.; Cherrett, T. Investigating relationships between road freight transport, facility location, logistics management and urban form. J. Transp. Geogr. 2012, 24, 45–57. [Google Scholar] [CrossRef] [Green Version]
  20. Yang, J.; Jin, S.H.; Xiao, X.M.; Jin, C.; Xia, J.C.; Li, X.M.; Wang, S.J. Local climate zone ventilation and urban land surface temperatures: Towards a performance-based and wind-sensitive planning proposal in megacities. Sustain. Cities Soc. 2019, 47, 101487. [Google Scholar] [CrossRef]
  21. Ni, L.; Wang, X.; Zhang, D. Impacts of information technology and urbanization on less-than-truckload freight flows in China: An analysis considering spatial effects. Transp. Res. Part A 2016, 92, 12–25. [Google Scholar] [CrossRef]
  22. Wang, J.E.; Mo, H.H.; Wang, F.H.; Jin, F.J. Exploring the network structure and nodal centrality of China’s air transport network: A complex network approach. J. Transp. Geogr. 2011, 19, 712–721. [Google Scholar] [CrossRef]
  23. Lao, X.; Zhang, X.; Shen, T. Comparing China’s city transportation and economic networks. Cities 2016, 53, 43–50. [Google Scholar] [CrossRef]
  24. Dai, L.; Derudder, B.; Liu, X. The evolving structure of the southeast Asian air transport network through the lens of complex networks, 1979–2012. J. Transp. Geogr. 2018, 68, 67–77. [Google Scholar] [CrossRef]
  25. Zhong, Y.; Lu, Y. Hierarchical structure and distribution pattern of Chinese urban system based on railway network. Geogr. Res. 2011, 30, 785–794. [Google Scholar]
  26. Wang, J.E.; Jing, Y. Comparison of spatial structure and organization mode of inter-city networks from the perspective of railway and air passenger flow. Acta Geogr. Sin. 2017, 72, 1508–1519. [Google Scholar]
  27. Chen, B.Y.; Lam, W.H.K.; Sumalee, A.; Li, Q.; Li, Z.C. Vulnerability analysis for large-scale and congested road networks with demand uncertainty. Transp. Res. Part A 2012, 46, 516. [Google Scholar] [CrossRef]
  28. Jenelius, E.; Petersen, T.; Mattsson, L.G. Importance and exposure in road network vulnerability analysis. Transp. Res. Part A 2006, 40, 537–560. [Google Scholar] [CrossRef]
  29. Liu, X.; Gong, L.; Gong, Y.; Liu, Y. Revealing travel patterns and city structure with taxi trip data. J. Transp. Geogr. 2015, 43, 78–90. [Google Scholar] [CrossRef] [Green Version]
  30. Joubert, J.W.; Axhausen, K.W. Complex network approach to understand commercial vehicle movement. Transportation 2013, 40, 729–750. [Google Scholar] [CrossRef]
  31. Zhong, C.; Arisona, S.M.; Huang, X.; Batty, M.; Schmitt, G. Detecting the dynamics of urban structure through spatial network analysis. Int. J. Geogr. Inf. Sci. 2014, 28, 2178–2199. [Google Scholar] [CrossRef]
  32. Allen, J.; Browne, M. Considering the Relationship between Freight Transport and Urban Form. Green Logistics Report; University of Westminster: London, UK, 2010. [Google Scholar]
  33. Sahu, P.K.; Padhi, A.; Patil, G.R.; Mahesh, G.; Sarkar, A.K. Spatial temporal analysis of major seaport freight flows in India. In Proceedings of the Transportation Research Board, Washington, DC, USA, 8–12 January 2017. [Google Scholar]
  34. Plat, D.; Raux, C. Frontier impedance effects and the growth of international exchanges: An empirical analysis for France. Pap. Reg. Sci. 2010, 77, 155–172. [Google Scholar] [CrossRef]
  35. He, M.L.; Shen, J.R.; Wu, X.H.; Luo, J.Q. Logistics space: A literature review from the sustainability perspective. Sustainability 2018, 10, 2815. [Google Scholar] [CrossRef]
  36. Boarnet, M.G.; Hong, A.; Santiago-Bartolomei, R. Urban spatial structure, employment subcenters, and freight travel. J. Transp. Geogr. 2017, 60, 267–276. [Google Scholar] [CrossRef]
  37. Liu, Y.; Kang, C.; Gao, S.; Xiao, Y.; Tian, Y. Understanding intra-urban trip patterns from taxi trajectory data. J. Geogr. Syst. 2012, 14, 463–483. [Google Scholar] [CrossRef]
  38. Jin, F.J. Infrastructure and Socio-Economic Spatial Organization; Science Press: Beijing, China, 2011. [Google Scholar]
  39. Yunnan Provinvial Bureau of Statistics. Available online: http://www.stats.yn.gov.cn/ (accessed on 20 August 2018).
  40. Ballantyne, E.E.F.; Lindholm, M.; Whiteing, A. A comparative study of urban freight transport planning: Addressing stakeholder needs. J. Transp. Geogr. 2013, 32, 93–101. [Google Scholar] [CrossRef]
  41. Ducruet, C.; Lugo, I. Structure and dynamics of transportation networks: models, methods and applications. In The SAGE Handbook of Transport Studies; Rodrigue, J.-P., Notteboom, T., Shaw, J., Eds.; SAGE: New York, NY, USA, 2013. [Google Scholar]
  42. Zhang, X.; Martin, T.; Newman, M. Identification of core–periphery structure in networks. Phys. Rev. E 2015, 91, 032803. [Google Scholar] [CrossRef] [PubMed]
  43. Yang, J.; Guo, A.D.; Li, Y.H.; Zhang, Y.Q.; Li, X.M. Simulation of landscape spatial layout evolution in rural-urban fringe areas: A case study of Ganjingzi District. GISci. Remote Sens. 2019, 56, 388–405. [Google Scholar] [CrossRef]
  44. Viljoen, N.M.; Joubert, J.W. The vulnerability of the global container shipping network to targeted link disruption. Phys. A 2016, 462, 396–409. [Google Scholar] [CrossRef] [Green Version]
  45. Gao, Z.Y.; Wu, J.J.; Mao, B.H.; Huang, H.J. Study on the complexity of traffic networks and related problems. J. Transp. Syst. Eng. Inf. Technol. 2005, 5, 79–84. [Google Scholar]
  46. Mo, H.H.; Wang, J.E.; Jin, F.J. Complexity perspectives on transportation network. Prog. Geo. 2008, 27, 112–120. [Google Scholar]
  47. Wang, J.E.; Mo, H.H.; Wang, F.H. Evolution of air transport network of China 1930–2012. J. Transp. Geogr. 2014, 40, 145–158. [Google Scholar] [CrossRef]
  48. Liu, Y.; Wang, F.; Xiao, Y.; Gao, S. Urban land uses and traffic ‘source-sink areas’: Evidence from GPS-enabled taxi data in Shanghai. Landsc. Urban Plan. 2012, 106, 87. [Google Scholar] [CrossRef]
  49. Chen, W.; Xiu, C.L.; Ke, W.Q.; Yu, Z.Y.; We, Y. Hierarchical structures of China’s city network from the perspective of multiple traffic flows. Geogr. Res. 2015, 34, 2073–2083. [Google Scholar]
  50. Borgatti, S.P.; Everett, M.G.; Freeman, L.C. Ucinet for Windows: Software for Social Network Analysis; Analytic Technologies: Harvard, MA, USA, 2002. [Google Scholar]
  51. Lordan, O.; Sallan, J.M.; Simo, P. Study of the topology and robustness of airline route networks from the complex network approach: A survey and research agenda. J. Transp. Geogr. 2014, 37, 112–120. [Google Scholar] [CrossRef]
  52. Girvan, M.; Newman, M.E.J. Community structure in social and biological networks. Proc. Natl. Acad. Sci. USA 2002, 99, 7821–7826. [Google Scholar] [CrossRef] [Green Version]
  53. Rosvall, M.; Bergstrom, C.T. Maps of random walks on complex networks reveal community structure. Proc. Natl. Acad. Sci. USA 2008, 105, 1118–1123. [Google Scholar] [CrossRef] [Green Version]
  54. Lancichinetti, A.; Fortunato, S. Community detection algorithms: A comparative analysis. Phys. Rev. E 2009, 80, 056117. [Google Scholar] [CrossRef] [Green Version]
  55. Clauset, A.; Shalizi, C.R.; Newman, M.E.J. Power-law distributions in empirical data. Siam Rev. 2009, 51, 661–703. [Google Scholar] [CrossRef]
  56. Chen, Y.G. Fractal Urban Systems: Scaling, Symmetry, Spatial Complexity; Science Press: Beijing, China, 2008. [Google Scholar]
  57. Newman, M.E.J. Modularity and community structure in networks. Proc. Natl. Acad. Sci. USA 2006, 103, 77–82. [Google Scholar] [CrossRef]
  58. Zhao, L.; Deng, M.; Wang, J.Q. Structural property analysis of urban street networks based on complex network theory. Geogr. Geo-Info. Sci. 2010, 26, 12–15. [Google Scholar]
  59. Ji, X.F.; Zhang, L.; Chen, F. Research on spatial organization optimization of urban agglomeration according to the promotion of the logistics integration level: A case of urban agglomeration of Yangtze River Economic Zone. Areal Res. Dev. 2015, 34, 24–28. [Google Scholar]
  60. Yang, W.; Li, T.; Cao, X. Examining the impacts of socio-economic factors, urban form and transportation development on CO2 emissions from transportation in China: A panel data analysis of China’s provinces. Habitat Int. 2015, 49, 212–220. [Google Scholar] [CrossRef]
Figure 1. Location of Yunnan in China.
Sustainability 11 01897 g001
Figure 2. (a) Map of prefecture-level city A and prefecture-level city B. City A is partitioned into county a1 to a3, and City B is partitioned into county b1 to b2. (b) The intracity trip: Trip 1 is an intracity trip from county a1 to country a2 with a freight volume of w 1 , and trip 2 is an intracity trip from county b1 to country b2 with a freight volume of w 2 . (c) The intercity trip: Trip 3 is an intercity trip from county a1 to county b1 with a freight volume of w 3 , and Trip 4 is an intercity trip from county b2 to country a1 with a freight volume of w 4 .
Sustainability 11 01897 g002
Figure 3. Flowchart of the methodology.
Sustainability 11 01897 g003
Figure 4. Networks of freight networks of study area. (a) The prefecture-level city-scale network G p . (b) The county-level city-scale network G c .
Sustainability 11 01897 g004
Figure 5. Degree distribution of network G p in double logarithmic coordinates. (a) Cumulative degree distribution P ( > k ) . (b) Cumulative strength distribution P ( > s ) .
Sustainability 11 01897 g005
Figure 6. Degree distribution of network G c in double logarithmic coordinates. (a) Cumulative degree distribution P ( > k ) . (b) Cumulative strength distribution P ( > s ) .
Sustainability 11 01897 g006
Figure 7. Community detection results of network G p (a) and network G c (b).
Sustainability 11 01897 g007
Figure 8. Community structures of network G c . (Note: Provinces are the 1st-level administrative subdivisions of China, prefectures are the 2nd-level, and counties are the 3rd.)
Sustainability 11 01897 g008
Figure 9. Sensitivity analysis of the number of nodes for G c .
Sustainability 11 01897 g009
Table 1. Share of each transportation mode in Yunnan.
Cargo Traffic Share of Each Transportation Mode (%)
20112012201320142015
Railway17.6615.5510.7110.49.78
Civil air0.010.010.010.010.01
Highway81.1483.2588.5788.7789.72
Water0.600.660.430.480.40
Pipeline0.590.530.280.340.00
Cargo Turnover for Each Transportation Mode (%)
20112012201320142015
Railway34.5532.627.9922.1725.09
Civil air0.100.100.100.100.10
Highway57.6860.3166.2256.9673.86
Water0.770.750.680.740.95
Pipeline6.906.245.0120.030.00
Table 2. Summary of the statistical properties of the freight network.
IndexesPrefecture-Level City-ScaleCounty-Level City-Scale
Network GpRandom Network of GpNetwork GcRandom Network of Gc
Number of nodes ( N )48199
Average degree ( i k i / N )8.83312.121
Average path length ( L )2.0271.7772.4472.122
Aggregation coefficient ( C )0.7360.1840.5250.061
Table 3. Summary of the statistical properties of the freight network without considering a cross-border effect.
IndexesPrefecture-Level City-ScaleCounty-Level City-Scale
Traditional Network GtpRandom Network of GtpTraditional Network GtcRandom Network of Gtc
Number of nodes ( N )16129
Average degree ( i k i / N )1115.746
Average path length ( L )1.2671.1561.9911.763
Aggregation coefficient ( C )0.7940.6880.5540.122
Table 4. Freight volume of the trip in each community.
CodeNumber of County UnitsMaximum Freight VolumeMinimum Freight VolumeSum of Freight VolumeMaximum Freight Volume Percentage (%)
Community 11413,8871466,10121.01
Community 22474,14620136,10254.48
Community 31118,8941836,50251.76
Community 4414981925,96419.18
Community 5241637679252.53
Community 62977081954,63514.11
Community 716624620 26,67123.42
Community 85419,39432 117,06116.57
Table 5. Sensitivity analysis of the number of nodes.
Experimental ProcessNumber of Removed Nodes
Before ExperimentOneTwoThreeFourFive
G p Node484645434240
Edge424362314276236198
Coverage variation−4.17%−6.25%−10.42%−12.50%−16.67%
Connectivity variation−14.62%−25.94%−34.91%−44.34%−53.30%
Freight volume variation−44.94%−58.31%−65.88%−69.99%−73.31%
G c Node199196194189187186
Edge241223522040191818881816
Coverage variation−1.51%−2.51%−5.03%−6.03%−6.53%
Connectivity variation−2.49%−15.42%−20.48%−21.72%−24.71%
Freight volume variation−14.54%−18.66%−22.77%−25.73%−28.50%
Table 6. Indicators of development level of transportation infrastructure and their respective correlations with freight volume.
IndicatorsVariablesSpearman Correlation Coefficient
G p G c
ScaleHighway density0.1310.267
Freight vehicle density
GradeProportion of high-rank highways0.2350.289
Proportion of classified highways
AccessibilityTime accessibility−0.052−0.652 **
Distance accessibility
Transportation capacityCoverage rate of road freight stations over a second county level0.813 **0.345
Service capacity of logistics infrastructure
Development level of transportation infrastructure0.646 **0.612 **
Note: ** denotes a significance level of 0.01 (2-tailed).
Table 7. Sensitivity analysis of the development level of transportation infrastructure.
Scenario G p G c
Transportation Capacity: +10%Transportation Capacity: −10%Accessibility: +10%Accessibility: −10%
Freight volume variation+8.68%−1.29%−6.68%+3.65%

