Article

Evaluation and Influencing Factors of Sustainable Development Capability of Agriculture in Countries along the Belt and Road Route

1
School of Economics and Management, Fuzhou University, Fuzhou 350116, China
2
Anxi College of Tea Science, Fujian Agriculture and Forestry University, Fuzhou 350002, China
*
Author to whom correspondence should be addressed.
Sustainability 2019, 11(7), 2004; https://0-doi-org.brum.beds.ac.uk/10.3390/su11072004
Submission received: 11 March 2019 / Revised: 28 March 2019 / Accepted: 31 March 2019 / Published: 4 April 2019
(This article belongs to the Section Sustainable Agriculture)

Abstract

:
Agriculture is increasingly facing major challenges such as climate change, scarcity of natural resources, and changing societal demands. To tackle these challenges, there is a pressing need to evolve towards more sustainable agricultural practices. As a result, sustainability stands among the most relevant topics in agricultural research worldwide, and countries along the Belt and Road (B&R) route are no exception. This paper selected 25 indicators from the five subsystems of population, society, economy, environment, and resources in order to build an evaluation index system of agricultural sustainable development capability, and then it used an improved entropy weight method, technique for ordering preference by similarity to an ideal solution (TOPSIS), and coordination degree method to measure the comprehensive capability and coordination of agricultural sustainable development of all countries along the B&R route from 2006 to 2015. First, according to the time dimension, the comprehensive score of sustainable development capability of agriculture along the B&R route: This had an average annual score of 0.3195 which initially decreased, then increased in a fluctuating manner, before finally falling again. Second, according to the spatial dimension, the average comprehensive score of agricultural sustainable development capability showed an evolutionary trend of ‘high–low–high–low–high’ from west to east, which showed an obvious basic spatial pattern of the ‘W’ type. Third, from the perspective of the subsystems of agriculture, although the coordination degree among subsystems in the main grain-producing areas increased continually from 2006 to 2015, the overall level of development needed to be further improved. In order to further clarify the main factors affecting the capability of agricultural sustainable development, this paper selected six explanatory variables: The level of economic development, financial expenditure for agriculture, agricultural foreign direct investment, agricultural labor force, the intensity of agricultural R&D investment, and the level of agricultural informatization. Then, geographically and temporally weighted regression was applied to evaluate the direction and degree of influences of selected factors on sustainability development capability of agriculture. The results showed that the regression coefficients of each variable in 53 countries were positive or negative, which indicated that the influencing factors of agricultural sustainable development capacity had the characteristics of geospatial nonstationarity.

1. Introduction

In 2013, China put forward the cooperative initiative of the “Silk Road Economic Belt and the 21st Century Maritime Silk Road” (hereinafter referred to as the Belt and Road Initiative or the B&R) to promote economic prosperity and common development of the countries along the route through complementary advantages and win-win cooperation. On this basis, agriculture is an important area in which to promote the B&R regional cooperation. Thus, China issued “Vision and Actions on Jointly Promoting Agricultural Cooperation on the Belt and Road” in 2017. The exchanges and trade in agriculture have been the main areas of cooperation along the ancient Silk Road since ancient times. Through the ancient Silk Road, China introduced crop varieties such as flax, pomegranate, alfalfa, and grape from the West and brought production technologies and agricultural products such as well-digging, silk, and tea to Central Asia, which promoted the dissemination and exchange of agricultural technologies and products among countries along the Silk Road. In the new era, agricultural development is still an important foundation for the development of the national economy along the B&R route. In addition, agricultural development is still a fundamental means of poverty alleviation, economic development, and sustainable development in general [1]. In recent years, the pattern of global agricultural development has been deeply adjusted [2], and the impact of climate change on major food-producing areas has been deepening. Moreover, nontraditional factors such as biomass energy and financial speculation have made the international market of agricultural products more uncertain. Thus, the availability, access, utilization, and stability of food supply remains a challenge [3]. It is urgent for many countries along the B&R route to achieve food security and nutrition and to solve hunger and poverty. It is also urgent to promote sustainable agricultural development through agricultural cooperation [4].
In 1985, the United States adopted the “Sustainable Agricultural Research and Education Program”, which first put forward a new agricultural development strategy and mode of sustainable agriculture and triggered research and exploration of the sustainable development of agriculture by governments and academia all over the world. Thereafter, the United Nations Food and Agriculture Organization (UNFAO) held an international seminar on sustainable agriculture and rural development in 1991. The Den Bosch Declaration published at the seminar proposed the most representative and widely accepted definition of sustainable agriculture. Sustainable agriculture refers to the adoption of a certain way of managing and protecting the natural resource base, as well as technological and institutional reforms, to ensure that the demand for agricultural products for present and future generations can be continuously satisfied. Therefore, the sustainable development of agriculture is to improve the benefits of agricultural output while effectively utilizing natural resources to maintain the balance of the ecological environment [5,6]. In addition, the sustainable development of agriculture directly affects the prosperity of the national economy and the realization of the goal of sustainable development of mankind [7].
The B&R route runs through the Asian, European, and African continents and their adjacent seas; that is, one side of the B&R route is an active economic circle in East Asia which has a long agricultural development history, and the other side is a developed economic circle in Europe which has obvious advantages of modern agriculture. The vast hinterland of the middle is rich in agricultural resources and has great potential for development [8]. According to the data released by UNFAO and World Bank Open Data (WBOD), of the top 10 countries in the world’s agricultural value added in 2017, eight were distributed along the B&R route. Among them, agricultural value added in China reached 968.628 billion US dollars, ranking first in the world, and that of India and Indonesia reached 401.319 billion US dollars and 133.465 billion US dollars, respectively, ranking second and third in the world. Moreover, the countries along the B&R route are the most concentrated areas of agricultural land in the world. The proportion of agricultural land accounts for more than 50% of the total land in nearly 20 of these countries, such as Central Asia and Mongolia. Though the total amount of agriculture in countries along the B&R route is enormous and the species resources are abundant, due to the large population base and the constraints of funds and technology, a large gap in the mode of production compared with developed countries has emerged [9]. In the process of production, many chemical fertilizers and pesticides are applied, which leads to overexploitation of some agricultural resources and serious overdraft. If agricultural production is still carried out in an extensive way with high consumption, low output, and high pollution, the ecological environment will deteriorate further, and the limited resources of agriculture will accelerate the depletion; then the agricultural ecosystem will be on the verge of collapse, and the development of social economy will be severely restricted. Under the constraints of the ecological environment and the resource environment, the implementation of green production modes and the enhancement of agricultural sustainable development capacity are urgent problems faced by all countries along the B&R route. On the basis of the B&R Initiative, the countries along the B&R route can seize the opportunity to actively integrate into agricultural globalization and develop agricultural cooperation with other countries, and then jointly promote agricultural sustainable development and comprehensively enhance the level of competitiveness. These ways are effective for countries along the route to achieve food security and nutrition and solve hunger and poverty. However, what is the current agricultural sustainable development capacity of the countries along the B&R route? What factors affect the sustainable development of agriculture in these countries? What are the main drawbacks? What are the more appropriate directions and areas for future agricultural cooperation? Based on the problems mentioned above, this paper first analyzes various factors that affect the sustainable development capability of agriculture, then establishes a comprehensive evaluation index system for sustainable development capacity of agriculture, and finally defines the status of various countries’ agricultural development among the B&R route. In addition, this paper finds the shortcomings of agricultural development in the countries along the B&R route and provides direction and theoretical guidance for the sustainable development and future cooperation of the countries along the B&R route.
Based on the above reality, this paper selects the agricultural sustainable development along the B&R route as the research object. By setting up an index system, this paper evaluates the sustainable development capability of agriculture and explores the key influencing factors. In brief, this paper will have a certain reference value and practical significance for the sustainable and coordinated development of agriculture along the B&R route. The theoretical and practical significance of this paper is embodied in three aspects. First, through the construction of tan evaluation index system of agricultural sustainable development capability, a comprehensive evaluation of agricultural sustainable development capability of countries along the B&R route can help in understanding the development of the agricultural industry in the partner countries, as well as providing a decision-making basis for planning agricultural external cooperation and macroscale agricultural policies for countries along the B&R route. Second, an agricultural sustainable development system is an organic whole composed of economic, social, population, resources, and environment subsystems interacting. Its essence is to achieve a high degree of coordination among these five aspects [10]. Therefore, through the evaluation of the coordination degree of agricultural subsystems in the countries along the B&R route, alongside analysis of the reasons for the difference in the degree of coordination between regions, it is helpful to identify shortcomings, integrate different sectoral programs, and develop coherent cross-sectoral policy [11]. Third, geographically and temporally weighted regression (GTWR) is used to analyze the spatial heterogeneity, direction, and degree of the impact of influencing factors on agricultural sustainable development capability. It will help to clarifying the future development direction and work layout of agriculture and narrow the gap relative to developed agricultural countries.
The rest of this paper can be divided into seven sections and is organized as follows. Section 2 provides a literature review and introduces the evaluation and influencing factors of the sustainable development capacity of agriculture and the application of research methods. The evaluation index system of sustainable development capability of agriculture in countries along the B&R route is detailed in Section 3. Then, Section 4 calculates the comprehensive evaluation of agricultural sustainable development capability in countries along the B&R route. Section 5 measures the coordination degree among agricultural subsystems. Afterwards, Section 6 analyzes the influencing factors on sustainable development capability of agriculture based on the attributes of time and space. Finally, the conclusion and discussion are presented in Section 7.

2. Literature Review

2.1. Evaluation of Sustainable Development of Agriculture

Many scholars have made in-depth studies in recent years on the evaluation of sustainable development of agriculture in various countries and regions by constructing various models. Among them, the agriculture-related sustainable development goals are an important framework and an important reference for the establishment of evaluation systems [7]. Thus, sustainable agriculture must be ecologically sound, economically viable, and socially responsible [12]. A system dynamics model named the agricultural–institutional–social–ecological–economic model has been applied to explore the potential long-term ecological, economic, institutional, and social interactions of ecological agricultural development [13], which indicates that the diversification of land-use patterns, government support for training, and low-interest government loans are important policy measures in promoting sustainable development of ecological agriculture. The agro-ecosystem health model was applied at a regional scale, and then 12 indicators were selected using four aspects—sound structure, stable function, safe service, and sustainable development—to perform an agro-ecosystem health assessment [14]. In addition, in Southern Africa, a reliable composite baseline index including eight indicators, such as ending poverty and zero hunger, of the sustainable development related to the agriculture sector was developed [15]. Furthermore, the agro-environmental sources, inputs system, socioeconomic system, and various farming systems were also considered with respect to agricultural sustainability [16]. Moreover, the regional sustainability was evaluated through a method combining four separate subsystems: The regional population, resources, environment, and socioeconomics [17,18]. The index frame of the sustainable agricultural development exponent can be divided into two parts: Agricultural production and agricultural output. Economy, society, technology, resources, and environment were also constructed as a comprehensive and scientific index system. All the above existing studies indicate the importance and complexity of the evaluation of sustainable development capacity of agriculture.
In addition, many scholars have also conducted in-depth discussions on ways to achieve the sustainable development of agriculture; for instance, precision agriculture [19], developing microorganisms as bio-fertilizers [20], reducing use of inorganic fertilizers [21] and insecticides [22], alpine agriculture [23], multifunctional farming [24,25], and sustainable agriculture and food systems education [26,27,28]. In summary, the evaluation of sustainable development capability of agriculture is a comprehensive and complicated system and involves all aspects of the economy, environment, and society.

2.2. Research Methods

A historical analysis approach was employed to examine the sustainable development concepts in Chinese traditional agriculture [29]. In addition, case analysis [30,31,32] and system dynamics were used to analyze the sustainable development capability of agriculture [13,33]. A systemic and integrated model was applied to analyze the existent dynamics in sustainable development of Iran’s agriculture, which showed that profit gained from agriculture and required water are among the most important leverage points [33]. The standardized Euclidean distance method was also used to evaluate the agricultural sustainable development [31].
The improved entropy weight method and technique for ordering preference by similarity to an ideal solution (TOPSIS) have wide application in various fields. As a whole, TOPSIS and the improved entropy weight method are often used in variable selection and parameter optimization. Besides, TOPSIS has been applied in green technology innovation [34] and the evaluation of green suppliers [35]. In addition, the entropy weight method has been used in PM2.5 prediction [36], environmental conflict analysis [37], and the investigation of the carrying capacity of regional water resources [38].
Geographically weighted regression (GWR) and GTWR were applied to analyze the temporal and spatial differentiation characteristics of variables [39,40,41,42]. For instance, GWR was used to explore the spatial and temporal patterns of land cover, land use, and population change dynamics [43]; the urban land efficiency [44]; and the impact of the agro-environmental policy initiative on the economic landscape [45]. As a novel method of coefficient estimation, the application of GTWR is still relatively small, although it has many advantages. GTWR was demonstrated to be more effective and overall superior to the traditional geographically weighted regression approach [46].

2.3. Influencing Factors on Sustainable Development of Agriculture

For the sustainable development of agriculture, aging and income subsidies are two of the most important influencing factors [47]. Labor is most important in explaining the farm efficiency losses, while income subsidy has a negative effect on farm efficiency. Infrastructure development, such as motorway construction, also has an influence on the agricultural land and sustainable development [48]. Therefore, at present, there are only a few studies on the influencing factors of agricultural sustainable development capability; there is an especially notable lack of research combining time and geographical factors.

3. Index System of Sustainable Development Capability of Agriculture

3.1. Study Area

A total of 66 countries are distributed along the B&R route at present, and 53 of them were selected as the study area according to the availability of data. These selected countries cover nine regions, including Southeast Asia, South Asia, East Asia, West Asia, Central Asia, Southern Europe, Central Europe, Eastern Europe, and North Africa, which means that they are highly representative of the area under study. According to the raw data released by UNFAO and WBOD, the total population of the selected area is 4.346 billion, and the total agricultural land is 18.671 million square kilometers, comprising 94.73% and 93.49% of the total population and total agricultural land along the B&R route, respectively.

3.2. Construction of Index System

The choice of indicators is a critical aspect for the development of appropriate sustainability assessments, since the data used for the calculation of each indicator will influence the outcome of the analysis. Meanwhile, the evaluation should reflect a holistic view of the linkage between indicators, and it should have the appropriate scope while still offering a practical application [49]. Thus, Mili and Martínez selected 22 indicators covering the three classical dimensions of sustainability: Environmental, economic, and social [50]. Olsson et al. created an indicator framework where the environmental, economic, and social dimensions of sustainable development can be related to each other in a consistent way [51]. In addition, Roy and Chan proposed a set of indicators, including economic, social, and ecological dimensions, for assessing agricultural sustainability in Bangladesh [52]. Mauerhofer presented a completely different approach: ‘3-D Sustainability’ [53]. He described a three-dimensional cone consisting of three types of capital (natural, social, and economic) and three types of capacity (environmental, social, and economic), while the cone’s diagonal sides represent the limits of the environmental system. Furthermore, Rasure described multidimensional aspects of sustainability, indicating 13 dimensions of sustainable agriculture such as technological appropriateness, economic viability, environmental soundness, and efficiency of resource use [54]. Seghezzo suggested using five dimensions: ‘Place’ understood in terms of nature, culture, and politics, as well as ‘permanence’ and ‘persons’ [55]. Besides, Agenda 21 adopted by the United Nations Conference on Environment and Development regards economy, society, resources, and environment as an inseparable and human-centered complex system, which constructs a comprehensive, long-term, and progressive framework for sustainable development. Thus, agricultural sustainable development also needs the interaction, promotion, and coordination of economy, society, population, resources, and environment. Therefore, the evaluation of agricultural sustainable development capability must consider the influence of the above factors. On the basis of the existing research [13,15,16,22,49] and according to the principles of representativeness, transferability, adaptability, and measurability [56] and the connotation of sustainable agricultural development [57], this paper selects the indicators from five dimensions: The sustainable development capability of agricultural economy, agricultural society, agricultural population, agricultural resources, and agricultural environment; it then forms the evaluation index system, which includes five primary indices and 25 secondary indices. The five dimensions are interrelated and play different important roles in the sustainable development system of agriculture [58]. Among them, the sustainable development of the economic subsystem can guarantee food security and enhance the ability of agricultural support, so it is the core of sustainable development of agriculture. In addition, the sustainable development of social subsystems and population subsystems can ensure the healthy development of the social environment needed for agricultural development, so they are the main basis and ultimate goal of sustainable development of agriculture. Furthermore, the sustainable development of agricultural resources and environmental systems can supply the material basis and ecological environment on which agricultural production and development depend, so they are the fundamental guarantee for achieving sustainable development of agriculture (Table 1).

4. Comprehensive Evaluation of Sustainable Development Capability of Agriculture

4.1. Data Sources

The original data in this paper mainly come from publicly accessible databases provided by the major international organizations and related countries. These data sources include WBOD, UNFAO, International Energy Agency (IEA), United States Department of Agriculture (USDA), European Statistical System (EUROSTAT), OECD Statistics, World Database on Protected Areas (WDPA), International Labour Organization (ILO), Global Assessment of Human-Induced Soil Degradation (GLASOD), World Trade Organization (WTO), Database for the Belt and Road, One Belt One Road Collection (OBOR), China Statistical Yearbook, and statistical yearbooks for each country, as well as other public data.

4.2. Evaluation Methods

4.2.1. Improved Entropy Weight Method

As an objective weighting method, the entropy weight method is widely applied in the calculation of index weight by using the information entropy. On this basis, the dynamic weights of secondary indices in this paper in each year are determined by the improved entropy weight method. Overall, the entropy weight method is a mathematical method for calculating an aggregative index on the basis of comprehensively considering the amount of information provided by various factors. Thus, the smaller the information entropy of an index is, the more significant the difference is. Moreover, the lower the degree of information disorder is, the greater the value of information utility is. These mean that the greater the weight of the index is, the more important it is in the comprehensive evaluation and the greater the entropy weight is.
Assuming that there are m regions and n evaluation indices, in addition, a i j represents the j t h evaluation index of the i t h region, the specific steps of the improved entropy weight method are as follows [59]:
(1)
The standardized processing of raw data:
Positive   attribute :   r i j = a i j min ( a i j ) max ( a i j ) min ( a i j ) , ( i = 1 , 2 , , m ; j = 1 , 2 , , n )
Negative   attribute :   r i j = max ( a i j ) a i j max ( a i j ) min ( a i j ) , ( i = 1 , 2 , , m ; j = 1 , 2 , , n )
(2)
The translation processing of standardized data:
b i j = 1 + r i j
(3)
The calculation of index weight of b i j :
p i j = b i j / j = 1 m b i j
(4)
The calculation of the entropy value of the j t h index:
e j = ( 1 / ln m ) i = 1 m p i j · ln p i j
(5)
The calculation of the entropy weight of the j t h index:
w j = ( 1 e j ) / n j = 1 n ( 1 e j )
(6)
The calculation of the index weight included in each subsystem:
w k j * = w j / j = 1 r w j

4.2.2. TOPSIS

The basic principle of TOPSIS is to calculate the distance between the evaluation object and the optimal solution and the worst solution by constructing the optimal solution and the worst solution of each index in the decision-making problem so as to obtain the relative proximity between the evaluation object and the optimal solution and use this as the basic criteria for evaluating the advantages and disadvantages [60]. The traditional TOPSIS uses relative ideal points, i.e., the maximum and minimum values of each index are selected separately from the existing finite comprehensive evaluation, which are uncertain and not unique. When the ideal solution changes, the distance from each evaluation index value to the ideal solution also changes; as a result, the evaluations from different years cannot be directly compared. In order to overcome this defect, this paper replaced the relative ideal solution with the absolute ideal solution; that is, the absolute positive ideal solution is superior to any possible index value of the evaluation object, and the absolute negative ideal solution is inferior to any possible index value of the evaluation object. As the evaluation criteria, the absolute positive and negative ideal solution remain unchanged for different years. We define the maximum of the decision matrix as the positive ideal solution and the minimum of the decision matrix as the negative ideal solution, respectively [61,62]. In addition, in order to eliminate the interference of correlation between variables, the Mahalanobis distance was introduced into the traditional TOPSIS method to take the place of Euclidean distance [63].
The specific steps of TOPSIS are as follows:
(1) Convert standardized data r i j into a normalized matrix:
y i j = r i j / i = 1 m r i j 2 ,   Y = ( y i j ) m × n
(2) Take the weights w j determined by the improved entropy weight method as the weights of each index and then multiply with Y to obtain the weighted decision matrix:
Z = ( z i j ) m × n = w j y i j
(3) Determine absolute positive and negative ideal solutions:
Absolute   positive   ideal   solution :   x = max z i j
Absolute   negative   ideal   solution :   x = min z i j
(4) Calculate the Mahalanobis distances between the solutions and ideal solutions and negative ideal solutions:
s i + = z i x = ( z i j x ) T 1 ( z i j x )
s i = z i x = ( z i j x ) T 1 ( z i j x )
where 1 represents the inverse matrix of the covariance matrix of z i j and x ( x ) .
(5) The proximity of the i t h evaluation object to the optimal solution:
C i = s i / ( s i + + s i )   ( 0 C i 1 , i = 1 , 2 , , m )
C i indicates closeness. The closer the value of C i is to 1, the closer the evaluation object is to the ideal solution, and the higher the degree of openness is. To rank the relative closeness degrees in order, the comprehensive sustainable development capacity of agriculture of all countries along the B&R route from 2006 to 2015 were calculated and are listed alphabetically in Table 2.

4.3. Spatial and Temporal Analysis of Sustainable Development of Agriculture

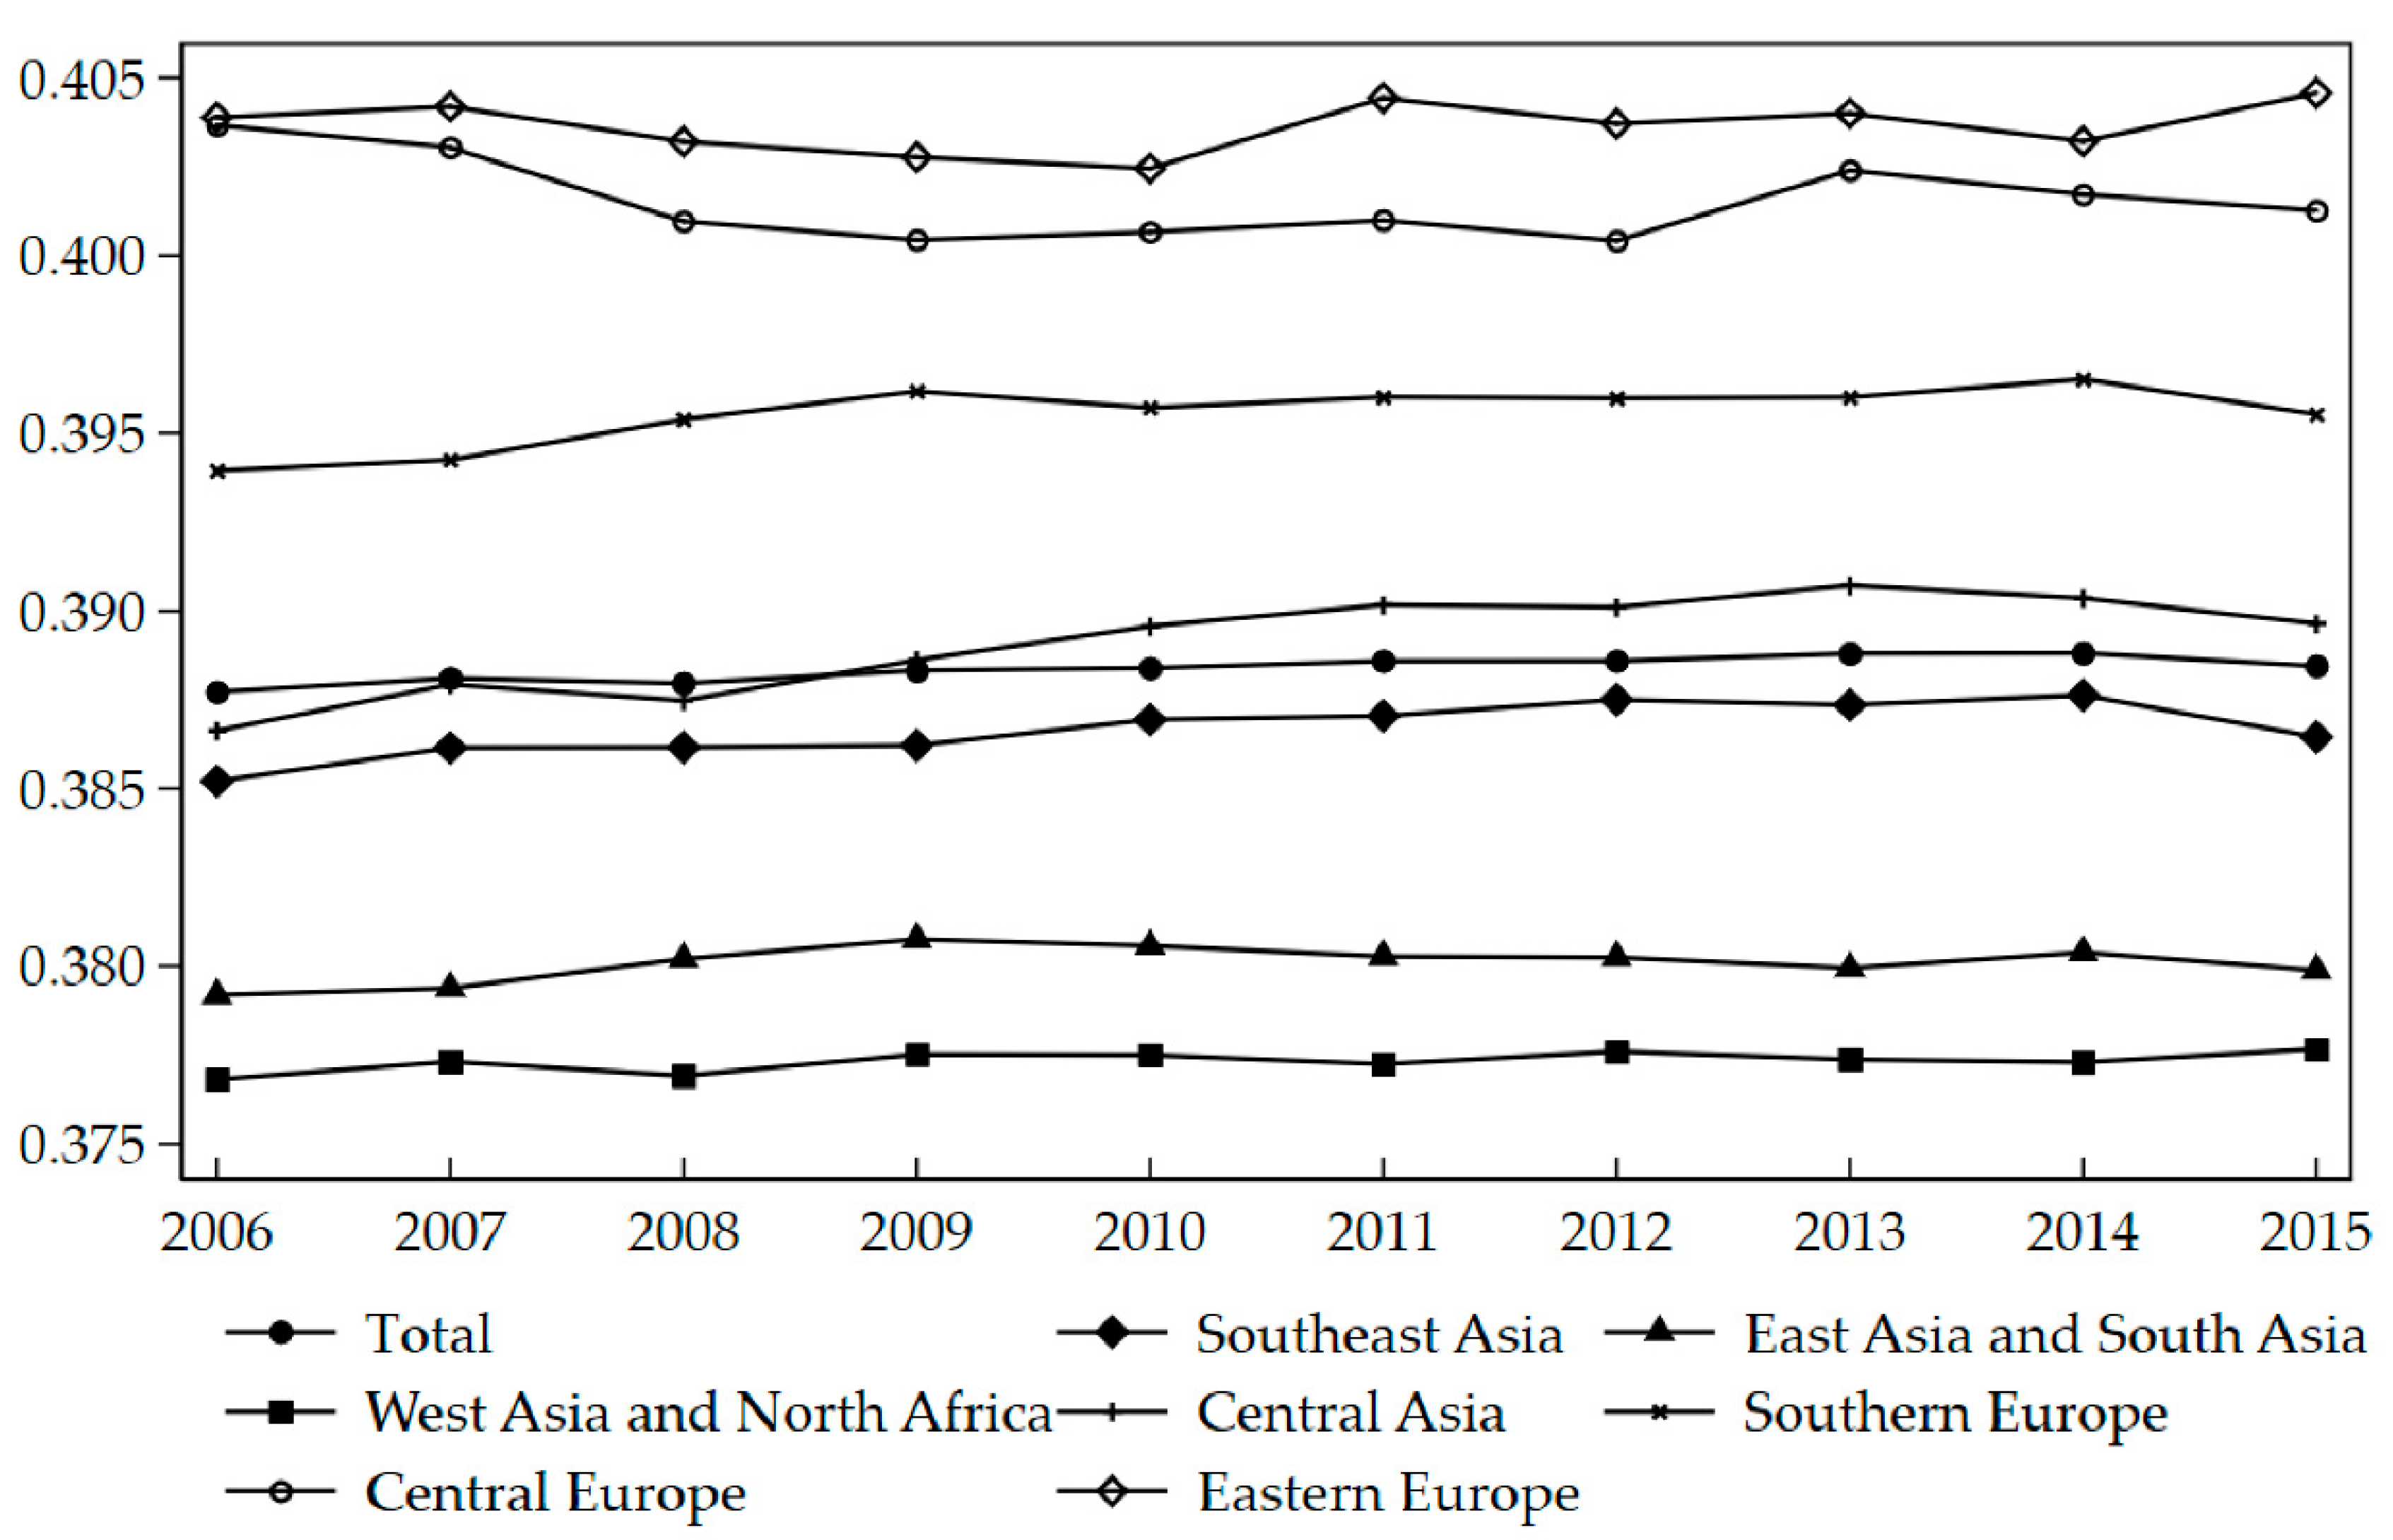
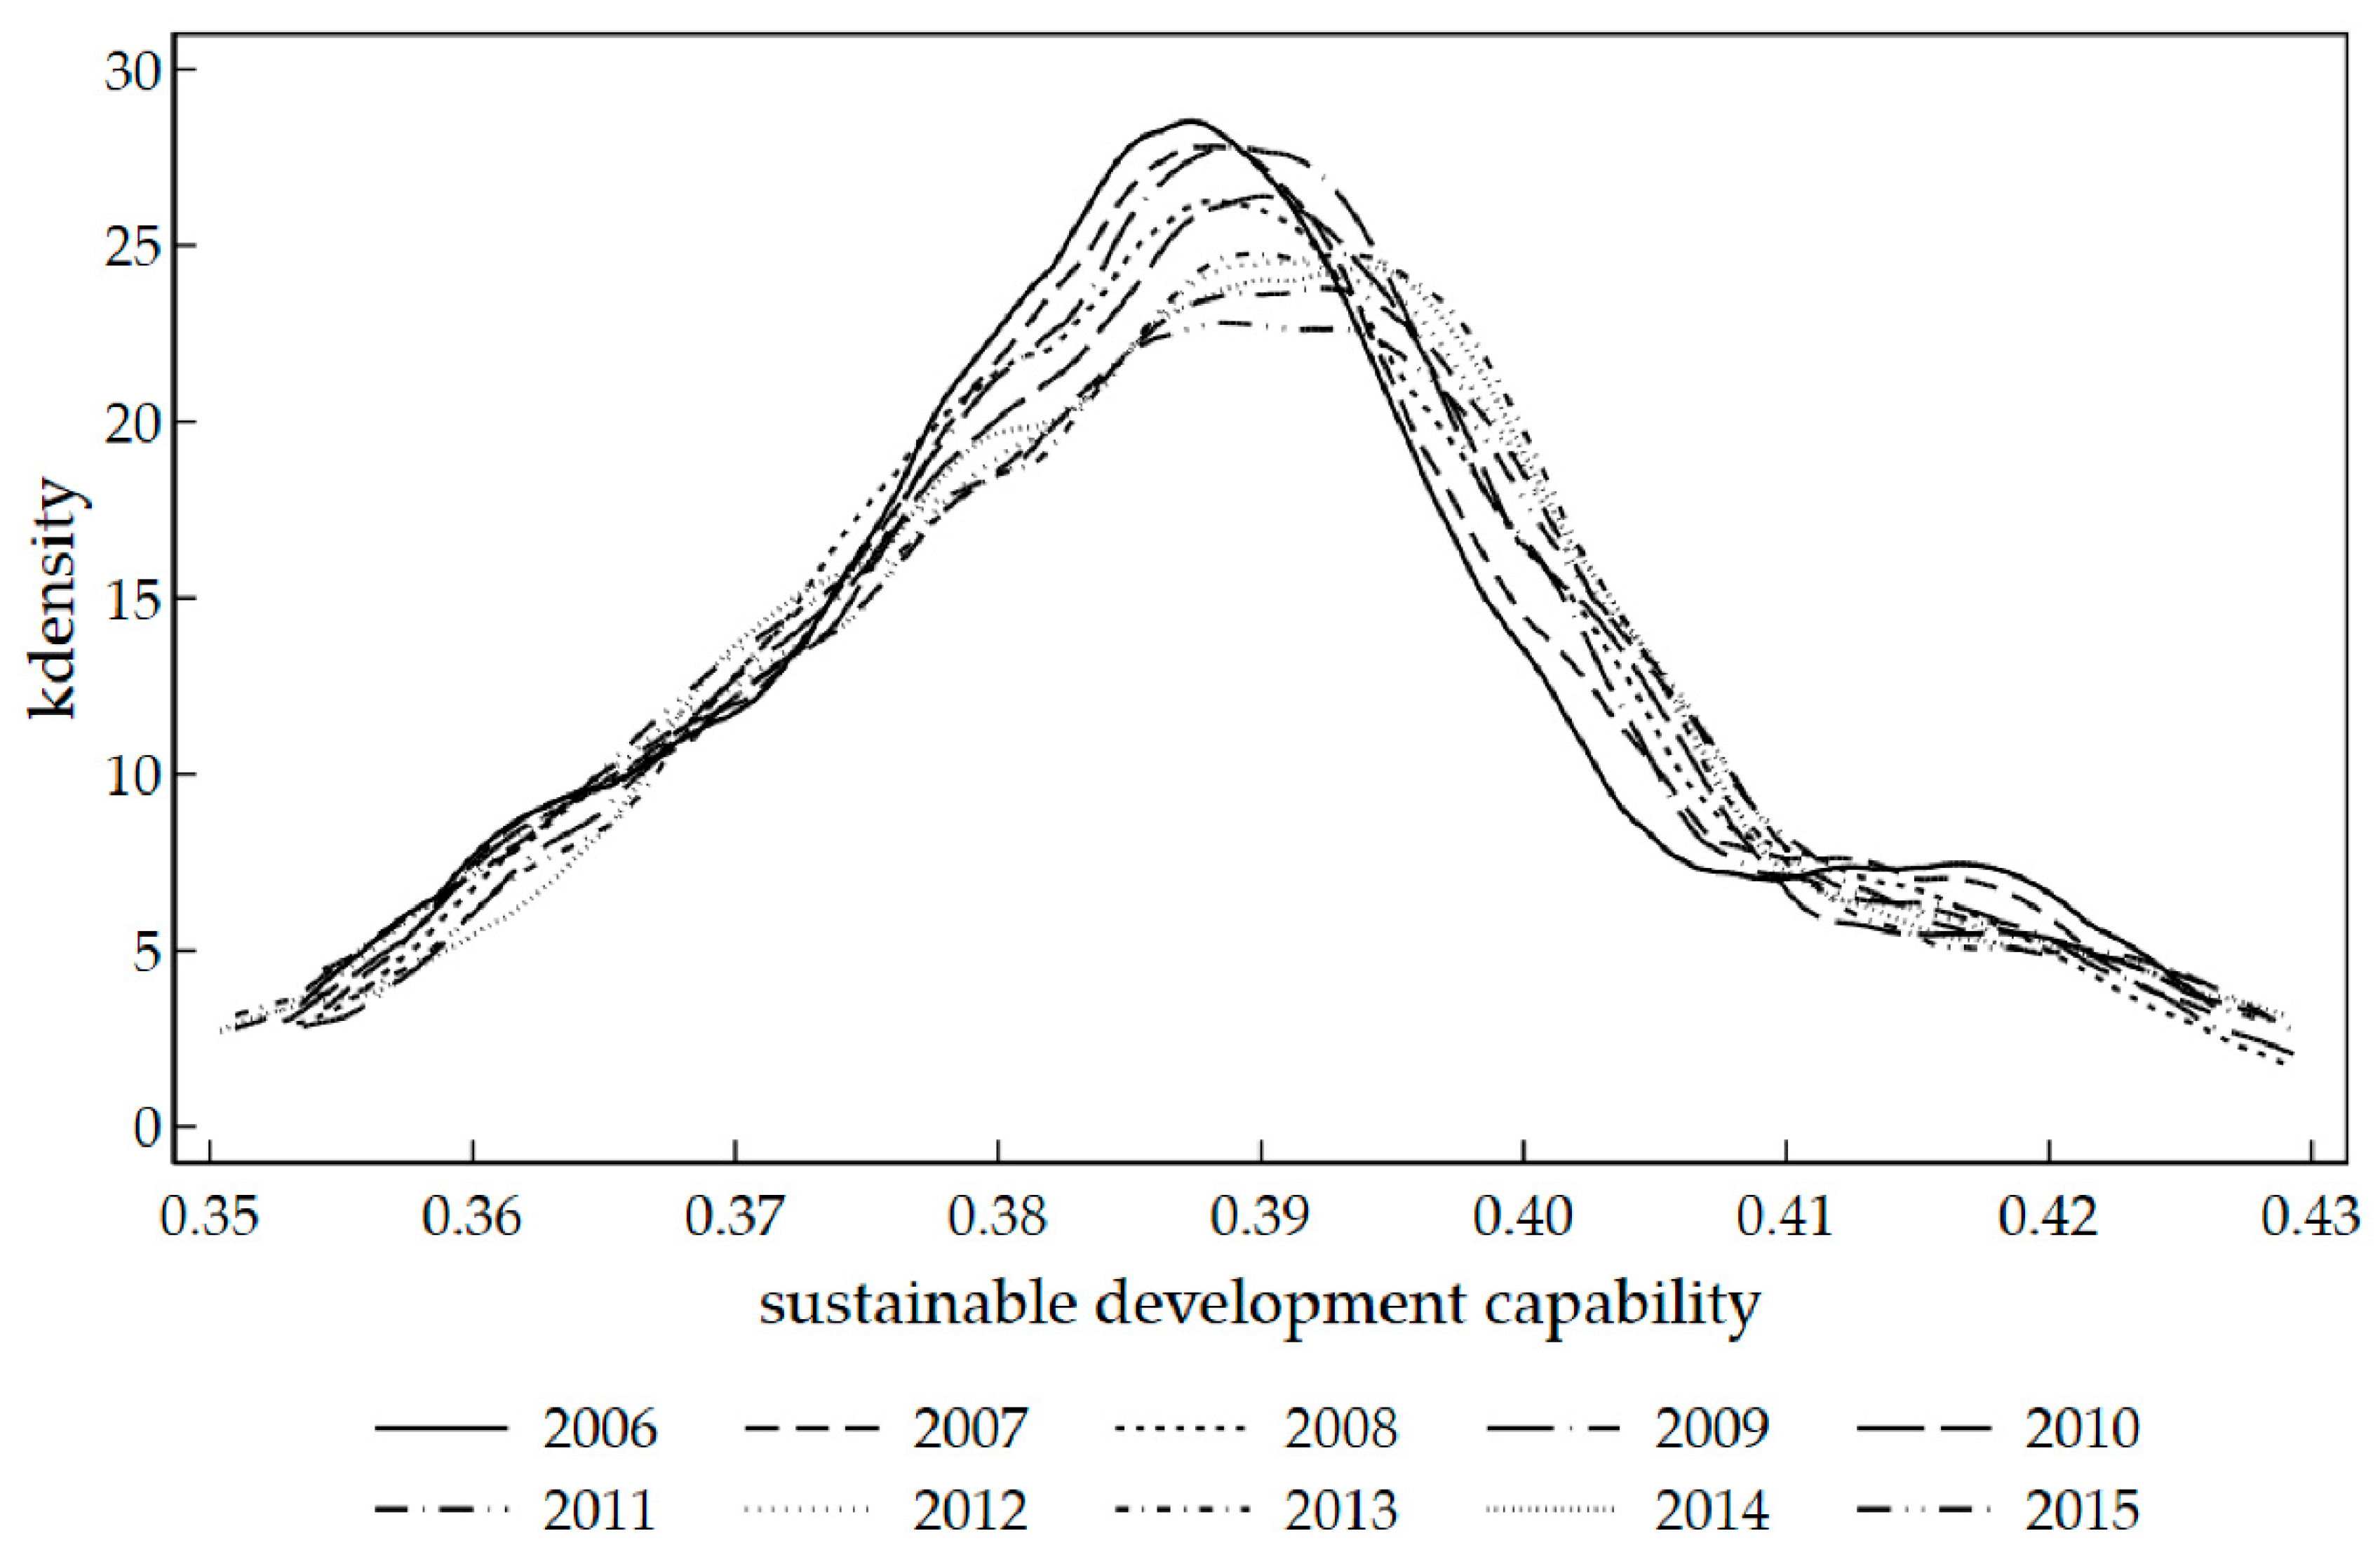
4.3.1. Analysis Based on Time Dimension

In general, the comprehensive score of sustainable development of agriculture along the B&R route during the period from 2006 to 2015 initially decreased, then increased in a fluctuating manner, and then finally fell again (Figure 1). As shown in Figure 1, the average annual comprehensive total score of the selected countries was 0.3884. Among them, the highest comprehensive score of the countries along the B&R route was 0.3888 in 2014, followed by 0.3887 in 2013. There may be many reasons for this. From 2007 to 2008, with the soaring price of grain in the international market, the sharp decline in production, and the serious shortage of inventory, the global food security situation worsened with the financial crisis; some developing countries even experienced a serious food crisis. Subsequently, according to the UNFAO database, the global agricultural and economic situation improved in the first half of 2009. Increased demand for agricultural products worldwide stimulated a new high in fertilizer consumption, with annual growth rates of 3.9% in Asia and Europe. Since 2010, the overall recovery of the economy and the bumper harvests of grain have weakened the adverse impact of the food crisis and promoted agricultural innovation and sustainable development. However, in recent years, the sustainable development of world agriculture has been threatened by population growth, land degradation, and water pollution. For instance, according to the ‘Food Security and Nutrition around the World’ report in 2018 released by UNFAO, International Fund for Agricultural Development (IFAD), United Nations International Children’s Emergency Fund (UNICEF), World Food Programme (WFP), and WTO, due to the effects of climate change, regional conflicts, and economic slowdown, the number of hungry people in the world has increased since 2015, and the food security situation has deteriorated. In addition, as can be seen in Figure 1, the comprehensive score of countries along the B&R route decreased from 0.3888 to 0.3884 by 2015, which indicates the arduous and long-term task of sustainable development of agriculture. Thus, if the goal of ‘zero hunger’ is to be achieved by 2030, governments must accelerate the implementation of effective measures.
In order to reveal the dynamic evolution process of sustainable development capability of agriculture more profoundly and carefully, nonparametric kernel density was applied to analyze the overall distribution characteristics of sustainable development capacity of agriculture in the selected 53 countries from 2006 to 2015.
As shown in Figure 2, the dynamic evolution of sustainable development capacity of agriculture along the B&R route presents three distinct characteristics. First, from the translation of the position of the density distribution curve, the curve moves slightly to the right, which intuitively reflects that the sustainable development capacity of agriculture in the 53 countries was increasing by a small amount. Second, the density distribution curve shows a bimodal distribution. Therein, the left peak is relatively steep and shows that the comprehensive score of sustainable development capability of agriculture concentrates near the value of 0.39. By contrast, the right peak is relatively gentle, which indicates that a few countries have a comparative advantage in the comprehensive score of sustainable development capacity of agriculture, with a concentration near the value of 0.42. Finally, the peak on the left side of the nuclear density distribution curve shows a slight decrease, which indicates that the gap of sustainable development capacity of agriculture among the selected countries has widened with the passage of time.

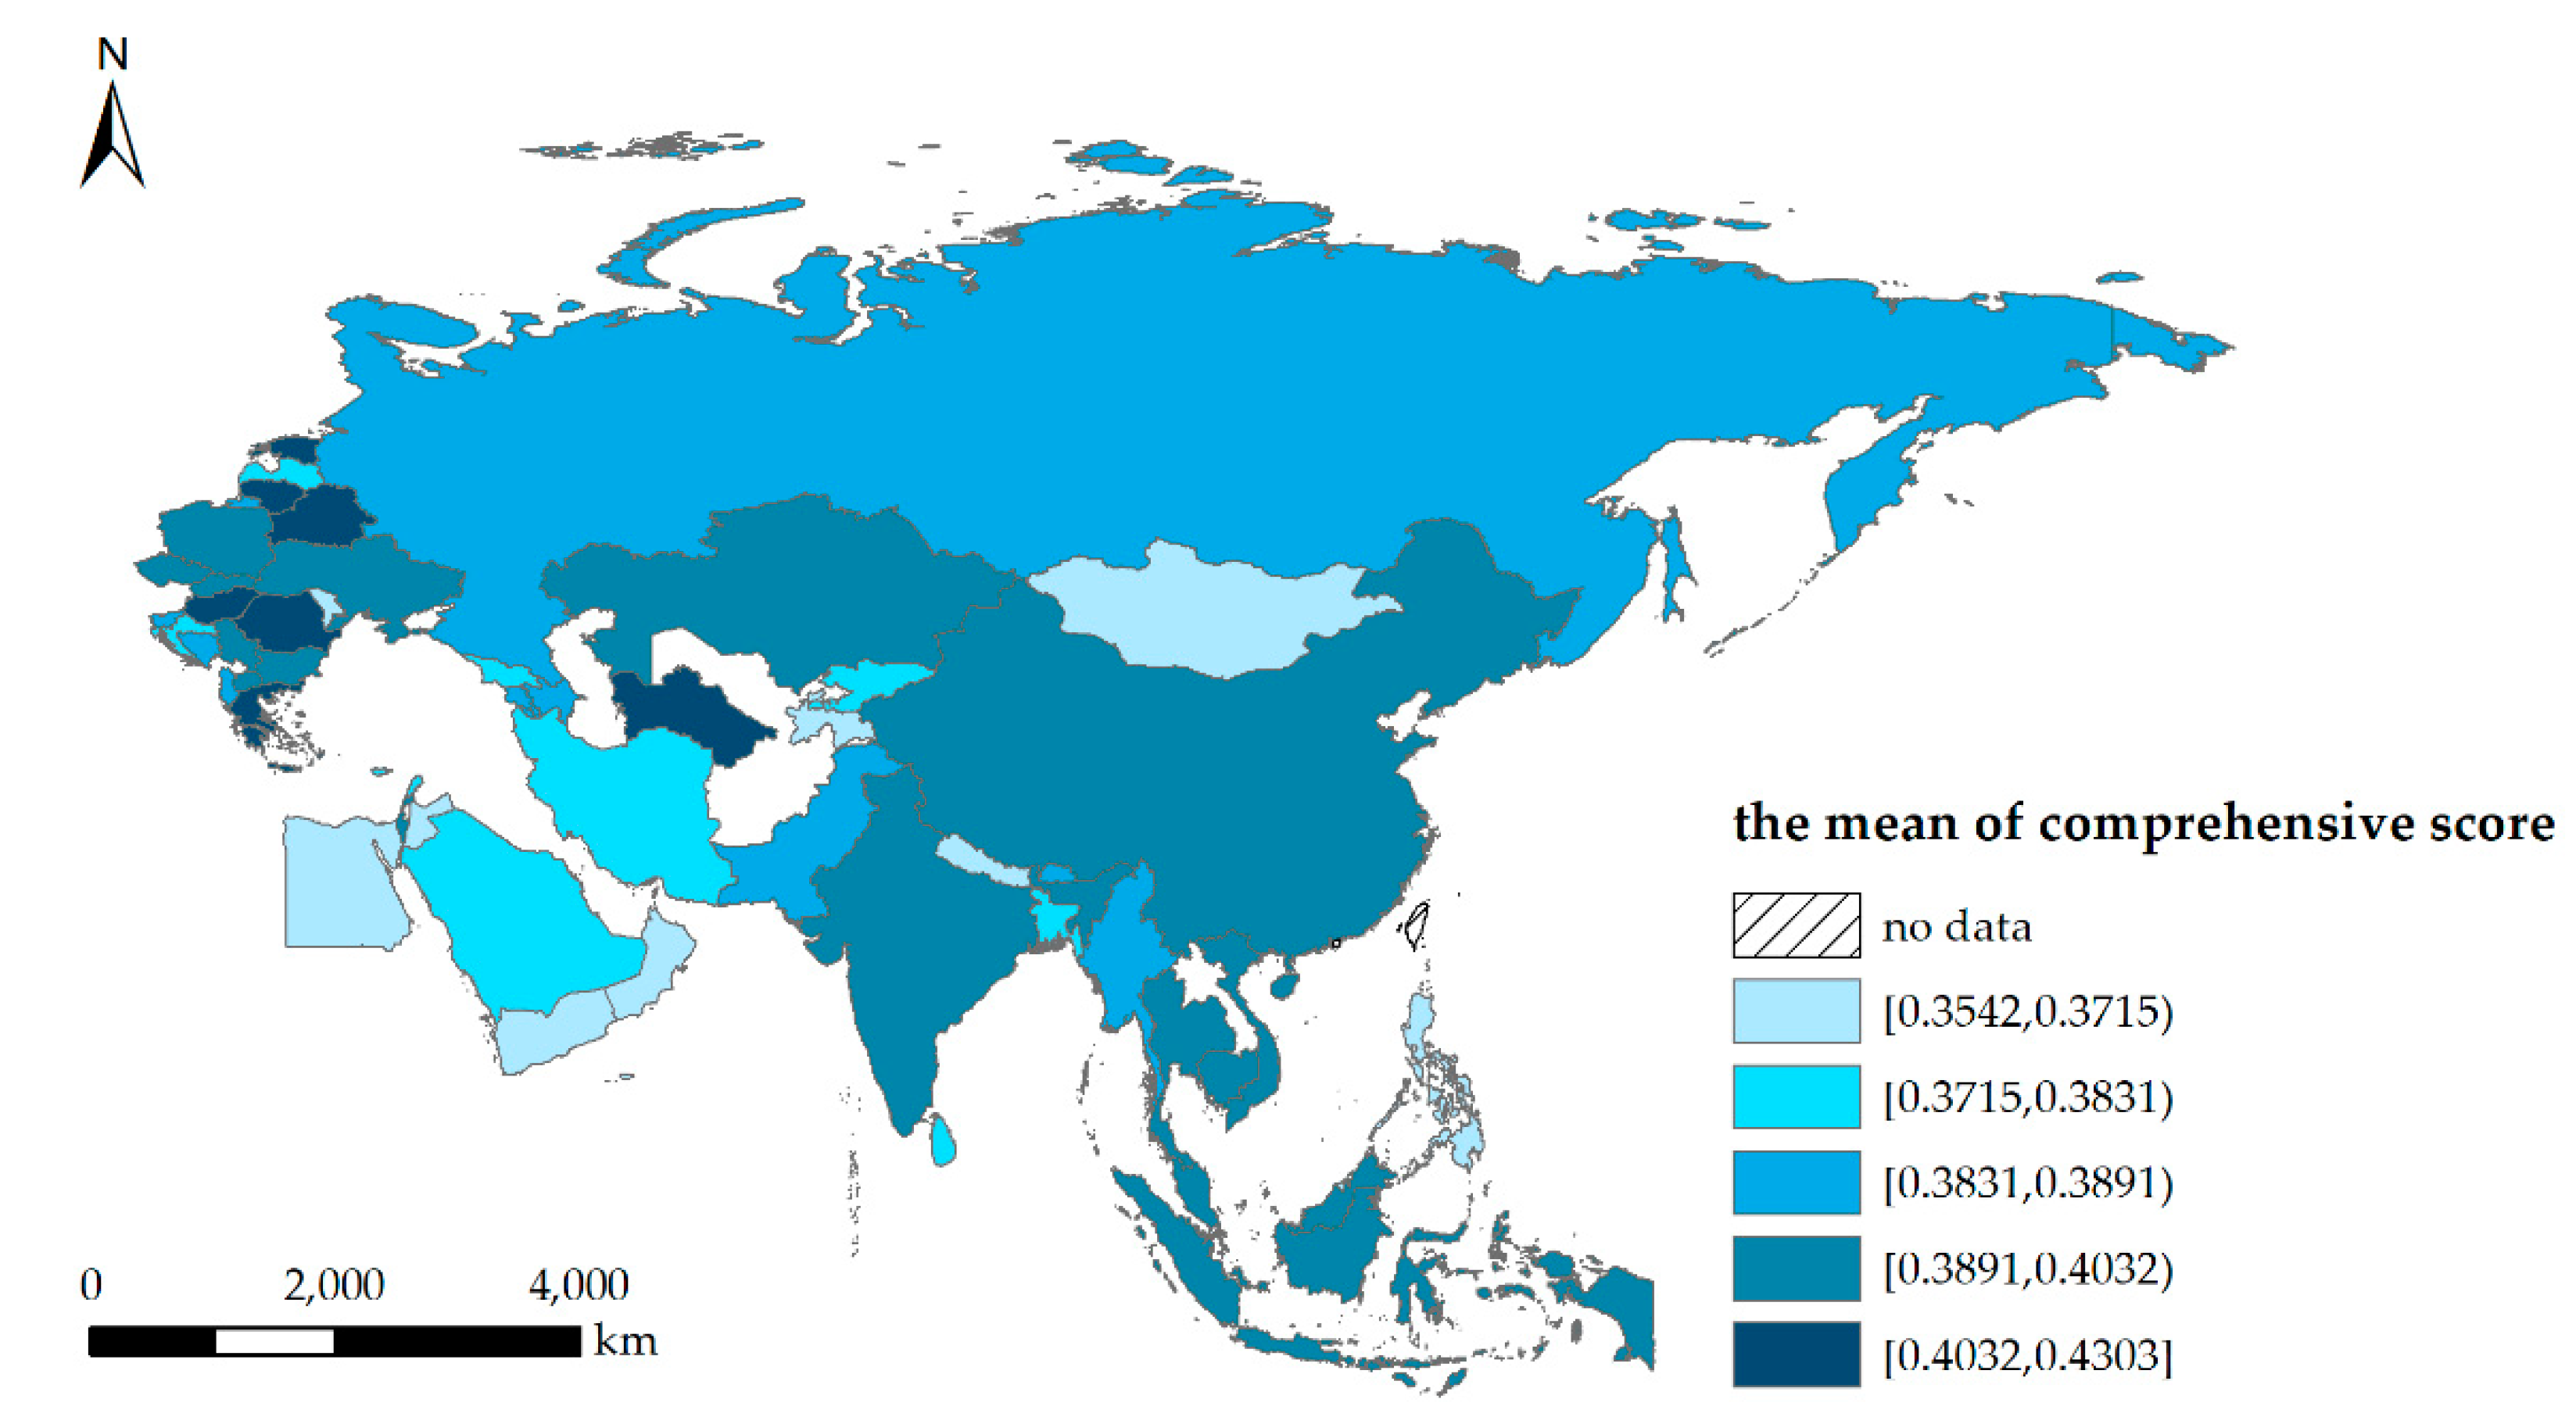
4.3.2. Analysis Based on Spatial Dimension

In order to clearly show the spatial evolution of the sustainable development of agriculture along the B&R route according to the comprehensive score shown in Table 2, this paper divides the average value of the comprehensive score from 2006 to 2015 into five certain intervals according to the Jenks natural breaks classification in ArcGIS. They are [0.3542,0.3715], [0.3715,0.3831], [0.3831,0.3891], [0.3891,0.4032], and [0.4032,0.4303], respectively, and are shown in Figure 3. The mean of the comprehensive score of sustainable development capability of agriculture within the interval [0.3542,0.3715] contains 11 countries, such as Brunei, Egypt, and Jordan. In the interval [0.3715,0.3831], there are 10 countries, such as Cyprus, Bangladesh, Croatia, and Iran. There are eight countries, including Armenia, Azerbaijan, and Bhutan, within the interval [0.3831,0.3891]. The interval [0.3891,0.4032] includes 17 countries, such as Albania, China (mainland), and Indonesia. Finally, there are seven countries, such as Belarus, Lithuania, and Estonia, which belong to the interval [0.4032,0.4303].
The sustainable development capability of agriculture in the countries along the B&R route presents the situation that the comprehensive score in the western part is obviously higher than that of the eastern part, and, at the same time, the score in the northern part is obviously higher than that of the southern part. It can be concluded that in the east–west direction, the sustainable development capability of agriculture in the countries of Southeast Asia, Central Asia, Eastern Europe, and Central Europe is far stronger than that of the countries of West Asia. In addition, in the north–south direction, the sustainable development capability of agriculture in Southeast Asia, Southern Europe, and Central Europe is stronger than that of North Africa. Thus, combining the two directions, the evolutionary trend of ‘high–low–high–low–high’ from west to east is generally presented, and the basic spatial pattern of ‘W’ type is obvious. Among them, Eastern Europe has the highest comprehensive score, which is followed by that of Central Europe. The comprehensive scores of Southern Europe and Central Asia are in an intermediate position, while those of the Maldives, Yemen, Brunei, and Jordan in West Asia and Southeast Asia are lowest. This could be explained by the geographical environment and natural resources. Most of Europe is in the temperate zone, with mild and humid climates and abundant natural resources. They depend on the developed industrial economy and make use of advanced production tools and technology to realize mechanization, electrification, and automation in all aspects of agriculture. By contrast, Egypt and Western Asia have a tropical desert climate and arid climate. Thus, the abundant petroleum resources and the scarcity of freshwater resources have caused frequent wars and conflicts in Saudi Arabia, Iran, Jordan, and other Western Asian regions. Meanwhile, the backward agricultural technology has seriously restricted the sustainable development of agriculture in the region.

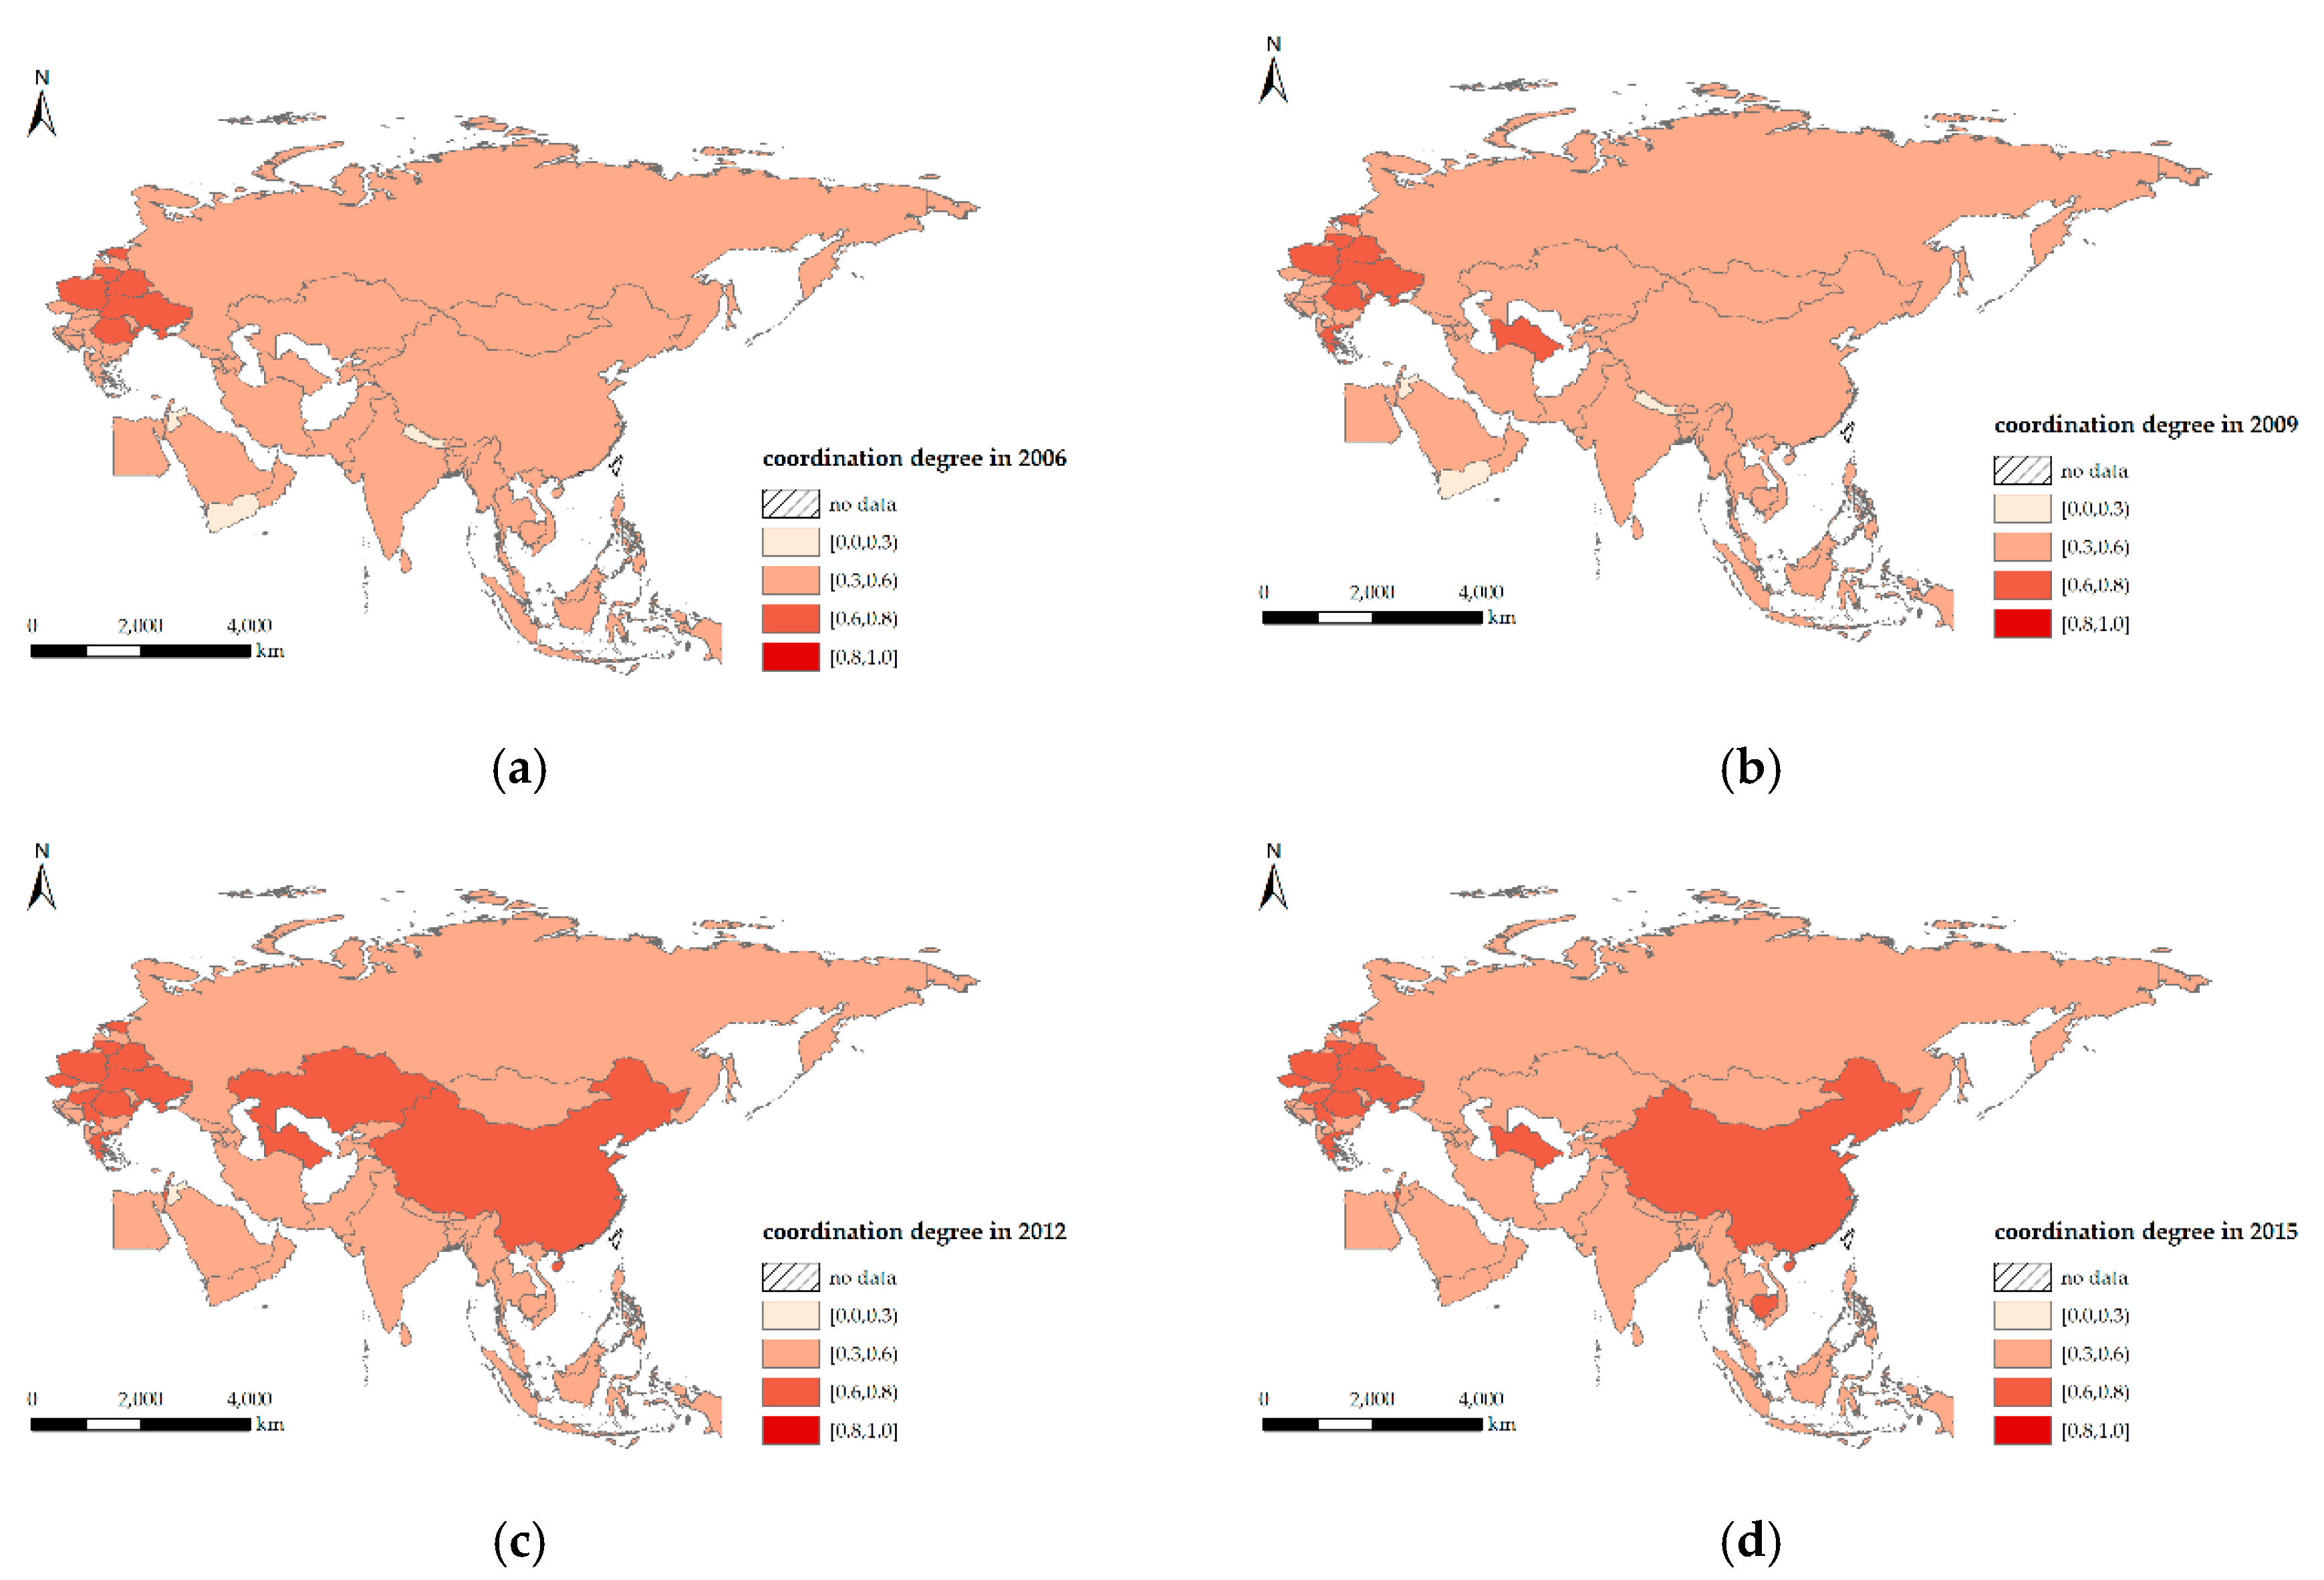
5. Coordination Degree among Agricultural Subsystems

The coordination degree of the sustainable development system directly affects the sustainable development capability. The coordination degree refers to a virtuous circle situation formed by the collaboration, coordination, and promotion of each subsystem element or system in order to achieve the overall evolution goal of the system [64]. The key to implementing green production modes and enhancing the sustainable development capability of agriculture lies in the coordinated development of all aspects and the coordination degree among subsystems. Thus, based on the analysis of the spatial and temporal evolution of sustainable development of agriculture along the B&R route, this paper calculates the degree of coupling between the five subsystems of sustainable development of agriculture by means of the system coordination degree.
The calculation formula of the system coordination degree is:
D = 1 S / M
where M represents the average of the sustainable development capability of each subsystem in a specific year, while S means the standard deviation. D represents the system coordination degree. That is, the bigger the value of D , the better the coordination among the subsystems. On the contrary, with lower values of D , the worse the coordination is. By using the formula of the system coordination degree, the capability of agricultural sustainable development of the countries along the B&R route during the period from 2006 to 2015 was calculated and is listed in Table 3.
On the basis of references to related research [65], the coordination types of the agricultural sustainable development subsystem are divided into four categories: (1) Low coupling coordination while 0 < D 0.3 ; (2) medium coupling coordination while 0.3 < D 0.6 ; (3) high coupling coordination while 0.6 < D 0.8 ; and (4) extreme coupling coordination while 0.8 < D 1 . In order to more intuitively display the spatial dynamic evolution of the coordination degree of agricultural sustainable development, this paper selects the coordination degree in selected countries in 2006, 2009, 2012, and 2015 as an illustration and shows them in Figure 4.
As shown in Figure 4a, in 2006, there were four countries along the B&R route, namely Brunei, Jordan, Nepal, and Yemen, whose coordination degree among subsystems of agriculture was in the interval [0.0,0.3]. In the interval [0.3,0.6], there were 43 countries, such as Albania, Armenia, Bangladesh, Bulgaria, Bosnia and Herzegovina, Bhutan, and China (mainland). The remaining six countries, namely Belarus, Estonia, Lithuania, Poland, Romania, and Ukraine, belonged to the interval [0.6,0.8]. However, no country was in the state of extreme coupling coordination.
In 2009, as can be seen in Figure 4b, there were only three countries, namely Jordan, Nepal, and Yemen, whose coordination degree among subsystems of agriculture was in the interval [0.0,0.3], while 42 countries, such as Albania, Armenia, Bangladesh, Bulgaria, Brunei, Bhutan, and Cyprus, were in the interval [0.3,0.6]. In addition, in the interval [0.6,0.8], there were eight countries, namely Belarus, Estonia, Greece, Lithuania, Poland, Romania, Turkmenistan, and Ukraine. As in 2006, there was no country in the interval [0.8,1.0].
In 2012, there was only one country, Jordan, whose coordination degree among subsystems of agriculture was in the interval [0.0,0.3], while 38 countries, such as Albania, Armenia, Bangladesh, Bulgaria, Brunei, Bhutan, and Cyprus, were in the interval [0.3,0.6]. In addition, the remaining 14 countries, such as Belarus, China (mainland), the Czech Republic, Estonia, Israel, and Kazakhstan, belonged to the interval [0.6,0.8]. However, there was no country belonging to the intervals [0.0,0.3] and [0.8,1.0].
The circumstances in 2015 became even more distinct than before. In total, 40 countries, such as Armenia, Azerbaijan, Bangladesh, Brunei, Bhutan, Cyprus, and Egypt, had coordination degrees of each subsystem of agriculture in the interval [0.3,0.6]. In the interval [0.6,0.8], there were 13 countries, including Belarus, Czech, Hungary, Serbia, and Estonia. As in 2015, there was no country belonging to the intervals [0.0,0.3] and [0.8,1.0].
By analyzing the descriptive statistics mentioned above, it was found that seven countries, including Belarus, Estonia, Israel, Romania, and Lithuania, were in the state of high coupling coordination in the selected four typical years. Generally, these countries have a good industrial base, stable political situation, and rising economic development. Furthermore, the terrain in these countries is dominated by plains, so the water and land resources are abundant. With the high level of science and technology and labor quality, the matching and coupling degree of agricultural subsystems in these countries is in a good state. There were 34 countries, such as Armenia, Azerbaijani, Bangladesh, Bhutan, and Cyprus, in the state of medium coupling coordination in the selected four typical years. Among them, Armenia, Georgia, Oman, and Mongolia, among other countries, have many plateaus and mountainous areas with small arable land areas. The economic foundation in these countries is weak, so the coordination degree of agricultural subsystems is not high. In addition, the sustainable development of agriculture in Egypt, Iran, and Pakistan, among other countries, is deeply affected by political turmoil. Besides, Bangladesh, India, and Thailand, among other countries, account for a high proportion of arable land, but they lack investment in agriculture and have low levels of mechanization and science and technology. Thus, the different situations of the different countries mentioned above mean that their degrees of coordination are not high. Brunei, Jordan, Nepal, and Yemen are the four countries that have entered the moderate coupling coordination from the low coupling coordination. Though these four countries have low agricultural labor force and low productivity, their natural resources are abundant. Furthermore, the construction of the B&R also provides an important opportunity for the development of their own economy. In addition, as the overall level of economic development tends to rise in China (mainland), Greece, Hungary, and the Czech Republic and their governments invest a lot of money in supporting agricultural development, these countries moved from moderate to highly coupled coordination during the period from 2006 to 2015.
To sum up, during the time period from 2006 to 2015, there was no country along the B&R route whose coordination degree of each subsystem of agriculture belonged to the interval [0.8,1.0], and most of them belonged to the interval [0.3,0.6]. In terms of quantity, the number of countries belonging to the interval [0.6,0.8] showed an increasing trend, but, overall, it was relatively small. The above findings show that the comprehensive level of agricultural sustainable development in various countries along the B&R route has been improved in recent years, but the problem is still outstanding. Therefore, there is a need to strengthen coordination among the sustainability of subsystems.

6. Influencing Factors of Sustainable Development Capability of Agriculture

6.1. Variable Selection

There are many factors affecting the sustainable development of agriculture. In order to further explore the dynamic changes of the influencing factors of agricultural sustainable development capability, according to the previous theoretical research [66,67,68,69,70] and data availability, the capability of agricultural sustainable development must be taken as the dependent variable. Meanwhile, the level of economic development, financial expenditure for agriculture, agricultural foreign direct investment, agricultural labor force, the intensity of agricultural R&D investment, and the level of agricultural informatization must be taken as the independent variables. Then, the dynamic changes of spatial heterogeneity affected by various factors mentioned above on agricultural sustainable development capacity must be compared and analyzed.

6.1.1. The Level of Economic Development

A country’s agricultural labor productivity is closely related to its productivity and the level of economic development. Thus, the low level of economic development in a country makes it difficult to provide strong support for the sustainable development of agriculture in terms of facilities, technology, disaster prevention, and disaster relief. On the contrary, higher levels of economic development are more conducive to improving agricultural labor productivity, increasing farmers’ agricultural income, and promoting the transformation of agriculture from extensive development to intensive development. Economic development is related to emissions from environmental pollution and the process of agricultural sustainable development across the globe [71,72,73,74]; thus, per capita GDP was used and noted as PCGDP in this paper to indicate the level of economic development of a country or region.

6.1.2. Financial Expenditure for Agriculture

Agriculture is a weak industry with high social efficiency and low comparative benefit [75]. With the low direct economic benefit and the long payback period of investment, it needs financial support from the government through subsidies, compensation, and other means. However, some countries have had the idea of laying stress on industry at the expense of agriculture. Thus, the financial support for agriculture is seriously inadequate, resulting in backward means of agricultural science and technology. In addition, the popularization and application of new agricultural varieties and technologies are very slow. Furthermore, the local talents of agricultural science and technology are insufficient and constantly diminishing, which ultimately affects the sustainable development of agriculture. Meanwhile, the excessive agricultural financial expenditure is not conducive to the construction of modern agriculture, so the proportion of agricultural financial expenditure must be effectively combined with the overall level of social development [76,77]. Thus, the financial expenditure for agriculture, noted as FEA, was selected in this paper.

6.1.3. Agricultural Foreign Direct Investment

Agricultural foreign direct investment, noted as AFDI, plays a positive role in promoting agricultural GDP and agricultural exports. Thus, investment is indispensable to the development of agricultural economy [78,79,80]. For instance, attracting foreign investment in agriculture and other related industries will greatly promote the increase of agricultural capital stock and make up for the shortage of domestic capital in agricultural investment. Furthermore, the introduction of agricultural foreign direct investment brings advanced production technology and management experience and thus enhances the competitiveness of agriculture and the sustainable development capability.

6.1.4. Agricultural Labor Force

Agricultural labor is the foundation of agriculture and the existence and development of the entire national economy and society [81]. In areas where agricultural labor force is scarce, with the expansion of the agricultural labor force, it will promote the mechanization and scale of agricultural production and thus increase the per capita gross agricultural production value. However, a relative surplus of the agricultural labor will lead to a decline in enthusiasm for agricultural production and further lead to a decline in the per capita gross agricultural production value. The number of the agricultural labor force population, noted as ALF, was used to measure the scale of the agricultural labor force in this paper.

6.1.5. The Intensity of Agricultural R&D Investment

Technological progress is a crucial factor in economic growth, as well as in agricultural growth and development. That is, to promote the sustainable development of agriculture, the key measure is to increase investment in technological research and development of agriculture [82,83,84,85] and then to use advanced technology to coordinate the relationship between agricultural development and environment, resource utilization, and protection. The ultimate goal is to realize a virtuous cycle of ecology and economy and transform traditional agriculture into a sustainable development mode. In this paper, the proportion of agricultural R&D investment to total R&D investment was used and marked as IARDI to measure the intensity of agricultural R&D investment.

6.1.6. The Level of Agricultural Informatization

As an important symbol of agricultural modernization in the 21st century, the development of digital agriculture and related technologies is inevitable for all countries in the world to develop modern agriculture [86,87,88,89,90]. The improvement of the informatization level will help agriculture change from traditional industry relying mainly on experience to modern industry relying on high and new technology. It will also promote the strategic adjustment of the rural economic structure and then improve the comprehensive agricultural production capacity and sustainable development capacity. In this paper, the level of agricultural informatization was measured by the number of secure Internet servers per million people, noted as LAI.

6.2. Construction of the Model

Because the spatial factors are not taken into account, the application of the traditional linear regression model deviates greatly. Thus, the application of GWR solves some problems [91,92]. GWR is based on the estimation of a regression coefficient function to explore and analyze the spatial nonstationary characteristics of the regression relationship. In addition, geographical location is added to the regression coefficient to analyze the characteristics of the regression relationship changing with spatial location. However, GWR only embeds the geographic location parameters into the model to form a model with spatial characteristics and does not consider the time characteristics of actual problems. Therefore, in order to incorporate the temporal and spatial characteristics of data into the regression model for analysis, GTWR [93,94] was applied to analyze the spatial–temporal characteristics of regression. GTWR has the basic characteristics of a general variable coefficient model. In addition, as a kind of GWR, it still has the advantage of a high fitting degree of a local regression model. Hence, GTWR can accurately explain spatial phenomena and reflect the differences of geographical location. In this paper, logarithmic transformation of raw data was carried out before applying the GTWR model in order to reduce heteroscedasticity.
The general model of GTWR is as follows:
y i = β 0 ( u i , v i , t i ) + k = 1 d β k ( u i , v i , t i ) x i k + ε i , i = 1 , 2 , , n
where ( y i , x i 1 , x i 2 , , x i d ) ( i = 1 , 2 , , n ) represents the observations of the dependent variable y i and the independent variables ( x 1 , x 2 , , x d ) at the i t h observation point ( u i , v i , t i ) . β k ( u i , v i , t i ) ( k = 0 , 1 , 2 , d ) represents the unknown parameter at the i t h observation point ( u i , v i , t i ) and is the arbitrary function of ( u i , v i , t i ) . ε i ( i = 1 , 2 , , n ) is an independent and identically distributed error term and is usually assumed to obey the N ( 0 , σ 2 ) distribution. As required, the dependent and independent variables applied in GTWR were used in logarithmic forms. Therefore, we used elasticity to express the meaning of the regression coefficients of the independent variables.

6.3. Model Operation Results

This paper mainly used ArcGIS 10.4.1 to realize the coefficient estimation of GTWR model based on the attributes of time and space. The influences of the selected variables on sustainable development capability in agriculture show great heterogeneity in the attributes of time and space. In order to analyze the distribution of each influencing factor more clearly, it is necessary to divide time and space effectively. Therefore, the descriptions of the estimated coefficients are listed in Table 4, while the coefficient distribution of each influencing factor in 2006 and 2015 are shown in Figure 5. Generally speaking, the regression coefficients of most regions were consistent with expectations, which shows that the influencing factors selected in this paper were reasonable. The value of adjusted R2 of GTWR reaches 0.9356, which indicates that the GTWR model is suitable for the measurement of the influences of independent variables on the dependent variable. Furthermore, the optimal bandwidth is determined based on the space–time weight function of the Gauss function method and cross validation while applying the GTWR model. Generally speaking, the distribution characteristics of each influencing factor are different in different time and geographical ranges. Therefore, there are great differences among countries when studying the sustainable development capability of agriculture in various regions. Moreover, it is necessary to consider the spatial and temporal heterogeneity of the local agricultural sustainable development capability.

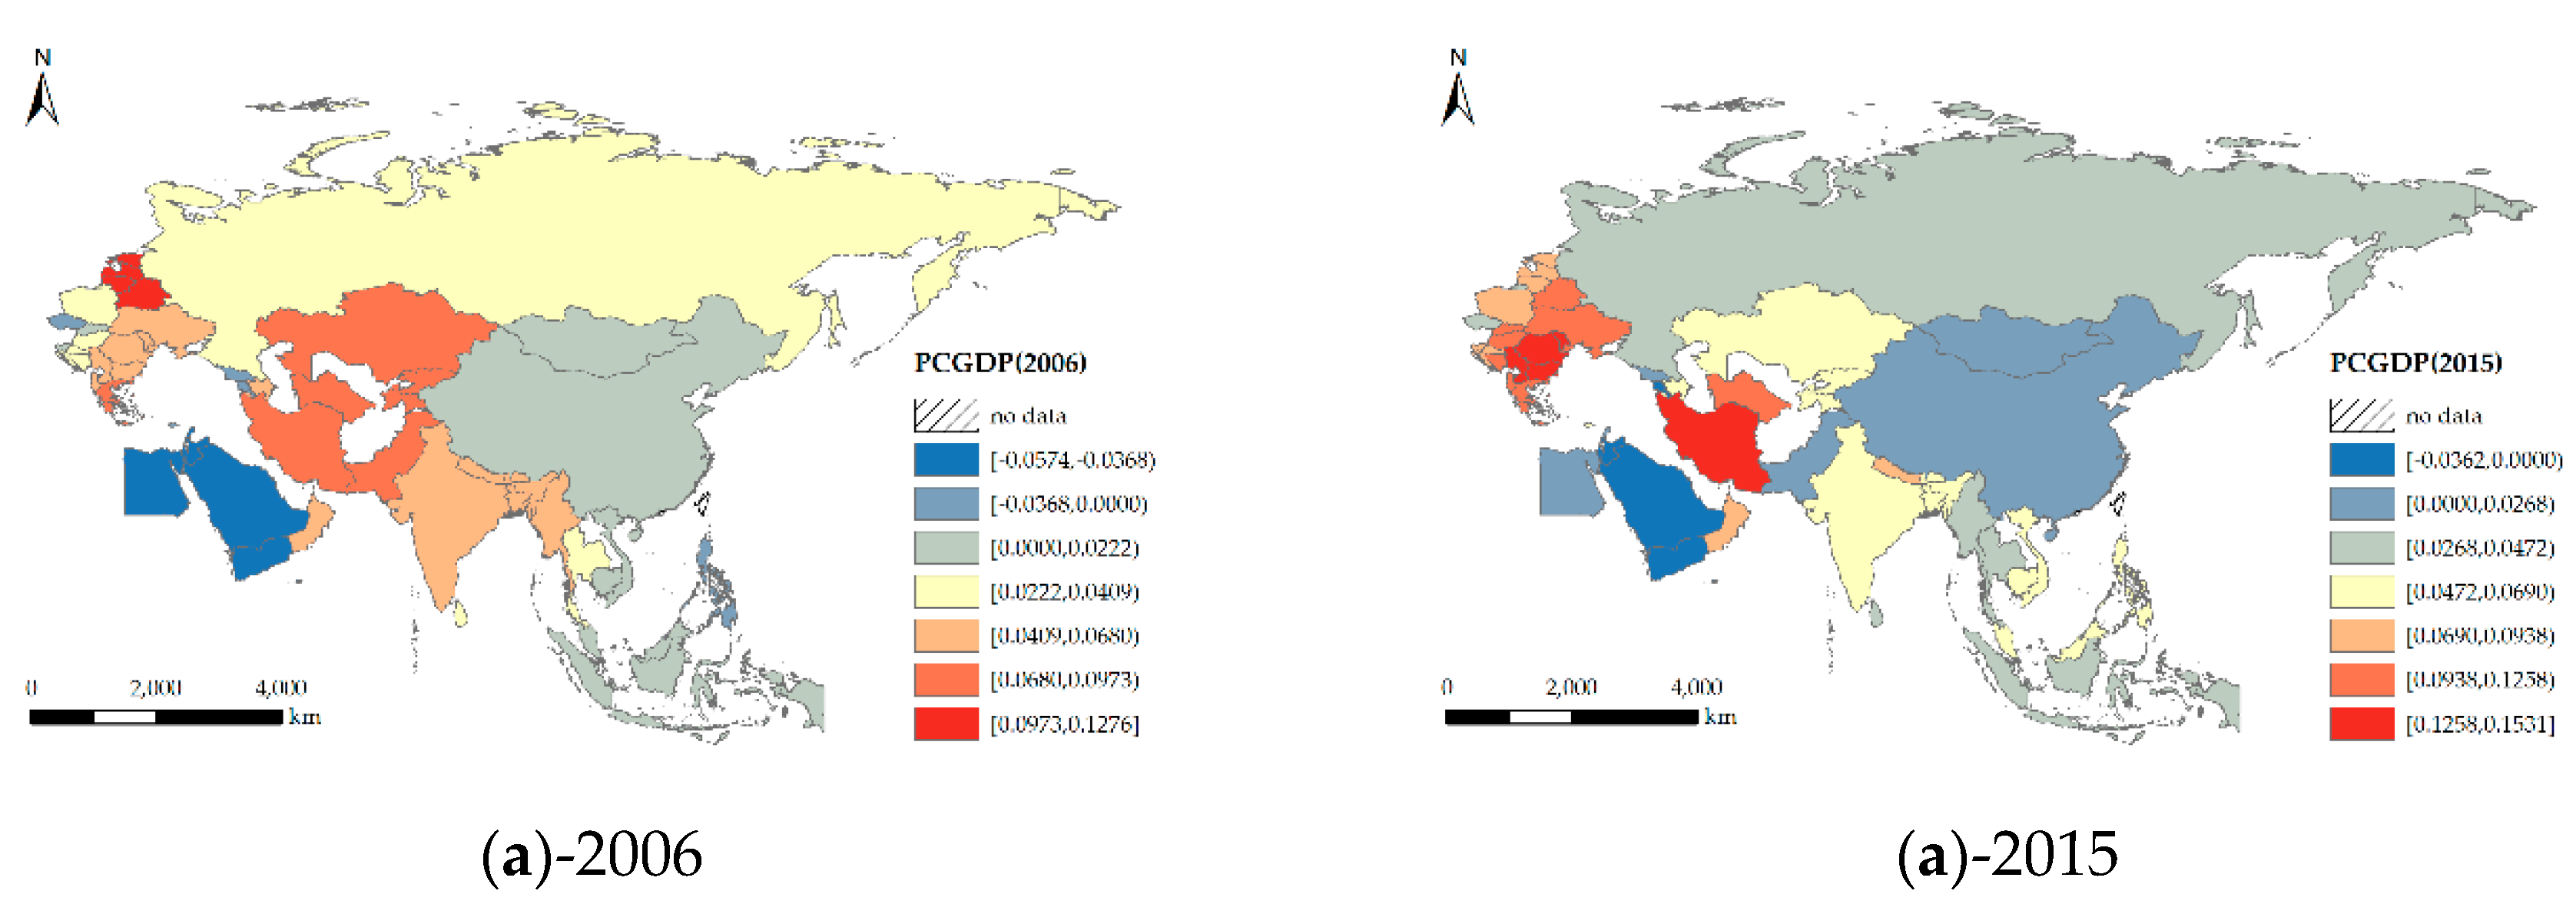
6.3.1. The Influence of PCGDP on Sustainable Development Capability in Agriculture

As shown in Table 4, when PCGDP increases by 1%, the sustainable development capability in agriculture will increase by 0.0485% on average in the same direction. However, PCGDP had a strong negative influence on the sustainable development capability of agriculture in many countries along the B&R route both in 2006 and 2015. The sustainable development of agriculture is constrained by the overall economic development level of a society; that is, the developed economy can continue to drive rural productivity upward, while the weak economic foundation hinders the speed of agricultural development. Therefore, as can be seen in Figure 5a, PCGDP has larger regression coefficients in South Asia, Central Asia, and Eastern Europe than in other countries for 2015. It is worth noting that in economic development, countries should not rely on disorderly means of economic development; instead, they should fully consider green development and ecological protection so as to effectively achieve agricultural sustainable development.

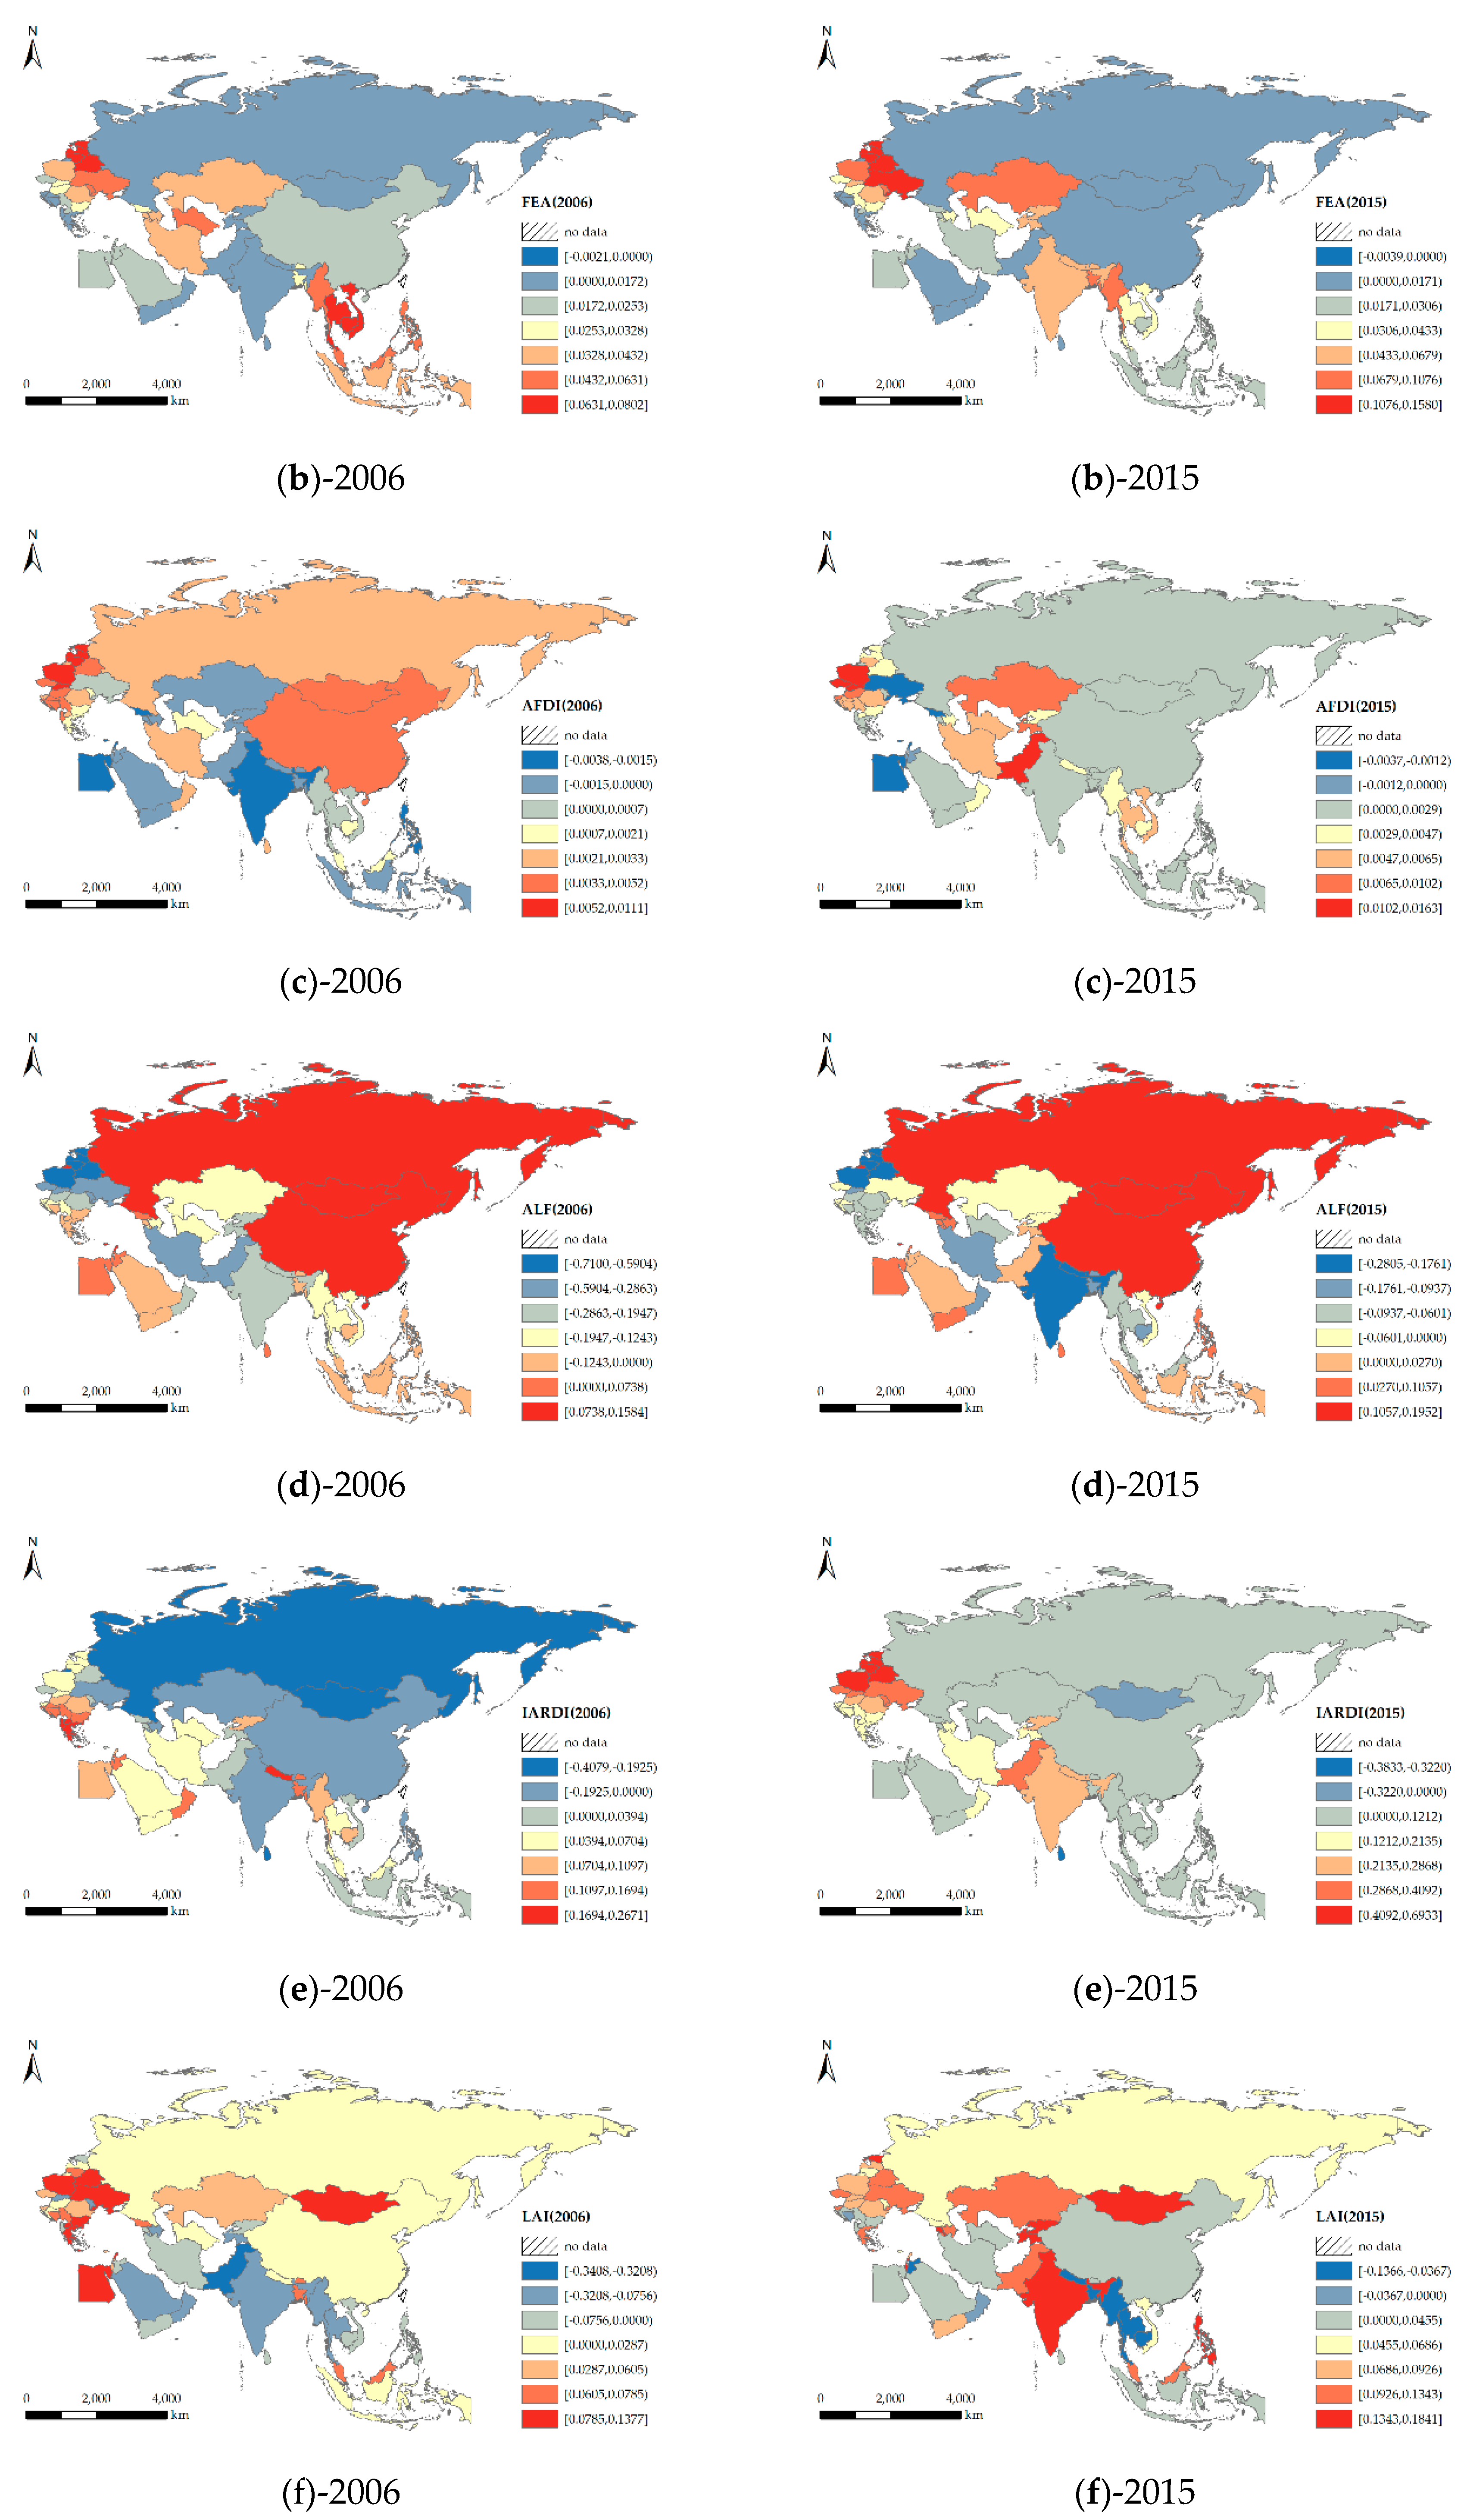
6.3.2. The Influence of FEA on Sustainable Development Capability in Agriculture

As shown in Table 4 and Figure 5b, the influence of FEA on sustainable development capability in agriculture is mainly positive. When FEA changes by 1%, the average change in the amplitude of sustainable development capability in agriculture is 0.0336%. From the perspective of spatial distribution, the negative effects only occur in the Maldives and Bangladesh for 2015. Financial expenditure for agriculture is one of the effective means for the government to promote agricultural development and increase farmers’ income. In recent years, although China’s total amount of financial investment in agriculture has increased substantially, the proportion of financial expenditure has shown a downward trend. Besides, there are several problems in financial expenditure, such as inefficient use of funds and unreasonable structure. In addition, as affected by the continued economic downturn, agricultural financial expenditure in some countries in Southeast Asia decreased in 2015. Overall, there is no significant difference in the spatial distribution of influences between 2006 and 2015. Therefore, when governments increase financial investment for agriculture, it must rationally increase the scale of expenditures and adjust and optimize the structure of fiscal expenditures in order to maximize its positive effects.

6.3.3. The Influence of AFDI on Sustainable Development Capability in Agriculture

As can be seen in Figure 5c, the agriculture foreign direct investment in South Asia and Southeast Asia hindered sustainable development capability in agriculture in 2006 and 2015. However, the influence changed into a positive one in East Asia. Table 4 shows that the positive effects of AFDI on sustainable agricultural development capability are significant, but the regression coefficient is minimal. This is mainly because the manufacturing and service industries are the main industries that attract foreign investment, while the proportion of enterprises and funds invested in agriculture is extremely low. From a global perspective, the scope of foreign-invested agriculture is dominated by agricultural product processing projects. The projects that significantly promote the sustainable development of agriculture, such as the development and utilization of barren hills and wasteland and the improvement of agricultural product varieties, find it difficult to attract foreign investment due to large investment in the early stage, high investment risk, and long payback period.

6.3.4. The Influence of ALF on Sustainable Development Capability in Agriculture

Overall, the influence of ALF on sustainable development capability in agriculture is mainly negative. Combining the results of Table 4 and Figure 5d, the positive influence of ALF on sustainable development capability in agriculture was stronger in East Asia and Southeast Asia in 2006 than that of other countries. Furthermore, ALF in Europe, South Asia, and Central Asia shows significant negative effects, especially in India. India’s agricultural labor force accounts for 72% of the total labor force. Therefore, the sustained growth of the population has brought tremendous pressure on resources and the environment. Too much or too little agricultural labor force is not conducive to the sustainable development of agriculture. Thus, the global population should be effectively controlled, especially the quantity of workers engaged in primary agricultural production, while a high-quality workforce is cultivated.

6.3.5. The Influence of IARDI on Sustainable Development Capability in Agriculture

IARDI mainly promotes the sustainable development capability in agriculture in most of the countries, which shows the importance of the intensity of agricultural R&D investment. However, it hindered agricultural sustainable development in China (mainland), Russia, India, Kazakhstan, Sri Lanka, and Ukraine in 2006. The areas restricted by IARDI in 2015 were only Sri Lanka, the Maldives, and Mongolia. In order to achieve the high-quality and sustainable development of agriculture, these countries must rely on scientific and technological innovation to break through the constraints of resources and environment, and then they must promote the transformation of agricultural efficiency and improve the total productivity of agriculture. Therefore, it is necessary to further enhance the intensity of R&D investment to promote the development of agricultural technology and further realize the mechanization and automation of agriculture.

6.3.6. The Influence of LAI on Sustainable Development Capability in Agriculture

The level of agricultural informatization in various countries increased with time between 2006 to 2015. Its positive influence on the sustainable development of agriculture also increased. By 2015, except for some countries in Southeast Asia, the level of informatization had shown a positive effect on the development of agricultural economy. The application of information technology to guide agricultural production activities can help agricultural workers use advanced technology for agricultural production and inject new vitality into agricultural development. Promoting the sustainable development of agriculture based on agricultural informatization is an inevitable trend in the future.

7. Conclusions and Discussion

This paper mainly focused on the calculation of the comprehensive score of the sustainable development capacity of agriculture and the coordination degree of the agricultural subsystem in the countries along the B&R route and the use of GTWR to analyze the mechanism of the factors affecting the sustainable development of agriculture. The conclusion of the study shows that the comprehensive score of sustainable development of agriculture initially decreased, then increased in a fluctuating manner, and finally fell again in the time dimension. In the spatial dimension, the evolutionary trend of ‘high–low–high–low–high’ from west to east was generally presented, and the basic spatial pattern of ‘W’ type was obvious. In addition, there was no country along the B&R route whose coordination degree of each subsystem of agriculture demonstrated extreme coupling coordination, and most of them demonstrated medium coupling coordination. The results also show that the regression coefficients of each explanatory variable were either positive or negative in 53 countries, which indicates that the influence factors of agricultural sustainable development capacity have the characteristics of geospatial nonstationarity.
Based on the above conclusions, we believe that the enhancement of sustainable development capability of agriculture in the countries along the B&R route should be the focus of attention at present so as to finally achieve effective coupling and coordination of agricultural subsystems. Therefore, some feasible measures can be taken to achieve the ultimate goals of sustainable development of agriculture. These measures are as follows:
(1) Sustainable development of agriculture can improve total food production and enhance agriculture productivity. The additional positive impacts on natural, social, and human capital also help to build the material base so as to sustain these improvements in the future [95,96]. Therefore, the sustainable development capability of agriculture of the countries along the B&R route should be improved. International cooperation in agriculture is an important way to utilize domestic and foreign resources to develop high-efficiency agriculture and improve the level of agricultural modernization and sustainable development [97]. On the basis of the B&R Initiative, the countries along the B&R route have faced important opportunities for foreign cooperation in agriculture. Therefore, deepening the cooperation with the agricultural countries along the B&R route will help to promote the complementarity of agricultural resources among the countries along the B&R route, ensure national food security, promote agricultural science and technology innovation, and improve the sustainable development capability of agriculture [4].
(2) The governments should improve the capability of agricultural sustainable development according to local conditions; that is, the spatial heterogeneity needs to be fully taken into account. There are great differences in the natural conditions, natural resources, and infrastructure construction of agricultural sustainable development in different countries. Most countries in Southeast Asia and Europe have a small territory area and a limited arable land area. Therefore, on this basis, the governments should prioritize high-level and new technology as the means to develop agriculture in order to improve agricultural ecological efficiency and yield efficiency. By contrast, although the territory area and arable land in East Asia and Central Asia are relatively large, the financial support for agriculture and scientific and technological investment are relatively inadequate [98]. Thus, the governments need to increase the intensity of financial investment and scientific research while striving to improve the level of economic development. Furthermore, climatic change and land degradation are the most serious threats affecting the sustainability of land resources in the region of West Asia and North Africa. Therefore, West Asia is one of the most import-reliant agricultural industries in the world [99]. By improving soil and water management and conservation, as well as nonstructural measures such as crop insurance, countries can reduce the impact of climate change on agriculture and improve agricultural sustainable development capacity.
(3) The coordination of the sustainable capability of agricultural subsystems of the countries along the B&R route should be enhanced. Though the degree of coordination among the agricultural subsystems of the countries along the B&R route has improved from 2006 to 2015, the overall level of development needs to be further improved. From the correlation and correspondence analyses, it was concluded that the top-performing countries do not necessarily have top performance in all five sustainability dimensions, and vice versa; the bottom-performing countries do not necessarily have the lowest performance in all five dimensions. The agricultural sustainable system can be operated in a benign manner only if the balance of all five dimensions is reached, while a high level of sustainability in one dimension makes it very difficult to reach a high level of sustainability overall [100]. It is especially important that the possible contradictions between the five subsystems’ objectives be resolved if harmonic and sustainable agricultural development is to be achieved [101]. Where this is the case, the concept of sustainability refers to the need to strike the right balance between its five dimensions; the progress of one sustainability dimension must not be achieved at the expense of the deterioration of the others [102].

Author Contributions

Conceptualization, Y.C.; investigation, M.L. and J.W.; methodology and manuscript, Y.C. and M.L. All authors read and approved the final manuscript.

Funding

This study was funded by The National Social Science Fund of China (grant NO. 18BGL018).

Conflicts of Interest

The authors declare that they have no conflict of interest.

References

  1. Daemane, M.M.M.; Mot’soene, K.A.; Nyawo-Shava, V.Z. Agricultural marketing cooperatives in developing society in relation to poverty alleviation and sustainable development: The case of Lesotho. Ann. Humanit. Dev. Stud. 2010, 1, 436–476. [Google Scholar]
  2. Akin, U. Urban agriculture: An instrument for sustainable urban development in the metropolitan city of Istanbul. J. Environ. Prot. Ecol. 2011, 12, 2245–2254. [Google Scholar]
  3. Calicioglu, O.; Flammini, A.; Bracco, S.; Bellù, L.; Sims, R. The future challenges of food and agriculture: An integrated analysis of trends and solutions. Sustainability 2019, 11, 222. [Google Scholar] [CrossRef]
  4. Liu, N. Great agricultural potential for cooperation between China and Belt and Road countries. China’s Foreign Trade 2017, 23, 46–47. [Google Scholar]
  5. Harwood, R.R. A history of sustainable agriculture. In Sustainable Agricultural Systems; CRC Press: Boca Raton, FL, USA, 1990; pp. 3–19. [Google Scholar]
  6. Crews, T.E.; Mohler, C.L.; Power, A.G. Energetics and ecosystem integrity: The defining principles of sustainable agriculture. Am. J. Altern. Agric. 2009, 6, 146–149. [Google Scholar] [CrossRef]
  7. Spann, M. Politics of poverty: The post-2015 sustainable development goals and the business of agriculture. Globalizations 2017, 14, 1–19. [Google Scholar] [CrossRef]
  8. Koboević, Ž.; Kurtela, Ž.; Vujičić, S. The maritime Silk Road and China’s Belt and Road initiative. Naše More-Znanstveni Časopis Za More I Pomorstvo 2018, 65, 113–122. [Google Scholar]
  9. Kamel, M.S. China’s Belt and Road initiative: Implications for the Middle East. Camb. Rev. Int. Aff. 2018, 31, 1–20. [Google Scholar] [CrossRef]
  10. Zhao, D.; Liu, C.; Bao, B.; Bo, X.U. Agricultural sustainable development ability evaluation and subsystem coordination degree analysis: Take the major grain-producing areas of China as an example. Econ. Geogr. 2018, 38, 157–163. (In Chinese) [Google Scholar]
  11. Wang, Q.; Yuan, X.; Cheng, X.; Mu, R.; Zuo, J. Coordinated development of energy, economy and environment subsystems—A case study. Ecol. Indic. 2014, 46, 514–523. [Google Scholar]
  12. Grundey, D. Semantics of sustainable agriculture development: Re-conceptualising content and definitions. Actual Probl. Econ. 2012, 131, 41–54. [Google Scholar]
  13. Shi, T.; Gill, R. Developing effective policies for the sustainable development of ecological agriculture in China: The case study of Jinshan County with a systems dynamics model. Ecol. Econ. 2005, 53, 223–246. [Google Scholar] [CrossRef]
  14. Wang, X.B.; Liu, W.N.; Wu, W.L. A holistic approach to the development of sustainable agriculture: Application of the ecosystem health model. Int. J. Sustain. Dev. World 2009, 16, 339–345. [Google Scholar] [CrossRef]
  15. Nhemachena, C.; Matchaya, G.; Nhemachena, C.R.; Karuaihe, S.; Muchara, B.; Nhlengethwa, S. Measuring baseline agriculture-related sustainable development goals index for Southern Africa. Sustainability 2018, 10, 849. [Google Scholar] [CrossRef]
  16. Palanisamy, K.; Parthasarathy, K. Urbanization, food insecurity and agriculture—Challenges for social sustainable development. Probl. Ekorozw. 2016, 11, 157–161. [Google Scholar]
  17. Zhao, Q.G.; Xu, M.J. Sustainable agriculture evaluation for red soil hill region of southeast China. Pedosphere 2004, 14, 313–321. [Google Scholar]
  18. Wang, Q.S.; Yuan, X.L.; Zhang, J.; Gao, Y.; Hong, J.L.; Zuo, J.; Liu, W. Assessment of the sustainable development capacity with the entropy weight coefficient method. Sustainability 2015, 7, 13542–13563. [Google Scholar] [CrossRef]
  19. Lindblom, J.; Lundstrom, C.; Ljung, M.; Jonsson, A. Promoting sustainable intensification in precision agriculture: review of decision support systems development and strategies. Precis. Agric. 2017, 18, 309–331. [Google Scholar] [CrossRef]
  20. Mahanty, T.; Bhattacharjee, S.; Goswami, M.; Bhattacharyya, P.; Das, B.; Ghosh, A.; Tribedi, P. Biofertilizers: A potential approach for sustainable agriculture development. Environ. Sci. Pollut. R. 2017, 24, 3315–3335. [Google Scholar] [CrossRef] [PubMed]
  21. Kasem, S.; Thapa, G.B. Sustainable development policies and achievements in the context of the agriculture sector in Thailand. Sustain. Dev. 2012, 20, 98–114. [Google Scholar] [CrossRef]
  22. Malschi, D.; Tritean, N.; Serbanescu, R. Protective agroforestry belts and their environmental importance for sustainable agriculture development in Transylvania. Rom. Agric. Res. 2010, 27, 103–114. [Google Scholar]
  23. Fleury, P.; Petit, S.; Dobremez, L.; Schermer, M.; Kirchengast, C.; De Ros, G.; Magnani, N.; Struffi, L.; Mieville-Ott, V.; Roque, O. Implementing sustainable agriculture and rural development in the European alps assets and limitations of local projects based on multi-stakeholder participation. Mt. Res. Dev. 2008, 28, 226–232. [Google Scholar] [CrossRef]
  24. Granvik, M.; Lindberg, G.; Stigzelius, K.A.; Fahlbeck, E.; Surry, Y. Prospects of multifunctional agriculture as a facilitator of sustainable rural development: Swedish experience of Pillar 2 of the Common Agricultural Policy (CAP). Nor. Geogr. Tidsskr.-Nor. J. Geogr. 2012, 66, 155–166. [Google Scholar] [CrossRef]
  25. Yi, T.; Xiang, P.A. Emergy analysis of paddy farming in Hunan Province, China: A new perspective on sustainable development of agriculture. J. Integr. Agr. 2016, 15, 2426–2436. [Google Scholar] [CrossRef]
  26. Galt, R.E.; Parr, D.; Jagannath, J. Facilitating competency development in sustainable agriculture and food systems education: A self-assessment approach. Int. J. Agr. Sustain. 2013, 11, 69–88. [Google Scholar] [CrossRef]
  27. George, D.; Clewett, J.; Birch, C.; Wright, A.; Allen, W. A professional development climate course for sustainable agriculture in Australia. Environ. Educ. Res. 2009, 15, 417–441. [Google Scholar] [CrossRef]
  28. Migliorini, P.; Lieblein, G. Facilitating transformation and competence development in sustainable agriculture nniversity education: An experiential and action oriented approach. Sustainability 2016, 8, 1243. [Google Scholar] [CrossRef]
  29. Li, G.P. Thought and practice of sustainable development in Chinese traditional agriculture. China Agr. Econ. Rev. 2009, 1, 97–109. [Google Scholar]
  30. Brown, T. Civil society organizations for sustainable agriculture: Negotiating power relations for pro-poor development in India. Agroecol. Sustain. Food 2016, 40, 381–404. [Google Scholar] [CrossRef]
  31. Yang, S.Q.; Mei, X.R. A sustainable agricultural development assessment method and a case study in China based on Euclidean distance theory. J. Clean Prod. 2017, 168, 551–557. [Google Scholar] [CrossRef]
  32. Sattler, C.; Nagel, U.J.; Werner, A.; Zander, P. Integrated assessment of agricultural production practices to enhance sustainable development in agricultural landscapes. Ecol. Indic. 2010, 10, 49–61. [Google Scholar]
  33. Bastan, M.; Khorshid-Doust, R.R.; Sisi, S.D.; Ahmadvand, A. Sustainable development of agriculture: A system dynamics model. Kybernetes 2018, 47, 142–162. [Google Scholar] [CrossRef]
  34. Sun, L.Y.; Miao, C.L.; Yang, L. Ecological-economic efficiency evaluation of green technology innovation in strategic emerging industries based on entropy weighted TOPSIS method. Ecol. Indic. 2017, 73, 554–558. [Google Scholar] [CrossRef]
  35. Dos Santos, B.M.; Godoy, L.P.; Campos, L. Performance evaluation of green suppliers using entropy-TOPSIS-F. J. Clean Prod. 2019, 207, 498–509. [Google Scholar] [CrossRef]
  36. Liu, D.J.; Li, L. Application study of comprehensive forecasting model based on entropy weighting method on trend of PM2.5 concentration in Guangzhou, China. Int. J. Env. Res. Pub. He 2015, 12, 7085–7099. [Google Scholar] [CrossRef]
  37. Delgado, A.; Romero, I. Environmental conflict analysis using an integrated grey clustering and entropy-weight method: A case study of a mining project in Peru. Environ. Modell Softw 2016, 77, 108–121. [Google Scholar] [CrossRef] [Green Version]
  38. Cui, Y.; Feng, P.; Jin, J.L.; Liu, L. Water resources carrying capacity evaluation and diagnosis based on set pair analysis and improved the entropy weight method. Entropy-Switz 2018, 20, 359. [Google Scholar] [CrossRef]
  39. Meleg, I.N.; Naparus, M.; Fiers, F.; Meleg, I.H.; Vlaicu, M.; Moldovan, O.T. The relationships between land cover, climate and cave copepod spatial distribution and suitability along the Carpathians. Environ. Conserv. 2014, 41, 206–216. [Google Scholar] [CrossRef]
  40. Song, W.; Jia, H.; Huang, J.; Zhang, Y. A satellite-based geographically weighted regression model for regional PM2.5 estimation over the Pearl River Delta region in China. Remote Sens. Environ. 2014, 154, 1–7. [Google Scholar]
  41. Su, S.L.; Xiao, R.; Zhang, Y. Multi-scale analysis of spatially varying relationships between agricultural landscape patterns and urbanization using geographically weighted regression. Appl. Geogr. 2012, 32, 360–375. [Google Scholar] [CrossRef]
  42. Huang, J.; Huang, Y.; Pontius, R.G.; Zhang, Z. Geographically weighted regression to measure spatial variations in correlations between water pollution versus land use in a coastal watershed. Ocean Coast. Manag. 2014, 103, 14–24. [Google Scholar]
  43. Maimaitijiang, M.; Ghulam, A.; Sandoval, J.; Maimaitiyiming, M. Drivers of land cover and land use changes in St. Louis metropolitan area over the past 40 years characterized by remote sensing and census population data. Int. J. Appl. Earth Obs. 2015, 35, 161–174. [Google Scholar] [CrossRef]
  44. Wu, C.Y.; Wei, Y.; Huang, X.J.; Chen, B.W. Economic transition, spatial development and urban land use efficiency in the Yangtze River Delta, China. Habitat Int. 2017, 63, 67–78. [Google Scholar] [CrossRef]
  45. Manca, G.; Attaway, D.F.; Waters, N. Program assessment and the EU’s agrienvironmental Measure 214: An investigation of the spatial dynamics of agrienvironmental policies in Sardinia, Italy. Appl. Geogr. 2014, 50, 24–30. [Google Scholar] [CrossRef]
  46. Fotheringham, A.S.; Crespo, R.; Yao, J. Geographical and temporal weighted regression (GTWR). Geogr. Anal. 2015, 47, 431–452. [Google Scholar] [CrossRef]
  47. Seok, J.H.; Moon, H.; Kim, G.; Reed, M.R. Is aging the important factor for sustainable agricultural development in Korea? Evidence from the relationship between aging and farm technical efficiency. Sustainability 2018, 10, 2137. [Google Scholar] [CrossRef]
  48. Bacior, S.; Prus, B. Infrastructure development and its influence on agricultural land and regional sustainable development. Ecol. Inform. 2018, 44, 82–93. [Google Scholar] [CrossRef]
  49. Ramos, T.B.; Caeiro, S. Meta-performance evaluation of sustainability indicators. Ecol. Indic. 2010, 10, 157–166. [Google Scholar] [CrossRef] [Green Version]
  50. Mili, S.; Martínez-Vega, J. Accounting for regional heterogeneity of agricultural sustainability in Spain. Sustainability 2019, 11, 299. [Google Scholar] [CrossRef]
  51. Olsson, J.A.; Bockstaller, C.; Stapleton, L.M.; Ewert, F.; Knapen, R.; Therond, O.; Geniaux, G.; Bellon, S.; Correira, T.P.; Turpin, N.; Bezlepkina, I. A goal oriented indicator framework to support integrated assessment of new policies for agri-environmental systems. Environ. Sci. Policy 2009, 12, 562–572. [Google Scholar] [CrossRef]
  52. Roy, R.; Chan, N.W. An assessment of agricultural sustainability indicators in Bangladesh: Review and synthesis. Environmentalist 2012, 32, 99–110. [Google Scholar] [CrossRef]
  53. Mauerhofer, V. 3-D sustainability: An approach for priority setting in situation of conflicting interests towards a sustainable development. Ecol. Econ. 2008, 64, 496–506. [Google Scholar] [CrossRef]
  54. Rasure, K.A. Sustainable agricultural development; Oxford Books Company: New Delhi, India, 2010. [Google Scholar]
  55. Seghezzo, L. The five dimensions of sustainability. Environ. Politics 2009, 18, 539–556. [Google Scholar] [CrossRef] [Green Version]
  56. Kelly, E.; Latruffe, L.; Desjeux, Y.; Ryan, M.; Uthes, S.; Diazabakana, A.; Dillon, E.; Finn, J.A. Sustainability indicators for improved assessment of the effects of agricultural policy across the EU: Is FADN the answer? Ecol. Indic. 2018, 89, 903–911. [Google Scholar] [CrossRef]
  57. Imran, S.; Alam, K.; Beaumont, N. Reinterpreting the definition of sustainable development for a more ecocentric reorientation. Sustain. Dev. 2014, 22, 134–144. [Google Scholar] [CrossRef]
  58. Yuan, J.H.; Qi, C.J. Dynamic assessment of regional agricultural sustainability of Hunan Province based on entropy method. Resour. Environ. Yangtze Basin 2013, 22, 152–157. (In Chinese) [Google Scholar]
  59. Zhang, X.; Wang, C.; Li, E.; Xu, C. Assessment model of ecoenvironmental vulnerability based on improved entropy weight method. Sci. World J. 2014, 2014, 1–7. [Google Scholar] [CrossRef] [PubMed]
  60. Azimifard, A.; Moosavirad, S.H.; Ariafar, S. Selecting sustainable supplier countries for Iran’s steel industry at three levels by using AHP and TOPSIS methods. Resour. Policy 2018, 57, 30–44. [Google Scholar] [CrossRef]
  61. Nan, J.; Chao, W.U.; Zhou, Q.L.; Xie, C.Y. Comprehensive Discrimination on Mined-out Area Through ITOPSIS Coupled with PSF. J. Northeast. Univ. 2016, 37, 24–29. (In Chinese) [Google Scholar]
  62. Yue, Z. A method for group decision-making based on determining weights of decision makers using TOPSIS. Appl. Math. Model. 2011, 35, 1926–1936. [Google Scholar] [CrossRef] [Green Version]
  63. Krzanowski, W.J. The Mahalanobis distance and Elliptic distributions. Biometrika 1985, 72, 464–467. [Google Scholar]
  64. Klein, D.; Orsborn, A. Concatenate coordination and mutual coordination. J. Econ. Behav. Organ. 2009, 72, 176–187. [Google Scholar] [CrossRef] [Green Version]
  65. Noe, E.; Alroe, H.F. Sustainable agriculture issues explained by differentiation and structural coupling using social systems analysis. Agron Sustain. Dev. 2015, 35, 133–144. [Google Scholar] [CrossRef]
  66. Song, B.; Zhao, T.; Chen, Y. Household water consumption and its influence factors in the agricultural and pastoral area, Tibet. Geogr. Res. 2016, 35, 1879–1886. (In Chinese) [Google Scholar]
  67. Schaible, G.D.; Mishra, A.K.; Lambert, D.M.; Panterov, G. Factors influencing environmental stewardship in US agriculture: Conservation program participants vs. non-participants. Land Use Policy 2015, 46, 125–141. [Google Scholar] [CrossRef]
  68. Ebrahimi, M.S.; Amini, A.M.; Bahrami, B. Factors affecting the ability of agricultural higher education graduates in Iran. Sci. J. Crop. Sci. 2013, 2, 159–163. [Google Scholar]
  69. Mamat, T.; Jumaway, M.; Zhang, X.; Hassan, M. Research on impact factors of agricultural mechanization development level based on BP neural network. J. Agric. Mech. Res. 2018, 40, 21–25. (In Chinese) [Google Scholar]
  70. Bosshaq, M.R.; Afzalinia, F.; Moradi, H. Measuring indicators and determining factors affecting sustainable agricultural development in rural areas—A case study of Ravansar, Iran. Int. J. Agrisci. 2012, 2, 477–495. [Google Scholar]
  71. Ramakrishnan, S.; Hishan, S.S.; Nabi, A.A.; Arshad, Z.; Kanjanapathy, M.; Zaman, K.; Khan, F. An interactive environmental model for economic growth: evidence from a panel of countries. Environ. Sci. Pollut. R 2016, 23, 14567–14579. [Google Scholar] [CrossRef]
  72. Weng, Z.X.; Dai, H.C.; Ma, Z.Y.; Xie, Y.; Wang, P. A general equilibrium assessment of economic impacts of provincial unbalanced carbon intensity targets in China. Resour. Conserv. Recy. 2018, 133, 157–168. [Google Scholar] [CrossRef]
  73. Gallego-Alvarez, I.; Fernandez-Gomez, M.J. Governance, environmental and economic factors: An international analysis. Environ. Policy Gov. 2016, 26, 29–44. [Google Scholar] [CrossRef]
  74. Tian, J.X.; Yang, H.L.; Xiang, P.A.; Liu, D.W.; Li, L. Drivers of agricultural carbon emissions in Hunan Province, China. Environ. Earth Sci. 2016, 75, 121. [Google Scholar] [CrossRef]
  75. Yao, S. Cointegration analysis of agriculture and non-agricultural sectors in the Chinese economy 1952-92. Appl. Econ. Lett. 2010, 1, 227–229. [Google Scholar] [CrossRef]
  76. Meng, Z.X.; Meng, H.S. The empirical analysis of the relationship between financial expenditure on agriculture and GDP growth in Shanxi Province. Chin. J. Agric. Resour. Reg. Plan. 2012, 479, 136–140. (In Chinese) [Google Scholar]
  77. Li, J.J. An analysis of the optimal-scale of expenditure on financial support to agriculture. Sci. Mosaic 2007, 100, 519–524. (In Chinese) [Google Scholar]
  78. Shah, A. Exploring sustainable production systems for agriculture: Implications for employment and investment under north-south trade scenario. Ecol. Econ. 2006, 59, 237–241. [Google Scholar] [CrossRef]
  79. Lay, J.; Nolte, K. Determinants of foreign land acquisitions in low- and middle-income countries. J. Econ. Geogr. 2018, 18, 59–86. [Google Scholar] [CrossRef]
  80. Bastiaens, I. Investing in agriculture: A preference for democracy or dictatorship? Br. J. Politics Int. Relat. 2016, 18, 946–965. [Google Scholar] [CrossRef]
  81. Dorward, A. Agricultural labour productivity, food prices and sustainable development impacts and indicators. Food Policy 2013, 39, 40–50. [Google Scholar] [CrossRef] [Green Version]
  82. Barnes, A.P. Publicly-funded UK agricultural R&D and ‘social’ total factor productivity. Agr. Econ.-Blackwell 2002, 27, 65–74. [Google Scholar]
  83. Tokgoz, S. Private agricultural R&D in the United States. J. Agr. Resour. Econ. 2006, 31, 212–238. [Google Scholar]
  84. Lee, J.; Koh, M.; Jeong, G. Analysis of the impact of agricultural R&D investment on food security. Appl. Econ. Lett. 2017, 24, 49–53. [Google Scholar]
  85. Xiao, Z.H.; Fulton, M. Underinvestment in producer-funded agricultural R&D: The role of the horizon problem. Can. J. Agr. Econ. 2018, 66, 55–86. [Google Scholar]
  86. Moon, J.; Hossain, M.D.; Kang, H.G.; Shin, J. An analysis of agricultural informatization in Korea: the government’s role in bridging the digital gap. Inf. Dev. 2012, 28, 102–116. [Google Scholar] [CrossRef]
  87. Liu, X.; Zhang, Z.R. An application of DEA model to measure the efficiency of ecological agricultural informatization in Heilong Jiang Province. Cust Agronegocio 2015, 11, 2–12. [Google Scholar]
  88. Deng, R.; Ran, G.H.; Zheng, Q.; Wu, X.J. The nonlinear effect of agricultural informatization on agricultural total factor productivity in China: A threshold test approach. Cust. Agronegocio 2018, 14, 213–236. [Google Scholar]
  89. Ma, C.; Li, J.; Wang, D.Y. Optimal evaluation index system and benefit evaluation model for agricultural informatization in Beijing. Int. J. Robot. Autom. 2018, 33, 89–96. [Google Scholar] [CrossRef]
  90. Liu, C. The myth of informatization in rural areas: The case of China’s Sichuan Province. Gov. Inf. Q. 2012, 29, 85–97. [Google Scholar] [CrossRef]
  91. Brunsdon, C.; Fotheringham, A.S.; Charlton, M.E. Geographically weighted regression: A method for exploring spatial nonstationarity. Geogr. Anal. 1996, 28, 281–298. [Google Scholar] [CrossRef]
  92. Brunsdon, C.; Fotheringham, A.S.; Charlton, M. Some notes on parametric significance tests for geographically weighted regression. J. Reg. Sci. 1999, 39, 497–524. [Google Scholar] [CrossRef]
  93. Huang, B.; Wu, B.; Barry, M. Geographically and temporally weighted regression for modeling spatio-temporal variation in house prices. Int. J. Geogr. Inf. Sci. 2010, 24, 383–401. [Google Scholar] [CrossRef]
  94. He, Q.; Bo, H. Satellite-based high-resolution PM 2.5 estimation over the Beijing-Tianjin-Hebei region of China using an improved geographically and temporally weighted regression model. Environ. Pollut. 2018, 236, 1027–1037. [Google Scholar] [CrossRef] [PubMed]
  95. Berresaw, M.K.; Zikhali, P.; Manjur, K.; Edwards, S. Adoption of sustainable agriculture practices: Evidence from a semi-arid region of Ethiopi. Nat. Resour. Forum 2010, 33, 189–198. [Google Scholar]
  96. Pretty, J.; Hine, R. The promising spread of sustainable agriculture in Asia. Nat. Resour. Forum 2010, 24, 107–121. [Google Scholar] [CrossRef]
  97. Peters, G.H.; Stanton, B.F.; Tyler, G.J. Sustainable agricultural development: The role of international cooperation. In Proceedings of the Twenty-First International Conference of Agricultural Economists, Tokyo, Japan, 22–29 August 1991. [Google Scholar]
  98. Witcover, J.; Rosegrant, M.W. Conference on agricultural sustainability, growth, and poverty alleviation in East and Southeast Asia. EPTD Workshop Summ. Pap. 1995, 1, 1–31. [Google Scholar]
  99. Selvaraju, R. Implications of climate change for agriculture and food security in the Western Asia and Northern Africa region. In Climate Change & Food Security in West. Asia & North. Africa; Springer: Dordrecht, The Netherlands, 2013; pp. 27–51. [Google Scholar]
  100. Geng, S.; Hess, C.E.; Auburn, J. Sustainable agricultural systems: Concepts and definitions. J. Agron. Crop Sci. 1990, 165, 73–85. [Google Scholar]
  101. Madau, F.A.; Furesi, R.; Pulina, P. An analysis of sustainability policies in European agriculture in the long term: Methods and materials using the FEEM indicators. Agroecol. Sustain. Food Syst. 2014, 38, 485–501. [Google Scholar] [CrossRef]
  102. European Commission. A Framework for Indicators for the Economic and Social Dimensions of Sustainable Agriculture and Rural Development; European Commission: Brussels, Belgium, 2001; Available online: https://ec.europa.eu/agriculture/publi/reports/sustain/index_en.pdf (accessed on 3 April 2019).
Figure 1. Evolution trend of comprehensive score of sustainable development capacity of agriculture divided by region (2006–2015).
Sustainability 11 02004 g001
Figure 2. Nuclear density distribution of sustainable development capability of agriculture divided by year (2006–2015).
Sustainability 11 02004 g002
Figure 3. Spatial differentiation of sustainable development capability of agriculture (2006–2015).
Sustainability 11 02004 g003
Figure 4. Spatial differentiation of coordination degree of agricultural sustainable development capability (2006–2015).
Sustainability 11 02004 g004
Figure 5. Spatial distribution of regression coefficients calculated by GTWR model in 2006 and 2015.
Sustainability 11 02004 g005aSustainability 11 02004 g005b
Table 1. Evaluation index system of sustainable development of agriculture along the Belt and Road (B&R) route.
Primary IndexSecondary IndexCalculation FormulaUnitAttributeSource
economic subsystemgross agricultural production per capitagross agricultural production/total populationUSD per capitapositiveUNFAO
rural incomes per capitatotal family income/rural populationUSD per capitapositiveUSDA & WBOD
agricultural productivityagricultural value added/agricultural land areaUSD per km2positiveUNFAO
the proportion of gross fixed capital formation in agriculturegross fixed capital formation in agriculture/gross fixed capital formation%positiveUNFAO
agricultural commodity rateagricultural commodity production/gross agricultural production%positiveEUROSTAT & WTO
export rate of agricultural productsexports of agricultural products/value of agricultural products%positiveOECD & UNFAO
social subsystemrural electricity consumption per capitarural electricity consumption/rural populationkW⋅h per capitapositiveIEA
political stabilitypolitical stability and the elimination of violence/terrorismindexpositiveUNFAO
population subsystemthe proportion of rural populationrural population/total population%negativeWBOD
population densitytotal population/territory areakm2 per capitanegativeWBOD
the proportion of agricultural employeesagricultural employees/total employees%positiveWBOD
growth rate of rural populationbirth rate minus mortality rate of rural population%negativeOBOR
the proportion of poor populationthe proportion of the poor in the total population measured by the rural poverty line%negativeILO & WBOD
resource subsystemthe proportion of agricultural landagricultural land/land area%positiveWBOD
the proportion of cultivated landarable land/land area%positiveUNFAO & GLASOD
hectares of arable land per capitaarable land area/total rural populationhectarepositiveUNFAO
the proportion of harvestable areaharvestable area/land area%positiveUNFAO
cultivation area of organic soilarea of organic soilhectarepositiveUNFAO
effective irrigated rateeffective irrigation area/cultivated land area%positiveUNFAO
environmental subsystemuse intensity of chemical fertilizeramount of fertilizer application/fertilizer application areatonnes per m2negativeUNFAO
PM2.5particulate matter smaller than or equal to 2.5 microns in diameter/1 m310−6 per m3negativeWBOD
total carbon emissionstotal emissions from different agricultural subfields106 kgnegativeUNFAO
the proportion of energy useterminal consumption of agricultural energy/value of agricultural products%negativeIEA
use intensity of pesticideamount of pesticide application/pesticide dosage application area%negativeUNFAO
forest coverageforest area/land area%positiveWDPA & UNFAO
Note: The meanings of all abbreviations in the column of Source can be seen in the part of Section 4.1.
Table 2. Comprehensive score of sustainable development capacity of agriculture (2006–2015).
Country2006200720082009201020112012201320142015
Albania0.38800.38880.38930.39000.38640.39010.39110.39130.38870.3874
Armenia0.38520.38470.38530.38710.38630.38740.38830.38870.38870.3883
Azerbaijan0.38210.38590.38400.38710.38880.38800.38870.38950.38710.3851
Bangladesh0.38360.38360.38800.38520.38590.38360.38310.37980.37900.3772
Bulgaria0.39560.39560.39840.39740.39870.39920.40010.40030.40100.4015
Bosnia and Herzegovina0.38130.38220.38400.38640.38650.38730.38680.38620.38820.3859
Belarus0.42590.42660.42890.42960.42830.42240.42340.42350.42210.4217
Brunei0.35920.36230.36120.36270.36040.36180.36100.36160.36220.3589
Bhutan0.38340.38440.38350.38480.38690.38760.38830.38930.39010.3926
China (mainland)0.39200.39290.39430.39530.39530.39520.39640.39540.39590.3944
Cyprus0.38470.38410.38080.37840.37980.37970.37760.37830.37620.3761
Czech0.40370.40350.40090.40090.40180.40360.40420.40430.40350.4054
Egypt0.36740.36860.36980.37000.37030.37260.37380.37240.37440.3724
Estonia0.42230.42300.42100.42090.42310.42470.42450.42570.42490.4266
Georgia0.38450.38400.38220.38300.38390.38460.38370.38250.37970.3829
Greece0.41520.41540.41520.41450.41260.41320.41310.41320.41280.4147
Croatia0.38680.38700.38710.38390.38090.37750.37660.37610.37520.3735
Hungary0.41320.41170.41090.40990.40900.40700.40680.40670.40600.4059
Indonesia0.39820.39810.39600.39530.39530.39430.39640.39420.39350.3954
India0.39120.39140.39380.39430.39500.39500.39450.39430.39570.3930
Iran0.37460.37600.37460.37600.37590.37600.37570.37880.37830.3782
Israel0.39500.39680.39570.39430.39610.39720.39660.39670.39700.3984
Jordan0.36460.36520.36660.36640.36460.35940.35670.35850.36020.3560
Kazakhstan0.39250.39520.39420.39270.39390.39790.39640.39900.39660.3976
Kyrgyz0.37890.38200.38120.38340.38100.37840.37650.37840.37850.3802
Cambodia0.39410.39470.39610.39550.39730.39780.39490.39490.39540.3941
Lebanon0.38230.37910.37830.37900.37880.37990.38090.37830.37830.3781
Sri Lanka0.37740.37600.37890.38080.38300.38360.38370.38300.38370.3821
Lithuania0.42030.41910.41700.41930.42470.42510.42650.42850.42910.4295
Latvia0.38610.38410.37710.37640.37680.37580.37580.37920.37770.3746
Moldova0.37030.36900.36830.36920.36820.36790.36960.37060.37260.3667
Maldives0.35810.35730.35570.35350.35550.35500.35530.35100.35040.3509
Macedonia0.39030.39190.39350.39500.39230.39190.39040.39450.39580.3951
Myanmar0.38690.38790.38650.38630.38810.38860.39100.39220.39110.3884
Mongolia0.37670.37670.37410.37530.36610.36490.36500.36870.37070.3765
Malaysia0.39390.39410.39450.39390.39810.39770.39530.39390.39870.3978
Nepal0.37040.36970.37010.37100.37070.36920.36920.36950.36860.3708
Oman0.37030.37110.37180.37210.37170.37030.36990.36880.36960.3670
Pakistan0.37990.38240.38350.38670.38680.38830.38710.38850.38940.3814
Philippines0.36390.36650.36730.36690.36580.36830.36530.37090.36920.3675
Poland0.40170.40270.40170.40170.40100.40200.40270.40280.40220.4036
Romania0.40970.41010.41210.41470.41620.41670.41720.41510.41840.4161
Russia0.38490.38730.38800.38710.38510.38880.38800.38990.38750.3890
Saudi Arabia0.37770.37810.38050.38170.38120.37960.38070.38210.38460.3867
Serbia0.39770.39820.40020.40280.40430.40480.40530.40310.40640.4042
Slovakia0.39490.39520.39510.39410.39440.39600.39780.39570.39430.3946
Slovenia0.38290.38270.38310.38550.38710.38970.38960.39090.38900.3901
Thailand0.39360.39560.39650.39740.39780.39810.39880.39760.39680.3958
Tajikistan0.36500.36480.36570.36780.37040.37220.37280.37210.37420.3660
Turkmenistan0.41020.40970.40880.41060.41290.41190.41500.41350.41220.4148
Ukraine0.41570.41210.40660.40060.39850.39810.39910.39950.39810.4008
Vietnam0.39160.39010.39120.39180.39270.39340.39370.39360.39410.3938
Yemen0.35350.35430.35330.35510.35280.35650.35430.35390.35360.3629
Table 3. Coordination degree of sustainable development of agriculture (2006–2015).
Country2006200720082009201020112012201320142015
Albania0.51050.52920.51590.51780.50450.52650.51230.56780.52960.5255
Armenia0.47200.46910.41390.47260.46910.50070.50320.51560.55140.5229
Azerbaijan0.46540.45730.43260.49330.46990.50370.50150.51550.54420.4732
Bangladesh0.45990.46370.48700.46440.45910.47970.47810.47800.47020.4957
Bulgaria0.53330.54230.51280.54120.53620.57240.58750.55170.57260.5602
Bosnia and Herzegovina0.44810.43230.43040.45730.45260.47160.48120.49320.49100.4793
Belarus0.72060.71960.69520.71990.73430.72320.73310.74290.73840.7381
Brunei0.27980.28260.26530.30980.32750.34420.38340.39070.33490.3764
Bhutan0.47100.46390.45220.48940.49330.49370.48190.50340.56130.5614
China (mainland)0.58720.58790.59780.58570.59850.59230.60790.60840.58300.6186
Cyprus0.45600.47210.44470.44850.46070.46100.47020.43220.46000.4725
Czech0.58720.57300.58240.59520.61560.60800.63830.60400.62950.6211
Egypt0.36350.36950.32980.37990.35940.41280.42700.43510.46870.4736
Estonia0.69960.67040.66860.68360.70690.64770.64860.61120.65570.6785
Georgia0.51050.52140.47430.44940.53440.45650.48750.44160.45390.4674
Greece0.59660.61050.57920.64320.60600.68000.66340.69930.68840.6943
Croatia0.48600.43750.42710.47780.43960.43380.46940.44460.45880.4459
Hungary0.57530.57900.57250.58390.61610.61000.62950.65850.64320.6465
Indonesia0.52940.51100.51110.56250.55450.57660.58080.58320.58930.5922
India0.47540.48140.48090.50640.51120.53460.51880.53740.55340.5524
Iran0.38070.37980.40200.38310.40020.38130.38830.44750.43040.4001
Israel0.56380.56570.55510.55220.57630.57510.61740.61890.60190.6219
Jordan0.28650.32510.32530.28040.30480.29010.28320.31100.29970.3082
Kazakhstan0.58420.57380.57110.58640.58040.59360.60130.54680.56570.5968
Kyrgyz0.44770.44880.43690.36640.44260.40440.41530.40700.50900.4802
Cambodia0.45830.50330.47340.48150.46960.50230.47010.62300.60560.6306
Lebanon0.39440.34970.30340.39930.37940.42870.41730.42750.44280.4349
Sri Lanka0.43630.44370.44390.45530.44780.45390.46200.46000.44050.4597
Lithuania0.74820.65440.67340.73440.68450.74730.74040.74000.74700.7370
Latvia0.38630.39770.40550.38960.36940.39520.41290.41190.41370.4287
Moldova0.37780.37140.35040.35330.37070.33790.35280.30830.38050.3547
Maldives0.30020.33160.30330.30730.29530.30120.34380.33870.28190.3259
Macedonia0.54160.54430.48480.54430.55550.49960.52800.53010.52270.5564
Myanmar0.47700.47060.45780.49610.47560.51800.51800.56800.55870.5457
Mongolia0.37870.40660.44500.39360.38820.39000.39720.37950.39830.3971
Malaysia0.54500.54950.57010.55660.53250.54710.55890.55450.56880.5740
Nepal0.29440.29510.27200.27550.30730.30170.32110.33980.33120.3407
Oman0.33870.26640.29090.38210.29450.39820.40880.44460.42330.4064
Pakistan0.43750.46460.44380.43710.45310.45350.45760.47320.49170.4878
Philippines0.32700.31400.31400.35250.31730.34250.34950.38680.36340.3631
Poland0.61700.61710.60280.60620.60940.61100.64440.66100.67210.6997
Romania0.65100.67340.68460.65210.66930.64400.66280.62990.63550.6487
Russia0.48670.50780.47030.51710.49080.52970.51210.57640.54400.5403
Saudi Arabia0.48100.45370.35420.47610.47730.44650.46440.43430.47130.4500
Serbia0.57220.56430.58340.58890.59490.57100.61710.59630.59540.6193
Slovakia0.51520.52450.50350.53890.52470.57950.54370.58340.55100.5744
Slovenia0.47520.47950.48020.49890.46690.49750.49180.49070.50230.5053
Thailand0.53650.55550.54900.54680.57050.54350.54470.55600.56580.5505
Tajikistan0.31180.27490.23530.31970.29200.32110.33420.35040.37870.3419
Turkmenistan0.58950.58030.58660.61000.61360.64100.64710.61670.63330.6559
Ukraine0.60080.61360.59220.60390.61460.60310.61540.62320.61580.6188
Vietnam0.54850.56620.55560.51270.55780.55630.55010.51650.52810.5620
Yemen0.26370.25100.21500.25050.25180.27870.30480.31410.32320.3212
Table 4. Estimation results of regression coefficient calculated by geographically and temporally weighted regression (GTWR).
VariablesMeanMinimumQ1MedianQ3MaximumSEtp-Value
Intercept−1.2086−2.2143−1.3897−1.1945−1.0375−0.26307.0070−91.4180.000
PCGDP0.0485−0.07680.02120.04850.07600.20051.085823.6950.000
FEA0.0336−0.03070.00930.01990.03860.19330.996517.8680.000
AFDI0.0031−0.0099−0.00030.00150.00370.05000.16639.7470.000
ALF−0.0591−0.7143−0.1620−0.06170.04800.72794.8253−6.4890.000
IARDI0.0919−0.50370.01780.08830.19250.71264.305311.3150.000
LAI0.0190−0.4613−0.07820.02660.11360.77133.17033.1790.002

