1. Introduction
Environmental pollution refers to the matters released from human activities (such as during the process of production and living) into the environment that are harmful to living organisms [
1,
2,
3]. The ecosystem has self-purifying functions on the pollutants, but if the pollutants released have exceeded the limits allowed by the ecosystem, they would cause great harm to the human society. If the environment is polluted by harmful matters, the growth and reproduction of organisms will be affected, disturbing the normal life of human beings and endangering human health and the sustainable development of human beings [
4,
5,
6,
7,
8]. Since the 1970s, China has achieved rapid economic development, but its growth model is characterized by extensive production and high pollution. The labor-intensive industry structure and relatively backward production technologies have made the pollution problem of China, especially its air pollution issues keep deteriorating, which has caused serious threats to China’s sustainable development [
9,
10,
11,
12,
13].
In 2016, the total emissions of SO
2, nitrogen oxides and smoke/dust of China reached 11.03 million tons, 13.94 million tons and 10.11 million tons, respectively, which caused great pressure on the environment and sustainable development [
14]. According to international standards, 38% of the Chinese people are breathing unhealthy air every day; and about 1.6 million people die of heart disease, lung disease and stroke every year due to air pollution (especially the particulate pollutants in haze) [
15]. According to the statistics of the World Bank, China is the most negatively affected country in the world by air pollution, with various types of air pollutants and shocking amounts of emissions. The annual economic losses caused by air pollution are as high as 10% of China’s GDP (Gross Domestic Product), which mainly includes premature death, loss of working time and increase of related welfare expenses [
16]. These figures and research results have driven us to reflect on the interrelations between China’s air pollution and sustainable development.
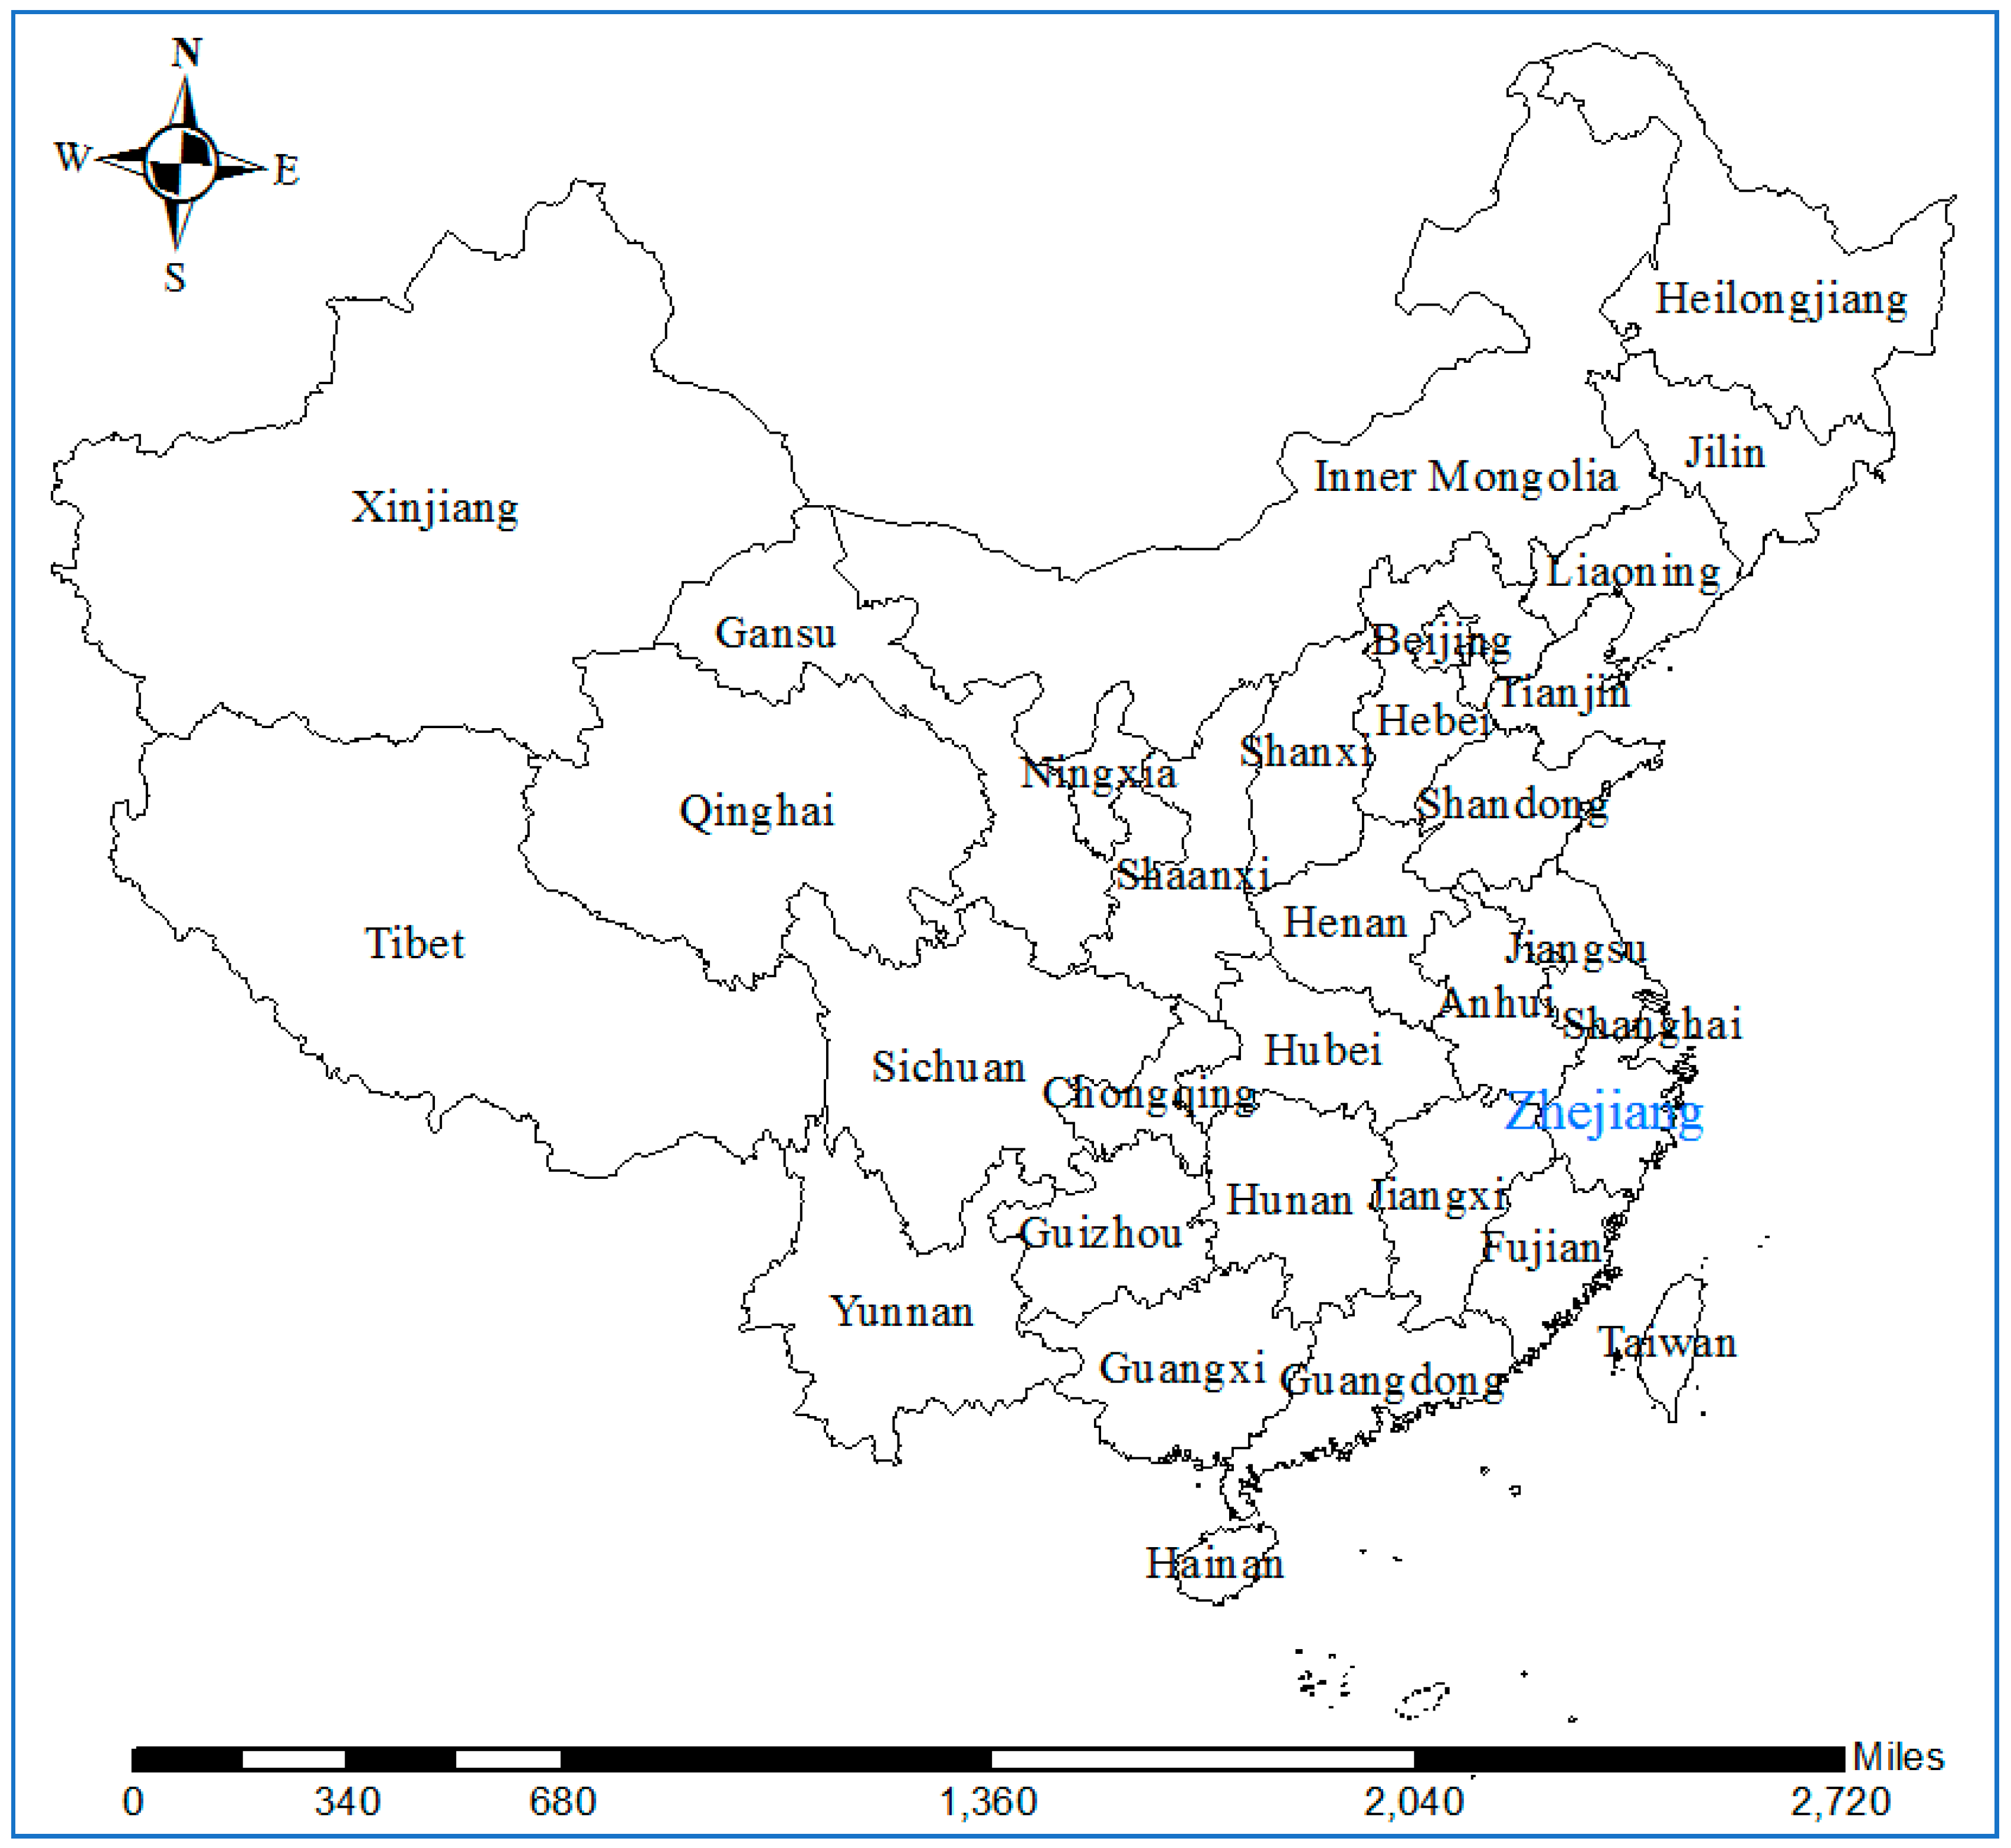
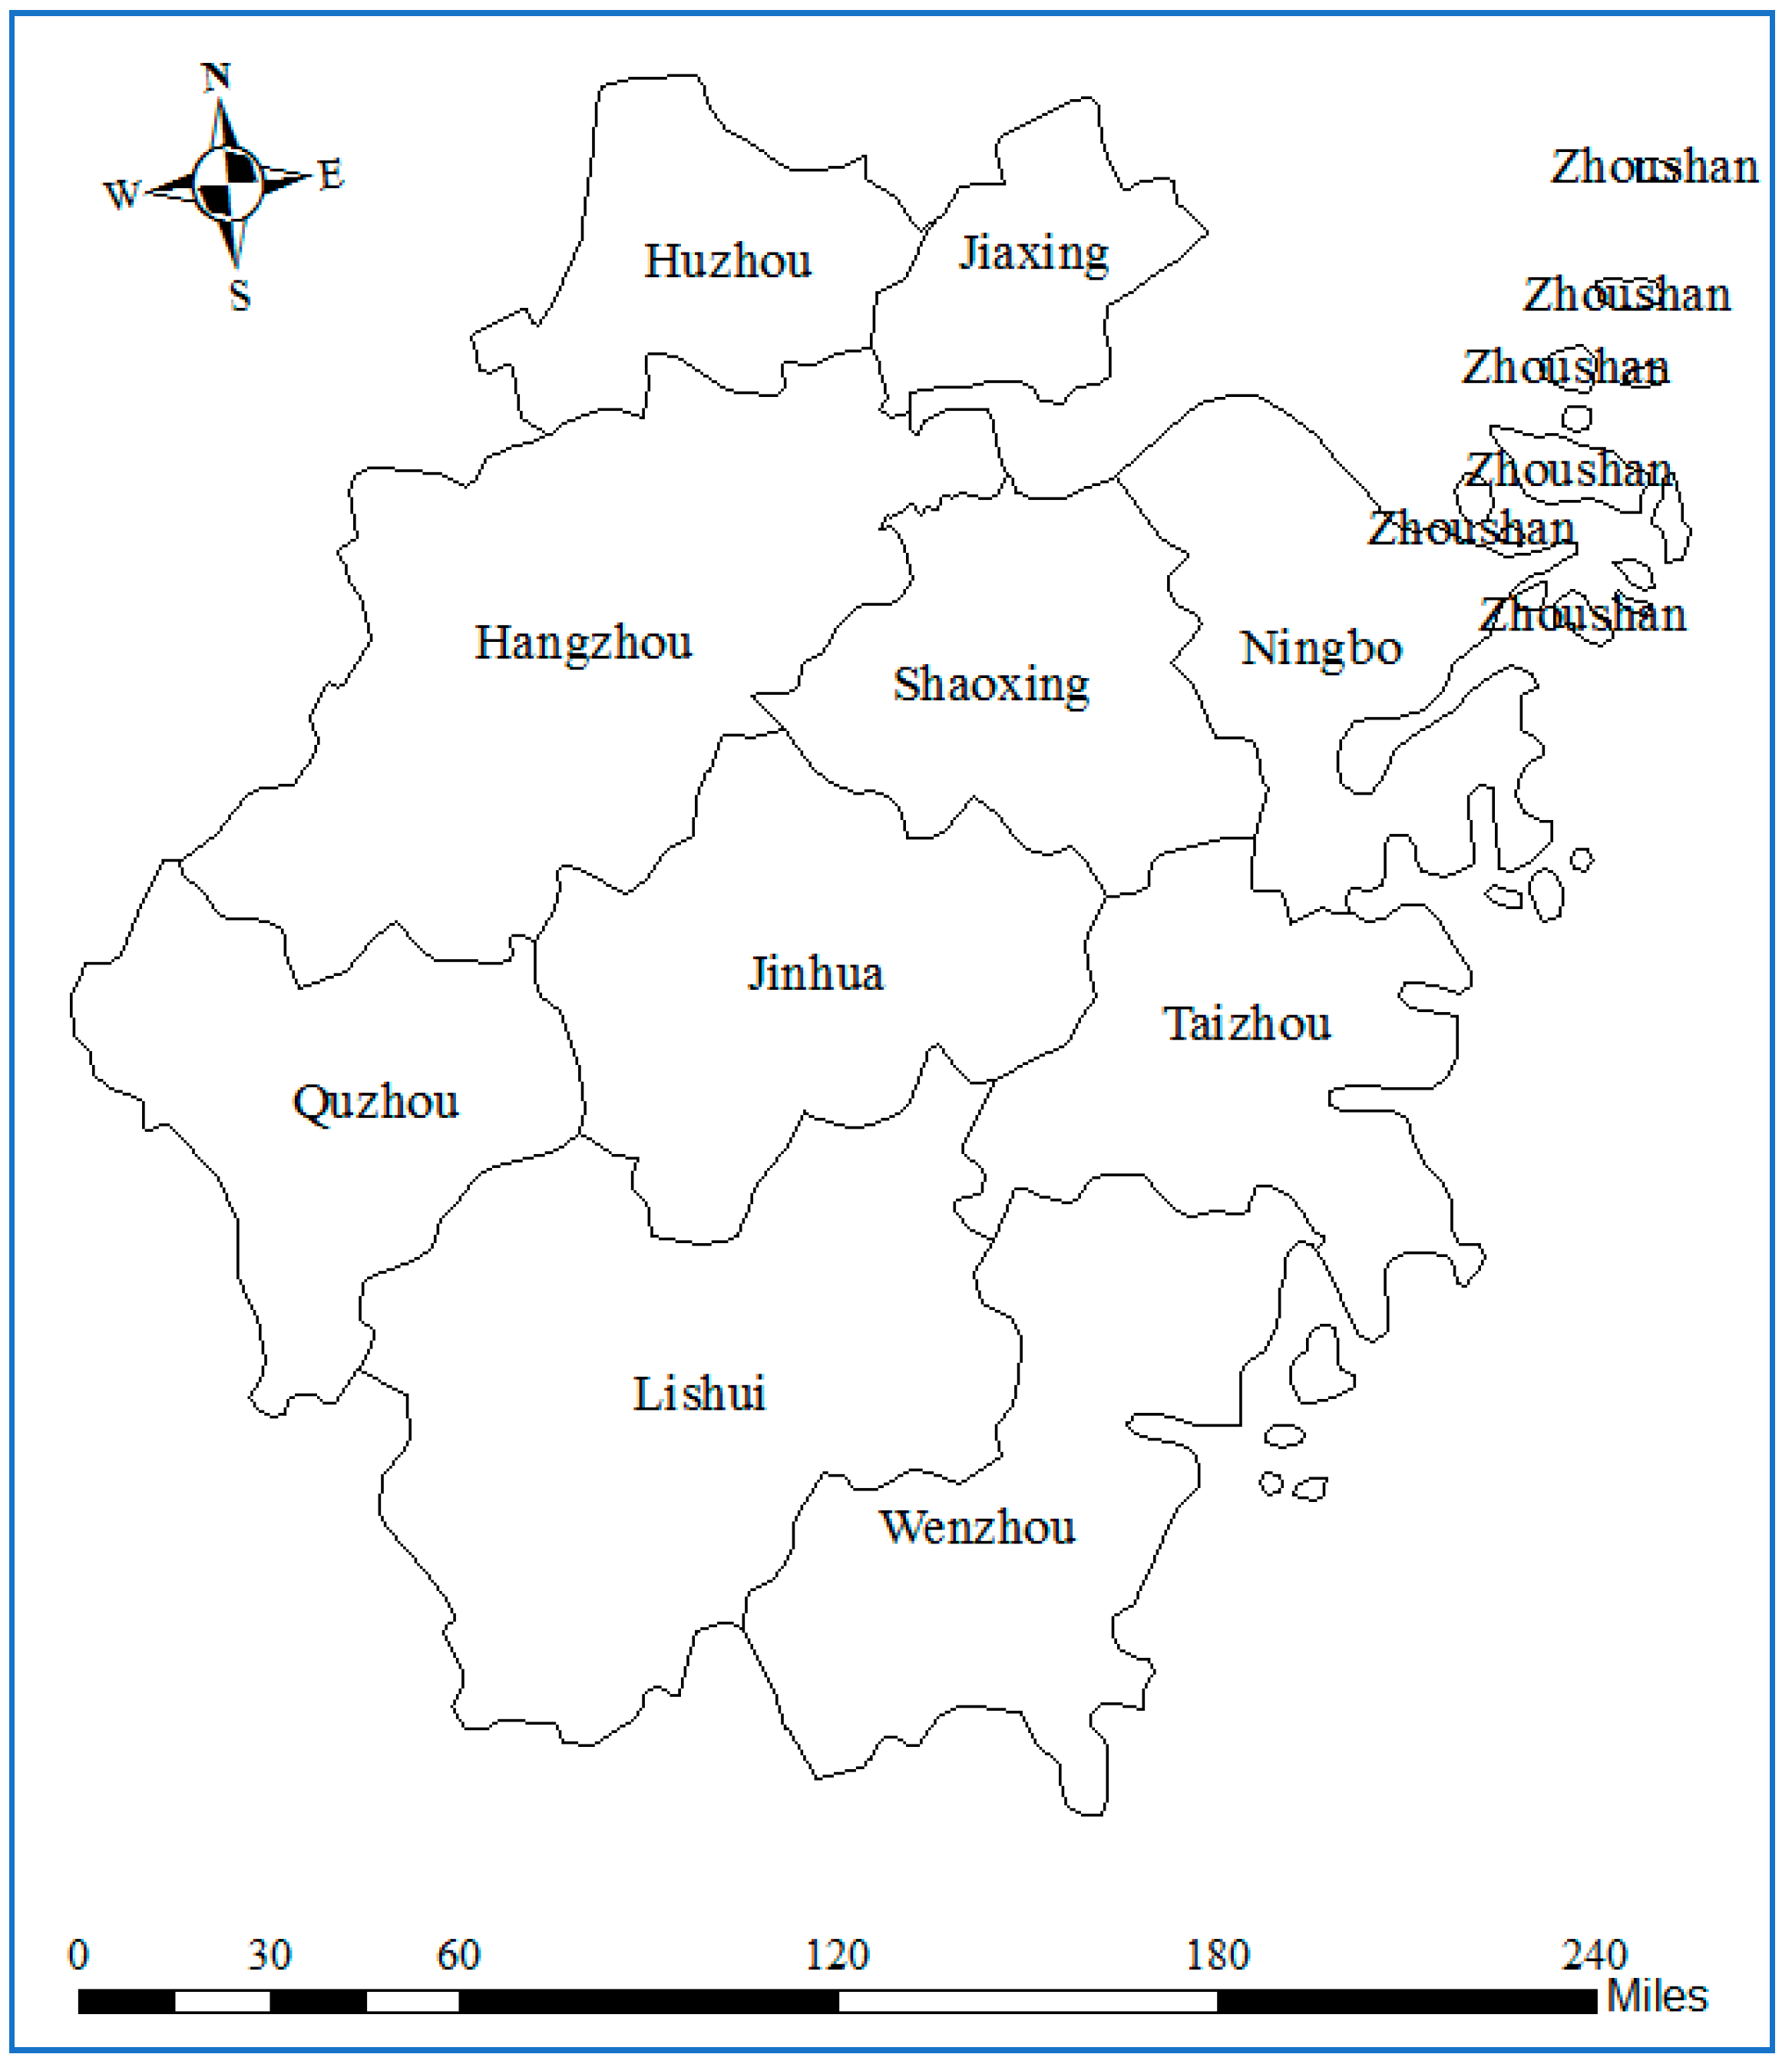
This paper has selected China’s Zhejiang Province as the research object of air pollution evaluation standards and air pollution governance policies (please refer to
Figure 1 and
Figure 2). Zhejiang Province is on the southeast coast of China, with the Yangtze River Delta in the north, Shanghai in the southeast, Anhui and Jiangxi in the west, and Fujian in the south. It is one of the most developed provinces in China, and has 11 prefecture-level cities. Zhejiang Province is not rich in natural resources and mainly relies on industrial production to support rapid economic growth [
17,
18]. In 2000, Zhejiang’s GDP was 641.10 billion yuan, and its total inflation-adjusted GDP in 2017 after rough calculation was 5176.80 billion yuan, which has achieved an increase of 842.99% [
19,
20].
However, just like China’s overall economic development model, Zhejiang’s rapid economic growth has always been driven by the consumption of limited natural resources, and its economic development is still at the stage of extensive growth characterized by quantity expansion and low-cost competition [
21]. In addition, the enterprises with high energy consumption, high emissions and backward production technologies are still in operation, thus driving the growth rate of Zhejiang’s industrial waste gas emissions to continuously rise and causing serious environmental pollution. In 2013, the industrial waste gas emissions of Zhejiang Province totaled 2456.5 billion cubic meters, and this number rose to 2695.8 billion cubic meters in 2014 with an increase of almost 9%. At the same time, the proportion of major air pollutants in the waste gas emissions has always been high. In 2016, the total emissions of SO
2, nitrogen oxides and smoke/dust in Zhejiang Province reached 268,400 tons, 380,400 tons and 182,300 tons, respectively.
Therefore, the choice of Zhejiang Province as a research object has the following important meanings: (1) Zhejiang is the most active area of China’s private economy, covering an area of 105,500 square kilometers which exceeds South Korea [
22,
23], with many small and medium-sized private enterprises. However, while Zhejiang’s economy has grown rapidly since the reform and opening up, the protection of the environment, especially of the air quality, is seriously inadequate; (2) Unlike in Jiangsu and Shanghai, which are the other two provinces located in the Yangtze River Delta region, air pollution control in Zhejiang is faced with the task of adjusting the economic structure and many small and medium-sized private enterprises. The change in air quality reflects not only the effectiveness of the air pollution control policy, but also the effectiveness of Zhejiang’s environmental adjustment of the industrial structure and the private economy; (3) Under the background of China’s implementation of the “Integration Development of Yangtze River Delta” strategy in recent years, the governance of air pollution in Zhejiang will represent the implementation of environmental protection and sustainable development strategies in the most developed areas of China’s private economy.
The academic circle has given great attention to the air pollution issue of Zhejiang Province. In the field of outdoor air pollution research, Ni et al. used the Weather Research and Forecasting with Chemistry Model to study the air pollution characteristics and its root causes in Hangzhou (the provincial capital of Zhejiang Province) during the second World Internet Conference in the winter of 2015. Their results showed that the control measures implemented one week before the meeting did help reduce the PM
2.5 pollution to some extent, with the total PM
2.5 concentration in Hangzhou decreased by 15% [
24]. Feng et al. used the WRF/CMAQ (Weather Research and Forecasting/Community Multi-scale Air Quality) Model to analyze the air pollution level in Hangzhou based on observation data from five local environmental monitoring stations in downtown Hangzhou. According to their findings, in 2017, the local pollution sources in Hangzhou accounted for 15.8%, 68.6%, 48.3% and 59.2% of the total concentrations of SO
2, NO
2, PM
2.5 and PM
10, respectively [
25]. PM
2.5 refers to particulate matter with an aerodynamic equivalent diameter of 2.5 μm or less in ambient air, and PM
10 refers to particulate matter with an aerodynamic equivalent diameter of 10 μm or less in ambient air [
26]. Based on the daily PM
10 and PM
2.5 concentration data from 50 monitoring stations in Zhejiang Province from 1 February 2015 to 28 February 2017, Wu et al. conducted a quantitative study on the relationship between PM
10 and PM
2.5 concentration and green spaces and landscape structure through Principal Composition Cluster Analysis (PCA) and Hierarchical Cluster Analysis (HCA). Their results showed that the increase of urban green space can reduce PM pollution, and the correlation between green space and PM
2.5 concentration is stronger than that between green space and PM
10 on the scale of 5 km or less [
27]. Xu et al. selected four representative locations (two cities, one suburb site and one rural site) in Hangzhou and Ningbo from December 2014 to November 2015 in order to study the seasonal and spatial variation in terms of fine particle pollution in Zhejiang Province. With help of the Principal Component Analysis (PCA) method, they found that industrial emissions, biomass burning, and formation of secondary inorganic aerosols are the major sources of fine particles in Zhejiang Province [
28]. Fu et al. studied the potential correlation between conjunctivitis and air pollution based on the air pollutant data from the Environmental Protection Department of Zhejiang Province from 1 July 2014 to 30 June 2016 and data of 9737 outpatient visits for conjunctivitis at the Eye Center of the Second Affiliated Hospital of Zhejiang University School of Medicine. Their results indicated significant correlations between the number of conjunctival outpatient visits and air pollution in Zhejiang [
29]. Xu et al. conducted a sample survey on air pollutants in Ningbo, Zhejiang Province from 3 December 2012 to 27 June 2013 in order to study the chemical characteristics of highly polluting aerosols in the air of Zhejiang Province. By analyzing the meteorological conditions, air mass backward trajectories, distribution of fire spots in surrounding areas and various categories of aerosol pollutants, they concluded that stagnant weather conditions and long-range transport of air masses from heavy industries and biomass burning from northern China to Ningbo are the main contributors to the high aerosol pollution during their study period [
30].
In the field of indoor air pollution study, Sun et al. studied the indoor air pollution in Hangzhou. Through high-frequency detection of indoor and outdoor homogenous pollutants, they found that air-conditioning filters play a significant role in the indoor propagation of outdoor pollutants, especially the home and office dust [
31]. Mestl et al. studied the relationship between indoor air pollution and deaths in Zhejiang, Shaanxi and Hubei provinces. By analyzing the PM concentrations in kitchens and living rooms, they believed that the premature mortality in these three provinces should reach 60,600 instead of the current estimate of 46,000 [
32].
Most of the above studies on air pollution in Zhejiang Province only considered 1–2 major pollutants (such as PM
2.5, PM
10, SO
2, etc.), and their study period was relatively short. In order to conduct a comprehensive and objective assessment on the air quality of the 11 cities in Zhejiang Province in recent years, this paper has included the six major air pollutants (SO
2, NO
2, CO, PM
10, PM
2.5 and O
3) covered by China’s regular monitoring and routine air quality evaluation based on China’s current National Ambient Air Quality Standards (GB3095-2012) [
33], and Technical Regulation on Ambient Air Quality Index (HJ 633-2012) [
26]. This paper would also like to illustrate the overall change and movements of these air pollutants over a longer period. Therefore, based on the above-mentioned domestic and overseas research, this paper has further incorporated the six major pollutants (SO
2, NO
2, CO, PM
10, PM
2.5 and O
3) into the air quality assessment indicator system, and studied the air quality of the 11 cities in Zhejiang from January 2015 to April 2018 based on related data in order to present a comprehensive picture of air quality of various cities.
Therefore, the research topic of this paper has the following important significance for sustainability, especially for China’s future sustainable development:
(1) The important symbol of sustainable development is the sustainable use of resources and a good ecological environment [
34,
35,
36]. In recent years, the serious air pollution in China has caused tremendous damage to the atmospheric environment in which human beings depend for survival and development. Therefore, this paper takes Zhejiang Province as the research object and quantitatively evaluates the air pollution status of the city under its jurisdiction, which provides a scientific basis for Chinese governments to formulate air pollution prevention policies and achieve sustainable development.
(2) Sustainability requires economic and social construction under conditions that protect the environment and sustainably use resources [
37,
38]. China’s future sustainable development should maximize the quality of life of the people without exceeding the capacity to maintain the capacity of the ecosystem, and must not destroy the environment and deplete resources for the cost of economic growth [
39,
40]. Hence, the evaluation index system for the construction of major pollutants provides scientific tools for measuring the carrying capacity of China’s atmospheric environment and achieving sustainable development in the future.
In the following parts of this paper, Part 2 introduces the research method; Part 3 provides the calculation results and analysis on the air quality of cities in Zhejiang Province since January 2015; Part 4 offers conclusions of this paper and related policy recommendations.
2. Materials and Methods
In order to take the six major air pollutants into consideration, this paper has introduced the Entropy Weight Method based on the traditional Fuzzy Optimization Model to construct a Fuzzy Optimization Measurement and Evaluation Model for the air quality in Zhejiang Province. In its application, the key of successful modeling is how to reasonably determine the weight of different indicators [
41,
42,
43,
44] and objective function [
45,
46]. To this end, this paper has adopted the Entropy Weight Method to determine the weight of indicators in the Fuzzy Optimization Model. Entropy is a concept in thermodynamics that represents a measure of the degree of disorder in a system. When the Entropy Weight Method is applied to the Fuzzy Optimization Model, the smaller the information entropy of an indicator is, the larger amount of information is contained in that indicator; the greater role it plays in this model, and therefore the higher weight it should have in the model. Otherwise, the larger the information entropy of an indicator is, the smaller role it plays in this model, and therefore the lower weight it should have [
47,
48,
49,
50].
The specific steps of applying the Entropy Weight Method to the Fuzzy Optimization Model are as follows:
(1) Construct a Fuzzy Comprehensive Evaluation Matrix
Given the evaluation object
, its related Factor Set
, and a Rating Set
for each of the factors, after performing fuzzy evaluation on the Rating Set of each factor in
based on the membership function, this paper could obtain a Fuzzy Evaluation Matrix with
elements:
The element in the above matrix represents the Fuzzy Membership Degree of factor with respect to the Rating element , that is, a fuzzy relationship of to , thereby determining the Fuzzy Evaluation Matrix of the evaluation object .
(2) Determine the Weight of Indicators by the Entropy Method
In the Fuzzy Comprehensive Evaluation Matrix, the Fuzzy Comprehensive Evaluation Vector needs to be obtained by weighted summation. This paper has used the Entropy Method to determine the weight of different indicators of the same rating. Since the calculation of the Entropy Method uses the proportion of a certain indicator of each rating to the sum of indicators with the same nature, no standardization is needed. The specific calculation steps are as follows:
A. Calculate the proportion of the
indicator preferred by the
program (
):
B. Calculate the entropy value of the
indicator (
):
where
represents the natural logarithm, and the constant
is related to the
of the Rating Set. Generally, let
, and it would have
.
C. Calculate the variation coefficient of the
indicator (
):
The above formula shows that, for the indicator, the smaller the Entropy Value () is, the larger the variation coefficient () becomes.
(4) Calculate the weight of the
indicator:
(3) Calculate the Fuzzy Comprehensive Evaluation Score
After calculating the weights of different indicators, this paper could obtain the Fuzzy Evaluation Set
by matrix and vector algorithm based on the Fuzzy Evaluation Matrix and Weight Vector:
Finally, this paper could obtain
based on the principle of maximum membership degree, whose value represents the Fuzzy Comprehensive Evaluation Score of the evaluation object (please refer to
Appendix A for the MATLAB Algorithm for Fuzzy Optimization Model Based on Entropy Weight Method). The higher the score, the better the city’s air quality is; the lower the score, the worse the city’s air quality is.
One disadvantage of the above method, especially the entropy weight method, is that the index values are all required to be greater than zero. If the value of some indicators has an outlier of zero or less than zero, the calculation result of the entropy method will be invalidated [
51,
52]. Since the data of the six pollutant indicators involved in this study are all greater than zero, this deficiency of the entropy weight method is avoided.
4. Discussion
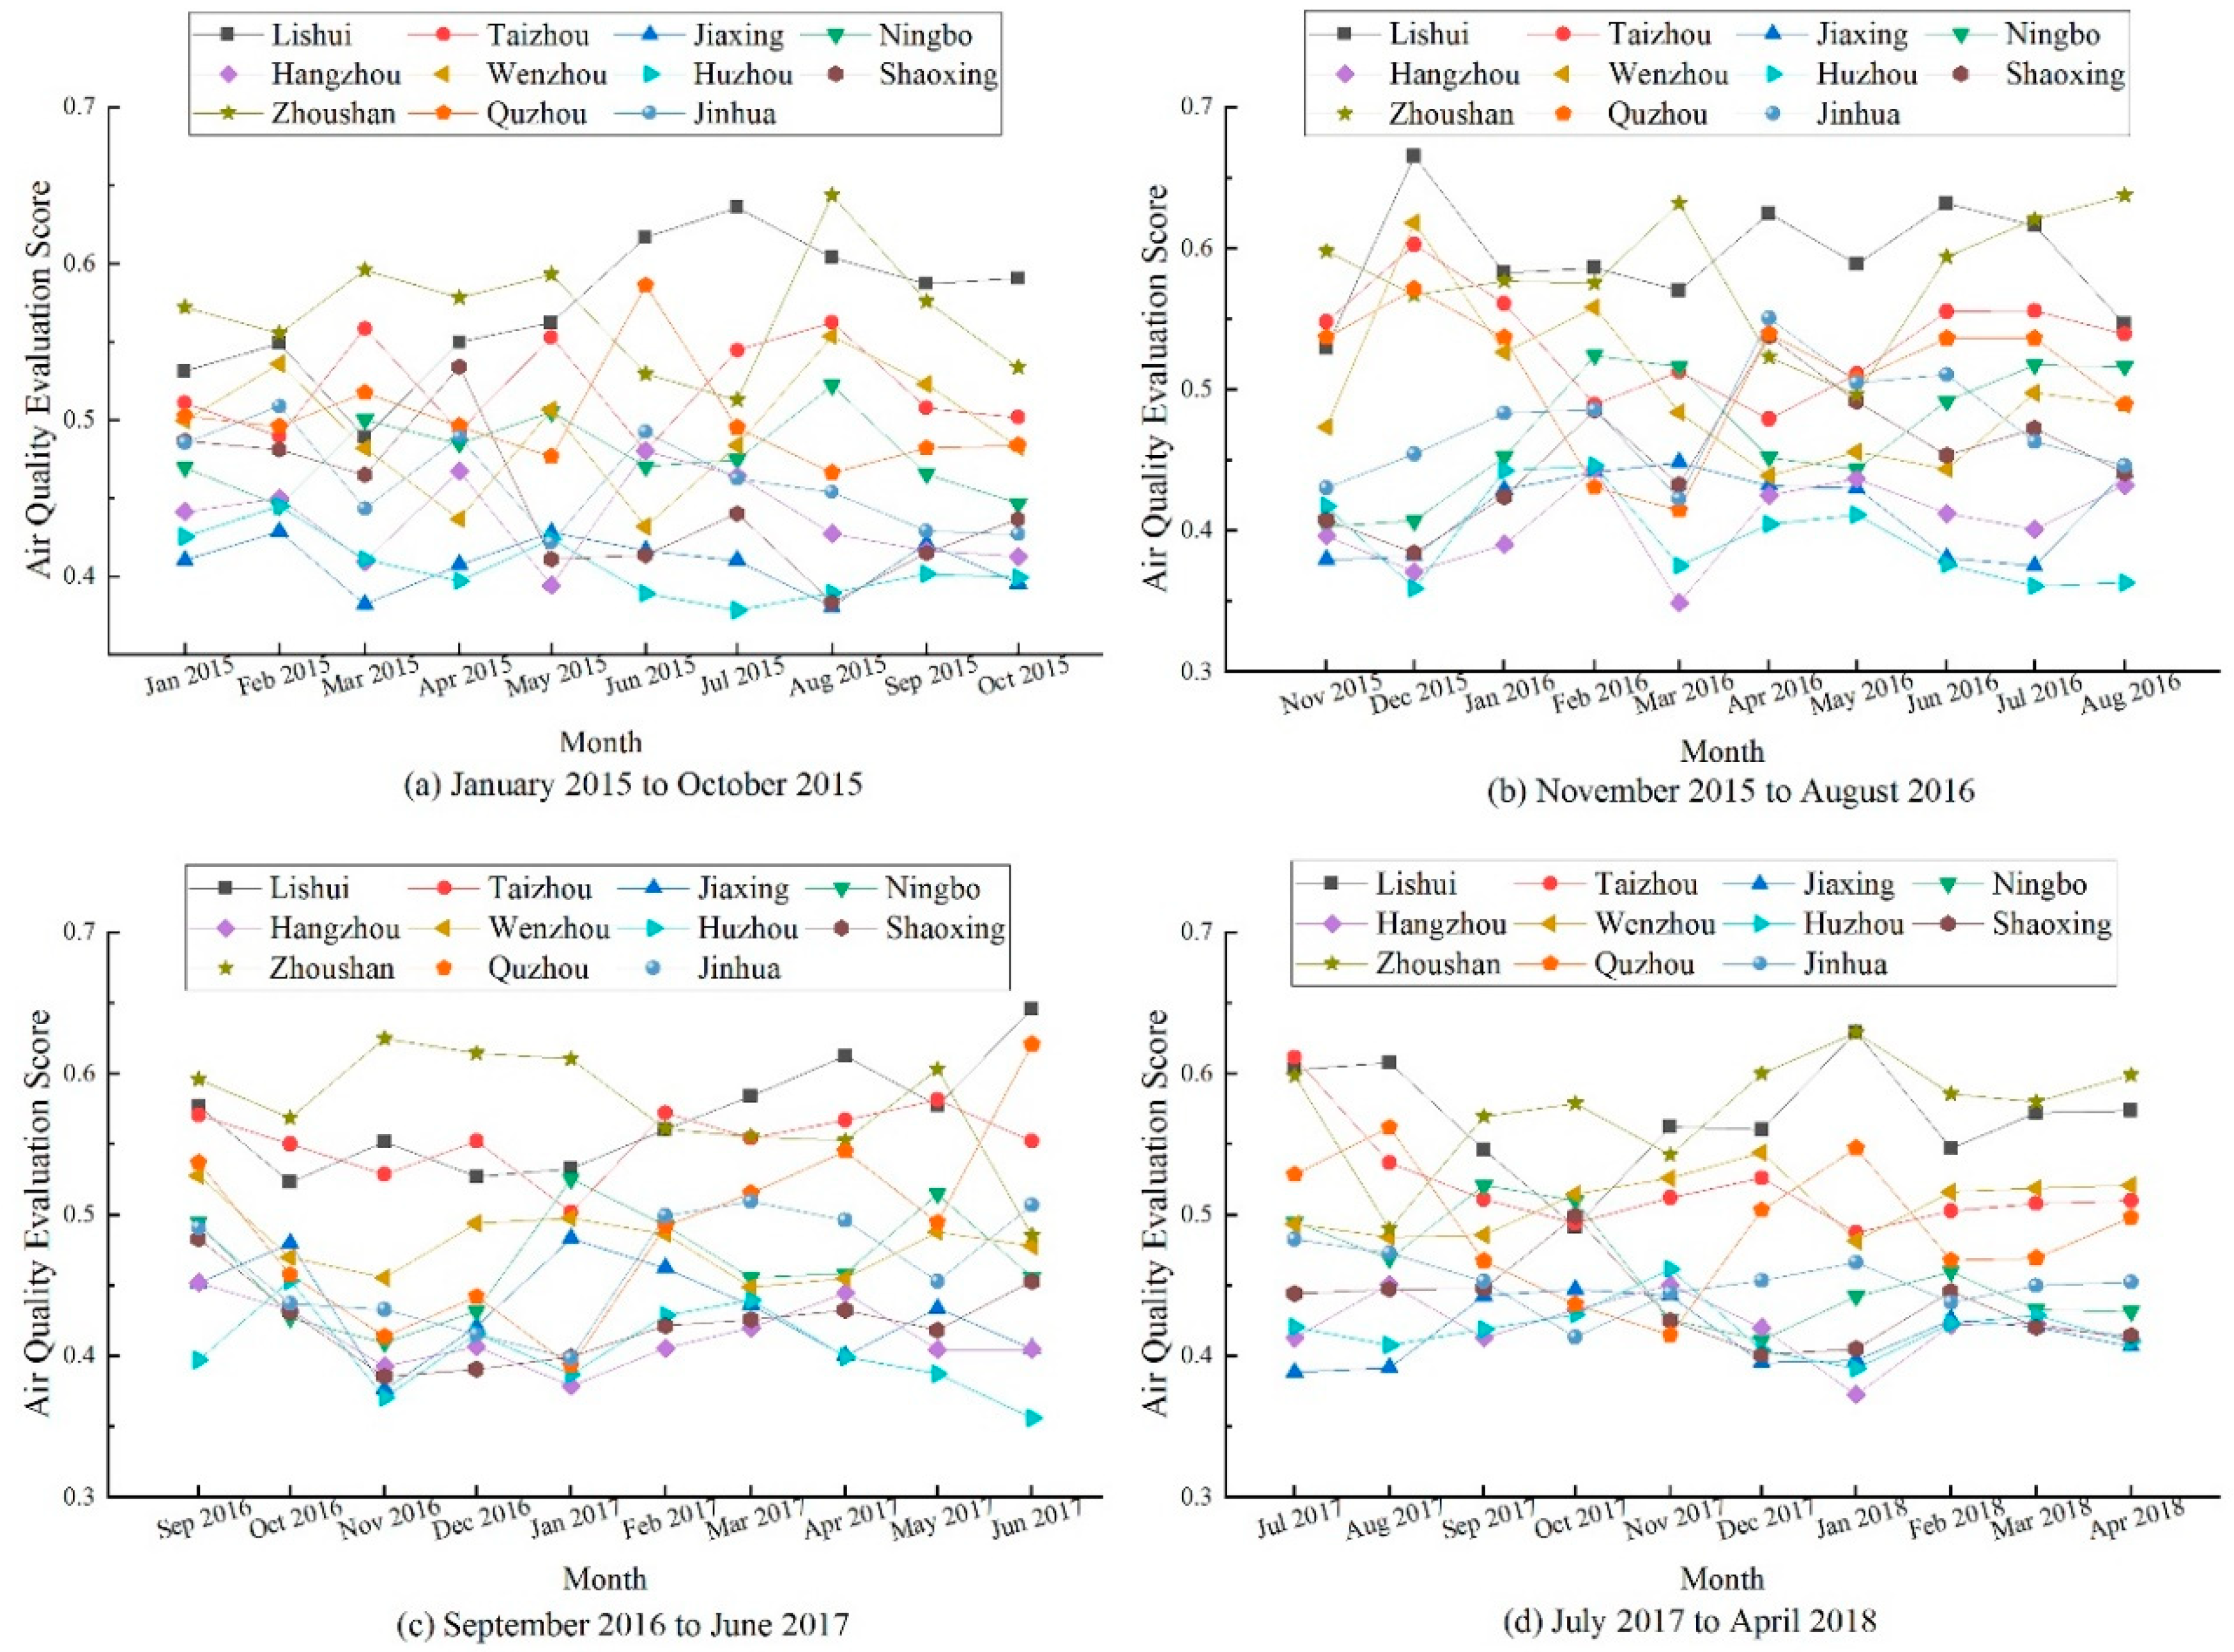
According to the above model and calculation results, the higher the score, the better the city’s air quality is; the lower the score, the worse the city’s air quality is. Therefore, the below characteristics in the air quality scores of cities in Zhejiang Province from January 2015 to April 2018 have been found:
(1) Overall evaluation results and trends. According to official statistics, since January 2013, the Ministry of Environmental Protection of China has started air quality monitoring and evaluation on key regions (such as the Beijing–Tianjin–Hebei region, the Yangtze River Delta region, and the Pearl River Delta region) and the so-called “74 cities” (including municipalities, provincial capitals, and other key cities) with air quality reports published monthly. According to the air quality reports published during the study period, the air quality of cities in Zhejiang Province was generally at the middle level [
55], which fully supports the calculation results in this paper. During the study period, the air quality evaluation scores of cities in Zhejiang range from 0.3 to 0.7. Although the evaluation scores of some cities (such as Jiaxing, Huzhou and Hangzhou) have always been low (never exceeded 0.5), the lowest air quality score is still above 0.34 (0.3491 of Hangzhou in March 2016). Therefore, the air pollution of Zhejiang Province is not as enduring and severe as that in areas such as Beijing, Tianjin and Hebei [
56,
57,
58].
(2) Seasonal trends. Although the differences between the quarters were not large during the study period, the air pollution in cities in Zhejiang Province still showed a certain seasonal trend—the air quality in autumn and winter was generally relatively poor, while in spring and summer is generally relatively good. This trend has been confirmed in relevant researches [
59,
60,
61,
62]. The reason is that, although Zhejiang is located in southern China, with higher temperature in winter than that in the northern regions such as Beijing, Tianjin and Hebei, the demand for heating in winter still exists, so the increase in energy consumption has increased air pollution to a considerable extent.
Compared with the above research, we calculated the air quality evaluation values of all prefecture-level cities in Zhejiang Province based on the six kinds of atmospheric pollutants, which overcame the limitation of only 1–2 pollutants and several cities of Zhejiang. Moreover, we calculated the weight of different pollutant indicators by using the fuzzy optimization model and based on the entropy weight method, to enrich existing research methods of seasonal changes literature.
(3) The air quality in Zhoushan and the southern cities of Zhejiang is obviously improved. As the first prefecture-level city in China that is formed by an archipelago, Zhoushan consists of large numbers of islands and is surrounded by sea, and thus enjoys unique geographical advantages in maintaining good air quality. In 2017, the air quality of Zhoushan ranked third among all cities in China [
63]. According to the calculation results of this paper, the air quality evaluation score of Zhoushan has always ranked top in Zhejiang Province, and its air quality score has improved by 4.67% at the last study period when compared with that of the beginning period. At the same time, the air quality of Lishui and Wenzhou in southern Zhejiang has improved by 8.04% and 4.22% respectively during the study period (please refer to
Table 1 below).
Apart from geographical reasons, these three cities have formulated tailored air pollution prevention and control measures based on their own characteristics and the “Regulations on the Prevention and Control of Air Pollution in Zhejiang Province” officially passed by the Standing Committee of Zhejiang Provincial People’s Congress on 1 July 2016 [
64]:
Lishui City has formulated a “Detailed Code of Practice for Air Pollution Prevention and Control Campaigns”, clearly specifying air pollution prevention and control work in terms of six perspectives: industrial structure, energy structure, mobile pollution sources (motor vehicles), industrial waste gas, urban smoke and dust, and rural waste gas [
65].
Based on the characteristics of its industries, Wenzhou is working to build a low-carbon city to control air pollution by developing a recycling economy. Wenzhou is promoting industrial transformation and upgrade by cultivating large clustering industries and large enterprise headquarters, vigorously develops the marine economy, and aims to build an industrial structure with the modern service industry as the main part, supported by an advanced manufacturing industry, and with an urban modern agriculture in synergetic development. By the end of 2017, the energy consumption per unit of industrial added value of Wenzhou has reduced by 17% compared with that in 2012. The recycled proportion of main non-ferrous metals and steel was over 40%, and more than 70% of the industrial parks of the above provincial level have completed recycling upgrade and reconstruction [
66].
Zhoushan strictly controls coal consumption: it has set a control target regarding total coal consumption, and determines detailed responsibility and accountability of specific enterprises and equipment that consume coal with monthly monitoring. In addition, Zhoushan also works hard to develop clean energy by taking advantage of its favorable geographical location (surrounded by sea), such as building onshore wind farms and independent power supply systems on islands in order to utilize ocean energy [
67].
(4) The air quality of the northern cities of Zhejiang is relatively poor. During the study period, the air quality of the four cities in northern Zhejiang (Jiaxing, Hangzhou, Huzhou, and Shaoxing) has been ranked at the bottom. The air quality score of Shaoxing even declined by 14.85% at the ending period when compared with that of the beginning period, and Hangzhou’s air quality score also decreased by 6.69% (please refer to
Table 2 below).
The main reason behind is that these four cities have always been the most densely populated and economically developed region in Zhejiang Province; their industries have generated large amounts of air pollutants. Moreover, the four cities are geographically located in the inland areas of northern Zhejiang, and are heavily affected by the air pollutants spread from northern China [
68,
69], unlike coastal cities (such as Zhoushan) where the air pollutants can be easily dispersed [
70,
71]:
Shaoxing is located in the intersection of the hills of western Zhejiang, the mountains of eastern Zhejiang and the northern Zhejiang plain, surrounded by mountains and with a terrain high in the south and low in the north [
72]. Once the air pollutants gathered over the city, it is more difficult for them to dissipate. Meanwhile, Shaoxing has been relying on the heavily polluting printing and dyeing industry as a pillar industry for many years, with this industry’s production capacity taking over 60% of the total production capacity in Zhejiang Province, and accounting for one-third of the national production capacity of the printing and dyeing industry in China [
73].
As for Hangzhou, the provincial capital of Zhejiang, its permanent population reached 9.47 million at the end of 2017, and its total population may have exceeded 10 million if taking the migrant population into consideration; its annual industrial investment was 86.1 billion yuan in 2017 and its total number of motor vehicles reached 2.79 million at the end of 2017 [
74], resulting in large amounts of air pollutant emissions of all kinds that have brought tremendous pressures to the environment.
Therefore, although these cities have adopted a series of pollution prevention measures, the air quality of these cities still ranked bottom among cities in Zhejiang during the study period.
(5) The air quality of the four cities in central Zhejiang (Jinhua, Ningbo, Quzhou and Taizhou) has declined at the last study period when compared with that of the beginning period. Among them, Jinhua and Ningbo have seen a large decline in air quality, which are 6.80% and 8.15%, respectively (please refer to
Table 3 below).
In Jinhua City, industrial emissions are the main source of air pollutants responsible for 67.31% of the SO
2, 34.42% of the NO
x, 30.39% of the CO, 53.02% of the PM
10 and 50.95% of the PM
2.5. Among the industrial pollution sources, the building materials manufacturing industry and the textile printing and dyeing industry account for the largest proportion [
75].
Ningbo is also short in natural resources and lacks the energy resources needed to fuel economic growth, with more than 90% of its energy imported from other regions in which industrial consumption accounts for over 75% [
76]. Meanwhile, the heavy usage of fossil energy in industrial production is also an important reason for decline in air quality of Ningbo. Therefore, although Ningbo have adopted a series of measures to control air pollution, given that their industrial structure and energy structure have not fundamentally changed, their air quality has not improved during the study period and has even deteriorated along with rapid economic development [
77].
The same thing is observed in Quzhou and Taizhou too. Although the decline in their air quality is not as big as in Ningbo and Jinhua (Quzhou 0.84% and Taizhou 0.20%), the fact that there is no obvious improvement in their air quality when comparing that in the last period with that of the beginning period has indicated that the air pollution control campaign still has a long way to go for these cities.
In summary, the main reasons for the above air quality status during the study period in cities in Zhejiang Province are:
- (1)
The industrial structure is not reasonable and industrial upgrading is not yet in place.
- (2)
Coal-based energy consumption structure has not changed, and energy efficiency is not ideal.
- (3)
The laws and regulations on air pollution control need to be further improved.
Compared with similar literature, this paper has made innovations and contributions in the following two aspects:
(1) By constructing the six major pollutants defined by China’s air quality standards, we have evaluated the air quality of Zhejiang Province more comprehensively than the existing research. In similar studies of air quality in Zhejiang Province, scholars often use particulate pollutants as research objects [
27,
28,
78]. Then, few research works contain the six major pollutants.
(2) In terms of research methods, the paper has introduced the Entropy Weight Method based on the traditional Fuzzy Optimization Model to construct a Fuzzy Optimization Measurement and Evaluation Model, in order to calculate the weight more accurately. Comparing the current literature on the evaluation of air quality in Zhejiang and the Yangtze River Delta region (such as Shanghai and Jiangsu) [
79,
80,
81,
82,
83], we have innovated the traditional evaluation model and tried to make the evaluation results more reliable.
5. Conclusions
This paper has constructed an air quality evaluation system incorporating the six major air pollutants covered in China’s current national air quality standards (SO2, NO2, CO, PM10, PM2.5 and O3), and attempts to obtain a comprehensive evaluation of the air quality of cities in Zhejiang by analyzing the monthly data of the six pollutants in the 11 cities of Zhejiang Province from January 2015 to April 2018. In terms of the research method, this paper has introduced the Entropy Weight Method to the traditional Fuzzy Optimization Model to construct a Fuzzy Optimization Measurement and Evaluation Model for the air quality of Zhejiang Province. The conclusions of this paper are:
(1) During the study period, the air pollution in cities in Zhejiang Province still showed a certain seasonal trend. Moreover, the air quality scores of cities in Zhejiang Province range from 0.3 to 0.7, which indicates the air pollution in Zhejiang is not as severe as in Beijing, Tianjin, Hebei and other regions.
(2) The air quality of northern Zhejiang cities (such as Jiaxing, Huzhou, Shaoxing and Hangzhou) is worse than that of the southern cities. The air quality of Shaoxing has dropped by 14.85% at the last study period when compared with that of the beginning period, and Hangzhou, the provincial capital of Zhejiang, has also seen a decrease of 6.69% in air quality. Apart from geographical factors, the industrial structure of these cities is also an important reason for their poor air quality.
(3) The air quality of Lishui, Zhoushan and Wenzhou has improved by 8.04%, 4.67% and 4.22%, respectively, at the last study period when compared with that of the beginning period. In addition to geographical reasons, these three cities have formulated tailored air pollution prevention and control measures based on their own characteristics and the “Regulations on the Prevention and Control of Air Pollution in Zhejiang Province”.
(4) The air quality of the four cities in central Zhejiang (Ningbo, Jinhua, Quzhou and Taizhou) has declined at the last study period when compared with that of the beginning period given that their industrial structure and energy structure have not fundamentally changed during the study period. Among them, Ningbo and Jinhua have seen a large decline in air quality, which are 8.15% and 6.80%, respectively.
The main feature of this study is the comprehensive evaluation of air quality in Zhejiang Province using the data of six air pollutants. Compared with the existing Chinese air pollution research literature, on the one hand, this paper comprehensively evaluates the impact of six kinds of pollutants instead of 1–2 kinds of pollutants according to Chinese national standards. On the other hand, we try to make innovation in the research methods of air pollution by using the Fuzzy Optimization Model Based on Entropy Weight Method, in order to enrich the literature on air pollution and sustainable development.
Based on the findings above, this paper has provided the following policy recommendations for further enhancing air pollution control in the cities of Zhejiang Province:
(1) Adjust the industrial structure as soon as possible to promote industrial upgrading. In the cities of Zhejiang Province, especially in Shaoxing and Ningbo, industry still accounts for a large proportion of the Gross Domestic Product (GDP). In 2017, Shaoxing’s secondary industry output accounted for 48.8% of its total GDP, while its service industry output accounted for 47.2% of its GDP [
84]; Ningbo’s secondary industry output accounted for 51.8% of its total GDP, while its service industry output accounted for 45.0% of its total GDP [
85]. These cities need to accelerate the development of their service industry and promote the transition of its industrial structure towards a low carbon and environmental friendly structure. The key in reducing air pollution in these cities is to optimize the industrial structure and promote industrial upgrade. In order to promote the transformation and upgrade of heavy pollution industrial enterprises, these cities must abandon the old production model and processing mode that sacrifice energy and environment, improve their GDP structure, and lower their level of air pollution. At the same time, it is necessary to vigorously develop advanced manufacturing industries, improve the industrial capacity with help from the advancement of information technologies, promote environmentally friendly industries to form related industrial clusters, and control the emissions of industrial waste gas from their sources. In addition, given the current industrial waste gas emission levels of Zhejiang Province, it is also necessary to speed up the construction of eco-industrial parks, attract funds and talents, and reduce the cost of sewage disposal and pollution treatment in order to facilitate resource saving, industrial upgrading, and pollution/emission reduction.
(2) Increase investment in science and technology, change the current energy consumption structure that heavily relies on coal, and improve the efficiency of energy utilization. Currently, the cities in Zhejiang Province still rely on coal as their main energy source for production. In 2016, the province’s total coal consumption reached 139.48 million tons [
14], which increased by 0.89% compared with that in year 2015 [
86]. Therefore, cities in Zhejiang Province need to enhance the investment in science and technology, change the energy structure over-relying on coal as soon as possible, eliminate coal-fired equipment with heavy pollution, reduce emissions resulted from coal burning, and improve their overall air quality and environment quality. On the one hand, they should continuously reduce the pollution emissions of coal-fired equipment; on the other hand, they need to continuously increase the proportion of clean energy and renewable energy in energy consumption, such as by using subsidies and incentives to encourage enterprises and residents to use clean energy, in order to fundamentally change the current coal-based energy consumption structure. At the same time, they should work to increase the output per unit of energy consumption by applying the latest scientific and technological achievements in the energy field to industrial production and daily life, reducing the energy consumption per unit of regional GDP with help from scientific and technological advancement in order to effectively control air pollution.
(3) Further improve laws and regulations on air pollution control, and enhance the legislation and law enforcement work on environmental protection. All cities in Zhejiang Province need to strengthen their legislation on air pollution control, especially the legislation of laws and regulations on industrial waste gas emission. The cities need to scientifically classify the enterprises by pollutant emissions, monitor and control the pollution emissions based on a grading standard and have clear rules and standards to follow. In law enforcement work, the cities need to suspend the production of enterprises that fail to meet national and provincial standards and order them to rectify, strictly supervise and control the approval and construction of high-pollution projects, and completely eradicate illegal pollution emission. It is necessary to strictly restrict the emissions of enterprises by legal provisions, investigate the enterprises that have violated the laws, and hold their responsible persons accountable by law. Furthermore, it is necessary to strengthen environmental protection supervision work, determine and clarify the accountability in environmental protection among governments at all levels, and actively cooperate with environmental protection departments to perform supervision/investigation and law enforcement work. At the same time, the cities should encourage their residents to participate in environmental supervision and management, and accept social supervision in order to eventually establish a long-term system for air pollution control with continuous improvement.


