Variations and Indications of δ13CSOC and δ15NSON in Soil Profiles in Karst Critical Zone Observatory (CZO), Southwest China


Abstract
:1. Introduction
2. Materials and Methods
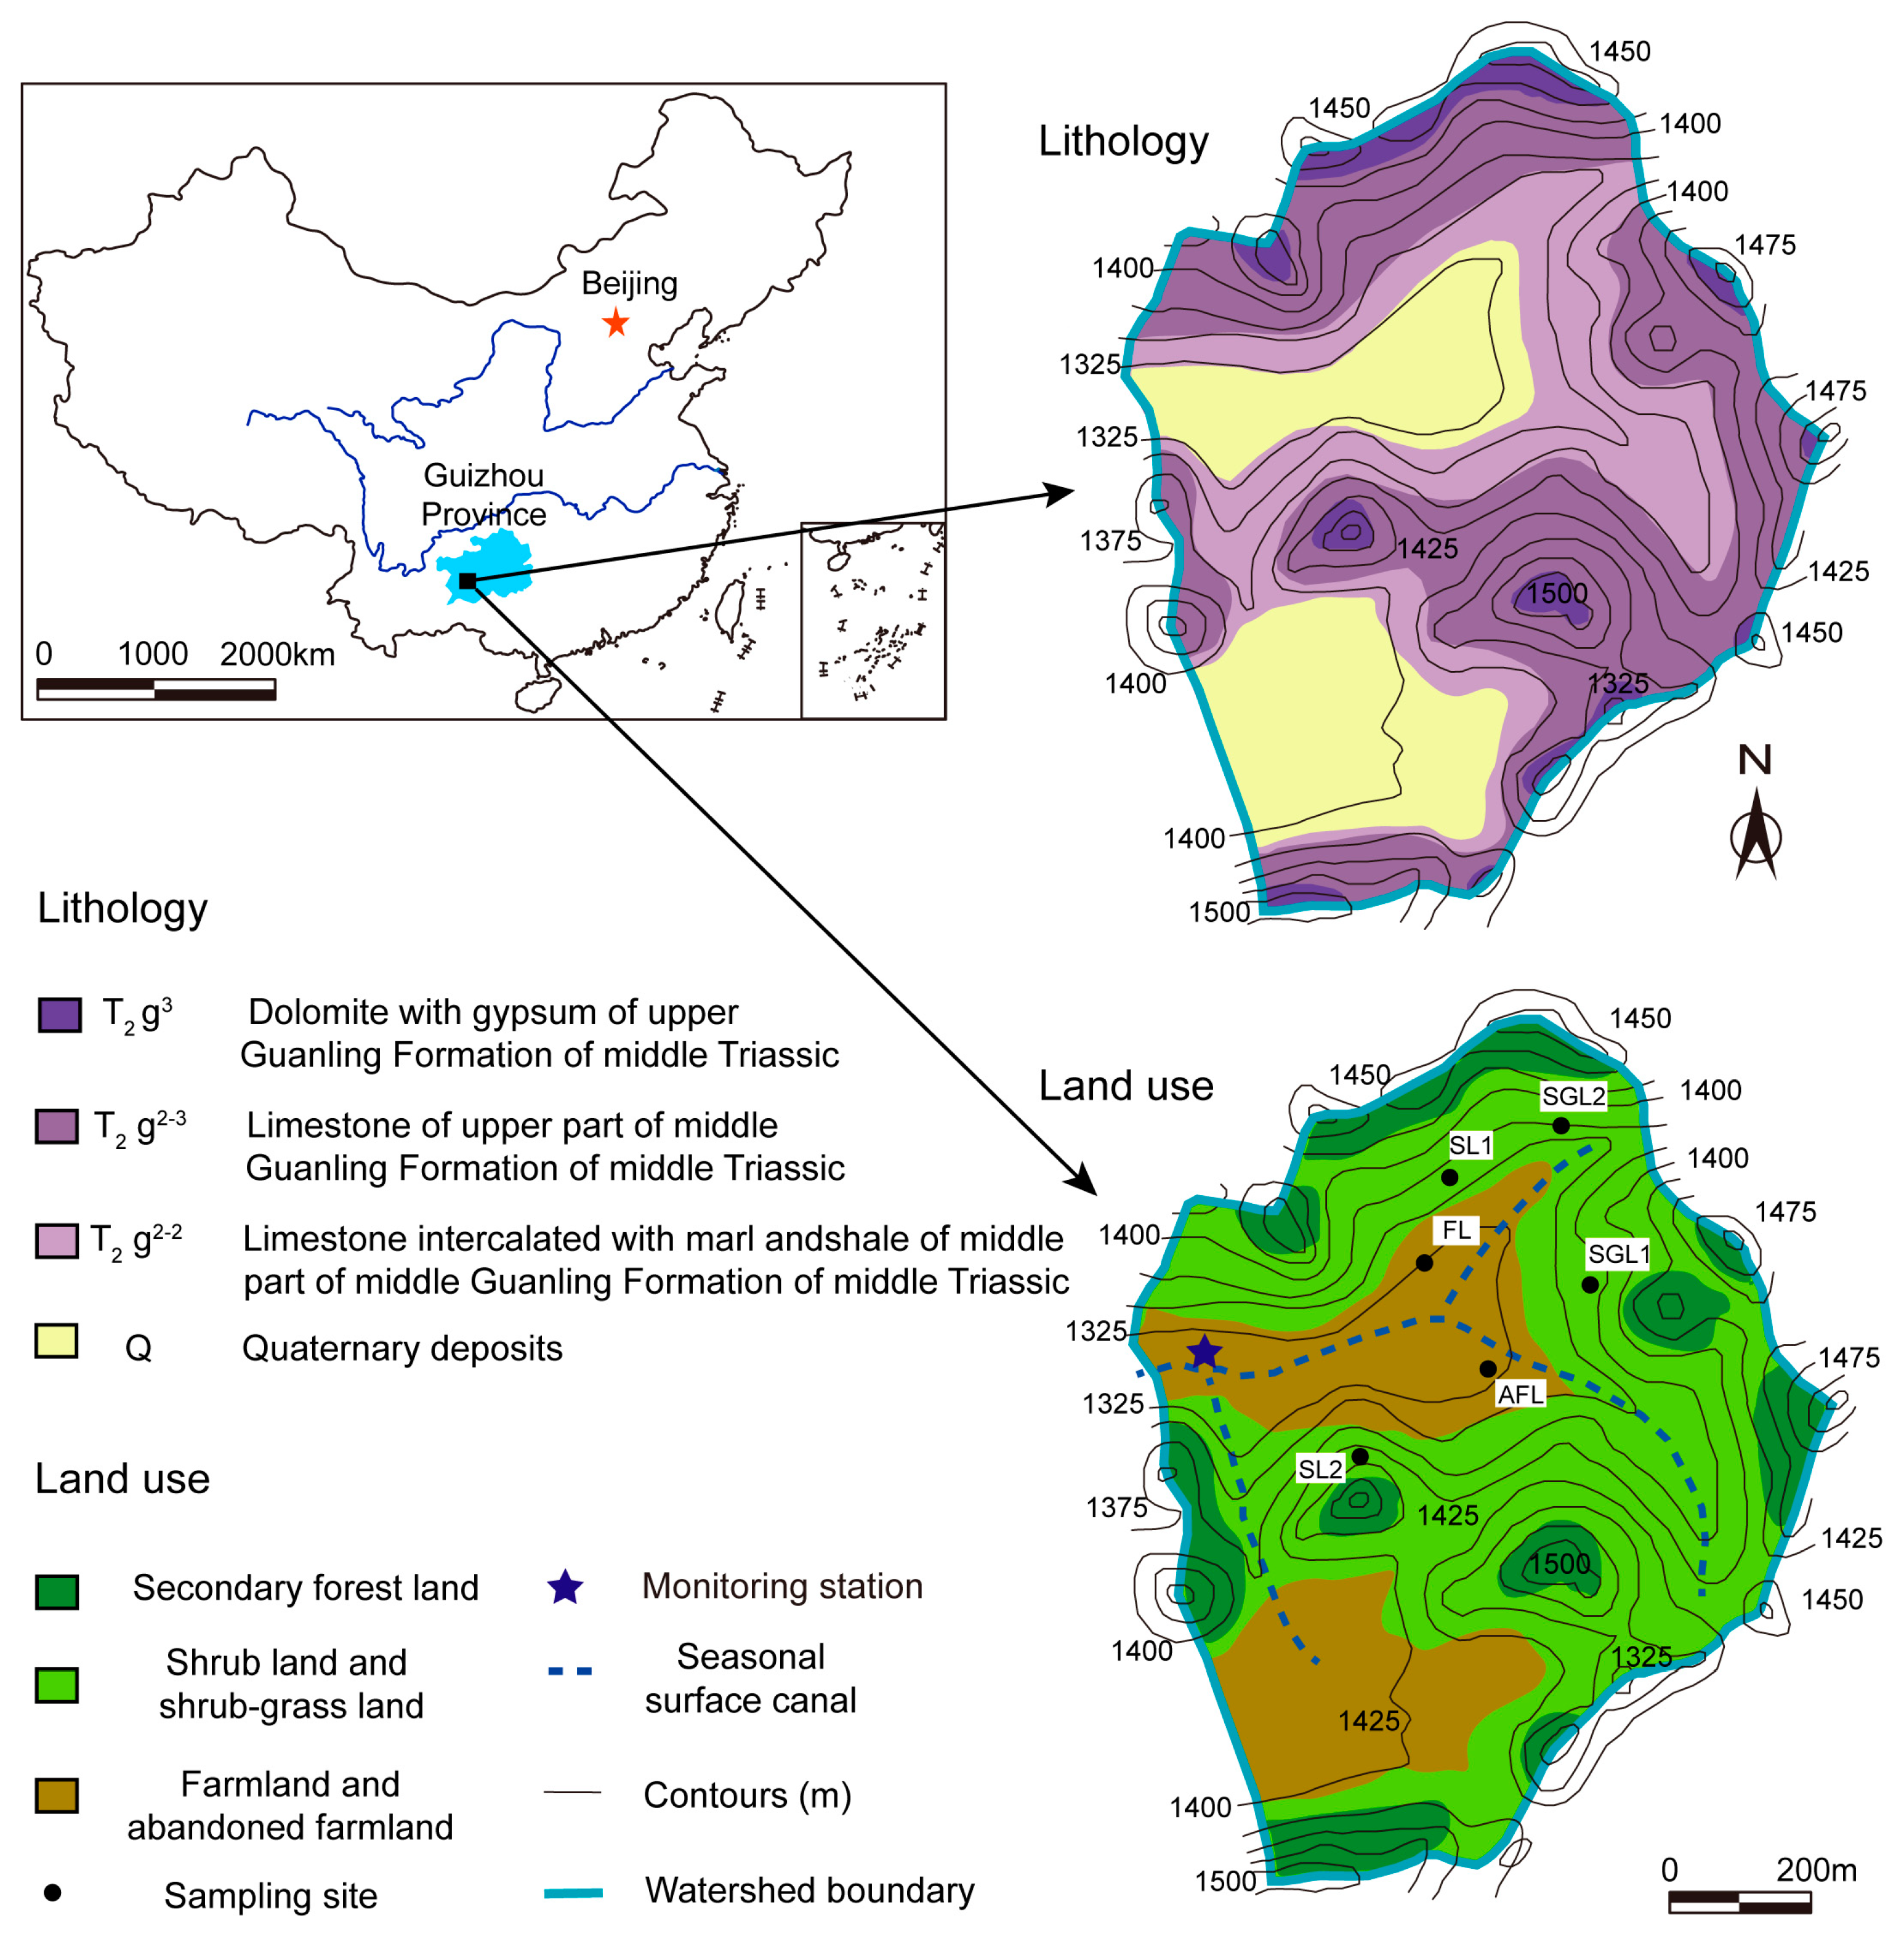
2.1. Study Area
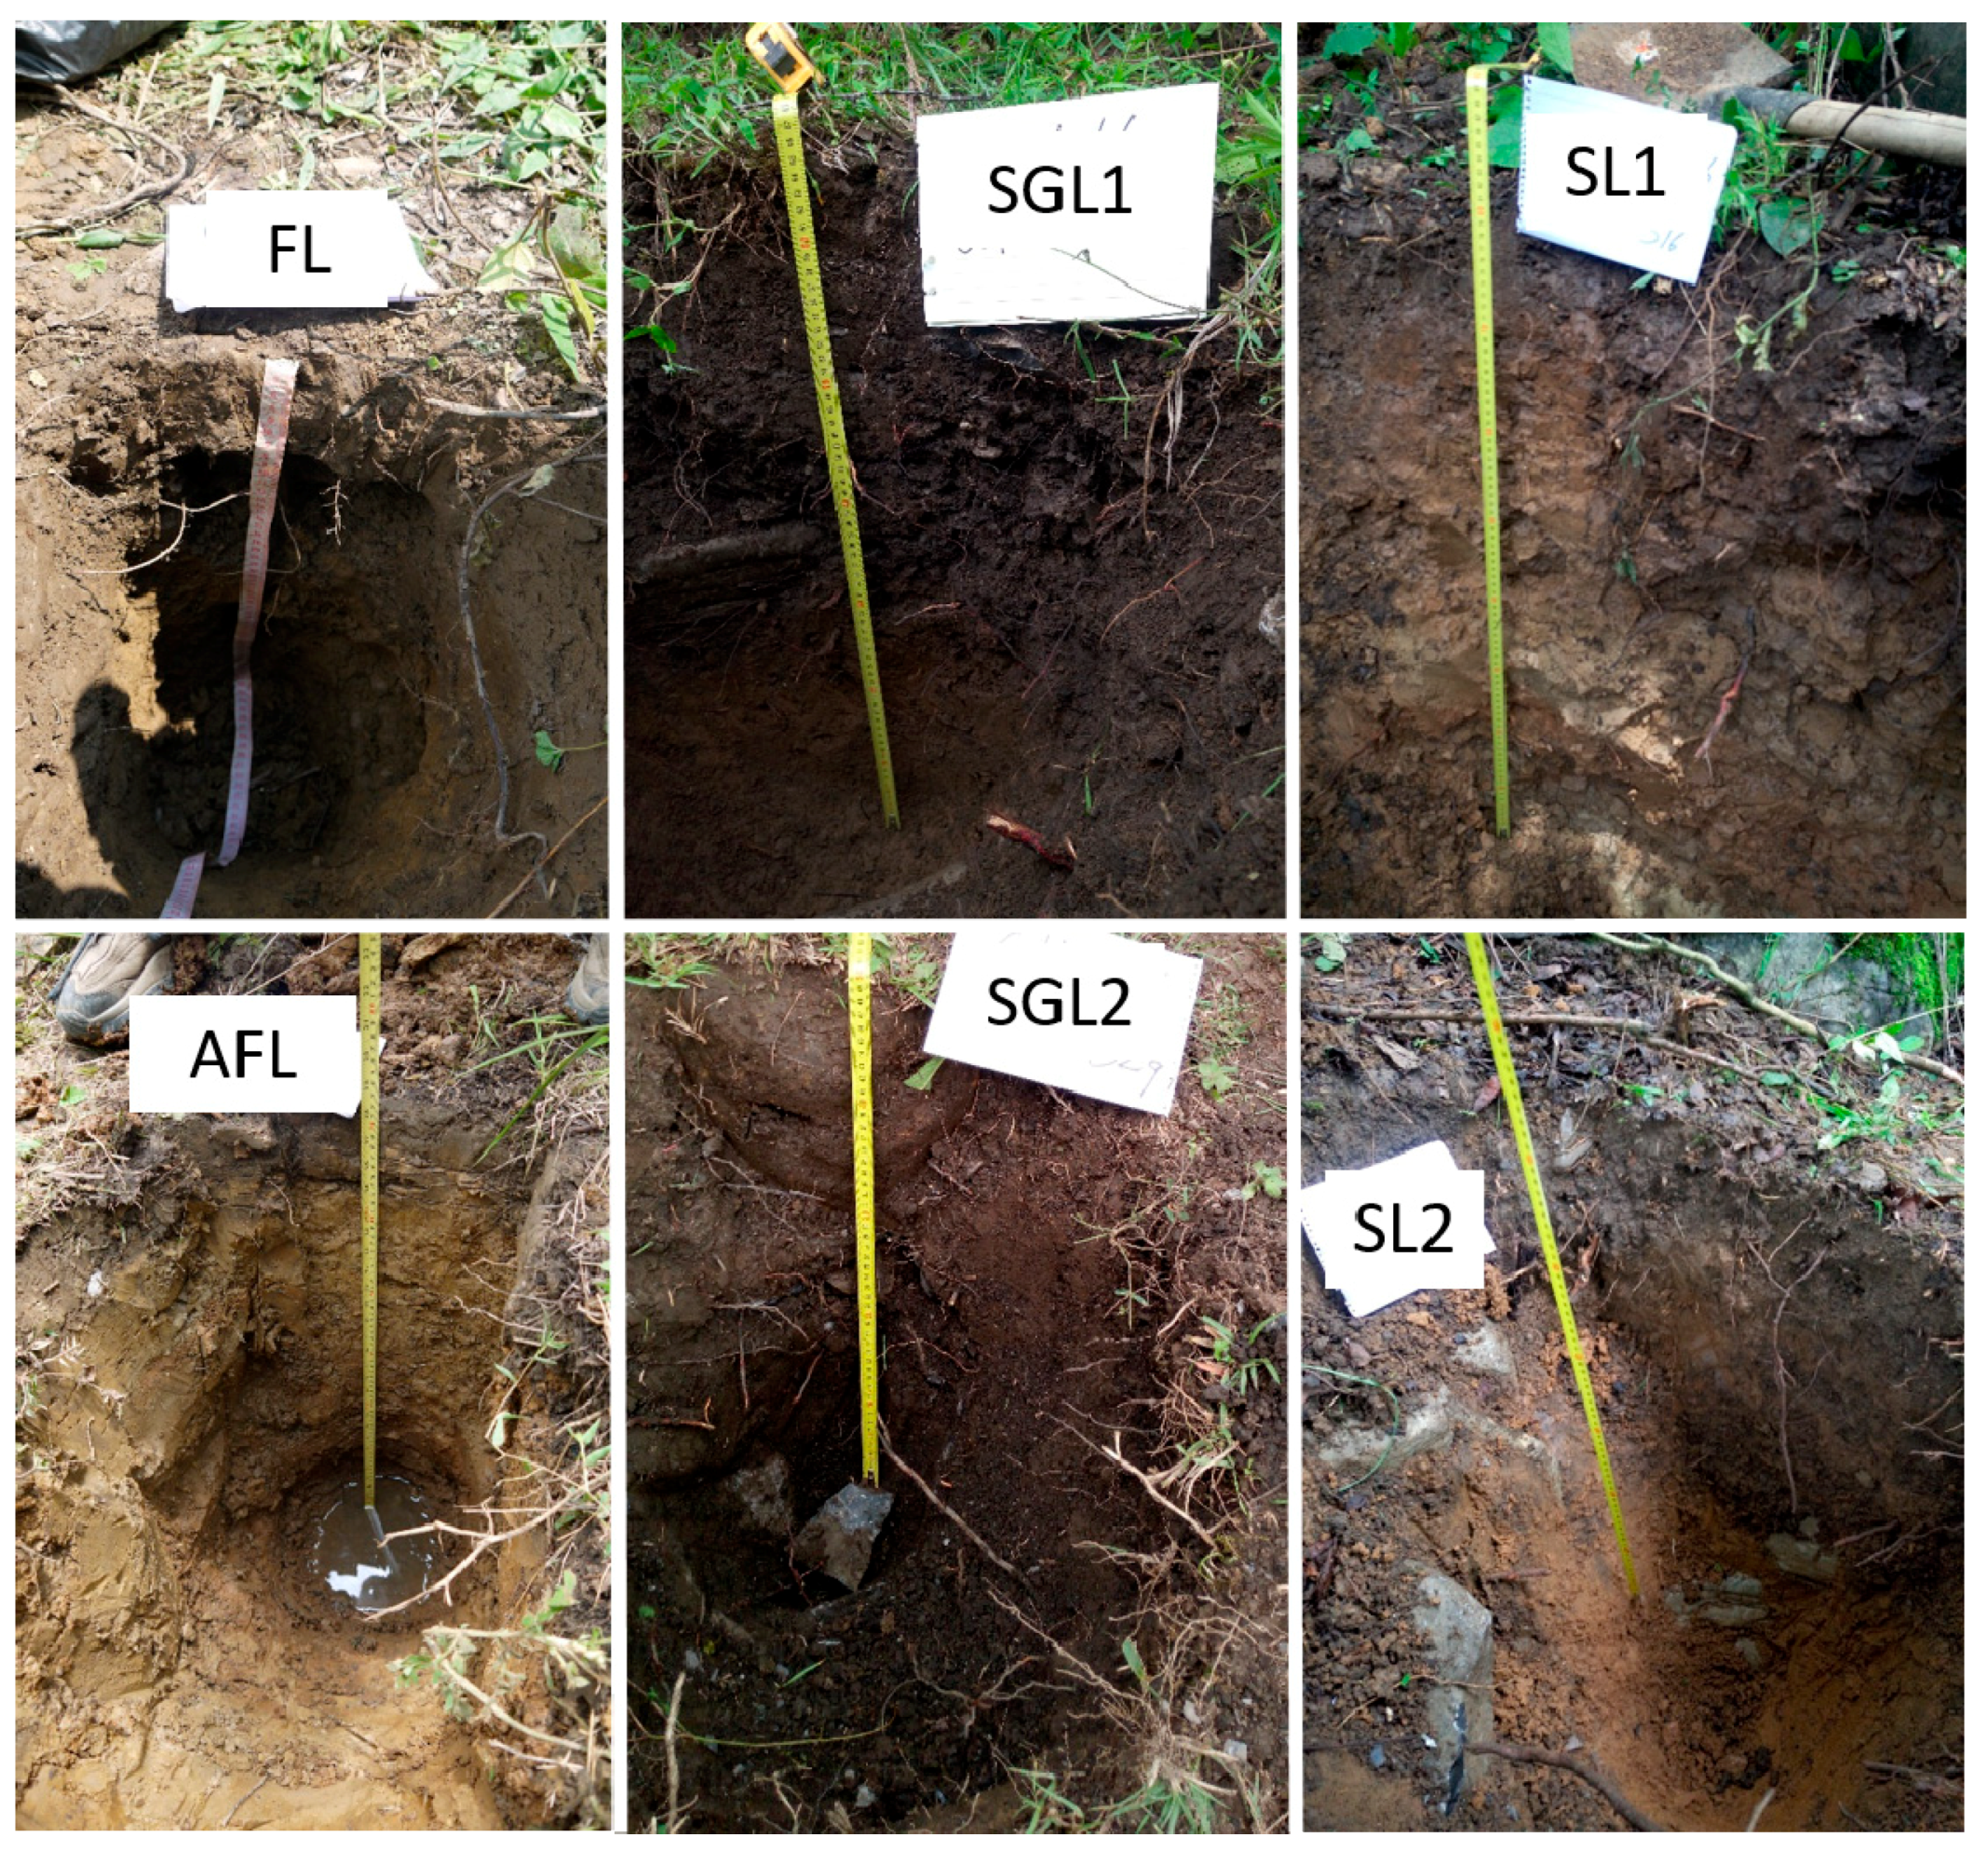
2.2. Soil Sampling
2.3. Soil Analysis
2.4. Statistical Analysis
3. Results
3.1. Soil Particle Distribution and Soil pH
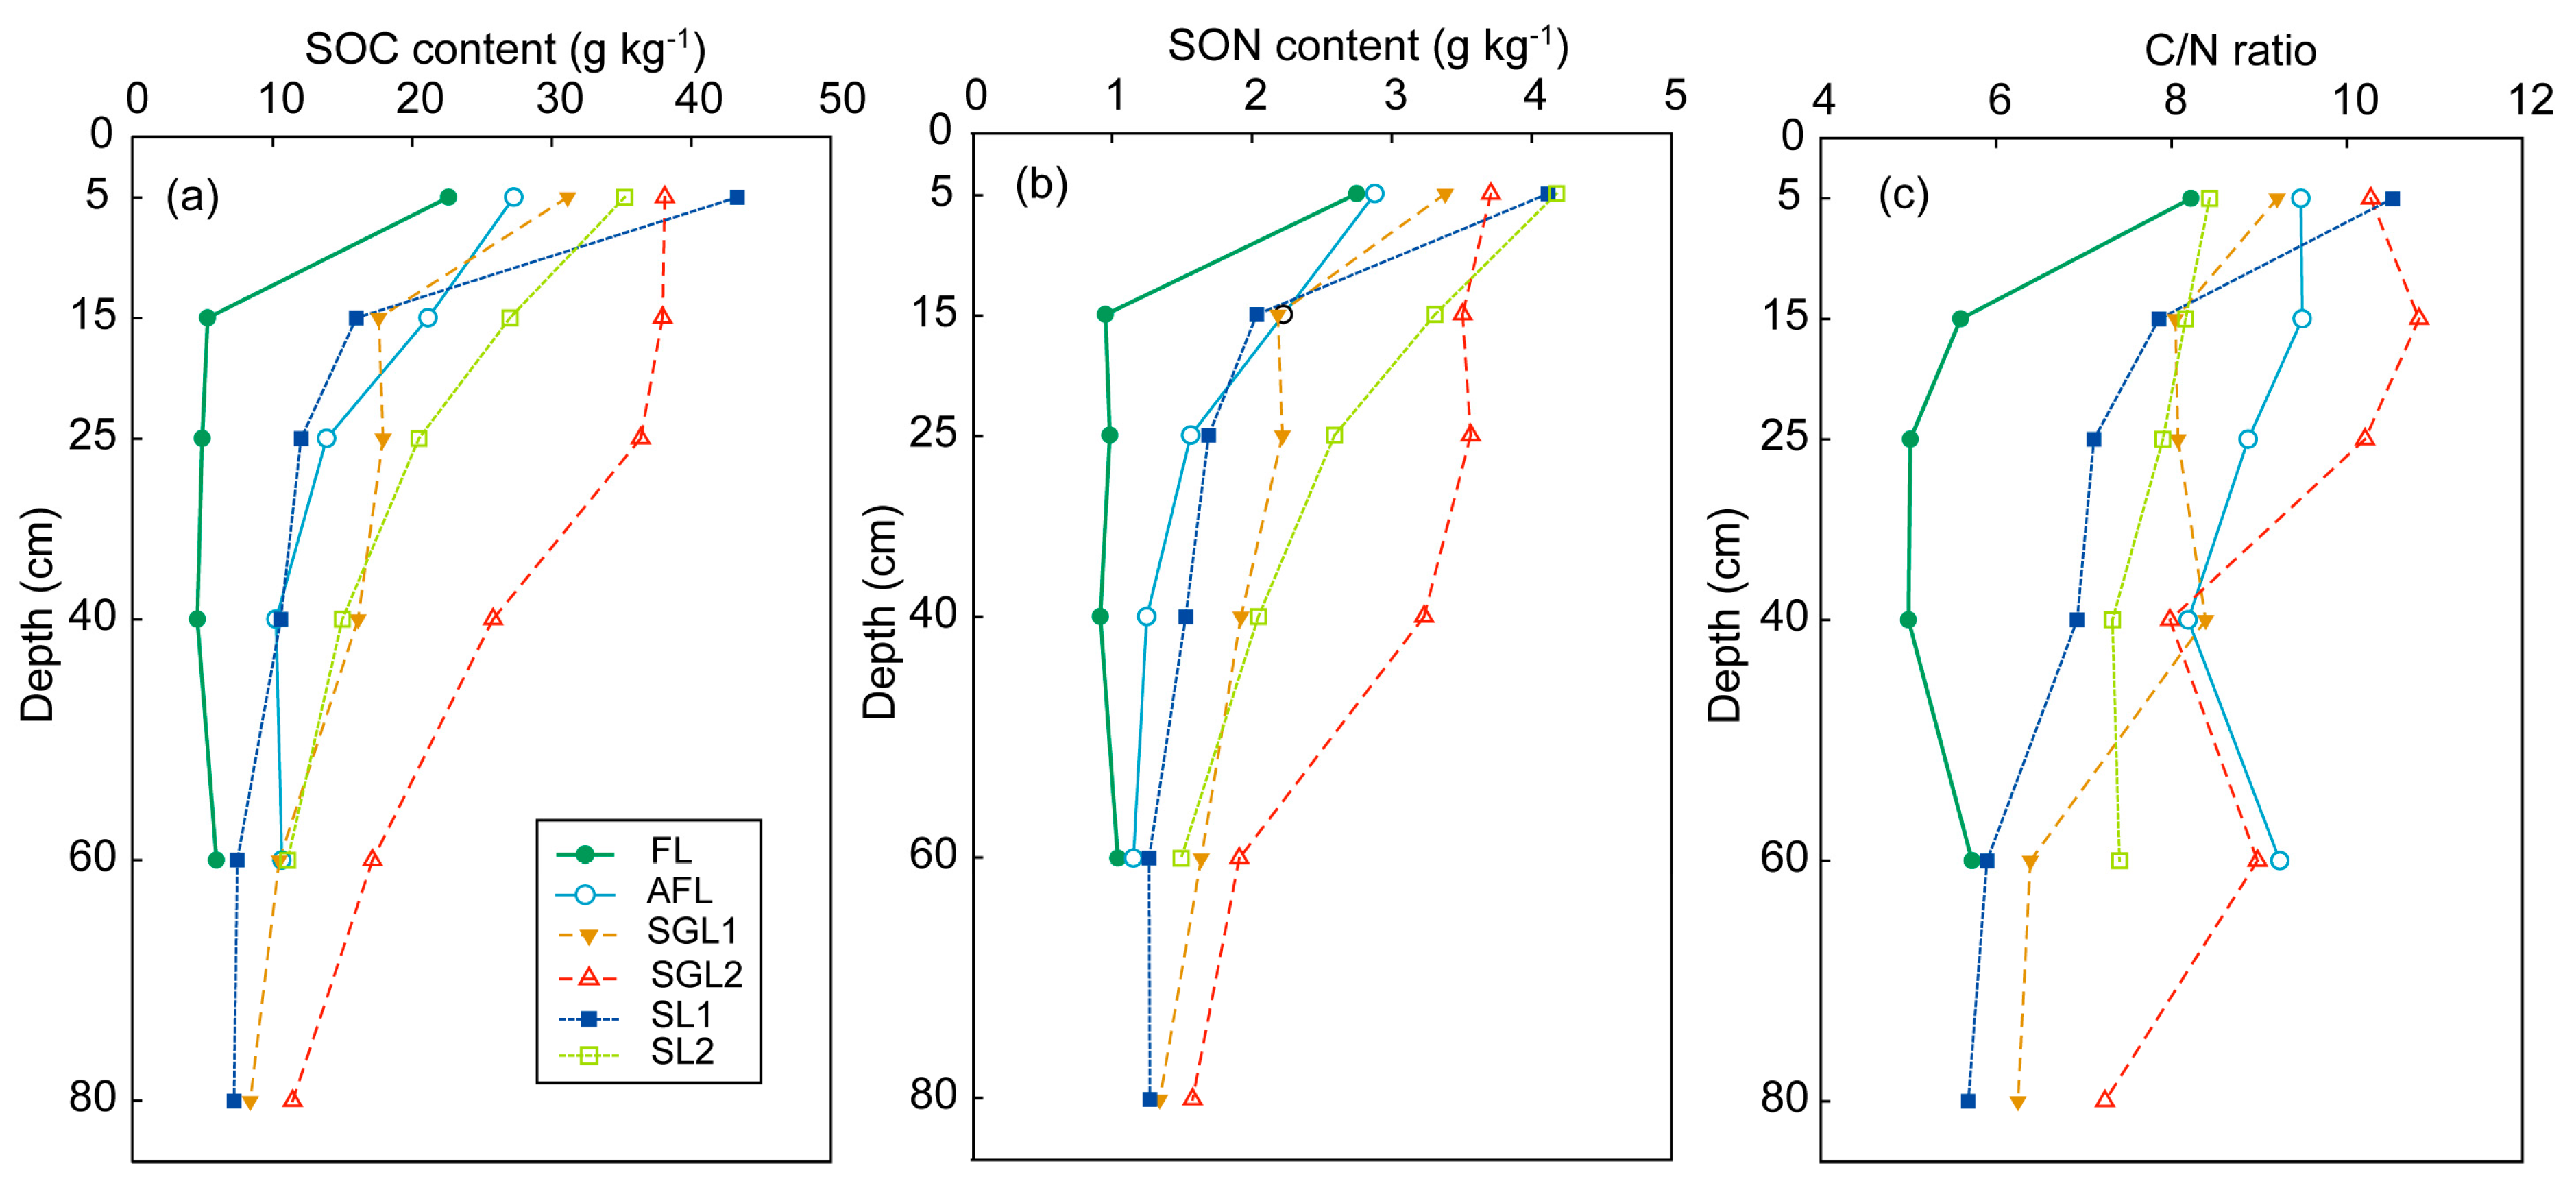
3.2. SOC and SON Content and C/N Ratio
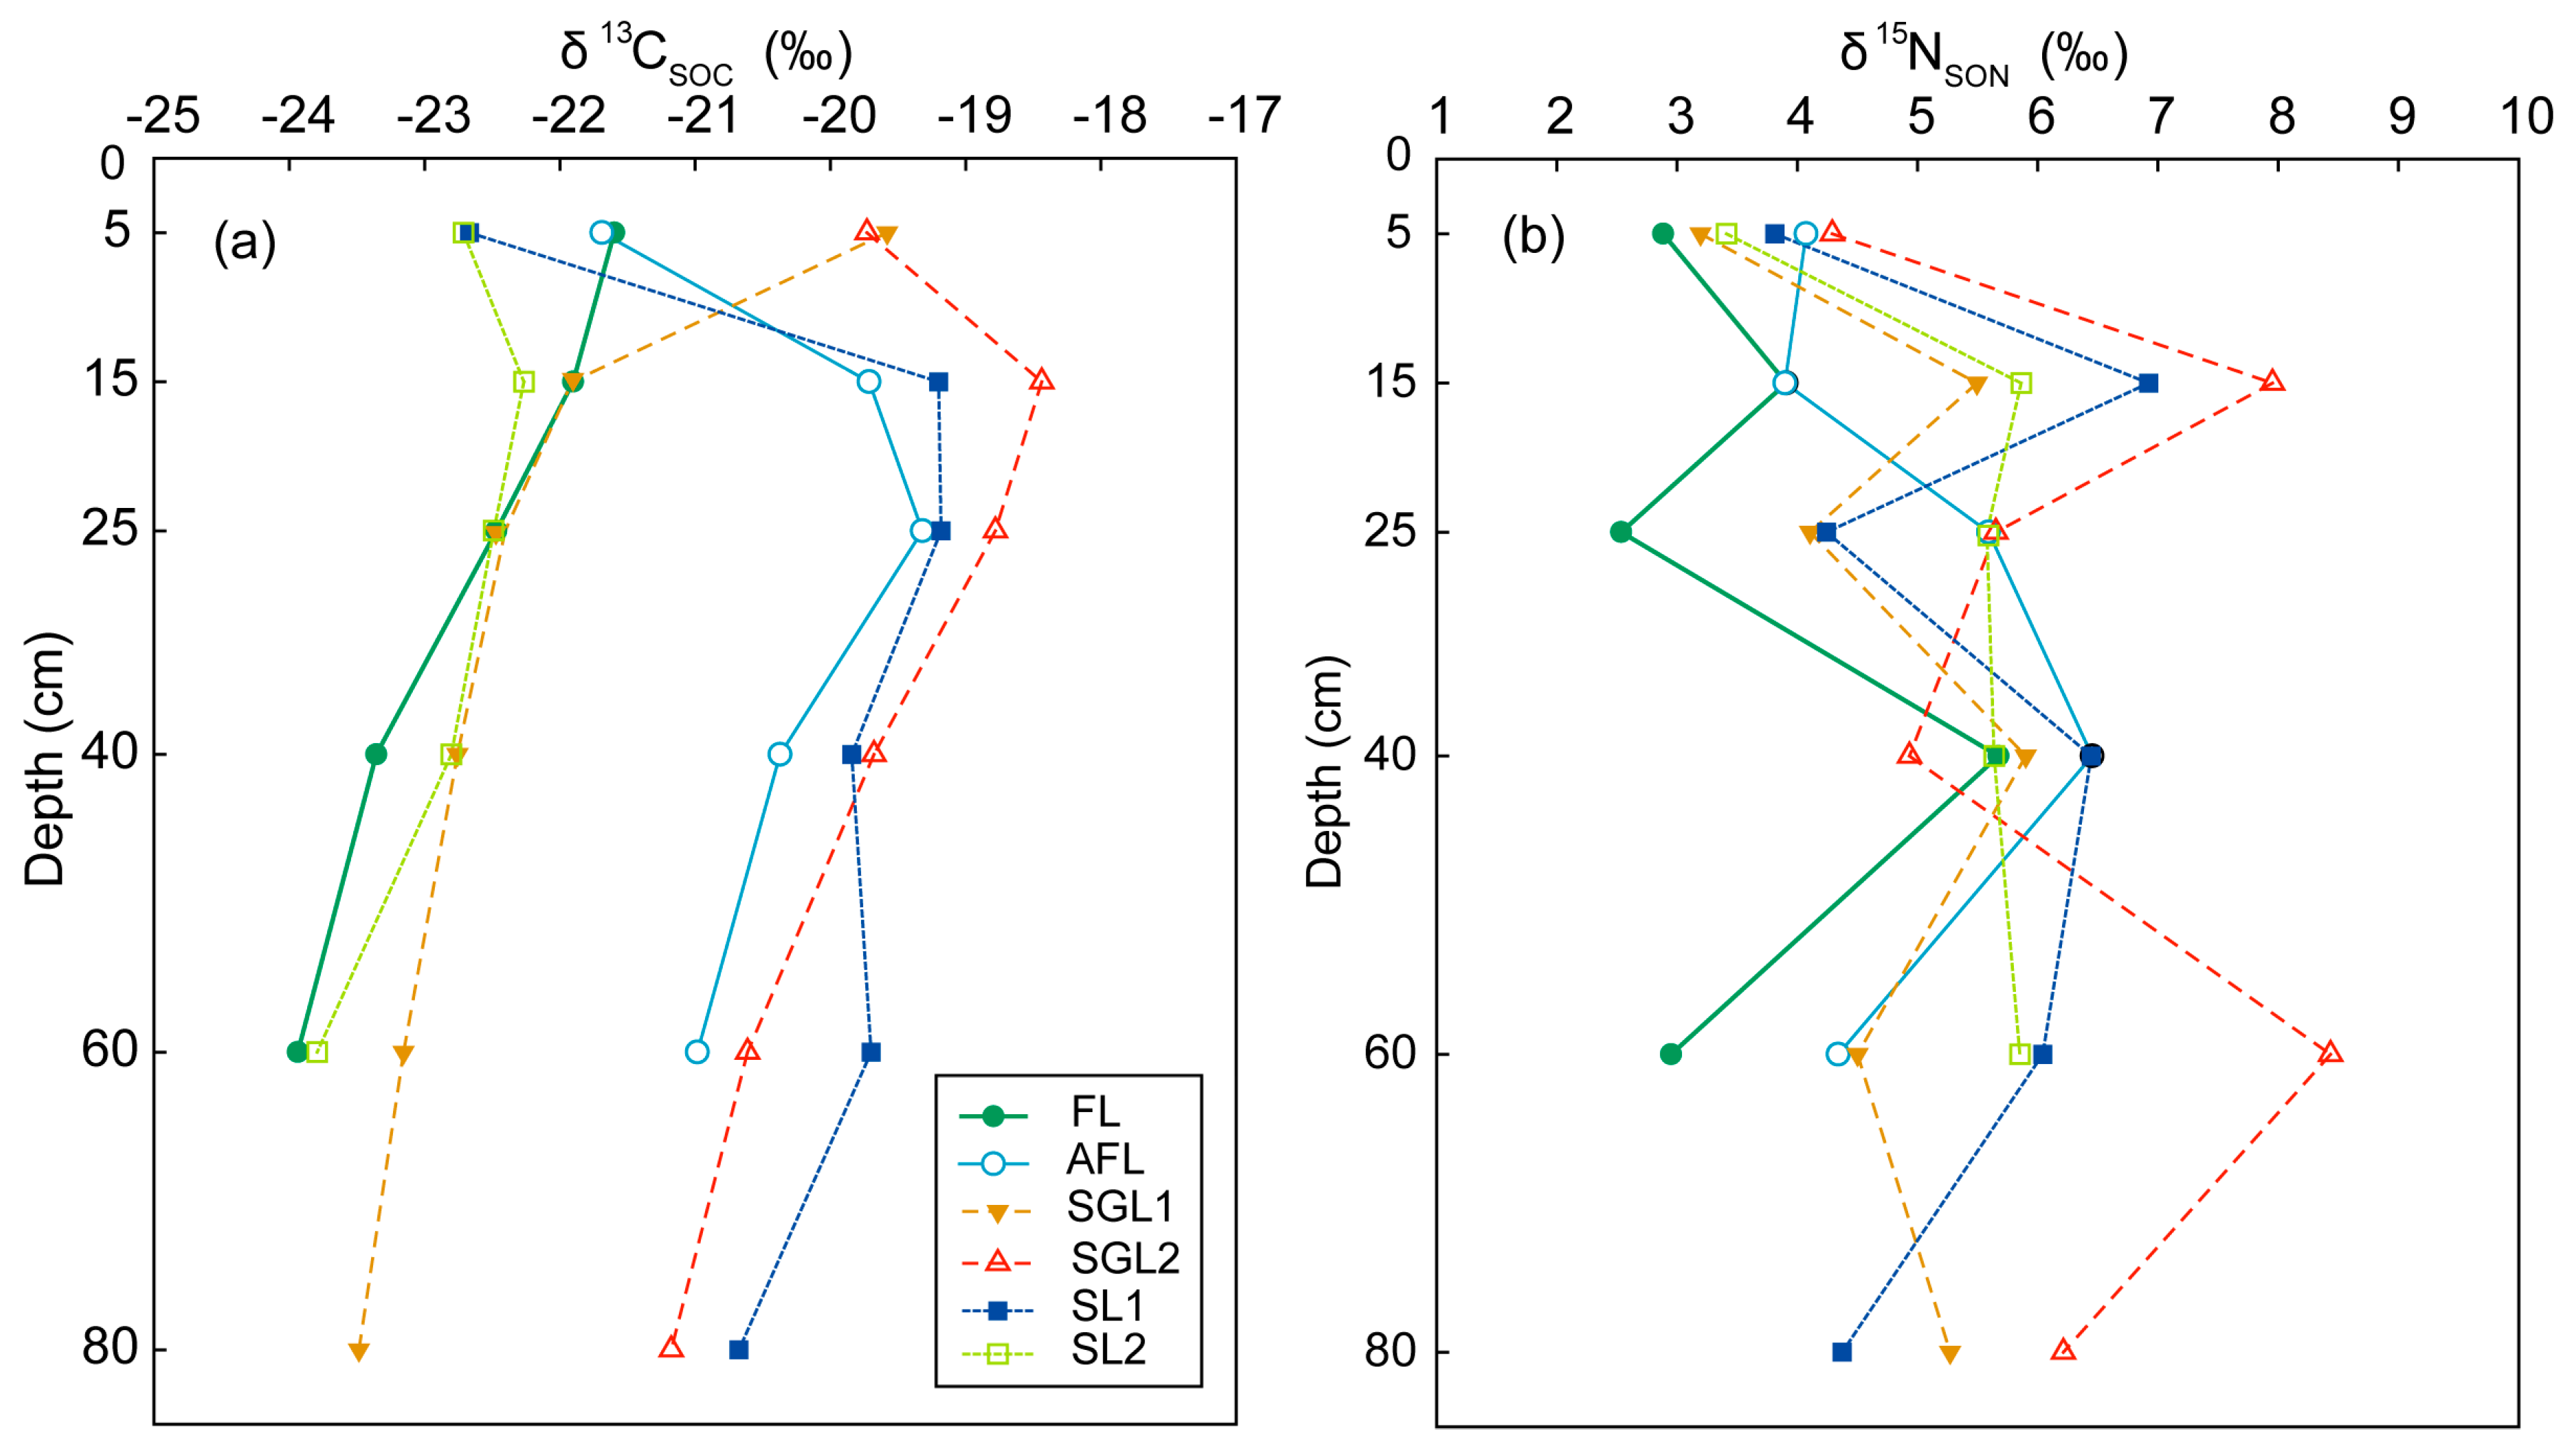
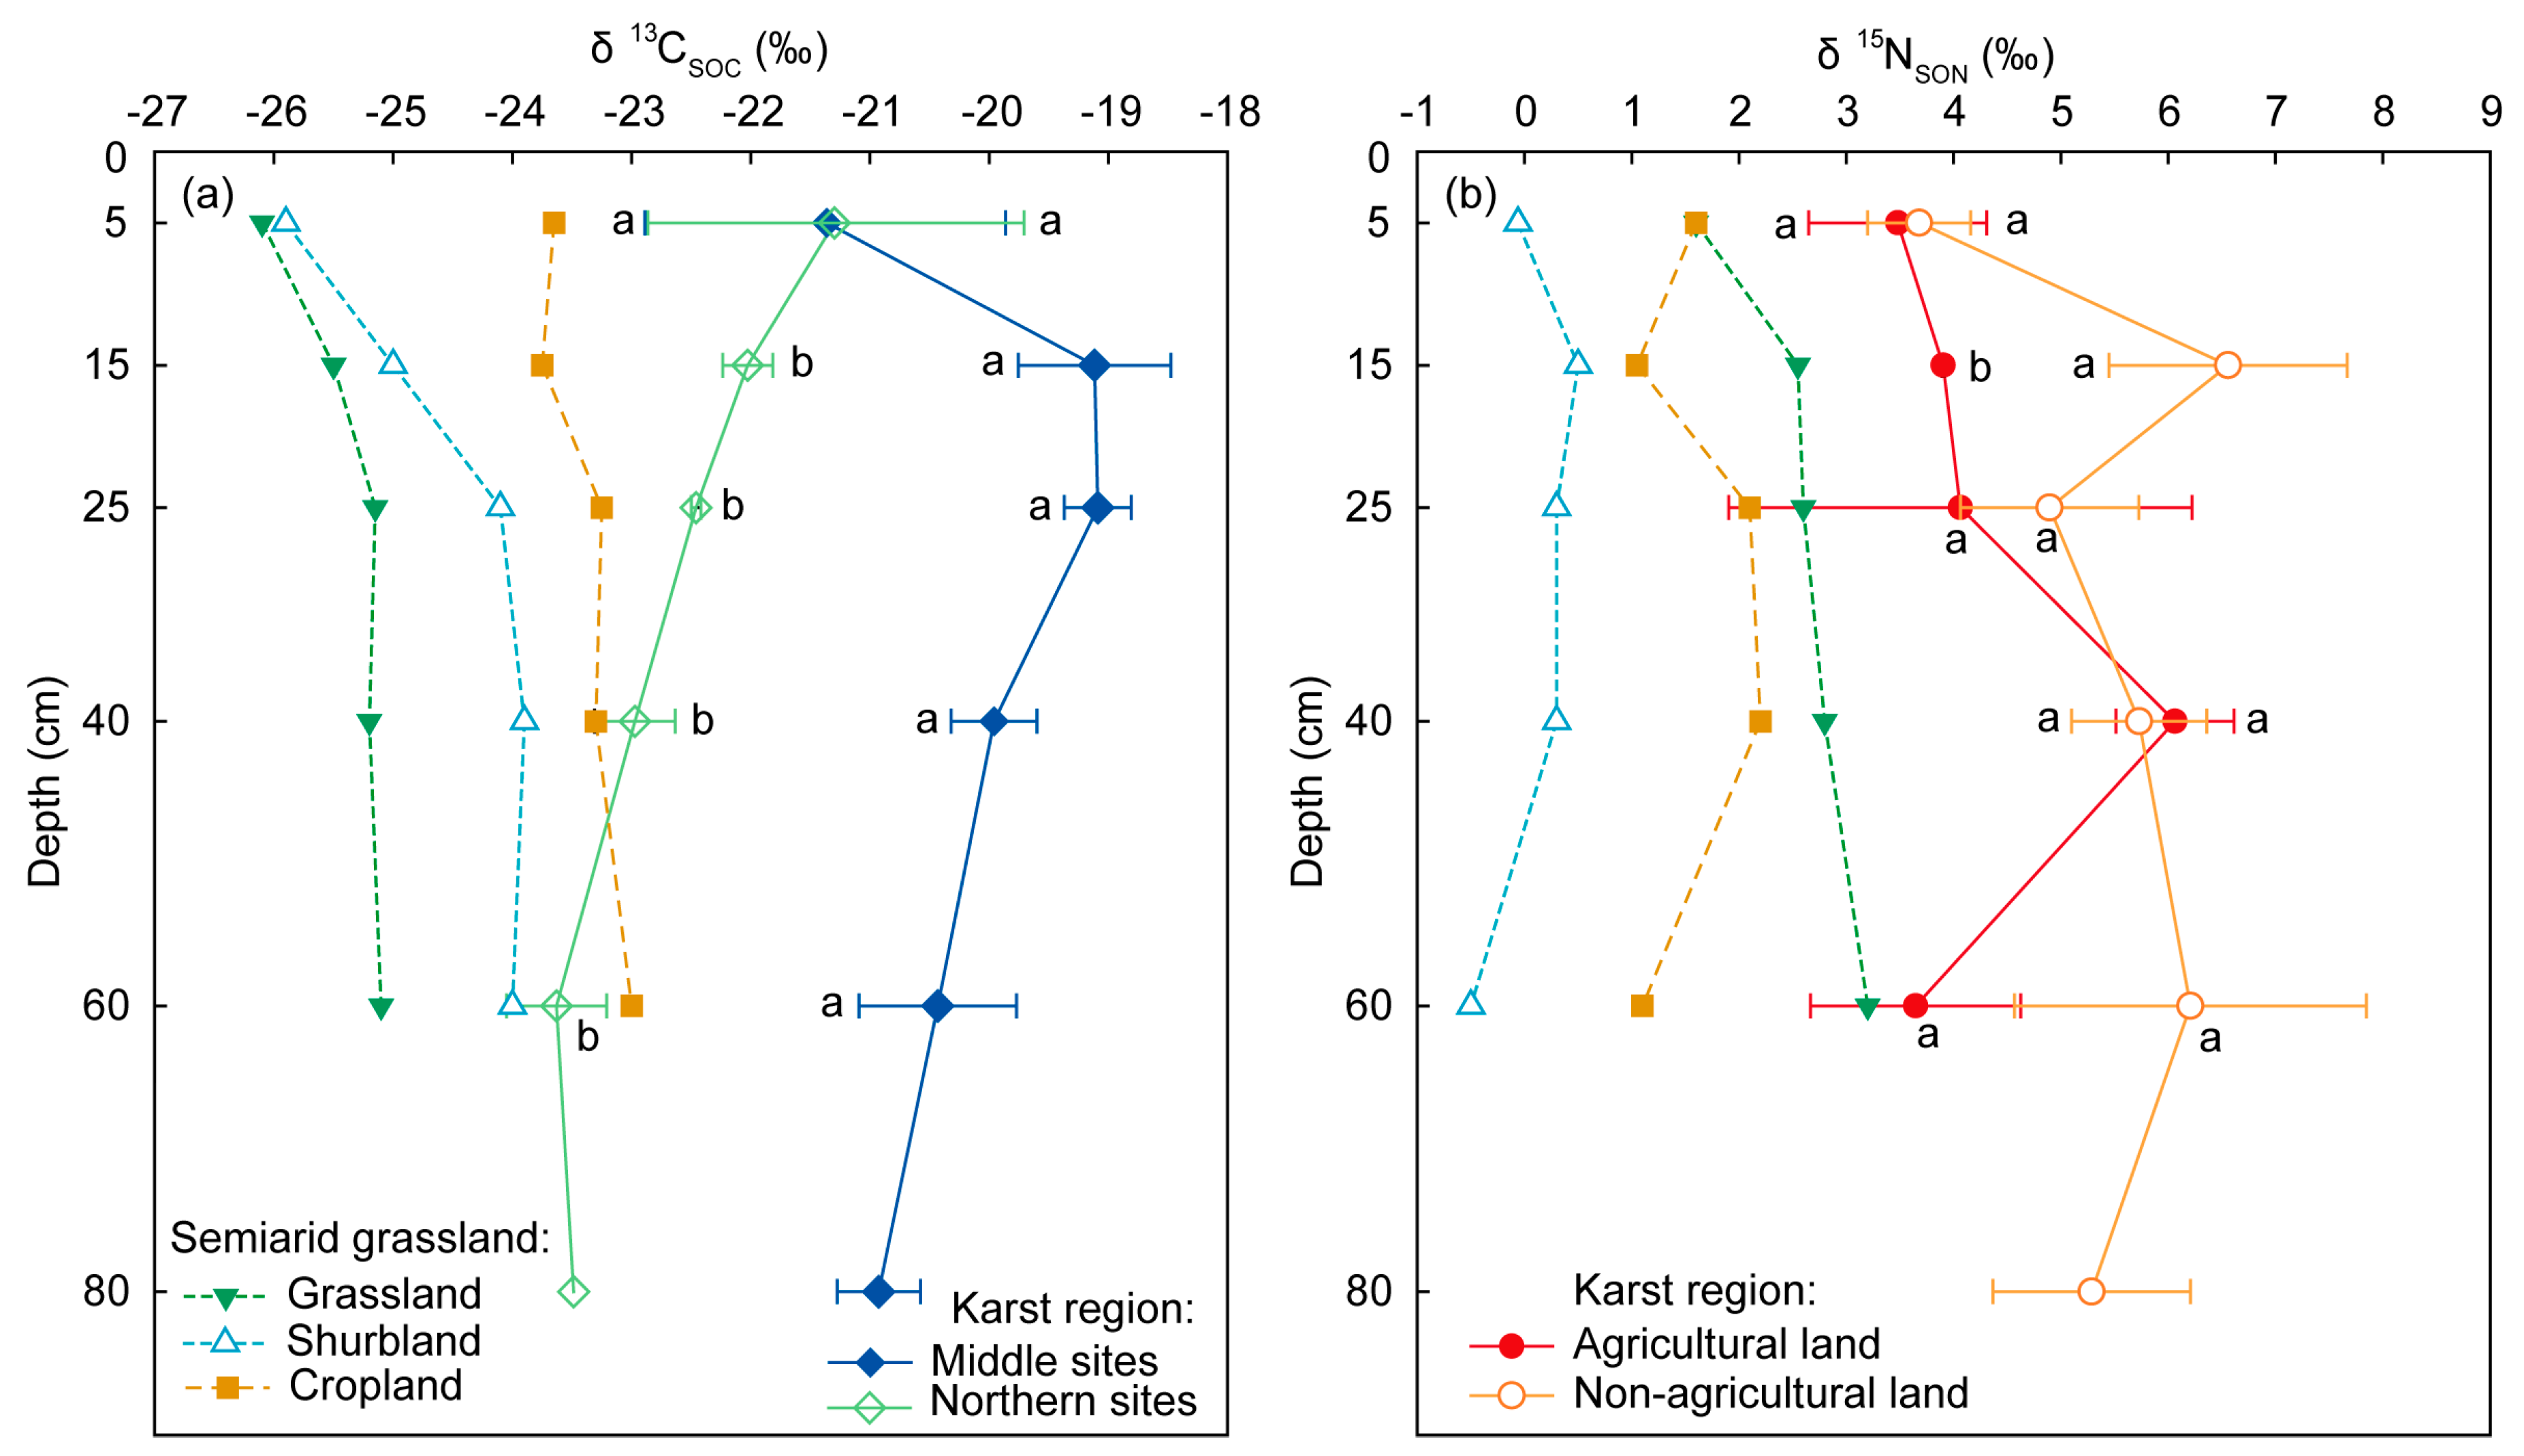
3.3. δ13CSOC and δ15NSON in Soil Profiles
4. Discussion
4.1. Indication of Agricultural Activity, C and N Sources in Agricultural Land
4.2. Fractionation of C and N Isotopic in Decomposition, Transformation, and Translocation Processes
4.3. The Impacts of the Soil Organic C and N Isotopic Fractionation on Source Identification in the Karst Soil
5. Conclusions
Author Contributions
Funding
Acknowledgments
Conflicts of Interest
References
- Qadir, M.; Noble, A.D.; Schubert, S.; Thomas, R.J.; Arslan, A. Sodicity-induced land degradation and its sustainable management: Problems and prospects. Land Degrad. Dev. 2010, 17, 661–676. [Google Scholar] [CrossRef]
- Lehmann, J.; Kleber, M. The contentious nature of soil organic matter. Nature 2015, 528, 60–68. [Google Scholar] [CrossRef]
- Anaya, C.A.; Huber-Sannwald, E. Long-term soil organic carbon and nitrogen dynamics after conversion of tropical forest to traditional sugarcane agriculture in East Mexico. Soil Till. Res. 2015, 147, 20–29. [Google Scholar] [CrossRef]
- Congreves, K.A.; Hooker, D.C.; Hayes, A.; Verhallen, E.A.; Eerd, L.L.V. Interaction of long-term nitrogen fertilizer application, crop rotation, and tillage system on soil carbon and nitrogen dynamics. Plant Soil 2017, 410, 1–15. [Google Scholar] [CrossRef]
- Rasmussen, P.E.; Collins, H.P. Long-term impacts of tillage, fertilizer, and crop residue on soil organic matter in temperate semiarid regions. Adv. Agron. 1991, 45, 93–134. [Google Scholar]
- Sanz-Cobena, A.; Lassaletta, L.; Garnier, J.; Smith, P. Mitigation and quantification of greenhouse gas emissions in Mediterranean cropping systems. Agric. Ecosyst. Environ. 2017, 238, 1–4. [Google Scholar] [CrossRef]
- Shelton, R.E.; Jacobsen, K.L.; Mcculley, R.L. Cover crops and fertilization alter nitrogen loss in organic and conventional conservation agriculture systems. Front. Plant Sci. 2017, 8, 2260. [Google Scholar] [CrossRef]
- Araujo, M.A.; Zinn, Y.L.; Lal, R. Soil parent material, texture and oxide contents have little effect on soil organic carbon retention in tropical highlands. Geoderma 2017, 300, 1–10. [Google Scholar] [CrossRef]
- Fissore, C.; Dalzell, B.J.; Berhe, A.A.; Voegtle, M.; Evans, M.; Wu, A. Influence of topography on soil organic carbon dynamics in a Southern California grassland. Catena 2017, 149, 140–149. [Google Scholar] [CrossRef]
- Reddy, K.R.; Patrick, W.H. Effect of alternate aerobic and anaerobic conditions on redox potential, organic matter decomposition and nitrogen loss in a flooded soil. Soil Biol. Biochem. 1975, 7, 87–94. [Google Scholar] [CrossRef]
- Balesdent, J.; Mariotti, A.; Boisgontier, D. Effect of tillage on soil organic carbon mineralization estimated from 13C abundance in maize fields. Eur. J. Soil Sci. 1990, 41, 587–596. [Google Scholar] [CrossRef]
- Biggs, T.H.; Quade, J.; Webb, R.H. δ13C values of soil organic matter in semiarid grassland with mesquite (Prosopis) encroachment in southeastern Arizona. Geoderma 2002, 110, 109–130. [Google Scholar] [CrossRef]
- Blagodatskaya, E.; Yuyukina, T.; Blagodatsky, S.; Kuzyakov, Y. Turnover of soil organic matter and of microbial biomass under C3–C4 vegetation change: Consideration of 13C fractionation and preferential substrate utilization. Soil Biol. Biochem. 2011, 43, 159–166. [Google Scholar] [CrossRef]
- Six, J.; Elliott, E.T.; Paustian, K. Soil macroaggregate turnover and microaggregate formation: A mechanism for C sequestration under no-tillage agriculture. Soil Biol. Biochem. 2000, 32, 2099–2103. [Google Scholar] [CrossRef]
- West, J.B.; Bowen, G.J.; Cerling, T.E.; Ehleringer, J.R. Stable isotopes as one of nature’s ecological recorders. Trends Ecol. Evol. 2006, 21, 408–414. [Google Scholar] [CrossRef]
- Vagen, T.G.; Walsh, M.G.; Shepherd, K.D. Stable isotopes for characterisation of trends in soil carbon following deforestation and land use change in the highlands of Madagascar. Geoderma 2006, 135, 133–139. [Google Scholar] [CrossRef]
- Farquhar, G.D.; Ehleringer, J.R.; Hubick, K.T. Carbon isotope discrimination and photosynthesis. Annu. Rev. Plant Biol. 1989, 40, 503–537. [Google Scholar] [CrossRef]
- Krull, E.S.; Skjemstad, J.O. δ13C and δ15N profiles in 14C-dated Oxisol and Vertisols as a function of soil chemistry and mineralogy. Geoderma 2003, 112, 1–29. [Google Scholar] [CrossRef]
- Chen, Q.Q.; Shen, C.D.; Sun, Y.M.; Peng, S.L.; Yi, W.X.; Li, Z.A.; Jiang, M.T. Spatial and temporal distribution of carbon isotopes in soil organic matter at the Dinghushan Biosphere Reserve, South China. Plant Soil 2005, 273, 115–128. [Google Scholar] [CrossRef]
- Zhu, Q.; Castellano, M.J.; Yang, G. Coupling soil water processes and nitrogen cycle across spatial scales: Potentials, bottlenecks and solutions. Earth-Sci. Rev. 2018, 187, 248–258. [Google Scholar] [CrossRef]
- Choi, W.J.; Kwak, J.H.; Lim, S.S.; Park, H.J.; Chang, S.X.; Lee, S.M.; Arshad, M.A.; Yun, S.I.; Kim, H.Y. Synthetic fertilizer and livestock manure differently affect δ15N in the agricultural landscape: A review. Agric. Ecosyst. Environ. 2017, 237, 1–15. [Google Scholar] [CrossRef]
- Lim, S.S.; Kwak, J.H.; Lee, K.S.; Chang, S.X.; Yoon, K.S.; Kim, H.Y.; Choi, W.J. Soil and plant nitrogen pools in paddy and upland ecosystems have contrasting δ15N. Biol. Fertil. Soils 2015, 51, 231–239. [Google Scholar] [CrossRef]
- Robinson, D. δ15N as an integrator of the nitrogen cycle. Trends Ecol. Evol. 2001, 16, 153–162. [Google Scholar] [CrossRef]
- Denk, T.R.A.; Mohn, J.; Decock, C.; Lewicka-Szczebak, D.; Harris, E.; Butterbach-Bahl, K.; Kiese, R.; Wolf, B. The nitrogen cycle: A review of isotope effects and isotope modeling approaches. Soil Biol. Biochem. 2017, 105, 121–137. [Google Scholar] [CrossRef]
- Mobley, M.L. Monitoring Earth’s critical zone. Science 2009, 326, 1067–1068. [Google Scholar]
- Quine, T.; Guo, D.; Green, S.M.; Tu, C.; Hartley, I.; Zhang, X.; Dungait, J.; Wen, X.; Song, Z.; Liu, H. Ecosystem service delivery in Karst landscapes: Anthropogenic perturbation and recovery. Acta Geochim. 2017, 36, 416–420. [Google Scholar] [CrossRef]
- Wang, S.J.; Liu, Q.M.; Zhang, D.F. Karst rocky desertification in southwestern China: Geomorphology, landuse, impact and rehabilitation. Land Degrad. Dev. 2004, 15, 115–121. [Google Scholar] [CrossRef]
- Zhao, M.; Zeng, C.; Liu, Z.H.; Wang, S.J. Effect of different land use/land cover on karst hydrogeochemistry: A paired catchment study of Chenqi and Dengzhanhe, Puding, Guizhou, SW China. J. Hydrol. 2010, 388, 121–130. [Google Scholar] [CrossRef]
- Soil Survey Staff. Keys to Soil Taxonomy, 12th ed.; USDA Natural Resources Conservation Service: Washington, DC, USA, 2014; pp. 161–195.
- Han, G.L.; Li, F.S.; Tang, Y. Organic matter impact on distribution of rare earth elements in soil under different land uses. Clean Soil Air Water 2017, 45, 1600235. [Google Scholar] [CrossRef]
- Yang, R.; Zhao, M.; Zeng, C.; Chen, B.; Liu, Z. Spatiotemporal variations of Soil CO2 in Chenqi, Puding, SW China: The effects of weather and LUCC. In Hydrogeological and Environmental Investigations in Karst Systems; Andreo, B., Carrasco, F., Durán, J.J., Jiménez, P., LaMoreaux, J.W., Eds.; Springer: Berlin, Germany, 2015; pp. 191–205. [Google Scholar]
- Piao, H.C.; Liu, Q.M.; Deng, Y.U.; Guo, J.H.; Ran, J.C. Origins of soil organic carbon with the method of natural 13C abundance in maize fields. Acta Ecol. Sin. 2001, 21, 434–439. (In Chinese) [Google Scholar]
- Piao, H.C.; Zhu, J.M.; Yu, D.L.; Ran, J.C. The contrlling factors of C4-grass C/N ratios and their relationships with soil organic carbon accumulation. Quat. Sci. 2004, 24, 621–629. (In Chinese) [Google Scholar]
- Du, X.L.; Wang, S.J.; Luo, X.Q. Effects of different soil types on the foliar δ13C values of common local plant species in karst rocky desertification area in central Guizhou Province. Environ. Sci. 2014, 35, 3587–3594. (In Chinese) [Google Scholar]
- Liu, G.S.; Jiang, N.H.; Zhang, L.D.; Liu, Z.L. Soil Physical and Chemical Analysis and Description of Soil Profiles; China Standard Methods Press: Beijing, China, 1996; pp. 24–25. [Google Scholar]
- Midwood, A.J.; Boutton, T.W. Soil carbonate decomposition by acid has little effect on δ13C of organic matter. Soil Biol. Biochem. 1998, 30, 1301–1307. [Google Scholar] [CrossRef]
- Meng, L.; Ding, W.; Cai, Z. Long-term application of organic manure and nitrogen fertilizer on N2O emissions, soil quality and crop production in a sandy loam soil. Soil Biol. Biochem. 2005, 37, 2037–2045. [Google Scholar] [CrossRef]
- Qiu, L.P.; Wei, X.R.; Ma, T.; Wei, Y.C.; Horton, R.; Zhang, X.C.; Cheng, J.M. Effects of land-use change on soil organic carbon and nitrogen in density fractions and soil δ13C and δ15N in semiarid grasslands. Plant Soil 2015, 390, 419–430. [Google Scholar] [CrossRef]
- Jackson, R.B.; Canadell, J.; Ehleringer, J.R.; Mooney, H.A.; Sala, O.E.; Schulze, E.D. A global analysis of root distributions for terrestrial biomes. Oecologia 1996, 108, 389–411. [Google Scholar] [CrossRef]
- Jobbagy, E.G.; Jackson, R.B. The vertical distribution of soil organic carbon and its relation to climate and vegetation. Ecol. Appl. 2000, 10, 423–436. [Google Scholar] [CrossRef]
- Liu, M.; Han, G.L.; Li, Z.C.; Liu, T.Z.; Yang, X.M.; Wu, Y.T.; Song, Z.L. Effects of slope position and land use on the stability of aggregate–associated organic carbon in calcareous soils. Acta Geochim. 2017, 36, 456–461. [Google Scholar] [CrossRef]
- Schjønning, P.; Thomsen, I.K. Shallow tillage effects on soil properties for temperate-region hard-setting soils. Soil Till. Res. 2013, 132, 12–20. [Google Scholar] [CrossRef]
- Ellert, B.H.; Janzen, H.H. Long-term biogeochemical cycling in agroecosystems inferred from 13C, 14C and 15N. J. Geochem. Explor. 2016, 88, 198–201. [Google Scholar] [CrossRef]
- Nel, J.A.; Craine, J.M.; Cramer, M.D. Correspondence between δ13C and δ15N in soils suggests coordinated fractionation processes for soil C and N. Plant Soil 2018, 423, 1–15. [Google Scholar] [CrossRef]
- Wedin, D.A.; Tieszen, L.L.; Dewey, B.; Pastor, J. Carbon isotope dynamics during grass decomposition and soil organic matter formation. Ecology 1995, 76, 1383–1392. [Google Scholar] [CrossRef]
- Liu, W.G.; Wang, Z. Nitrogen isotopic composition of plant-soil in the Loess Plateau and its responding to environmental change. Chin. Sci. Bull. 2009, 54, 272–279. [Google Scholar] [CrossRef]
- Schlesinger, W.H. On the fate of anthropogenic nitrogen. Proc. Natl. Acad. Sci. USA 2009, 106, 203–208. [Google Scholar] [CrossRef]
- Eissfeller, V.; Beyer, F.; Valtanen, K.; Hertel, D.; Maraun, M.; Polle, A.; Scheu, S. Incorporation of plant carbon and microbial nitrogen into the rhizosphere food web of beech and ash. Soil Biol. Biochem. 2013, 62, 76–81. [Google Scholar] [CrossRef]
- Craine, J.M.; Elmore, A.J.; Aidar, M.P.M.; Mercedes, B.; Dawson, T.E.; Hobbie, E.A.; Ansgar, K.; Mack, M.C.; Mclauchlan, K.K.; Anders, M. Global patterns of foliar nitrogen isotopes and their relationships with climate, mycorrhizal fungi, foliar nutrient concentrations, and nitrogen availability. New Phytol. 2010, 183, 980–992. [Google Scholar] [CrossRef]
- Xiao, H.Y.; Liu, C.Q. Sources of nitrogen and sulfur in wet deposition at Guiyang, Southwest China. Atmos. Environ. 2002, 36, 5121–5130. [Google Scholar] [CrossRef]
- Yeatman, S.G.; Spokes, L.J.; Dennis, P.F.; Jickells, T.D. Comparisons of aerosol nitrogen isotopic composition at two polluted coastal sites. Atmos. Environ. 2001, 35, 1307–1320. [Google Scholar] [CrossRef]
- Wynn, J.G.; Harden, J.W.; Fries, T.L. Stable carbon isotope depth profiles and soil organic carbon dynamics in the lower Mississippi Basin. Geoderma 2006, 131, 89–109. [Google Scholar] [CrossRef]
- Zhu, S.F.; Liu, C.Q. Vertical patterns of stable carbon isotope in soils and particle-size fractions of karst areas, Southwest China. Environ. Geol. 2006, 50, 1119–1127. [Google Scholar] [CrossRef]
- Han, G.L.; Li, F.S.; Tang, Y. Variations in soil organic carbon contents and isotopic compositions under different land uses in a typical karst area in Southwest China. Geochem. J. 2015, 49, 63–71. [Google Scholar] [CrossRef]
- Van Bergen, P.F.V.; Nott, C.J.; Bull, I.D.; Poulton, P.R.; Evershed, R.P. Organic geochemical studies of soils from the Rothamsted Classical Experiments—IV. Preliminary results from a study of the effect of soil pH on organic matter decay. Org. Geochem. 1998, 29, 1779–1795. [Google Scholar] [CrossRef]
- Kim, J.H.; Torres, M.E.; Choi, J.; Bahk, J.J.; Park, M.H.; Hong, W.L. Inferences on gas transport based on molecular and isotopic signatures of gases at acoustic chimneys and background sites in the Ulleung Basin. Org. Geochem. 2012, 43, 26–38. [Google Scholar] [CrossRef]
- Bonacci, O.; Pipan, T.; Culver, D.C. A framework for karst ecohydrology. Environ. Geol. 2009, 56, 891–900. [Google Scholar] [CrossRef]
- Liu, T.Z.; Liu, C.Q.; Lang, Y.C. Dissolved organic carbon and its carbon isotope compositions in hill slope soils of the karst area of southwest China: Implications for carbon dynamics in limestone soil. Geochem. J. 2014, 48, 277–285. [Google Scholar] [CrossRef] [Green Version]
- Poffenbarger, H.J.; Sawyer, J.E.; Barker, D.W.; Olk, D.C.; Six, J.; Castellano, M.J. Legacy effects of long-term nitrogen fertilizer application on the fate of nitrogen fertilizer inputs in continuous maize. Agric. Ecosyst. Environ. 2018, 265, 544–555. [Google Scholar] [CrossRef]
- Hobbie, E.A.; Ouimette, A.P. Controls of nitrogen isotope patterns in soil profiles. Biogeochemistry 2009, 95, 355–371. [Google Scholar] [CrossRef]
- Stewart, K.J.; Grogan, P.; Coxson, D.S.; Siciliano, S.D. Topography as a key factor driving atmospheric nitrogen exchanges in arctic terrestrial ecosystems. Soil Biol. Biochem. 2014, 70, 96–112. [Google Scholar] [CrossRef]
- Tokumoto, I.; Heilman, J.L.; Schwinning, S.; Mcinnes, K.J.; Litvak, M.E.; Morgan, C.L.S.; Kamps, R.H. Small-scale variability in water storage and plant available water in shallow, rocky soils. Plant Soil 2014, 385, 193–204. [Google Scholar] [CrossRef]
- Hefting, M.; Clement, J.C.; Dowrick, D.; Cosandey, A.C.; Bernal, S.; Cimpian, C.; Tatur, A.; Burt, T.P.; Pinay, G. Water table elevation controls on soil nitrogen cycling in riparian wetlands along a European climate gradient. Biogeochemistry 2004, 67, 113–134. [Google Scholar] [CrossRef]
- Sogbedji, J.M.; Es, H.M.V.; Klausner, S.D.; Bouldin, D.R.; Cox, W.J. Spatial and temporal processes affecting nitrogen availability at the landscape scale. Soil Till. Res. 2001, 58, 233–244. [Google Scholar] [CrossRef]
- Sogbedji, J.M.; Es, H.M.V.; Yang, C.L.; Geohring, L.D.; Magdoff, F.R. Nitrate leaching and nitrogen budget as affected by maize nitrogen rate and soil type. J. Environ. Qual. 2000, 29, 1813–1820. [Google Scholar] [CrossRef]
- Templer, P.H.; Arthur, M.A.; Lovett, G.M.; Weathers, K.C. Plant and soil natural abundance δ15N: Indicators of relative rates of nitrogen cycling in temperate forest ecosystems. Oecologia 2007, 153, 399–406. [Google Scholar] [CrossRef]


| Profile | Thickness (cm) | Dominant vegetation species | δ13C of leaf (‰) | Visible characteristics |
|---|---|---|---|---|
| Agricultural land | ||||
| FL | 70 cm | Zea mays (C4) | −11.4‰ a | 0–20 cm: brawn, block structure, tight, abundant plant roots and debris |
| Arachis hypogaea (C3) | 20–70 cm: yellow, block structure, tight, no rootlet | |||
| AFL | 70 cm | Artemisia carvifolia (C3) | −28.4‰ c | 0–6 cm: brawn, block structure, tight, abundant plant roots and debris |
| 6–70 cm: yellow, block structure, tight, no rootlet | ||||
| Non-agricultural land | ||||
| SGL1 | 90 cm | Miscanthus floridulus (C4) | −12.3‰ b | 0–22 cm: brawn, fine grained, loose, abundant plant roots |
| Rubus biflorus (C3) | −28.7‰ c | 24–42 cm, Brawn, block structure, tight, few plant roots | ||
| 42–90 cm: yellow, block structure, tight, no rootlet, merges to weathered crust below | ||||
| SGL2 | 90 cm | Miscanthus floridulus (C4) | −12.3‰ b | 0–10 cm: black humus layer, fine grained, loose, abundant plant roots |
| Pyracantha fortuneana (C3) | −28.5‰ c | 10–35 cm: black brawn, block structure, tight, medium amount of plant roots | ||
| 35–90 cm: red brawn, block structure, tight, no rootlet | ||||
| SL1 | 90 cm | Rubus biflorus (C3) | −28.7‰ c | 0–15 cm: black humus layer, granular structure, loose, abundant plant roots and debris |
| 15–40 cm: red, block structure, tight, few plant roots | ||||
| 40–90 cm: brawn, clayey, tight, no rootlet | ||||
| SL2 | 70 cm | Rhamnus davurica (C3) | −28.4‰ c | 0–10 cm: black humus layer, fine grained, loose, abundant plant roots |
| Rubus biflorus (C3) | −28.7‰ c | 10–50 cm: brawn, block structure, tight, medium amount of plant roots | ||
| 50–70 cm: red, clayey, tight, no rootlet | ||||
| Sampling site | Depth (cm) | Clay (%) | Silt (%) | Sand (%) | pH |
|---|---|---|---|---|---|
| FL | 0–10 | 20.9 | 73.8 | 5.3 | 7.5 |
| 10–20 | 20.6 | 73.6 | 5.8 | 7.4 | |
| 20–30 | 20.0 | 71.4 | 8.6 | 7.5 | |
| 30–50 | 19.2 | 73.1 | 7.8 | 7.3 | |
| 50–70 | 18.7 | 75.2 | 6.1 | 7.3 | |
| AFL | 0–10 | 23.0 | 71.8 | 5.2 | 7.2 |
| 10–20 | 24.6 | 70.4 | 5.0 | 7.4 | |
| 20–30 | 21.4 | 74.9 | 3.8 | 7.5 | |
| 30–50 | 21.1 | 73.9 | 5.0 | 7.4 | |
| 50–70 | 23.2 | 71.7 | 5.1 | 7.4 | |
| SGL1 | 0–10 | 21.9 | 74.2 | 3.9 | 6.8 |
| 10–20 | 21.4 | 74.7 | 3.9 | 6.7 | |
| 20–30 | 20.2 | 76.7 | 3.1 | 6.7 | |
| 30–50 | 21.9 | 74.3 | 3.8 | 6.4 | |
| 50–70 | 20.6 | 75.3 | 3.8 | 6.4 | |
| 70–90 | 19.3 | 77.0 | 3.8 | 6.4 | |
| SGL2 | 0–10 | 19.8 | 76.9 | 3.3 | 7.7 |
| 10–20 | 19.1 | 77.2 | 3.7 | 7.5 | |
| 20–30 | 19.4 | 77.4 | 3.1 | 7.7 | |
| 30–50 | 17.7 | 79.5 | 2.9 | 7.5 | |
| 50–70 | 20.2 | 78.3 | 1.5 | 7.4 | |
| 70–90 | 22.5 | 76.3 | 1.3 | 7.4 | |
| SL1 | 0–10 | 18.0 | 77.3 | 4.7 | 6.7 |
| 10–20 | 19.7 | 76.9 | 3.4 | 6.8 | |
| 20–30 | 20.9 | 77.6 | 1.5 | 6.8 | |
| 30–50 | 20.3 | 78.2 | 1.5 | 6.8 | |
| 50–70 | 23.1 | 74.6 | 2.3 | 7.2 | |
| 70–90 | 23.6 | 74.4 | 2.0 | 7.5 | |
| SL2 | 0–10 | 18.0 | 77.3 | 4.7 | 7.0 |
| 10–20 | 17.6 | 77.7 | 4.7 | 7.2 | |
| 20–30 | 16.5 | 79.1 | 4.4 | 7.3 | |
| 30–50 | 16.2 | 79.3 | 4.5 | 7.3 | |
| 50–70 | 16.6 | 78.6 | 4.8 | 7.4 | |
| Maximum | 24.6 | 79.5 | 8.6 | 7.7 | |
| Minimum | 16.2 | 70.4 | 1.3 | 6.4 | |
| Mean | 20.2 | 75.7 | 4.1 | 7.2 |
© 2019 by the authors. Licensee MDPI, Basel, Switzerland. This article is an open access article distributed under the terms and conditions of the Creative Commons Attribution (CC BY) license (http://creativecommons.org/licenses/by/4.0/).
Share and Cite
Liu, M.; Han, G.; Zhang, Q.; Song, Z. Variations and Indications of δ13CSOC and δ15NSON in Soil Profiles in Karst Critical Zone Observatory (CZO), Southwest China. Sustainability 2019, 11, 2144. https://0-doi-org.brum.beds.ac.uk/10.3390/su11072144
Liu M, Han G, Zhang Q, Song Z. Variations and Indications of δ13CSOC and δ15NSON in Soil Profiles in Karst Critical Zone Observatory (CZO), Southwest China. Sustainability. 2019; 11(7):2144. https://0-doi-org.brum.beds.ac.uk/10.3390/su11072144
Chicago/Turabian StyleLiu, Man, Guilin Han, Qian Zhang, and Zhaoliang Song. 2019. "Variations and Indications of δ13CSOC and δ15NSON in Soil Profiles in Karst Critical Zone Observatory (CZO), Southwest China" Sustainability 11, no. 7: 2144. https://0-doi-org.brum.beds.ac.uk/10.3390/su11072144