Thermal Comfort and Longwave Radiation over Time in Urban Residential Complexes


1
Interdisciplinary Program in Landscape Architecture, Seoul National University, Seoul 08826, Korea
2
Department of Landscape Architecture and Rural System Engineering, Seoul National University, Seoul 08826, Korea
*
Author to whom correspondence should be addressed.
Sustainability 2019, 11(8), 2251; https://0-doi-org.brum.beds.ac.uk/10.3390/su11082251
Submission received: 25 February 2019
/
Revised: 20 March 2019
/
Accepted: 23 March 2019
/
Published: 15 April 2019
Abstract
:Large cities with a high concentration of high-rise buildings are shaded by urban canyon. This brings a cooling effect compared to the space exposed to the sun, but is not always cool due to the longwave radiation emitted from buildings and the built environment. We tested the micro-scale effects of major external spatial factors, trees, and buildings, under shade on longwave radiation shifts to understand the effects of large shaded areas in megacities. Incoming and outgoing longwave radiations (ILR and OLR, respectively) were found to decrease the overall observation by time zone. Longwave radiation on a micro-scale was also inversely proportional to the tree volume. From mean radiant temperature (MRT) analysis, we found that about a 10% decrease in MRT could be achieved by increasing tree volume by around 50%. Larger tree volumes corresponded to greater blocking effects on longwave radiation. Considering the tree volume, a multilayer urban tree canopy composition can more favorably improve the thermal environment and energy sustainability of a city compared to a single-layer canopy. Larger trees planted with harmonious shrubs are the most effective in reducing longwave radiation.
1. Introduction
As high-density areas increase with urbanization, urban canyons are formed with high-rise buildings casting shade [1]. The urban heat island effect (UHIE) is intensifying with climate change. Despite the need to mitigate the UHIE to ensure sustainability, large cities tend to emphasize economic efficiency in constructing new buildings [2]. Therefore, high-rise high-density residential complexes are continuously constructed in metropolitan cities where land is scarce [3]. This intensifies the UHIE, even though children and elderly people who are vulnerable to heat remain active in the daytime [4].
Dense residential complexes cause significant shadows in metropolitan areas. These many shaded areas decrease the solar radiation reaching the surface or space. This mitigates the UHIE [5,6]. Therefore, shadows that block heat are important in high-population-density urban residential areas with high-rise buildings.
Longwave radiation, which is dominant in shaded areas with highly concentrated high-rise buildings, is a long-wavelength emission from a medium that receives shortwave radiation (solar radiation) [7], thus yielding infrared radiation that causes people to feel heat [8]. It also includes the heat energy emitted by all built environment objects, such as buildings and trees [9], even those in shaded areas without incident solar radiation [10]. Radiation is influenced by not only surrounding parametric objects, trees, and buildings, but also by architectural characteristics such as sizes, allocations, shapes, and materials [11,12,13]. In such high-rise urban spaces, during the summer, both hot and cool spaces are present, even in shade, due to influencing factors on urban micro-scale climate. In this study, we focused on determining the effect of tree and building deployment on the mean radiant temperature (MRT), based on shifts in longwave radiation time in urban apartment areas. In the Standard report from ANSI (American National Standards Institute) and ASHRAE (American Society Of Heating, Refrigerating And A-C Engineers) in 2004, thermal comfort is defined as “a condition of mind that expresses satisfaction with the thermal environment” [14]. Thus, feeling hot and cold is related to thermal comfort and various indices that indicate the spatial sensible comfort are as follows: Predicted Mean Vote (PMV) [15], Physiological Equivalent Temperature (PET) [16,17], Standard Effective Temperature (SET) [18], Outdoor Standard Effective Temperature (OUT_SET) [19], Universal Thermal Climate Index (UTCI) [20,21,22], and LMRT (Longwave mean radiant temperature) [10]. There are various methods that can be employed to estimate thermal comfort, but the MRT index is known as the most accurate way to consider exterior thermal comfort [23].
Longwave radiation is divided into outgoing longwave radiation (OLR) from the Earth and incoming longwave radiation (ILR) from the atmosphere. The longwave radiation left in a given space by this two-directional radiation is called the net longwave radiation. As the net longwave radiation in the space increases, the infrared rays in the space increase, which affects the sensible heat [24]. The net radiation ultimately remaining in the atmosphere in the energy budget (or radiation budget), corresponding to the energy balance, is the sum of the net shortwave and longwave radiation.
Many buildings in urban canyons create large shaded areas. In these areas, solar radiation is interrupted and longwave radiation is dominant. Because longwave radiation related to mean radiation temperature (MRT) [10] is involved in sensible heat, this dominance reduces the thermal comfort of those using the space. Therefore, under the shadows of urban canyons, it is necessary to examine the spatial factors affecting longwave radiation.
Research on longwave radiation has been widely performed on a broad range of space scales. However, few have investigated changes in longwave radiation, which reflects the albedo of the polar regions of the earth [25]. In the temperate regions where most people live, the UHIE in densely populated metropolitan centers is becoming increasingly severe, but longwave studies at the metropolitan scale are lacking. Some studies have shown that cooling effects are generated by blocking shortwave radiation, achieved by enlarging the shaded areas of buildings in large cities with many urban canyons. Nevertheless, no research has shown that the cooling effect of shadows always guarantees thermal comfort in outdoor spaces during summer [26]. Therefore, because the effects of shadows cannot be completely guaranteed, the factors affecting thermal comfort under the influence of longwave radiation, which exists even where shortwave radiation is blocked, must be determined.
Studies on thermal comfort in cities include active research both inside and outside of buildings, including urban green spaces [27]. The relationship between the temperature of external spaces [28] and the energy emitted from buildings has been investigated [29], and sustainability research for energy reduction in construction is popular. As a part of this, there is a study of the correlation between urban infrastructure and surface temperature [30]. In order to achieve sustainability, there is also a mitigation technique based on research on technologies to mitigate temperature through albedo [31]. However, research on improving the thermal environment to achieve sustainability is lacking. Recently, numerical simulations have been performed via coupling convection, radiation, and conduction [32]. The net radiation, as defined above, is an essential force of climate in the lower layers of the Earth’s atmosphere. Diversified variations in the radiation balance have widespread implications for human living conditions, as changes in land cover tend to increase surfaces with higher net radiation levels [33]. Studies on longwave radiation affecting heat discharge in urban canyons [34], which can intercept shortwave radiation, are particularly insufficient. The spatial characteristics of urban canyons contribute to increases in artificial heat, thereby decreasing the thermal comfort of the external space and increasing the consumption of energy for internal comfort.
In this context, longwave radiation is the energy released from the ground and the heat energy conducted and radiated from the inner surface of buildings to the external surface [35] (magnitude of heat-transmission, such as thermal conduction, convection, and radiation, of building walls is affected by the building interior or surface materials). Longwave radiation is affected by the surface temperatures of objects induced by shortwave radiation. It also includes the heat from the surface of a shortwave radiation-emitting object [36]. Thus, as the number of objects and built environment components with surface temperatures is increased, the longwave radiation increases. However, structural components, such as the built environment, that block shortwave radiation but emit longwave radiation [37], will increase the net longwave radiation by anthropogenic heat. On the other hand, the natural environment, such as trees and grass, will take part in reducing longwave radiation compared to the radiation from the built environment [38]. This is related to energy sustainability because mitigation can enhance thermal comfort based on the spatial heat balance [39].
Passive cooling is a sustainable way to improve the thermal comfort of an indoor space. However, studies have investigated the sustainable and environmentally friendly use of trees to understand whether the passive cooling method can also ameliorate thermal conditions in outdoor spaces [40,41]. Most studies on thermal comfort in internal and external spaces have focused on temperature changes, heat mitigation using 3D simulations [42,43], observations on thermal comfort through questionnaires [44], and studies using physical or experimental models [45,46]. Recently, there have been studies on land cover and urban regeneration activities as a heat island reduction strategy for thermal comfort [47]. However, radiation-focused studies on improving the thermal environment have emphasized simple physics solutions derived from celestial science, such as the single-layer model [48,49]. Studies on improving the external thermal environment have mainly focused on trees [50,51] because of their efficiency, natural occurrence, and availability in outdoor spaces, which are advantageous for sustainable utilization in the limited spaces of urban canyons [52].
Trees block radiation in summer and increase the latent heat flux to improve the thermal environment [53,54]. An improved thermal environment enhances the sustainability of an urban space by mitigating UHIE [55,56]. However, a method for decreasing the longwave radiation emitted from the surrounding environment is required to improve the thermal environment of a city where shortwave radiation is already blocked by high-rise residential buildings.
Ultimately, longwave radiation in urban canyons should be re-examined for the practical comfort improvement of those who use such spaces. Furthermore, experimental research is necessary to clarify the relationship among urban canyon components of buildings, trees, and longwave radiation.
2. Method
This research starts by determining whether a shaded space provides more “thermal comfort” than a space exposed to sunlight. This study also determines the degree of longwave radiation reduction induced by urban canyon structures. Therefore, it is an experimental study to determine how longwave radiation should be manipulated as a sustainable way to enhance thermal comfort.
According to the previous section, shade does not guarantee a cooling effect all the time. We therefore consider a cooling effect under conditions in which shortwave radiation is blocked: only longwave radiation exists in urban canyons. Thus, considering building energy efficiency as a sustainable way to increase thermal comfort [57], this study examines the relationship between shade-creating architectural components and trees and longwave radiation for thermal comfort. In-situ measurements were collected as follows:
- Building volume and longwave radiation time shift data
- Time shifts with variations in tree volume
- Mixed-deployment observation of overall effects of buildings and trees
- Longwave radiation data of open space
- MRT comparisons
The observations were performed to obtain longwave radiation data under different environmental compositions of trees or building existence, tree volume, and sky view factor (SVF). Additionally, we collected air temperature, wind speed, humidity, and shortwave radiation for our survey premise.
2.1. Survey Process
2.1.1. Pilot Test
The pilot observation was conducted on 29 June 2017, a clear day, to inspect the measurement site and check the equipment. The place of measurement included many shadows and an area where trees and buildings were installed in a mixed manner.
2.1.2. Survey Design
- According to the presence or absence of trees under persistent shadow, we designed the longwave radiation measurement through Step 1.
- Location attributes of the observation scenario: observation of spatial conditions under steady shade.
- Premise: Observation sites should have the same amount of albedo, wind speed, and humidity. Air temperature should be above 30 °C at 14:00.
- Reason: The albedo and SVF are often used as independent variables when measuring radiation or heat flux. This is because the albedo represents the surface reflectance and the amount of radiation transfer can be determined by the reflectance. Furthermore, the amount of incident radiation on the space could be controlled through manipulating the SVF. Then, when both the albedo and SVF were controlled, we could determine the effects of other parameters on the radiation. Because the control of these two variables is difficult, measurement data were obtained by observing places under similar spatial conditions of the shadows of buildings.
2.1.3. Observation Site Selection
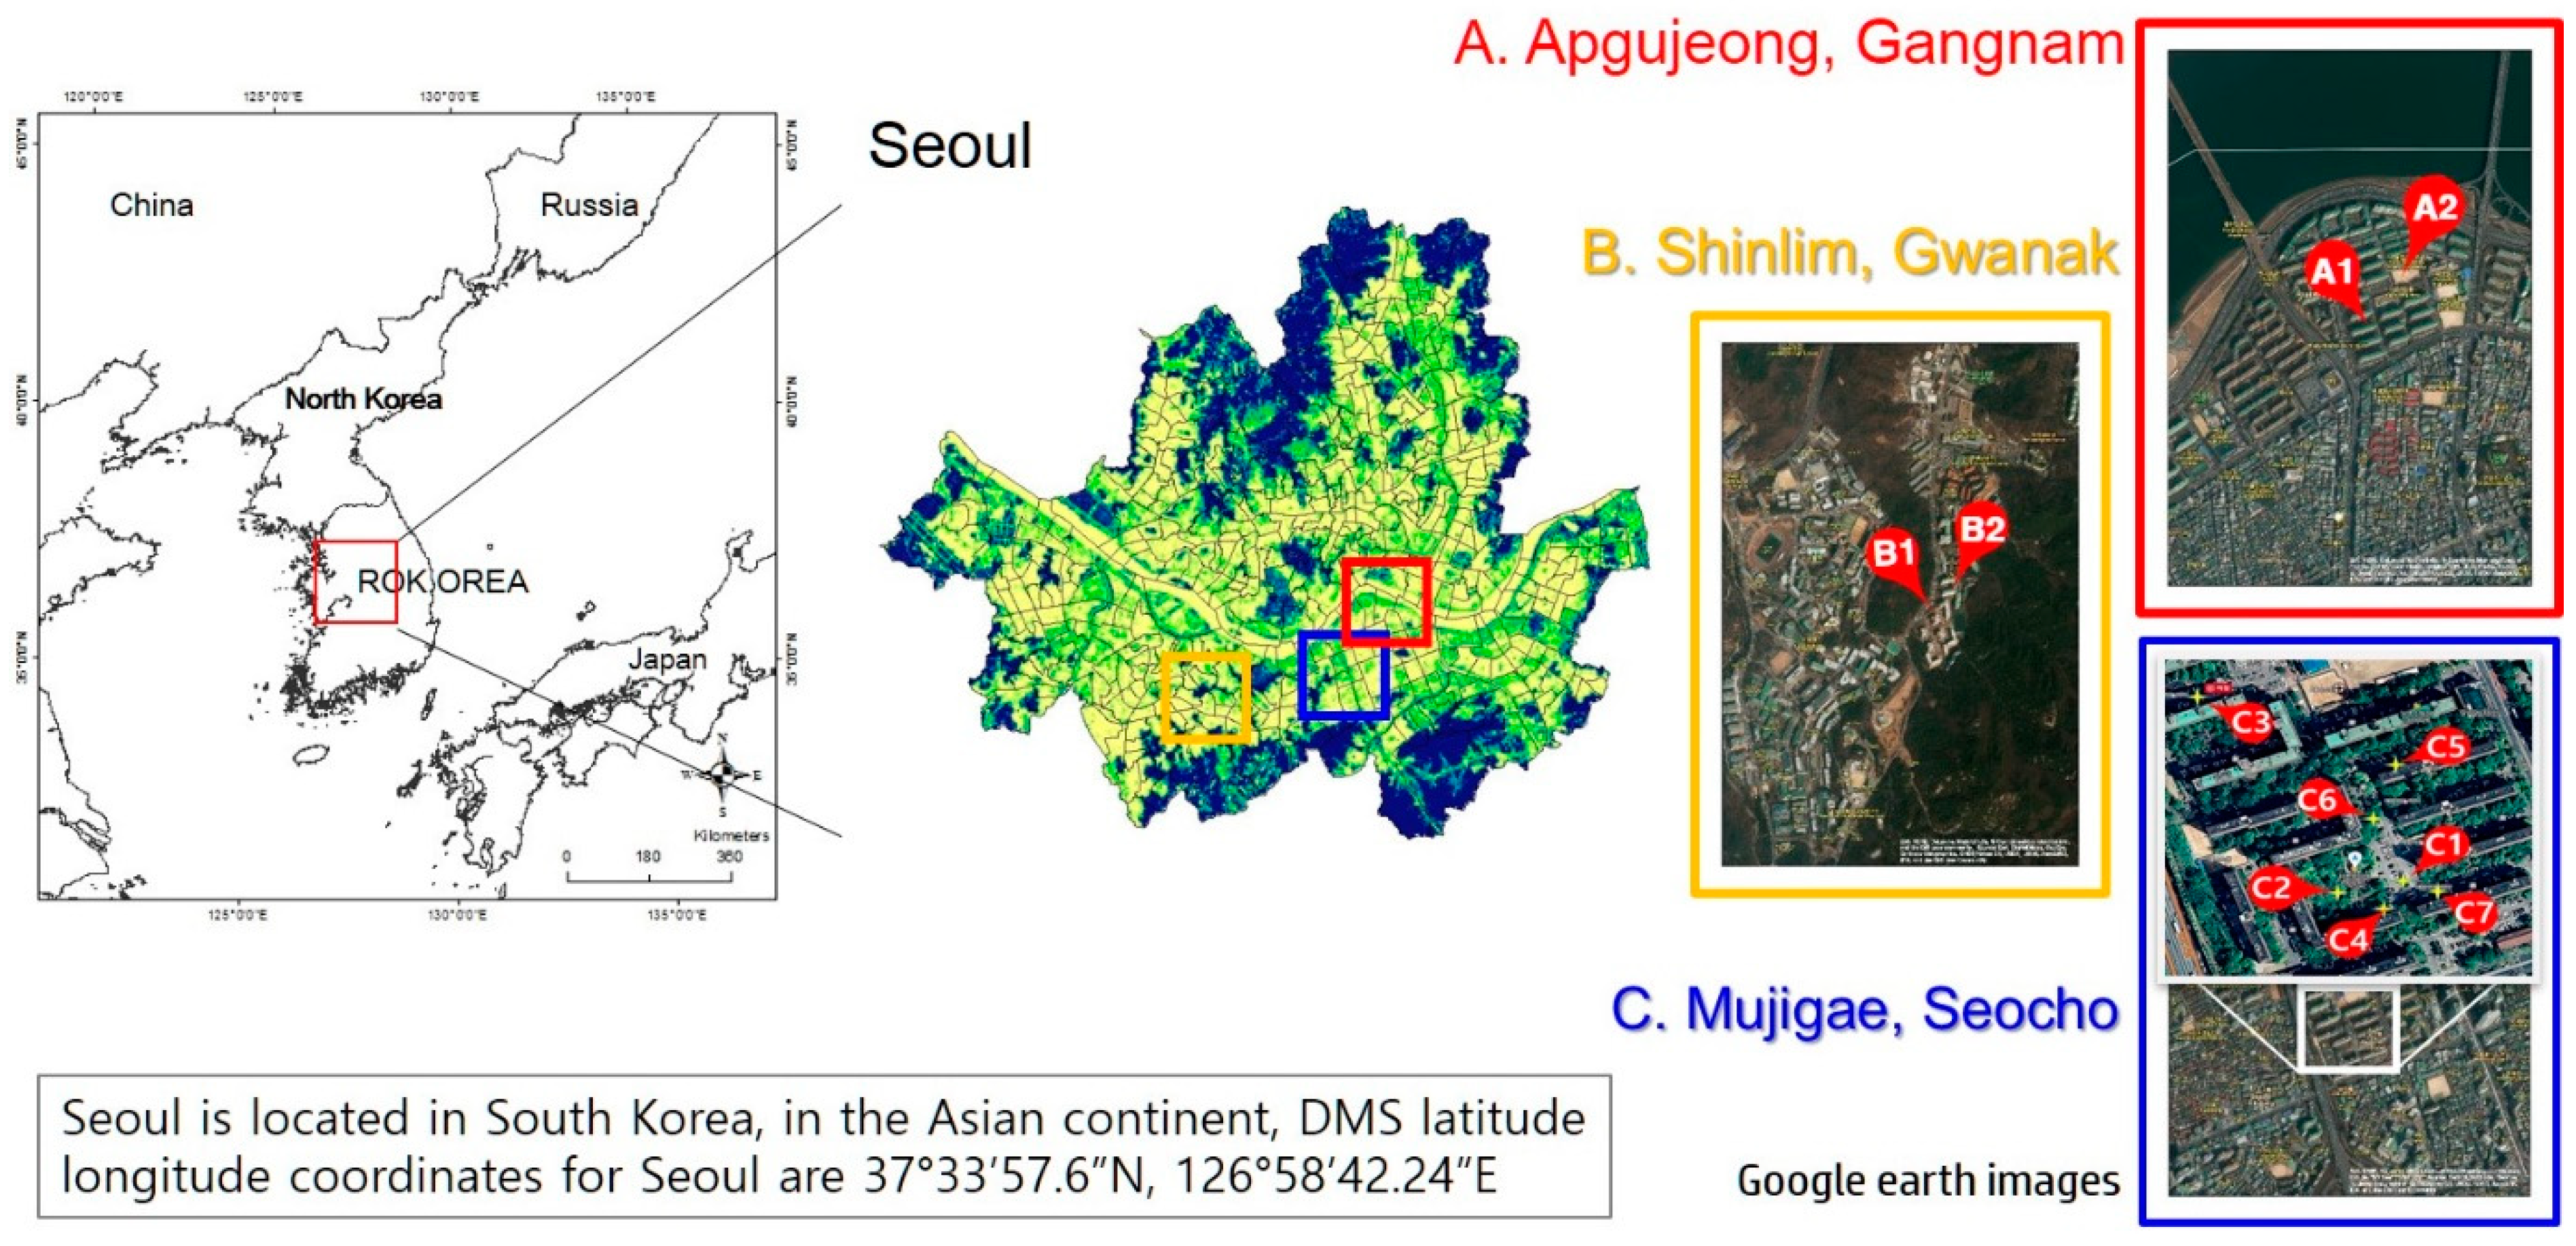
This study is mainly focused on knowing trees’ effect on longwave radiation and MRT on an urban micro-scale under the building shade. Thus, we searched study areas which had continuous shade and trees. Moreover, we sought for the place which was occupied by the most daily heat-vulnerable pedestrians and where thermal comfort solutions are required. Therefore, twelve-story residential buildings built in the 1970–80s in Seoul were selected as the sites for measuring longwave radiation. Most of apartment buildings from the 70–80s in Seoul are plate-type architectures that have a 75–100 m length facing southeast. Among residential complexes in Seoul, the three study sites we chose have a plane topography and received permission from residents’ committees for measurements. Moreover, all three sites have the common attributes of high populations, hot thermal-topic areas in Seoul, and close proximity to each other.
2.1.4. Measurement and Data Collection
Date: The pilot observation was conducted on 29 June, while the main observation was conducted on 22nd August and 2nd and 3rd September. The dates were selected considering the locations’ availability for measurement and good weather conditions since it is rainy season during summer in Seoul.
- Data collection
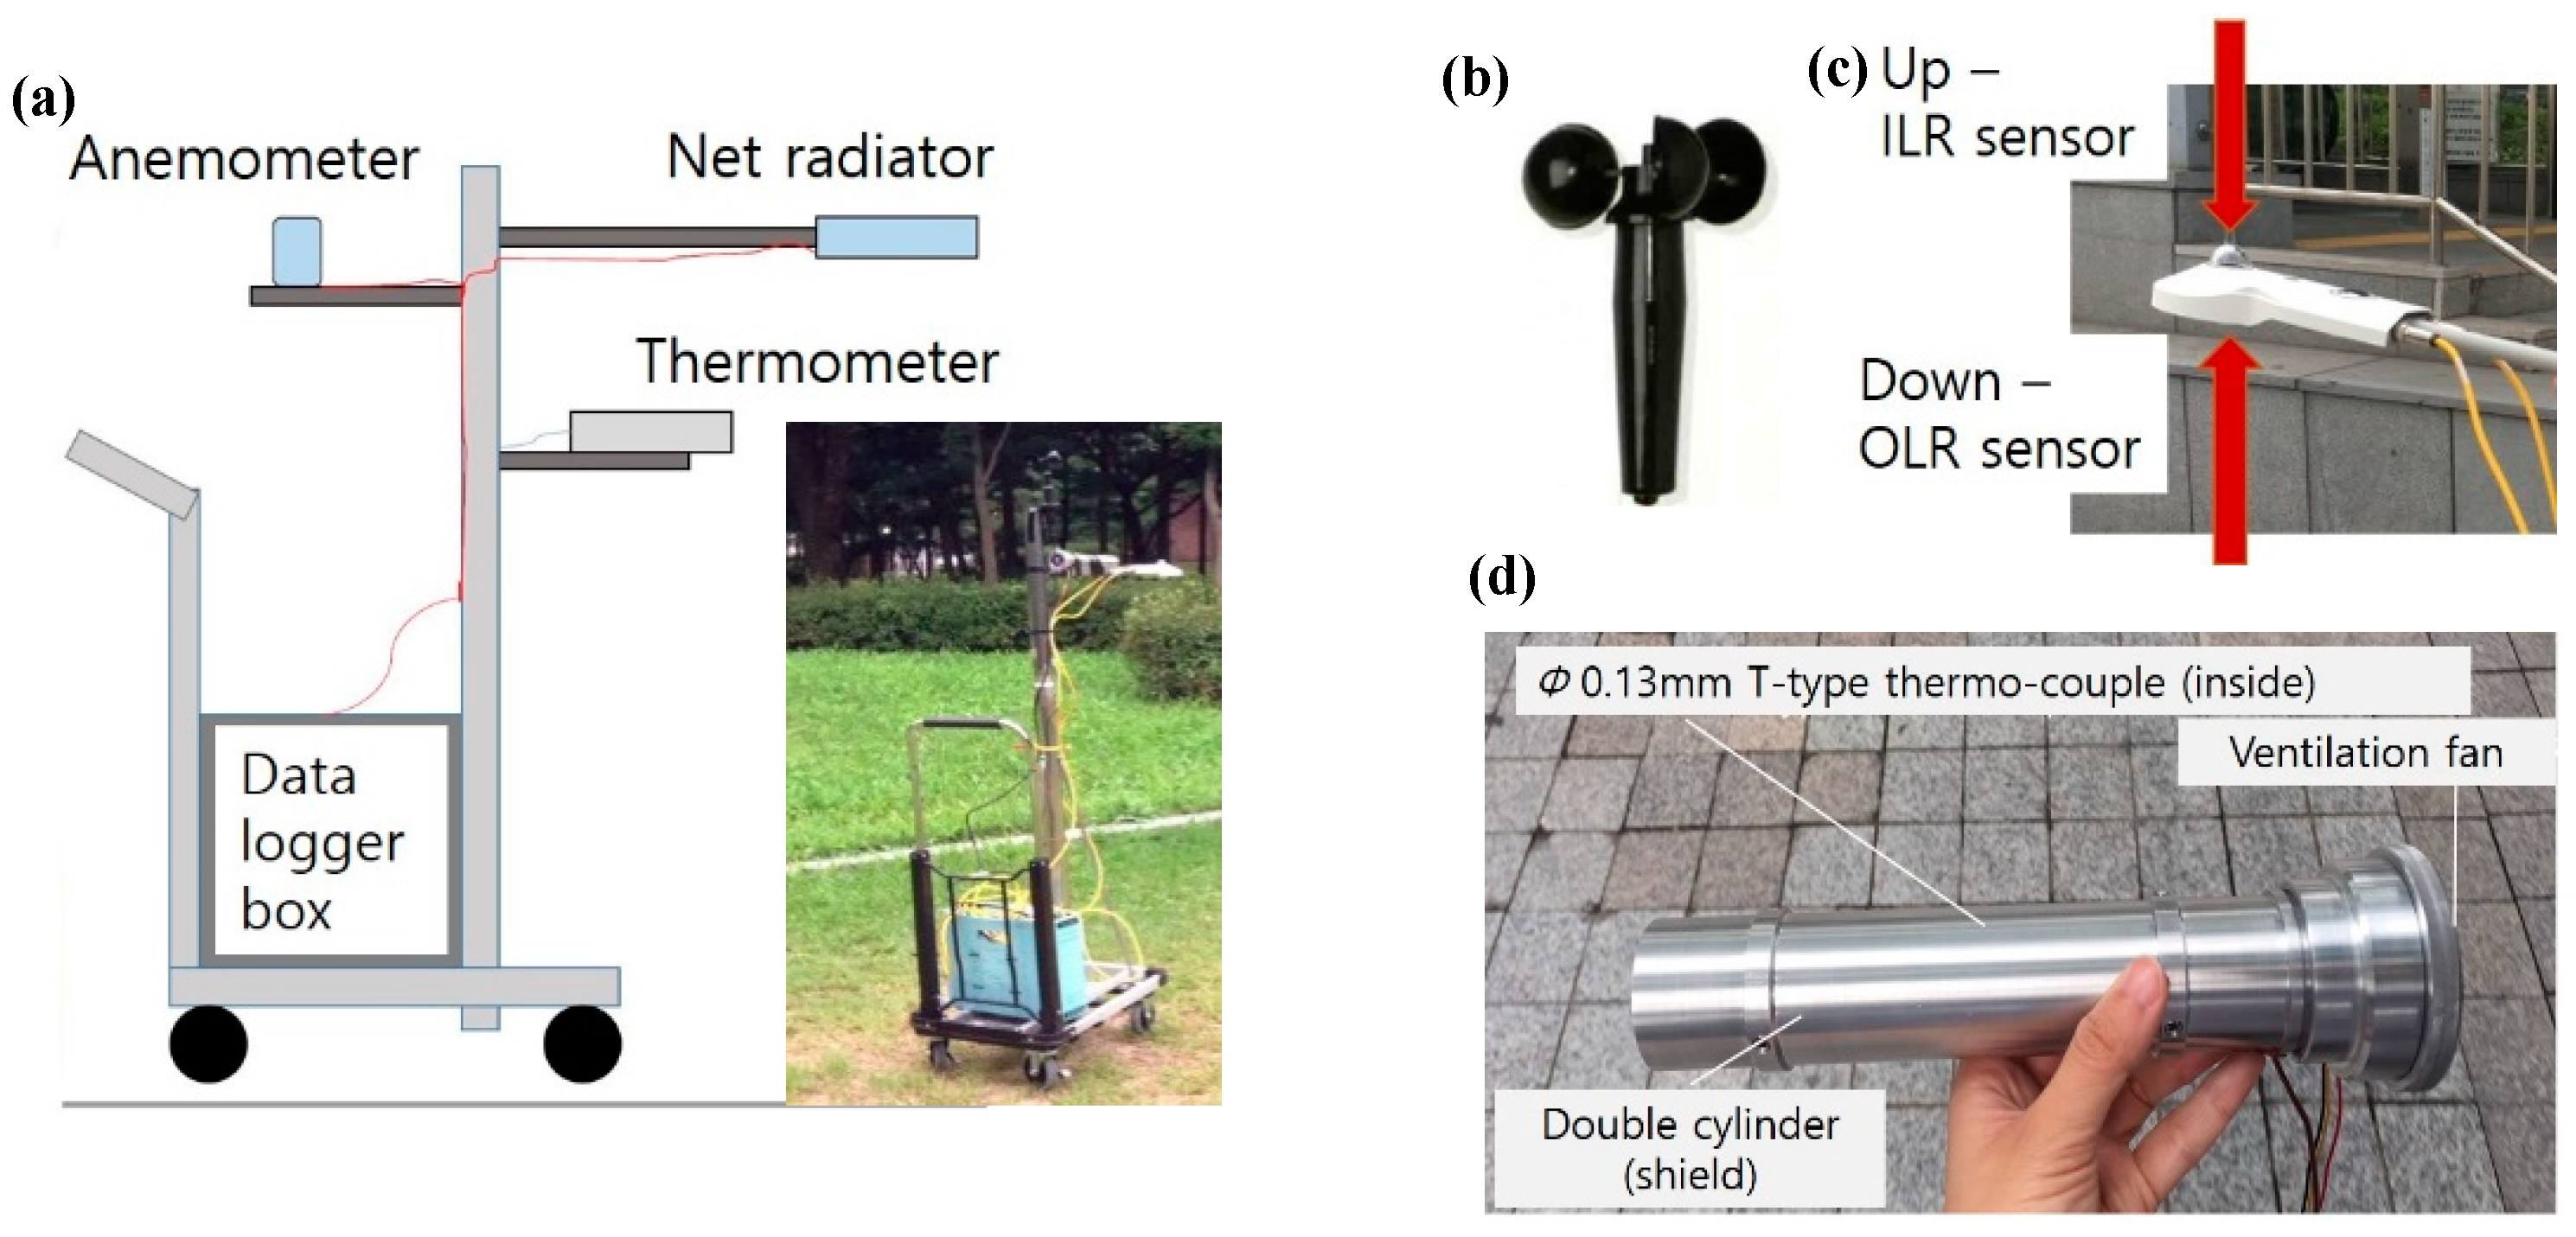
- Longwave radiation: A CNR4 (Campbell Scientific, Inc., Logan, UT, USA; Figure 1) upper sensor was used to collect ILR, while a lower sensor was used to collect OLR, and the data was collated in a logger (CR1000).
- A thermometer, anemometer, and loggers (CR1000) were used to measure and collect the air temperature and wind data (Figure 1).
- A camera with a fish-eye lens was used to determine the SVF (Appendix A).
- Weather conditions: mean wind speed was 0 m/s, temperature was 31–33 °C, and humidity was 55% (measured 7–10 m from the 12-story building).
- Time period was from 12:00 to 21:00 with a collection interval of one second.
- The sunset and sunrise times in Seoul during the summer are 6:00 AM and 7:00 PM, respectively.
- Instrument position: All instruments were located north of each building and each instrument was elevated 1.2 m from the ground.
2.2. Context of the Study Sites
For the three sites mentioned earlier, heat radiation measurements were performed for SVF, air temperature, wind speed, and humidity on sunny summer days.
Two typical apartment complex forms in Seoul are towers and plates (see Appendix A). Most apartment structures are exposed to the south–north side and the distances between the buildings and instrument deployment locations are 3–36 m. The SVF of the complex for in-situ observation is 0.22–0.90, and the building heights are 18–42 m. Two open spaces exist; one offers a plain view and the other is surrounded and enclosed by trees. To estimate the tree volume, we used the tree-volume equations from Park’s research in 2017 [58].
According to two research questions at the beginning of the study, this study was designed with two survey sections: (1) site A and B: Focusing on acquiring radiation data under tree or building shade by architectural type, and (2) site C: Focusing on obtaining data considering tree volume variation The residential apartment of site A is plate-type and the architecture of site B is tower-type (see Appendix A, Figure 2). Site C has plate-type buildings (Appendix A). In order to collect radiation data from the various volumes and layers of planting, we deployed two mobile net radiometer instrument kits at seven measuring stations (C1-C7; Figure 2, Table 1).
2.3. Research Limitations
The measurements showed that the presence of trees had different effects on the longwave radiation and MRT loads in the space around high-rise buildings [59]. However, the study was limited by the restricted number of observation locations in Seoul. The present study was intended to extend beyond existing research by developing suggestions for spatial design and planning to achieve outdoor thermal comfort, especially around residential complexes. This study examined the reductions of net longwave radiation and MRT near residential building complexes using trees and building compositions according to the layouts of old (sites A and C) and new (site B) apartment complexes considering longwave radiation in the megacity of Seoul. The research was only conducted in the summer and focused on days with full sun exposure between 14:00 and 18:00, when human activity and cooling loads were at their peaks.
3. Research Findings and Analysis: Causal Analysis of Longwave Radiation Time Shift
3.1. Comparison of Tree and Building Effects
The comparison evaluates the elements that are more likely to affect longwave radiation around a single residential complex with the same microclimatic conditions. Therefore, we examined the changes of longwave radiation by classifying the measurement sites into four types present at apartment residential complexes commonly seen in Seoul, Korea. The four types are as follows: (C1) open spaces without trees, (C2) open spaces surrounded by trees, (C3) spaces around buildings, and (C5) spaces with both buildings and trees (Appendix A).
Absolute Deviation
: Open space longwave radiation, : Longwave radiation by spatial type (open, open with trees, with buildings, with buildings and trees), ADEVILR: Absolute deviation of ILR, and ADEVOLR: Absolute deviation of OLR.
The influence was analysed by the changes of ILR and OLR [60], which are shown in Table 2. The longwave radiation value of the open space without space elements (C1) is used as the reference (average), and the absolute deviation of longwave radiation value of each type is calculated. The type that shows the largest deviation value has the greatest influence on longwave radiation.
Among the three types other than the standard open space, the largest reduction in ILR is observed in C3. The OLR is the most prevalent in the spot (C3) with only buildings. The major changes in the amount of longwave radiation occur in the order of buildings (C3), buildings and trees (C4), and trees (C2).
3.2. Comparison of Building Shade Effect
This section compares two different sites where observation was performed with and without tree coverage. The measurements for the tree effect comparison were performed at the four spots A1, A2, B1, and B2 in two different places (sites A and B) with two types of shade: under a building (A2, B2) and under a building with trees (A1, B1). We have numerically examined the reduction in longwave radiation in the presence of an object blocking it. We also observed how trees blocked longwave radiation over time.
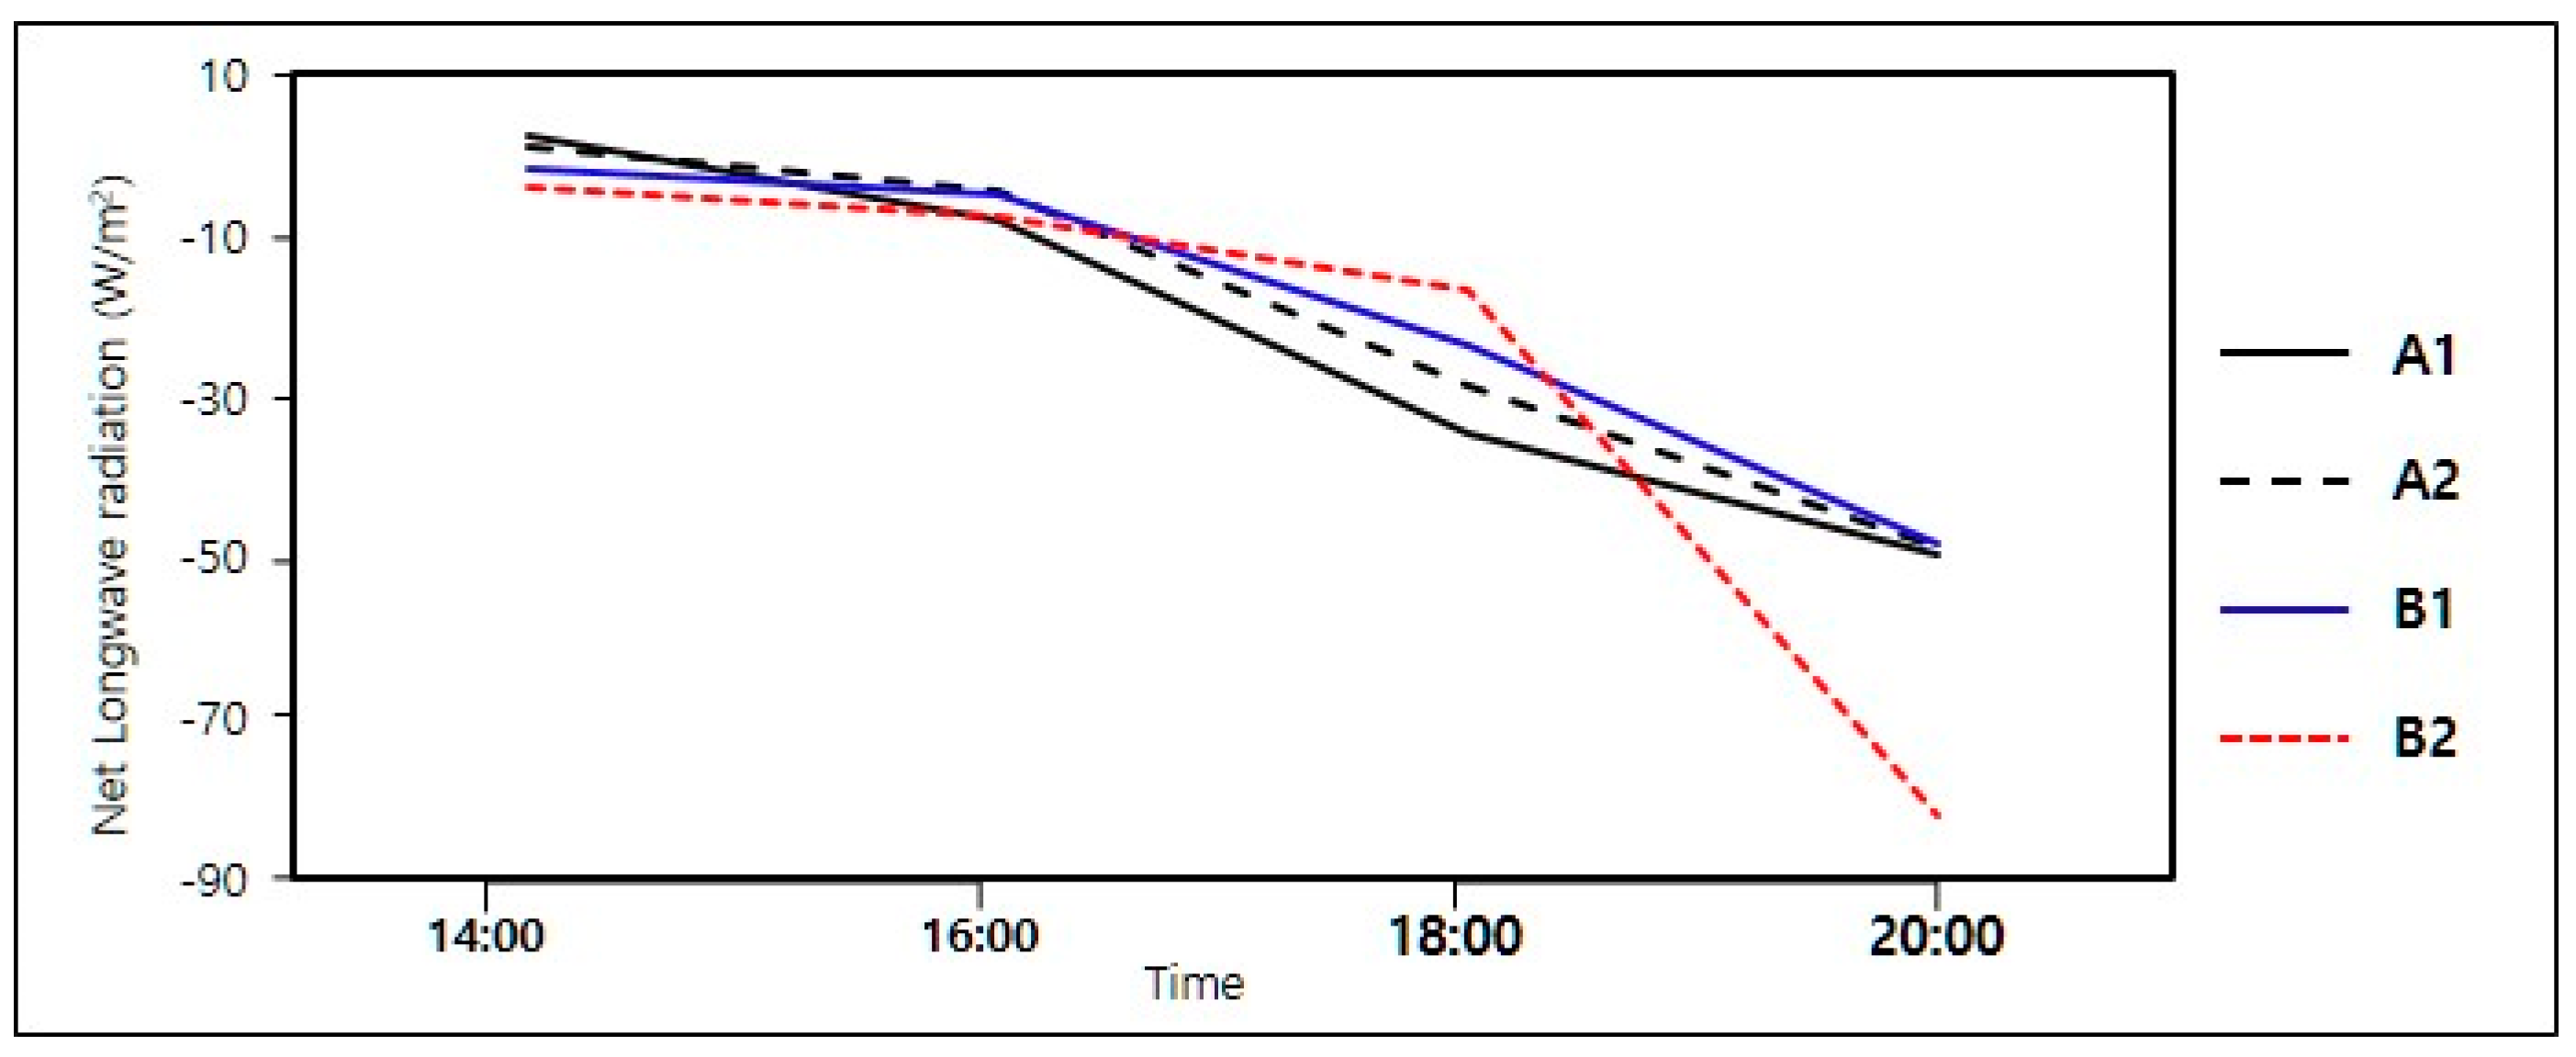
First, the overall longwave radiation at A2 is less than that at A1 and that at B2 is comparatively less than that at B1 (Figure 3). On average, the difference in ILR between A1 and A2 is 19.6, and that between B1 and B2 is 11.1 (Table 3). The OLR is lower for A2 with trees than for A1, but OLR is higher at B2 (Table 3).
In all time periods, the OLR of A2 is lower than that of A1, whereas in the B site in Figure 2, that at B2 was higher than that at B1 at all times except 20:00 (Table 3). The high OLR indicates significant longwave radiation from underground, and thus less heat under the tree in the measurement area of the bulky building in residential area A in Figure 2, while more long-term radiation is emitted in residential area B under the tree. The net longwave radiation is lower in the two residential areas with trees, A2 and B2, than in those without trees, A1 and B1 (Figure 3).
Depending on the presence or absence of trees, the ILR changes over time vary in absolute numbers. Trees block longwave radiation from the buildings. However, the OLR is affected by not only trees, but also by soils and building volumes [61].
3.3. Time Shift by Tree Volume and Composition
The four measurement sites C4, C5, C6, and C7 were all measured under the shadows of the apartment buildings at site C (Figure 2). Therefore, we investigated the quantitative reduction of longwave radiation derived from the measurement sites according to the volumes of the four types of trees at these sites by comparing the longwave radiation deviations from that of the building space (C3), which is a building-only measurement site (Table 4). The shrub on C4, C6, and C7 measured spot has a one (0.3)-m height and one (0.3)-m width (Appendix A).
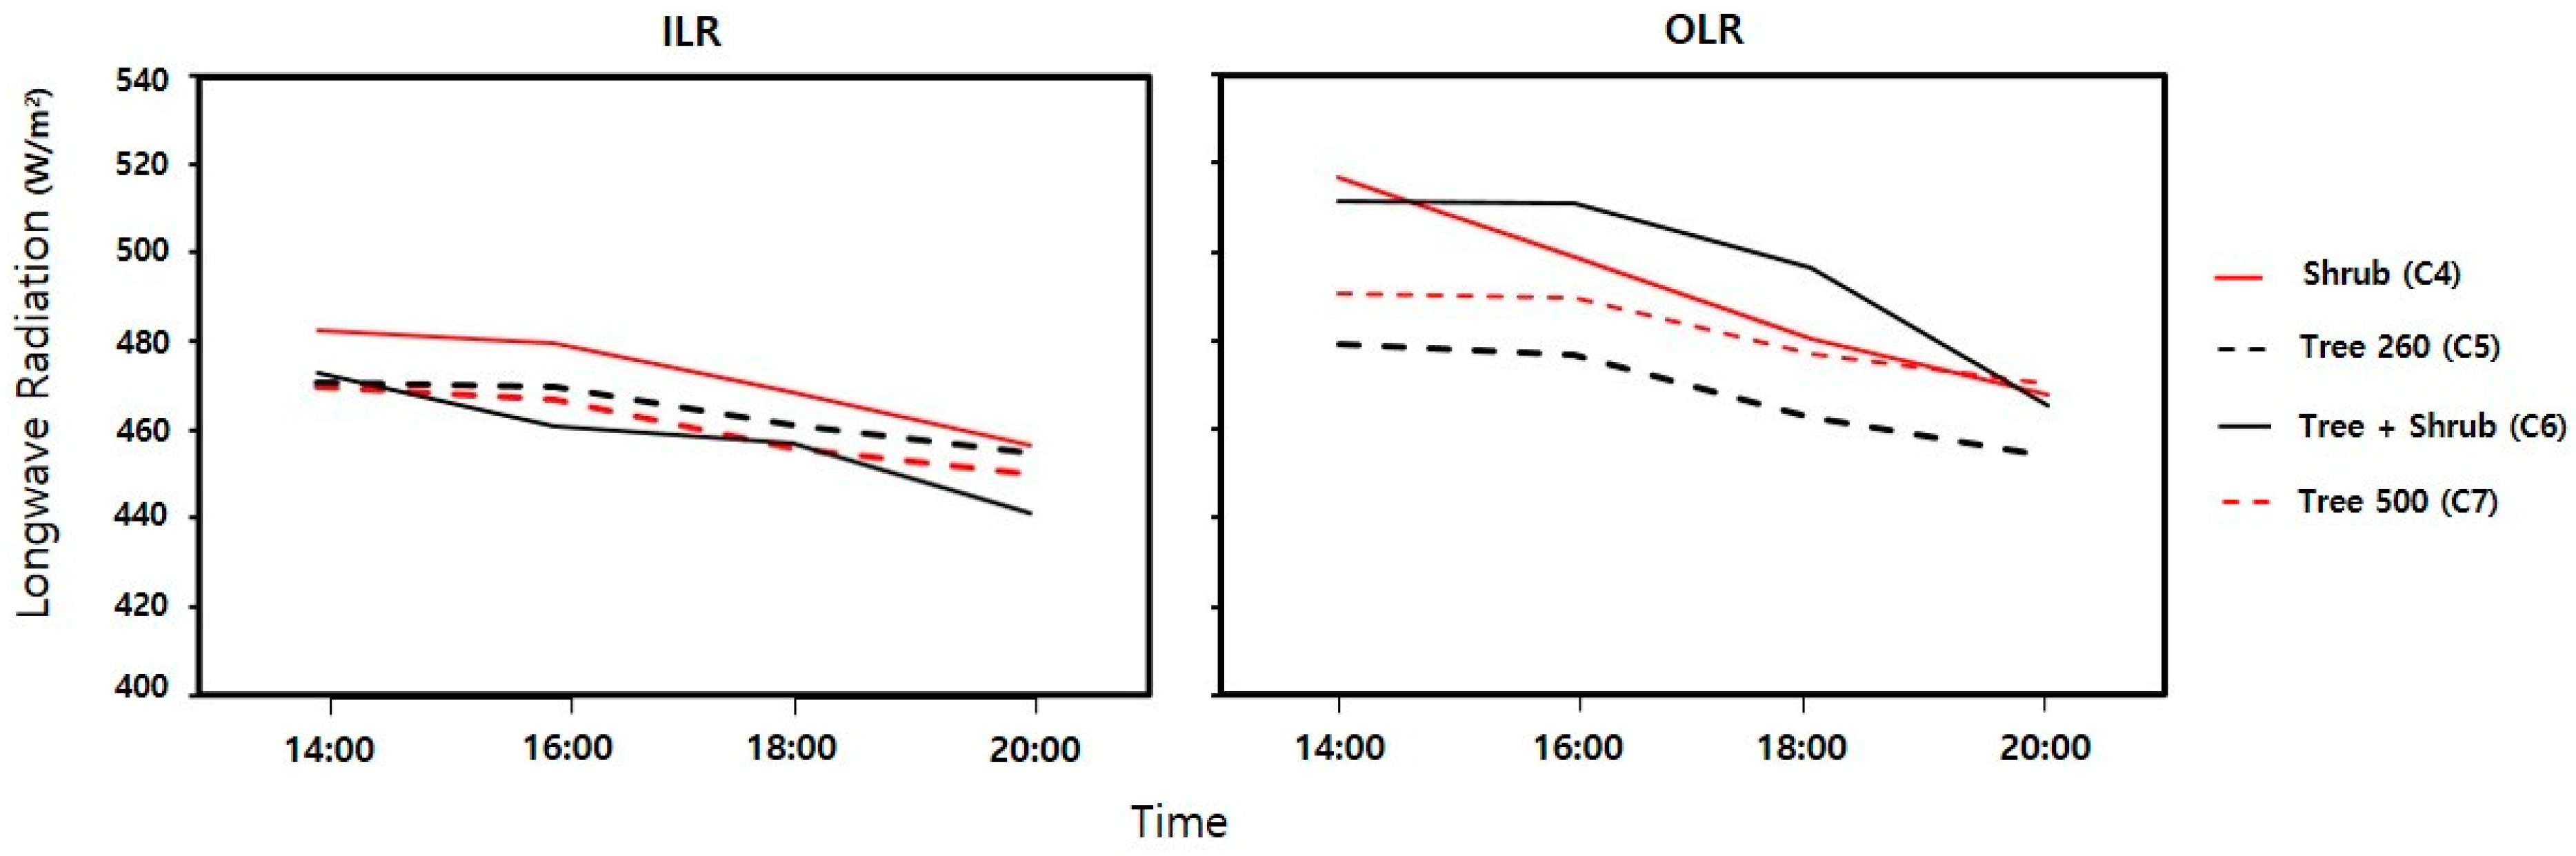
Tree 260 (C5) denotes the location with a tree that is approximately 260 m3 in volume. Tree 500 (C7) indicates the spot with a 530-m3 tree. Shrub (C4) indicates that the spot is surrounded by shrubs. Tree + shrub (C6) refers to an observation spot surrounded by both trees and shrubs (Figure 4).
The OLR is decreased by approximately 13–40 W/m2 and ILR values are decreased by approximately 15–29 W/m2, corresponding to the tree volume and its composition with the time shift (Table 4). However, the OLR of Shrub (C4) demonstrates a predominant decrease of approximately 61 W/m2 from 14:00 to 20:00 (Figure 4, Appendix A). Because of the trees’ blocking function [10], increased areal coverage corresponds to decreased incident radiation and increased coolness. Thus, a higher value of incoming longwave radiation (ILR) means that there is a higher influx of longwave radiation from the peripheral area. The smaller volume of the shrub (mostly under 2 m3) compared to that of trees, causes the emission of a smaller quantity of ILR to the ambient environment in the order C4 > C6 > C5 > C7 (Table 4).
As in Section 3.1, we analysed the effect of tree volume and composition on the degree of change in ILR and OLR [62]. The absolute deviation of each type of longwave radiation of Tree 500 (C7) shows the lowest average standing longwave radiation value (Table 4). It is interpreted that the tree volume type of the measurement site with the largest deviation has a significant effect on the time shift of the longwave radiation.
Among the four types, except for the reference measuring point C3, the place where the ILR is changed the most is Tree + shrub (C6). The order of ADEVILR values is as follows: Tree & Shrub (C6) > Tree 260 (C5) > Tree 530 (C7) > Shrub (C4) (Table 4). Since all the values of ADEV are positive numbers, it implies that C3, an unplanted area, has the highest value of ILR. However, all the planted areas are decreased with ILR and different layers of trees decreases more than a single layer of big trees. That with the largest change in OLR (ADEVOLR) is Tree & Shrub (C6), where the different layers of trees are planted. This indicates that multiple layering of planting is more useful to mitigate the longwave radiation from both up and down emission.
3.4. MRT
Mean radiant temperature (MRT) is one of the favorable outdoor thermal comfort indices and can be estimated by the following Equation (2) [19].
: Effective radiation area factor
: Stefan Boltzmann constant, 5.67 10−8 Wm−2K−4
: the absorption coefficient for short-wave fluxes (standard value 0.7)
: the emissivity of human body. According to Krichhoff’s laws (equal to the absorption coefficient long-wave radiation, standard value 0.97)
: ISR (Incoming shortwave radiation)
: OSR (outgoing shortwave radiation)
: ILR
: OLR
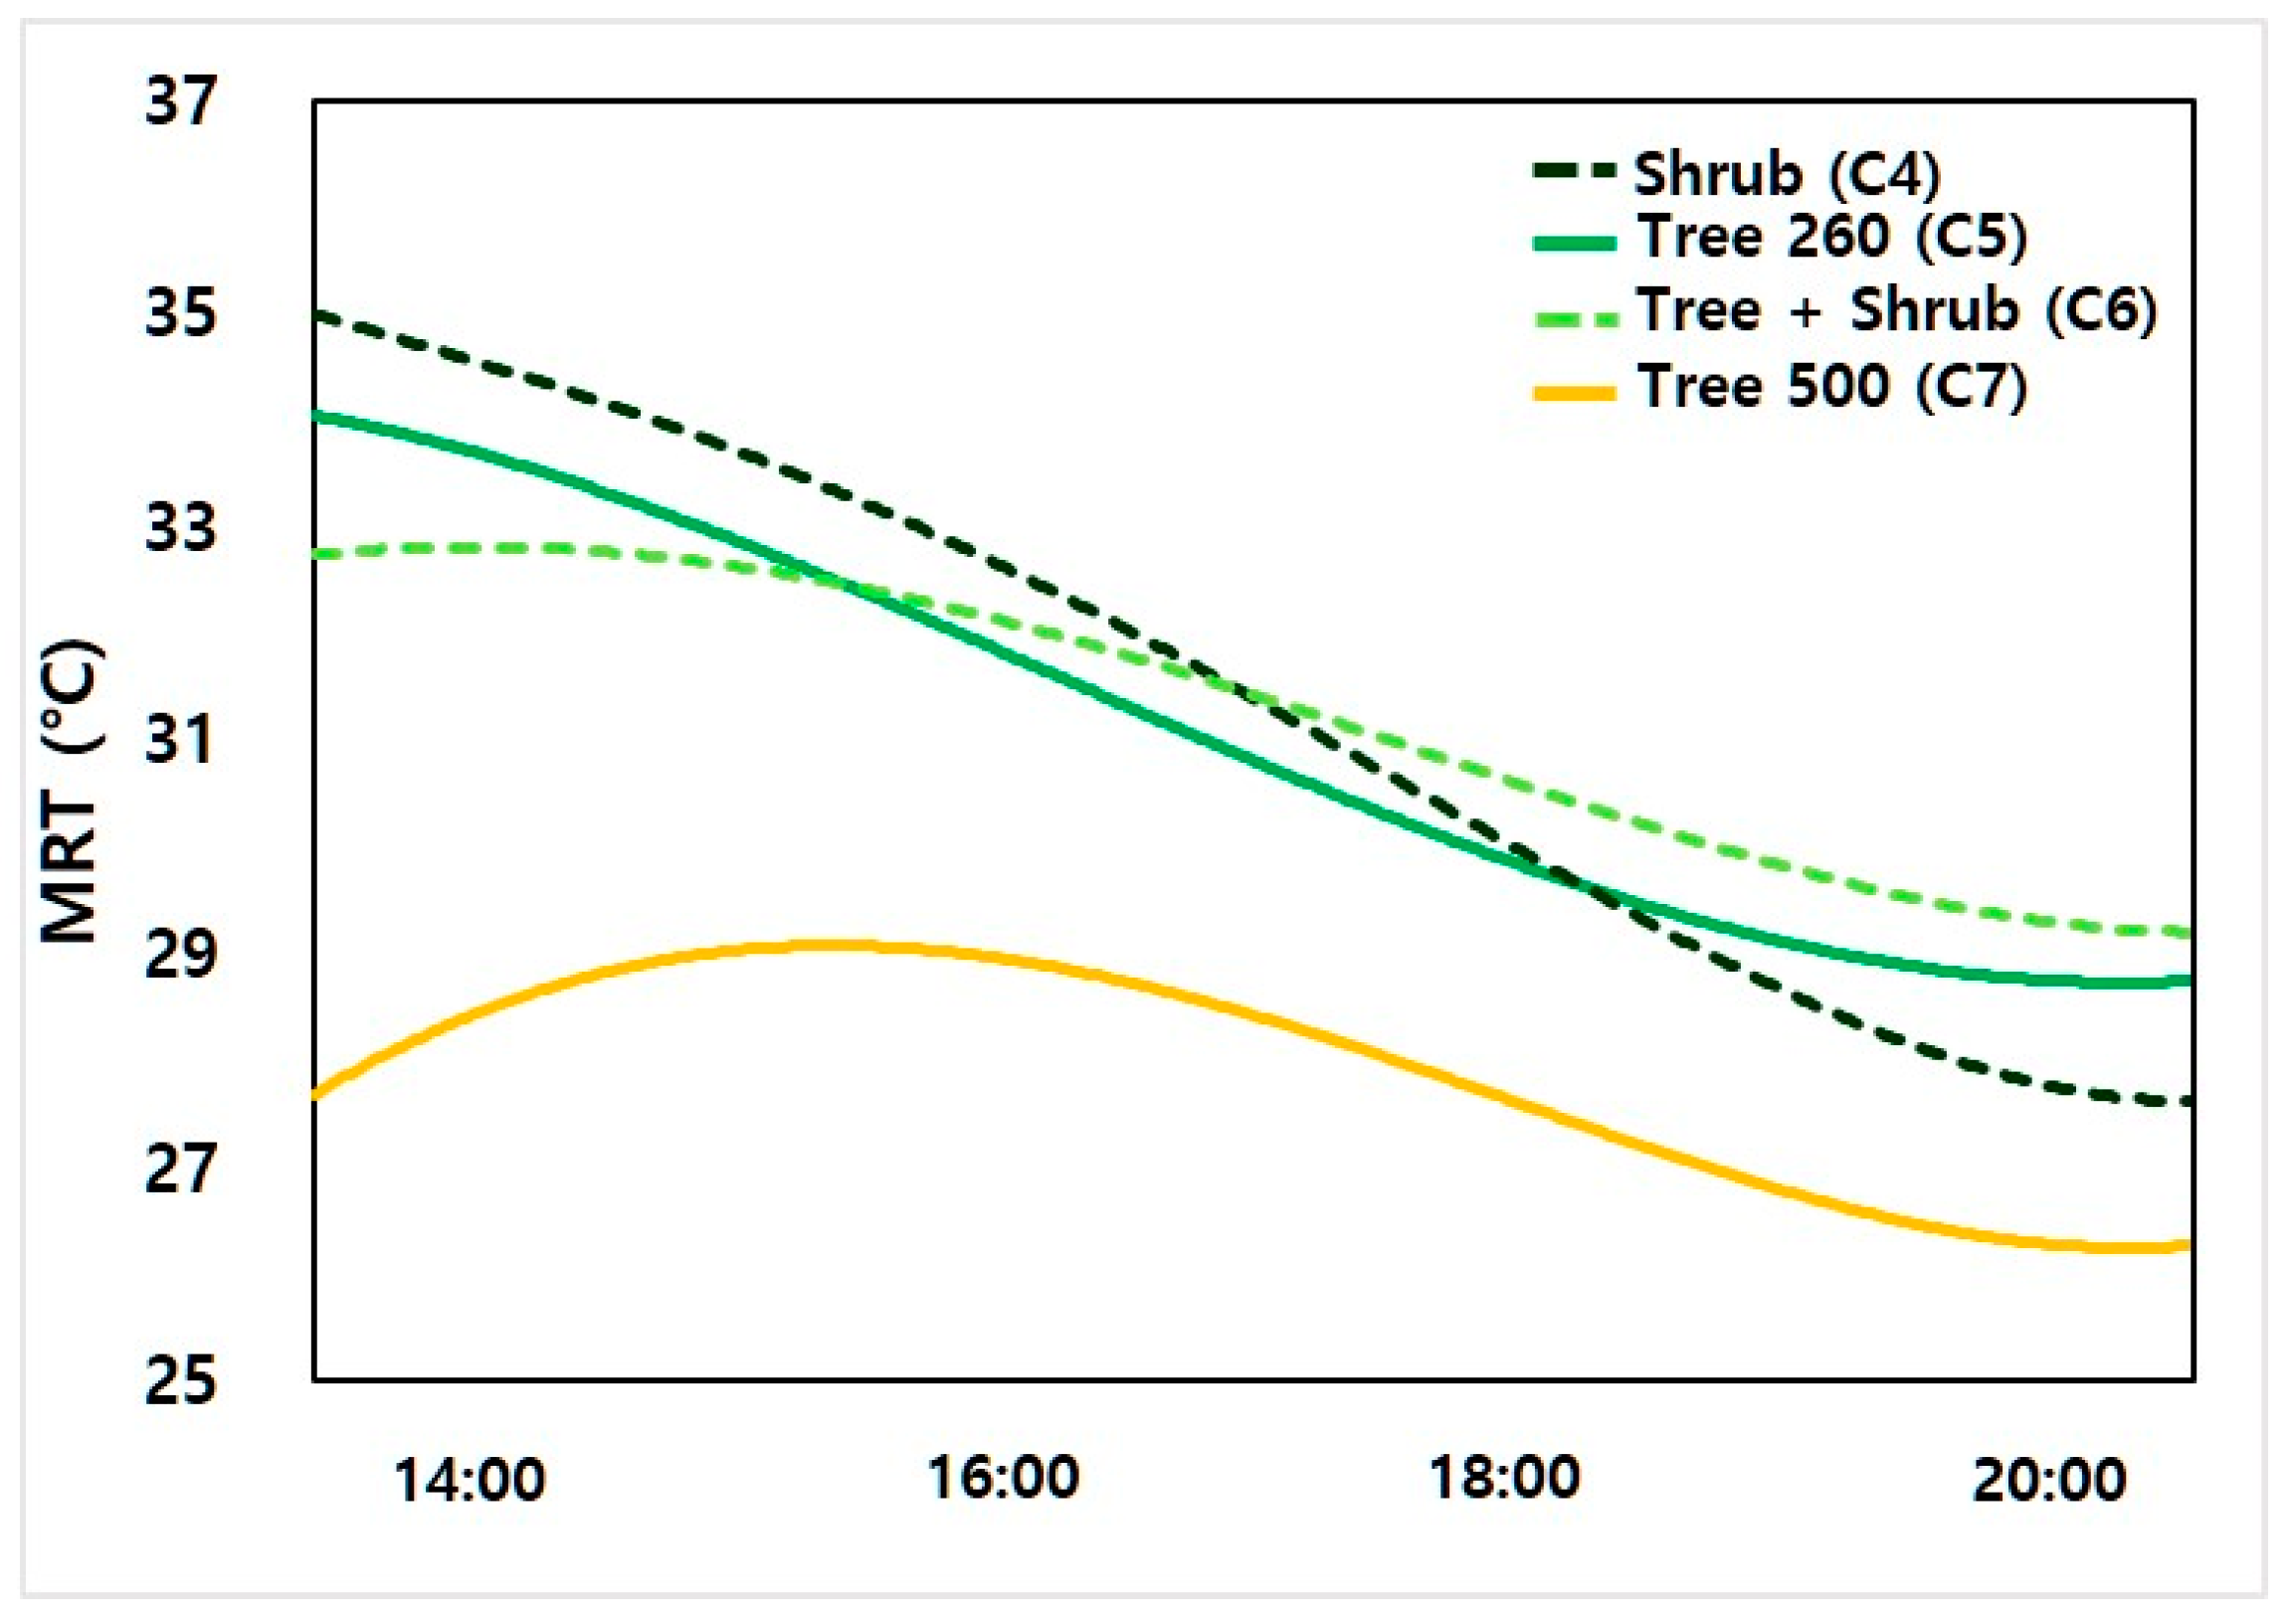
The MRT also demonstrates a declining trend similar to the longwave radiation with time shift (Table 5 and Figure 5). Each measured spot Tree 500 (C7) projects the lowest MRT value from 14:00 to 20:00. The other three types (C4, C5, and C6) demonstrate higher absolute values and decrease in the order of increasing tree volume at first. However, at around 16:00, the MRT of C5 decreases below that of C6; C4 decreases below that of C6 at approximately 17:00. The OLR and ILR values of the shrub (C4) are higher than those of C6 and C5, and the bidirectional longwave radiation accumulates the most at C4 because it has the smallest planting volume. We assume that shrubs block radiation emitted from the ground to the air, while conveying OLR to the ground. Thus, C4 has the highest MRT, even though the temperature drops the most at 18:00 (Table 5 and Figure 5). The typical range of MRT in summer is approximately 35 2 °C [63]. Thus, the values of MRT under the trees (C5, C6, and C7) in our in-situ observations are reasonably low, indicating reduced thermal energy, except in the area with shrubs (C4), because of solar radiation. As the tree volume is doubled from 260 m3 (C5) to 530 m3 (C7), MRT decreases by approximately 10% from 31.05 to 28.0 °C.
Bar graphs express temporal trends in longwave radiation depending on spatial types. Figure 6a compares longwave radiation in open space (C1), open space with trees (C2), a space next to a building (C3), and a space next to a building with trees (C5) at different times. The results show that most measured locations show similar trends. The net longwave radiation decreases when time passes, and the order of values is C1, C2, C3, C5. Figure 6b expresses the radiation time shift with varying tree volumes of trees. In the bar graphs, data nearer the bottom line correspond to lower absolute values of net longwave radiation at the locations indicated. A low absolute net longwave radiation indicates that the surface temperature is lower than those at locations with higher net longwave radiation [64].
In the bar graphs, negative values indicate that the OLR is greater than the ILR. Thus, the locations with negative values are dominated by OLR, including the radiation emitted from peripheral objects.
From Figure 6a, the trends in longwave radiation with the passage of time have similar shapes of lines at different locations. The net longwave radiation in the open space (C1) is the highest among the four observed types: C1 > C2 > C3 > C5. Because C1 has no shade during the daytime, it receives full solar radiation and absorbs a large amount of solar radiation in the ground [65]. Therefore, C1 releases more longwave radiation than the other types at night-time.
However, Figure 6b describes the effect of tree volume on longwave radiation. The time shifts in Figure 6b also show similar trends with variations in tree volume. The net longwave radiation at a spot with both trees and shrubs (C6) has the highest absolute value among the four types of spots; C6 > C4 > C5 > C7. The order of the values indicates that shrubs minimize OLR from the ground [66]. In other words, the ground environmental condition affects the emission of OLR.
4. Discussion: Energy Sustainability to Improve Thermal Environment
Because of the rapid densification of cities and climate change, which impede sustainability, many approaches have been attempted to adapt to summer heatwaves. Most studies have focused on blocking solar radiation to improve thermal comfort. However, this study began by questioning whether people feel cool when they are in areas such as urban canyons, which are shaded by buildings during the daytime. Therefore, the research mainly concentrated on finding the appropriate thermal environment conditions for residents considering urban canyons in summer.
Thus, we investigated the influence of trees and buildings on longwave radiation and MRT, with an emphasis on the temporal shifts in ILR, OLR, and MRT considering tree types and building shade. Although research on the environmental elements affecting UHIE [67] has been performed, the surface temperatures of surrounding buildings also influence longwave radiation in urban canyons [68].
We determined the spatial and environmental effects on radiation in shaded areas by measuring longwave radiation in residential areas located in urban canyons. The temporal shifts of longwave radiation in urban canyons were determined in four location types: locations with trees (C2), buildings (C3), trees and buildings (C5), and open space (C1).
The ILR and OLR values for the four types descend in the order C3 > C5 > C2 > C1 (Table 2). This shows that longwave radiation is emitted most near buildings (C3), and is least emitted in open space (C1). The longwave radiation in areas with buildings and trees (C5) is less than that in areas with only buildings (C3) because the trees block radiation incident on the buildings [69,70]. The data from the tree-only spot (C2) shows that the longwave radiation emitted by the tree volume is smaller than that emitted by buildings. Therefore, increasing tree planting in residential complex designs can not only decrease longwave radiation during the daytime, but also increase the longwave radiation after sunset, thus improving the thermal comfort.
The study area was enlarged to examine the longwave radiation blocking effects of buildings in other residential areas (sites A and B). The ILR was decreased by 11.1 and 19.6 W/m2 in the presence of trees (A2 and B2, respectively) compared to that measured without trees (A1 and B1, respectively). OLR at A2 was lower than that at B2. The decrease in ILR indicates that the longwave radiation emitted from the building is decreased, which contributes to the energy balance in the residential complex. However, OLR was lower at the spot with the tree. This is because the treetop effect in the surface energy balance [71] was low because of the small number of trees. Therefore, in designing detailed planting in a residential complex, the number of trees required to decrease longwave radiation should be considered.
4.1. Time Shift of Radiation by Tree Volume and Composition
In the longwave radiation change according to tree volume, the radiation value is the lowest at the location with both trees and shrubs (C6). This is because the location has a lower SVF, which is advantageous for thermal comfort. This result can be used in planting planning or designs. In addition, a greater tree volume has a greater blocking effect on longwave radiation. Therefore, denser canopy space filling [72] in planting design is more favourable for enhanced thermal comfort.
4.2. Time Shift of MRT
The temporal change of the estimated MRT indicates that the location with the largest tree volume (C7) is the most favourable for thermal comfort. The sharpest decline of both day and night longwave radiation occurs at C4, which is planted with shrubs. However, low absolute MRT values and low day and night fluctuations, rather than a drastically reduced night-time MRT, can help promote the energy balance to achieve sustainable thermal and residential thermal environments. From MRT analysis, we found that about a 10% reduction in MRT could be achieved with around a 50% increase in the tree volume.
4.3. Study Limitations
The measuring equipment was located north of the buildings and the distance between the trees and the building was approximately 17 m. Four-story buildings were located at spots B1 and B2. These architectural circumstances restricted the shade from reaching the tree spot and allowed the tree to create shade near the building during the daytime [73]. The two-directional MRT measurement instruments may cause higher MRT under incoming longwave radiation [74]. Each sensor (where each instrument has two longwave radiation sensors) collects the radiation value over a half-hemisphere (180°). Thus, ILR was only collected from the upper sensor, so the MRT value is only affected by the sky condition, unlike a six-directional MRT value.
Because this research utilized limited seasons and spaces, longwave radiation trends in the winter should be investigated as well.
4.4. Suggestions for Further Research
In this study, focused longwave radiation directly affects the urban thermal environment relative to the surface temperature in shadowy urban canyons [74]. Considering this point, research on longwave radiation allows the proposal of new methods to secure energy efficiency by manipulating the volume and composition of planting in overpopulated residential areas with concentrated high-rise buildings. Research on the temporal changes and energy balance of longwave radiation in shaded areas is useful for urban planners in developing microclimate-change adaptation methods.
We expect that the findings regarding the interactions of tree volume, building shade, and longwave radiation can contribute to rationalizing landscape and architectural standard criteria for residential apartment complex redevelopment in megacities. However, to solve heat problems in a megacity residential apartment complex, the role of trees, which reduce longwave radiation, is important. The development of high-density residential areas will require the establishment of standard criteria that may be reflected in construction, considering the temporal change of longwave radiation shifts in residential areas shaded by buildings. In addition, land use characteristics such as the terrestrial and surrounding environments affect variations in longwave radiation and resulting trends.
5. Conclusions
This research investigated shifts in longwave radiation over time, depending on spatial aspects, focusing on trees, buildings, and their sizes. Radiation was measured in residential areas where the spatial characteristics met our requirements for the designed investigation. From the measurements, we found that voluminous trees and multi-layered planting (i.e., trees and shrubs) facilitate longwave radiation mitigation more than single-layer planting, because they block radiation from buildings. Moreover, analysis of the MRT showed that larger tree volumes corresponded to greater thermal comfort. For instance, a 50% increase in tree volume induced a 10% decrease in MRT. These results may permit urban planners and designers to manage longwave radiation and improve thermal comfort in residential areas.
Net longwave radiation was more decreased under conditions of steady shade than under partial sunlight exposure, as shown by the research. We can apply this characteristic to the design of urban residential site designs, considering tree volume and composition. Multi-layered urban tree canopies favor the improvement of thermal environment and energy sustainability. Larger trees planted with harmonious shrubs are more effective and useful for reducing longwave radiation than smaller trees or only shrubs. The data presented in this study may guide the management of tree volume and various vertical aspects in planting in residential areas to reduce longwave radiation.
The findings of the study offer new data to rationalize methods for thermal environment improvement. For future research related to sustainable radiation mitigation methods in the daytime under heatwaves, appropriate species and volumes of trees for controlling longwave radiation in residential areas could be investigated in detail. More advanced studies regarding natural emitted surplus radiation could be adequately performed with the positive reuse of energy for achieving community energy balance. In the future, radiation measurement research will be performed on additional sites to further determine the influences of tree species and volume on longwave radiation over time. For this, SVF data over time must be obtained. In our next work, we aim to conduct a simulation of spatial radiation distribution tendencies, in addition to proposing a physical and chemical model related to the thermal environment and in-situ human body mobile observations. This simulation will facilitate explanation of the spatial mechanism of thermal vulnerability in urban environments.
Author Contributions
Data curation, Y.J.K.; Conceptualization, Y.J.K.; Formal analysis, Y.J.K.; Funding acquisition, D.K.L.; Investigation, Y.J.K.; Methodology, Y.J.K.; Visualization, Y.J.K.; Supervision, D.K.L.; Writing—original draft, Y.J.K.; Writing—review & editing, D.K.L.
Funding
This research was funded by the Korea Agency for Infrastructure Technology Advancement (KAIA) grant funded by the Ministry of Land, Infrastructure and Transport (Grant 19AUDP-B102406-05).
Acknowledgments
This work was supported by the BK 21 Plus Project in 2018 (Seoul National University Interdisciplinary Program in Landscape Architecture, Global Leadership Program toward Innovative Green Infrastructure). We truly appreciate for taking photos who is one of the lab colleagues at SNU, Han Kyul Heo and also thank to students at SNU who helped measuring under sunlit in such an extremely hot weather. Lastly, we appreciate the anonymous reviewers for their constructive suggestions and scrutinisingly comments to improve the quality of this paper and also to the editors, especially Sylvia Du.
Conflicts of Interest
The authors declare no conflicts of interest. The funders had no role in the design of the study; in the collection, analyses, or interpretation of data; in the writing of the manuscript, or in the decision to publish the results.
Appendix A. Study Site Details and Measured Data

Table A1.
Properties and Measured Data of the Study Site.
| Type | Schematic (Unit: m/m3) | Boxplot (Mean/STDV) | Photographs (SVF/Site) | |
|---|---|---|---|---|
| A1 |  Bldg. H (Height)/V (Volume): 18/10368 Tree height/vol.: 20/530 |  ILR Mean 451.3, Standard deviation: 14.2 OLR Mean 456.8, Standard deviation: 13.5 |  0.49 |  |
| A2 |  Bldg. H/V: 42/39312 Shrub H/V: 1/15 |  ILR Mean 445.7, Standard deviation: 5.2 OLR Mean 452.1, Standard deviation: 8.1 |  0.38 |  |
| B1 |  Bldg. H/V: 15/15000 Tree H/V: 10/24 Shrub H/V: 1/4 |  ILR Mean 427.0, Standard deviation: 5.0 OLR Mean 465.0, Standard deviation: 6.0 |  0.42 |  |
| B2 |  Bldg. H/V: 15/15000 |  ILR Mean 415.8, Standard deviation: 10.1 OLR Mean 473.3, Standard deviation: 16.5. |  0.81 |  |
| C1 |  Open space (parking lot): 70 × 30 = 2100 m2 |  ILR Mean 443.2, Standard deviation: 26.7 OLR Mean 508.5, Standard deviation: 33.2 |  0.67 |  |
| C2 |  Open space: 50 × 40 m = 2000 m2 Tree volume: 504 m3 |  ILR Mean 438.5, Standard deviation: 8.4 OLR Mean 511.0, Standard deviation: 33.8. |  0.78 |  |
| C3 |  Building H/V: 42/39312 |  ILR Mean 471.2, Standard deviation: 7.6 OLR Mean 469.3, Standard deviation: 8.5 |  0.46 |  |
| C4 |  Building H/V: 42/39312 Tree H/V: 1/353 |  ILR Mean 472.9, Standard deviation: 10.8 OLR Mean 491.0, Standard deviation: 22..8 |  0.74 |  |
| C5 |  Building H/V: 42/39312 Tree H/V: 20/265 (cone) |  ILR Mean 460.6, Standard deviation: 8.9 OLR Mean 481.8, Standard deviation: 18.1 |  0.38 |  |
| C6 |  Building H/V: 42/39312Shrub H/V: 1/353 Tree H/V: 10/261(oval) |  ILR Mean 458.0, Standard deviation: 12.5 OLR Mean 495.5, Standard deviation: 21.8. |  0.48 |  |
| C7 |  Building H/V: 42/39312 Tree H/V:18/530 (oval) |  ILR Mean 464.0, Standard deviation: 5.4 OLR Mean 468.1, Standard deviation: 7.8 |  0.34 |  |
Table A2.
C4, C5, C6, and C7 values.
| Shrub (C4) | Tree 260 (C5) | Tree & Shrub (C6) | Tree 500 (C7) | |||||
|---|---|---|---|---|---|---|---|---|
| time (hours) | ILR | OLR | ILR | OLR | ILR | OLR | ILR | OLR |
| 1400 | 486.67 | 526.05 | 460.46 | 481.66 | 472.78 | 521.35 | 467.50 | 471.88 |
| 1600 | 476.48 | 484.09 | 465.09 | 480.93 | 469.64 | 516.36 | 469.68 | 477.84 |
| 1800 | 465.63 | 476.55 | 453.07 | 467.05 | 464.18 | 506.81 | 459.91 | 460.73 |
| 2000 | 454.65 | 465.03 | 447.13 | 459.20 | 458.07 | 496.07 | 454.94 | 456.11 |
Table A3.
CNR4 specifications of the pyranometer (thorough explanation of CNR4, a net radiometer).
| Pyranometers Specification | Value (Unit) | Definition |
|---|---|---|
| Sensing sensitivity | 5~20 (µV/W/m²) | Calibration factor |
| Irradiance range | 0~2000 (W/m²) | Measurement range |
| Net irradiance range | −250~+250 (W/m²) | |
| Shortwave radiation spectral range | 300~2800 (nm) | |
| Longwave radiation spectral range | 4500~430,000 (nm) | |
| Field of view | 1) upper detector: 180°, 2) lower detector: 150° | Sensor opening angle |
| Non-linearity | less than 1 (%) | 0~1000 W/m² irradiance—Maximum deviation from the responsivity at 500 W/m2 due to any change of irradiance within the indicated range. |
| Uncertainty in daily total | Less than 5 (95% confidence level) | Achievable uncertainty |
| Temperature dependence of sensitivity | −10~+ 40 (°C) | |
| Operating temperature | −40~+ 80 (°C) | |
| Environmental | 0–100% RH | Relative Humidity |
| Response time | less than 18 s | 95% response |
| Directional error | less than 20 (W/m²) | angles up to 80° with 1000 W/m² Beam radiation–combined zenith and azimuth error from 0~80° with 1000 W/m² beam radiation |
Sited by KIPP & ZONEN CNR4 Net Radiometer Instruction Manual.
Table A4.
Correlation of longwave radiation and measured weather condition.
| LW_Up | LW_Down | Wind_Speed | Air_Temp | SVF | ||
|---|---|---|---|---|---|---|
| LW_up | Pearson Correlation | 1 | −0.582 ** | −0.171 ** | −0.041 * | −0.507 ** |
| Sig. (2-tailed) | 0.000 | 0.000 | 0.044 | 0.000 | ||
| Sum of Squares and Cross-products | 767511.866 | −721733.521 | −5068.676 | −1214.111 | −3638.978 | |
| N | 2421 | 2421 | 2419 | 2419 | 2419 | |
| LW_down | Pearson Correlation | −0.582 ** | 1 | 0.157 ** | 0.566 ** | 0.734 ** |
| Sig. (2-tailed) | 0.000 | 0.000 | 0.000 | 0.000 | ||
| Sum of Squares and Cross-products | −721733.521 | 2006096.517 | 7555.581 | 27051.415 | 8520.616 | |
| N | 2421 | 2421 | 2419 | 2419 | 2419 | |
| Wind_speed | Pearson Correlation | −0.171 ** | 0.157 ** | 1 | 0.148 ** | 0.059 ** |
| Sig. (2-tailed) | 0.000 | 0.000 | 0.000 | 0.004 | ||
| Sum of Squares and Cross-products | −5068.676 | 7555.581 | 1150.502 | 169.017 | 16.404 | |
| N | 2419 | 2419 | 2419 | 2419 | 2419 | |
| Air_temp | Pearson Correlation | −0.041 * | 0.566 ** | 0.148 ** | 1 | 0.374 ** |
| Sig. (2-tailed) | 0.044 | 0.000 | 0.000 | 0.000 | ||
| Sum of Squares and Cross-products | −1214.111 | 27051.415 | 169.017 | 1141.213 | 103.434 | |
| Covariance | −0.502 | 11.188 | 0.070 | 0.472 | 0.043 | |
| N | 2419 | 2419 | 2419 | 2419 | 2419 | |
| SVF | Pearson Correlation | −0.507 ** | 0.734 ** | 0.059 ** | 0.374 ** | 1 |
| Sig. (2-tailed) | 0.000 | 0.000 | 0.004 | 0.000 | ||
| Sum of Squares and Cross-products | −3638.978 | 8520.616 | 16.404 | 103.434 | 67.164 | |
| Covariance | −1.505 | 3.524 | 0.007 | 0.043 | 0.028 | |
| N | 2419 | 2419 | 2419 | 2419 | 2419 | |
Note: **. Correlation is significant at the 0.01 level (2-tailed). *. Correlation is significant at the 0.05 level (2-tailed).
References
- Madlener, R.; Sunak, Y. Impacts of urbanization on urban structures and energy demand: What can we learn for urban energy planning and urbanization management? Sustain. Cities Soc. 2011, 1, 45–53. [Google Scholar] [CrossRef]
- Turok, I.; McGranahan, G. Urbanization and economic growth: The arguments and evidence for Africa and Asia. Environ. Urban. 2013, 25, 465–482. [Google Scholar] [CrossRef]
- Grace Wong, K.M. Vertical cities as a solution for land scarcity: the tallest public housing development in Singapore. URBAN Des. Int. 2004, 9, 17–30. [Google Scholar] [CrossRef]
- Basara, J.B.; Basara, H.G.; Illston, B.G.; Crawford, K.C. The Impact of the Urban Heat Island during an Intense Heat Wave in Oklahoma City. Adv. Meteorol. 2010, 2010, 1–10. [Google Scholar] [CrossRef]
- Adebayo, Y.R. Aspects of the variation in some characteristics of radiation budget within the urban canopy of Ibadan. Atmos. Environ. Part B Urban Atmos. 1990, 24, 9–17. [Google Scholar] [CrossRef]
- Kiehl, J.T.; Trenberth, K.E. Earth’s Annual Global Mean Energy Budget. Bull. Am. Meteorol. Soc. 1997, 78, 197–208. [Google Scholar] [CrossRef]
- Todhunter, P.E.; Terjung, W.H. Intercomparison of three urban climate models. Boundary-Layer Meteorol. 1988, 42, 181–205. [Google Scholar] [CrossRef]
- Nazarian, N.; Fan, J.; Sin, T.; Norford, L.; Kleissl, J. Predicting outdoor thermal comfort in urban environments: A 3D numerical model for standard effective temperature. Urban Clim. 2017, 20, 251–267. [Google Scholar] [CrossRef] [Green Version]
- McPherson, E.G.; Simpson, J.R. Potential energy savings in buildings by an urban tree planting programme in California. Urban For. Urban Green. 2003, 2, 73–86. [Google Scholar] [CrossRef]
- Lai, A.; Maing, M.; Ng, E. Observational studies of mean radiant temperature across different outdoor spaces under shaded conditions in densely built environment. Build. Environ. 2017, 114, 397–409. [Google Scholar] [CrossRef]
- Palme, M.; Lobato, A.; Carrasco, C. Quantitative Analysis of Factors Contributing to Urban Heat Island Effect in Cities of Latin-American Pacific Coast. Procedia Eng. 2016, 169, 199–206. [Google Scholar] [CrossRef]
- Zhou, Y.; Zhuang, Z.; Yang, F.; Yu, Y.; Xie, X. Urban morphology on heat island and building energy consumption. Procedia Eng. 2017, 205, 2401–2406. [Google Scholar] [CrossRef]
- Rossi, F.; Castellani, B.; Presciutti, A.; Morini, E.; Filipponi, M.; Nicolini, A.; Santamouris, M. Retroreflective façades for urban heat island mitigation: Experimental investigation and energy evaluations. Appl. Energy 2015, 145, 8–20. [Google Scholar] [CrossRef]
- ASHRAE. ASHRAE-55 Thermal environmental conditions for human occupancy. In ANSI/ASHRAE Stand.—55; ASHRAE: Atlanta, GA, USA, 2004; Volume 6, ISBN 1041-2336. [Google Scholar]
- Chen, L.; Ng, E. Outdoor thermal comfort and outdoor activities: A review of research in the past decade. Cities 2012, 29, 118–125. [Google Scholar] [CrossRef]
- Yang, W.; Lin, Y.; Wong, N.H.; Zhou, J. Thermal comfort requirements in the summer season in subtropical urban spaces. Intell. Build. Int. 2014, 6, 224–238. [Google Scholar] [CrossRef]
- Hoppe, P. The physiological equivalent temperature—A universal index for the biometeorological assessment of the thermal environment. Int. J. Biometeorol. 1999, 2466, 71–75. [Google Scholar] [CrossRef]
- Paliaga, G.; Schoen, L.J.; Alspach, P.F.; Arens, E.A.; Aynsley, R.M.; Bean, R.; Eddy, J.; Hartman, T.B.; Int-hout, D.; Humphreys, M.A.; et al. Thermal environmental conditions for human occupancy. ASHRAE Stand. 2010, 8400, 1–44. [Google Scholar]
- Pickup, J.; de Dear, R. An outdoor thermal comfort index ( OUT-SET *)—Part I—The model and its assumptions AN OUTDOOR THERMAL COMFORT INDEX (OUT-SET *). In Proceedings of the 15th International Congress Biometeorology and International Conference on Urban Climatology, Sydney, Australia, 8–12 November 1999; de Dear, R., Kalma, J., Oke, T., Auliciems, A., Eds.; Volume 99, pp. 279–283. [Google Scholar]
- Eliasson, I. The use of climate knowledge in urban planning. Landsc. Urban Plan. 2000, 48, 31–44. [Google Scholar] [CrossRef]
- Bröde, P.; Fiala, D.; Blazejczyk, K.; Holmér, I.; Jendritzky, G.; Kampmann, B.; Tinz, B.; Havenith, G. Deriving the operational procedure for the Universal Thermal Climate Index (UTCI). Int. J. Biometeorol. 2012, 56, 481–494. [Google Scholar] [CrossRef]
- Rozbicka, K.; Rozbicki, T. Variability of UTCI index in South Warsaw depending on atmospheric circulation. Theor. Appl. Climatol. 2018, 133, 511–520. [Google Scholar] [CrossRef]
- Walikewitz, N.; Jänicke, B.; Langner, M.; Meier, F.; Endlicher, W. The difference between the mean radiant temperature and the air temperature within indoor environments: A case study during summer conditions. Build. Environ. 2015, 84, 151–161. [Google Scholar] [CrossRef]
- Lu, S.; Li, Z.; Zhao, Q. Thermal Process of Windows in Hot Summer and Cold Winter Climate. Procedia Eng. 2015, 121, 1788–1794. [Google Scholar] [CrossRef] [Green Version]
- Kushnir, Y.U. Solar Radiation and the Earth’s Energy Balance. Take away ideas and understandings Lecture 2000. Available online: https://eesc.columbia.edu/courses/ees/climate/lectures/radiation/index.html (accessed on 20 July 2002).
- Park, B.; Oh, K.; Hong, S. Analysis of the Changes in Urban Thermal Environments Considering Development Densities (FAR and BCR). Int. J. Environ. Sci. Dev. 2018, 9, 32–37. [Google Scholar] [CrossRef] [Green Version]
- Kwon, Y.J.; Lee, D.K.; Ahn, S. Urban Street Planting Scenarios Simulation for Micro-scale Urban Heat Island Effect Mitigation in Seoul. J. Environ. Impact Assess. 2019, 28, 23–34. [Google Scholar] [CrossRef]
- Lehmann, B.; Ghazi Wakili, K.; Frank, T.; Vera Collado, B.; Tanner, C. Effects of individual climatic parameters on the infrared thermography of buildings. Appl. Energy 2013, 110, 29–43. [Google Scholar] [CrossRef]
- Avdelidis, N.P.; Moropoulou, A. Emissivity considerations in building thermography. Energy Build. 2003, 35, 663–667. [Google Scholar] [CrossRef]
- Benas, N.; Chrysoulakis, N.; Cartalis, C. Trends of urban surface temperature and heat island characteristics in the Mediterranean. Theor. Appl. Climatol. 2017, 130, 807–816. [Google Scholar] [CrossRef]
- Santamouris, M. Cooling the cities—A review of reflective and green roof mitigation technologies to fight heat island and improve comfort in urban environments. Sol. Energy 2014, 103, 682–703. [Google Scholar] [CrossRef]
- Zhou, Z.; Yang, G.; Lin, Y.; Deng, Q. Quantitative study of using piloti for passive climate adaptability in a hot-summer and cold-winter city in China. Int. J. Environ. Res. Public Health 2018, 15, 2202. [Google Scholar] [CrossRef]
- Haro-Rincón, Z.; Velázquez-Limón, N.; Santillán-Soto, N.; García-Cueto, R.; Quintero-Núñez, M.; Ojeda-Benítez, S. Radiation Balance of Urban Materials and Their Thermal Impact in Semi-Desert Region: Mexicali, México Study Case. Atmosphere (Basel) 2015, 6, 1578–1589. [Google Scholar] [CrossRef] [Green Version]
- Yuan, Y.; Xi, C.; Jing, Q.; Felix, N. Seasonal Variations of the Urban Thermal Environment Effect in a Tropical Coastal City. Adv. Meteorol. 2017, 2017, 1–18. [Google Scholar] [CrossRef] [Green Version]
- Irsyad, M.; Pasek, A.D.; Indartono, Y.S.; Pratomo, A.W. Heat transfer characteristics of building walls using phase change material. IOP Conf. Ser. Earth Environ. Sci. 2017, 60. [Google Scholar] [CrossRef]
- Lauster, M.; Remmen, P.; Fuchs, M.; Teichmann, J.; Streblow, R.; Müller, D. Modelling long-wave radiation heat exchange for thermal network building simulations at urban scale using Modelica. In Proceedings of the 10th International Modelica Conference, Lund, Sweden, 10–12 March 2014. [Google Scholar] [CrossRef]
- Hwang, R.L.; Lin, T.P.; Matzarakis, A. Seasonal effects of urban street shading on long-term outdoor thermal comfort. Build. Environ. 2011, 46, 863–870. [Google Scholar] [CrossRef]
- Shashua-Bar, L.; Pearlmutter, D.; Erell, E. The influence of trees and grass on outdoor thermal comfort in a hot-arid environment. Int. J. Climatol. 2011, 31, 1498–1506. [Google Scholar] [CrossRef]
- Kwon, Y.J.; Ahn, S.; Lee, D.K.; Yoon, E.J.; Sung, S.; Lee, K. Spatial Typification based on Heat Balance for Improving Thermal Environment in Seoul. J. Korea Plan. Assoc. 2018, 53, 109–126. [Google Scholar] [CrossRef]
- Chambers, U.; Jones, V.P. Effect of Over-Tree Evaporative Cooling in Orchards on Microclimate and Accuracy of Insect Model Predictions. Environ. Entomol. 2015, 44, 1627–1633. [Google Scholar] [CrossRef]
- Coutts, A.M.; White, E.C.; Tapper, N.J.; Beringer, J.; Livesley, S.J. Erratum to: Temperature and human thermal comfort effects of street trees across three contrasting street canyon environments (Theor Appl Climatol, 10.1007/s00704-015-1409-y). Theor. Appl. Climatol. 2016, 126, 815. [Google Scholar] [CrossRef]
- Salata, F.; Golasi, I.; de Lieto Vollaro, R.; de Lieto Vollaro, A. Urban microclimate and outdoor thermal comfort. A proper procedure to fit ENVI-met simulation outputs to experimental data. Sustain. Cities Soc. 2016, 26, 318–343. [Google Scholar] [CrossRef]
- Ascione, F.; Bianco, N.; De Stasio, C.; Mauro, G.M.; Vanoli, G.P. Simulation-based model predictive control by the multi-objective optimization of building energy performance and thermal comfort. Energy Build. 2016, 111, 131–144. [Google Scholar] [CrossRef]
- Chen, Q.; Lin, C.; Guo, D.; Hou, Y.; Lai, D. Studies of outdoor thermal comfort in northern China. Build. Environ. 2014, 77, 110–118. [Google Scholar] [CrossRef]
- Coccolo, S.; Kämpf, J.; Scartezzini, J.L.; Pearlmutter, D. Outdoor human comfort and thermal stress: A comprehensive review on models and standards. Urban Clim. 2016, 18, 33–57. [Google Scholar] [CrossRef]
- Rupp, R.F.; Vásquez, N.G.; Lamberts, R. A review of human thermal comfort in the built environment. Energy Build. 2015, 105, 178–205. [Google Scholar] [CrossRef]
- Evola, G.; Gagliano, A.; Fichera, A.; Marletta, L.; Martinico, F.; Nocera, F.; Pagano, A. UHI effects and strategies to improve outdoor thermal comfort in dense and old neighbourhoods. Energy Procedia 2017, 134, 692–701. [Google Scholar] [CrossRef]
- Krayenhoff, E.S. A multi-layer urban canopy model for neighbourhoods with trees. In Proceedings of the ICUC9 9th International Conference on Urban Climate jointly with 12th Symposium on the Urban Environment, Toulouse, France, 20–24 July 2015. [Google Scholar]
- Kingdom, U.; Kingdom, U.; Kingdom, U. Key Conclusions of the First International Urban. AMS J. 2015. [CrossRef]
- Kong, F.; Yin, H.; James, P.; Hutyra, L.R.; He, H.S. Effects of spatial pattern of greenspace on urban cooling in a large metropolitan area of eastern China. Landsc. Urban Plan. 2014, 128, 35–47. [Google Scholar] [CrossRef]
- Tan, Z.; Lau, K.K.L.; Ng, E. Urban tree design approaches for mitigating daytime urban heat island effects in a high-density urban environment. Energy Build. 2016, 114, 265–274. [Google Scholar] [CrossRef]
- Livesley, S.J.; McPherson, G.M.; Calfapietra, C. The Urban Forest and Ecosystem Services: Impacts on Urban Water, Heat, and Pollution Cycles at the Tree, Street, and City Scale. J. Environ. Qual. 2016, 45, 119. [Google Scholar] [CrossRef] [Green Version]
- Shashua-Bar, L.; Hoffman, M.E. Geometry and orientation aspects in passive cooling of canyon streets with trees. Energy Build. 2003, 35, 61–68. [Google Scholar] [CrossRef]
- Wang, Z.H.; Zhao, X.; Yang, J.; Song, J. Cooling and energy saving potentials of shade trees and urban lawns in a desert city. Appl. Energy 2016, 161, 437–444. [Google Scholar] [CrossRef] [Green Version]
- OMalley, C.; Piroozfar, P.; Farr, E.R.; Pomponi, F. Urban heat island (UHI) mitigating strategies: A case-based comparative analysis. Sustain. Cities Soc. 2015, 19, 222–235. [Google Scholar] [CrossRef]
- Aflaki, A.; Mirnezhad, M.; Ghaffarianhoseini, A.; Ghaffarianhoseini, A.; Omrany, H.; Wang, Z.H.; Akbari, H. Urban heat island mitigation strategies: A state-of-the-art review on Kuala Lumpur, Singapore and Hong Kong. Cities 2017, 62, 131–145. [Google Scholar] [CrossRef]
- Wang, Y.; Fukuda, H. The influence of insulation styles on the building energy consumption and indoor thermal comfort of multi-family residences. Sustainability 2019, 11, 266. [Google Scholar] [CrossRef]
- Park, J.; Kim, J.H.; Lee, D.K.; Park, C.Y.; Jeong, S.G. The influence of small green space type and structure at the street level on urban heat island mitigation. Urban For. Urban Green. 2017, 21, 203–212. [Google Scholar] [CrossRef]
- Hart, M.A.; Sailor, D.J. Quantifying the influence of land-use and surface characteristics on spatial variability in the urban heat island. Theor. Appl. Climatol. 2009, 95, 397–406. [Google Scholar] [CrossRef]
- Kobal, M.; Kastelec, D.; Eler, K. Temporal changes of forest species composition studied by compositional data approach. IForest 2017, 10, 729–738. [Google Scholar] [CrossRef] [Green Version]
- Cole, R.J. The longwave radiative environment around buildings. Build. Environ. 1976, 11, 3–13. [Google Scholar] [CrossRef]
- Redon, E.C.; Lemonsu, A.; Masson, V.; Morille, B.; Musy, M. Implementation of street trees within the solar radiative exchange parameterization of TEB in SURFEX v8.0. Geosci. Model Dev. 2017, 10, 385–411. [Google Scholar] [CrossRef] [Green Version]
- Taleghani, M.; Kleerekoper, L.; Tenpierik, M.; Van Den Dobbelsteen, A. Outdoor thermal comfort within five different urban forms in the Netherlands. Build. Environ. 2015, 83, 65–78. [Google Scholar] [CrossRef]
- Monteith, J.L.; Unsworth, M.H. Principles of Environmental Physics; Academic Press: Cambridge, MA, USA, 2013; ISBN 9780123869104. [Google Scholar]
- Schütz, K.E.; Rogers, A.R.; Cox, N.R.; Tucker, C.B. Dairy cows prefer shade that offers greater protection against solar radiation in summer: Shade use, behaviour, and body temperature. Appl. Anim. Behav. Sci. 2009, 116, 28–34. [Google Scholar] [CrossRef]
- Liebmann, B.; Smith, C.A. LiebmannandSmith1996.pdf. Bull. Am. Meteorol. Soc. 1996, 77, 1275–1277. [Google Scholar]
- Devadas, M.D.; A, L.R. Urban Factors and the Intensity of Heat Island in the City of Chennai. In Proceedings of the Seventh International Conference on Urban Climate, Yokohama, Japan, 29 June–3 July 2009. [Google Scholar]
- Nunez, M.; Oke, T.R. Long-wave radiative flux divergence and nocturnal cooling of the urban atmosphere—II: Within an urban canyon. Boundary-Layer Meteorol. 1976, 10, 121–135. [Google Scholar] [CrossRef]
- Akbari, H. Shade trees reduce building energy use and CO2 emissions from power plants. Environ. Pollut. 2002, 116, 119–126. [Google Scholar] [CrossRef]
- Wang, Y.; Akbari, H. The effects of street tree planting on Urban Heat Island mitigation in Montreal. Sustain. Cities Soc. 2016, 27, 122–128. [Google Scholar] [CrossRef]
- Murakami, A.; Hoyano, A. Study on urban heat island phenomenon in a local small city of Japan using airborne themal image. Int. Geosci. Remote Sens. Symp. 2008, 3, III-1354–III-1357. [Google Scholar] [CrossRef]
- Pretzsch, H. Canopy space filling and tree crown morphology in mixed-species stands compared with monocultures. For. Ecol. Manag. 2014, 327, 251–264. [Google Scholar] [CrossRef] [Green Version]
- Berry, R.; Livesley, S.J.; Aye, L. Tree canopy shade impacts on solar irradiance received by building walls and their surface temperature. Build. Environ. 2013, 69, 91–100. [Google Scholar] [CrossRef]
- Vallati, A.; Mauri, L.; Colucci, C.; Ocłoń, P. Effects of radiative exchange in an urban canyon on building surfaces’ loads and temperatures. Energy Build. 2017, 149, 260–271. [Google Scholar] [CrossRef]
Figure 1.
Observation instruments: (a) mobile net radiometer instruments kit design, (b) anemometer, (c) thermometer (revised Park’s 2018), and (d) bi-directional radiation sensors.
Figure 1.
Observation instruments: (a) mobile net radiometer instruments kit design, (b) anemometer, (c) thermometer (revised Park’s 2018), and (d) bi-directional radiation sensors.

Figure 2.
Survey sites: A. Apguqjeong, Gangnam; B. Shinlim, Gwanak; and C. Mujigae, Seocho, Seoul, Korea.
Figure 2.
Survey sites: A. Apguqjeong, Gangnam; B. Shinlim, Gwanak; and C. Mujigae, Seocho, Seoul, Korea.

Figure 3.
Net longwave radiation shifts in areas A1, A2, B1, and B2.

Figure 4.
Net longwave radiation shifts at C4, C5, C6, and C7.

Figure 5.
MRT over time corresponding to tree type: C4 (Shrub), C5 (Tree 260 m), C6 (Tree + shrub), and C7 (Tree 500 m).
Figure 5.
MRT over time corresponding to tree type: C4 (Shrub), C5 (Tree 260 m), C6 (Tree + shrub), and C7 (Tree 500 m).

Figure 6.
(a) Net longwave radiation, and (b) net longwave radiation in the presence of trees (C1: open space; C2: open space surrounded by trees; C3: building; C5: building + tree; C4: shrubs; C5: trees; C6: trees and shrubs; C7: tall trees and shrubs; net longwave radiation = (ILR − OLR) (unit: W/m2).

Table 1.
Building and tree existence of each site (O: present; X: not present) Appendix.
| Type | A1 | A2 | B1 | B2 | C1 | C2 | C3 | C4 | C5 | C6 | C7 |
|---|---|---|---|---|---|---|---|---|---|---|---|
| Building | O | O | O | O | X | X | O | O | O | O | O |
| Tree | O | X | O | X | X | O | X | O | O | O | O |
Table 2.
Radiation measurements (W/m2).
| Open (C1) | Open with Trees (C2) | Building (C3) | Building & Tree (C5) | |||||
|---|---|---|---|---|---|---|---|---|
| Time | ILR | OLR | ADEVILR | ADEVOLR | ADEVILR | ADEVOLR | ADEVILR | ADEVOLR |
| 14:00 | 451.7 | 546.5 | 0.6 | 10.3 | 29.7 | 65.7 | 18.1 | 51 |
| 16:00 | 443.6 | 519.6 | 4.3 | 20.9 | 26.8 | 45.7 | 23.5 | 31.0 |
| 18:00 | 442.4 | 496.0 | 7.8 | 6.5 | 29.3 | 30.3 | 13.3 | 20.9 |
| 20:00 | 435.3 | 471.9 | 7.6 | 6.2 | 26.1 | 14.9 | 14.7 | 3.7 |
| average | 443.2 | 508.5 | 5.1 | 11.0 | 28.0 | 39.2 | 17.4 | 26.6 |
Table 3.
Comparison of ILR and OLR on the tree and building spot (W/m2).
| A1 | A2 | B1 | B2 | |||||
|---|---|---|---|---|---|---|---|---|
| Time | ILR | OLR | ILR | OLR | ILR | OLR | ILR | OLR |
| 14:00 | 476.1 | 473.6 | 457.0 | 465.4 | 433.9 | 468.3 | 429.4 | 479.3 |
| 16:00 | 472.2 | 471.3 | 450.8 | 455.5 | 427.3 | 461.0 | 410.6 | 474.6 |
| 18:00 | 460.4 | 462.2 | 441.5 | 446.5 | 424.0 | 428.1 | 422.2 | 470.6 |
| 20:00 | 452.6 | 456.6 | 433.4 | 441.2 | 421.6 | 460.7 | 386.5 | 468.6 |
Table 4.
Comparison of ADEVILR and ADEVOLR in areas with four types of tree coverage (W/m2).
| Building (C3) | Shrub (C4) | Tree 260 (C5) | Tree + shrub (C6) | Tree 500 (C7) | ||||||
|---|---|---|---|---|---|---|---|---|---|---|
| Time | ILR | OLR | ADEVILR | ADEVOLR | ADEVILR | ADEVOLR | ADEVILR | ADEVOLR | ADEVILR | ADEVOLR |
| 14:00 | 481.4 | 480.8 | 1.3 | 36.0 | 11.6 | 14.7 | 8.6 | 34.6 | 10.9 | 1.7 |
| 16:00 | 470.3 | 473.9 | 9.1 | 24.9 | 3.3 | 14.8 | 9.3 | 27.1 | 0.7 | 3.0 |
| 18:00 | 471.7 | 465.6 | 3.0 | 14.9 | 16.0 | 9.4 | 14.5 | 26.7 | 10.8 | 3.1 |
| 20:00 | 461.3 | 457.0 | 4.7 | 11.0 | 11.4 | 11.2 | 20.2 | 16.4 | 6.4 | 2.8 |
| average | 471.2 | 469.3 | 4.5 | 21.7 | 10.5 | 12.5 | 13.2 | 26.2 | 7.2 | 2.7 |
Table 5.
Mean MRT corresponding to tree type (unit: °C).
| Time | Shrub (C4) | Tree 260 (C5) | Tree + Shrub (C6) | Tree 500 (C7) |
|---|---|---|---|---|
| 14:00 | 36.4 | 33.8 | 32.8 | 29.4 |
| 16:00 | 33.3 | 31.9 | 32.2 | 29.1 |
| 18:00 | 31.7 | 29.8 | 30.4 | 28.1 |
| 20:00 | 29.9 | 28.7 | 29.3 | 25.4 |
| Average | 32.8 | 31.0 | 31.2 | 28.0 |
© 2019 by the authors. Licensee MDPI, Basel, Switzerland. This article is an open access article distributed under the terms and conditions of the Creative Commons Attribution (CC BY) license (http://creativecommons.org/licenses/by/4.0/).
Share and Cite
MDPI and ACS Style
Kwon, Y.J.; Lee, D.K. Thermal Comfort and Longwave Radiation over Time in Urban Residential Complexes. Sustainability 2019, 11, 2251. https://0-doi-org.brum.beds.ac.uk/10.3390/su11082251
AMA Style
Kwon YJ, Lee DK. Thermal Comfort and Longwave Radiation over Time in Urban Residential Complexes. Sustainability. 2019; 11(8):2251. https://0-doi-org.brum.beds.ac.uk/10.3390/su11082251
Chicago/Turabian StyleKwon, You Jin, and Dong Kun Lee. 2019. "Thermal Comfort and Longwave Radiation over Time in Urban Residential Complexes" Sustainability 11, no. 8: 2251. https://0-doi-org.brum.beds.ac.uk/10.3390/su11082251
Note that from the first issue of 2016, this journal uses article numbers instead of page numbers. See further details here.