Dynamic Assessment of Environmental Efficiency in Chinese Industry: A Multiple DEA Model with a Gini Criterion Approach


1
School of Economics and Trade, Hunan University, Changsha 410079, China
2
School of Economics, Southwestern University of Finance and Economics, Chengdu 611130, China
3
School of Applied Economics, Renmin University of China, Beijing 100872, China
*
Author to whom correspondence should be addressed.
Sustainability 2019, 11(8), 2294; https://0-doi-org.brum.beds.ac.uk/10.3390/su11082294
Submission received: 7 March 2019
/
Revised: 11 April 2019
/
Accepted: 15 April 2019
/
Published: 17 April 2019
Abstract
:While China’s rapid industrialization has brought great pressure on environmental pollution, great variations appear in terms of environmental pollution levels among industries. The effective assessment of the environmental performance of different industries is not only conducive to identifying the major sources of pollution in China but also of great significance to the Chinese government in formulating differentiated industry environmental control policies in a targeted manner. Using data of 36 Chinese industries from 2006 to 2015 and a multiple data envelopment analysis (DEA) with a Gini criterion as well as a systematic clustering approach, this study first calculates the environmental efficiency score of Chinese industries and then identifies those pollution sources based on a ranking and clustering analysis. The main result indicates that the ranking of environmental efficiency of various industries overall varies greatly by time. In addition, using a clustering analysis, this study finds that 13 labor-intensive light industries and heavy chemical industries with high energy use and high emissions are medium- and high-pollution industries. Important policy implications are drawn to achieve green industrial development.
1. Introduction
In recent years, environmental degradation has become one of the important factors hindering the sustainable development of China’s economy. Since the emission of environmental pollutants mainly comes from the industries, many scholars have taken the environmental efficiency evaluation of China’s industries as an important research direction and obtained abundant research results. However, most of these studies examine the environmental efficiency of China’s industrial sector at the regional level, and few studies examine this issue from the industry perspective. These studies have also neglected the fact that the internal environmental efficiency across the industries shows substantial differences, a fact which no doubt restricts Chinese industries’ efforts to promote the efficiency of their overall environmental impact because of industry heterogeneity. On the other hand, due to increasing environmental regulation in China during a period of economic transformation, the pollution safe haven effect has led China, which was once a safe haven for developed countries, to transfer pollution-intensive industries to other developing countries. China’s domestic industrial transfer has a tendency to shift high-polluting industries from the east to the west [1]. This intensification of the trend has put pressure on China’s economic growth, and the transfer of industries is closely related to their environmental efficiency and regional environment policy. Therefore, an industry-level analysis will help identify the pollution sources of the industrial sector, which will provide an important reference for the Chinese government to formulate more differentiated industry policies.
In the 2009 Copenhagen Accord, China made a commitment to slash its carbon dioxide emissions per unit of GDP (i.e., carbon intensity) by 40–50% from the 2005 level by 2020. China updated its goal under the Paris Accord as ‘reducing its carbon intensity by 60–65% from the 2005 level by 2030, peaking its carbon emissions by 2030, and increasing non-fossil fuel energy to 20% of its energy mix.’ In order to achieve these goals, several official documents were released. These include: (1) China’s 13th Five-Year Plan on National Economic and Social Development, released by the State Council in 2016; (2) A Comprehensive 13th Five-Year Plan on Energy Conservation and Emission Reductions and A Comprehensive 13th Five-Year Plan on Controlling Greenhouse Gas Emissions, released together by the National Development and Reform Commission (NDRC) and the National Energy Bureau; (3) Plan on First National Pollution Sources Census (‘the Census’ hereafter) released by the State Council in 2007. The Census proposed to consider waste water, waste gas, and industrial solid wastes as the main industrial pollution sources; it also proposed to treat the following industrial activity units as 2007 key pollution sources: (1) All industrial activity units with heavy metal, hazardous waste, or radioactive emissions; (2) all industrial activity units among 11 heavy pollution industries; (3) above-scale industries among 16 key industries. Though this document defines industrial pollution sources, the Census merely provides a subjective judgement of industrial pollution sources; it lacks any accurate assessment by scientific methods. Accompanied by more attention to environmental issues, methods of efficiency evaluation have been widely used in the field of environment and economy, among which data envelopment analysis (DEA) is the one most widely used.
Since data envelopment analysis (DEA) was first proposed by Charnes and Cooper [2] as a non-parametric mathematical programming method, it has been shown to have advantages, such as that it allows the use of multiple inputs/outputs under constant return to scale to evaluate the relative efficiency of decision making units (DMUs) and that the weights (multipliers) for each decision unit’s inputs and outputs are not affected by subjective factors or by the dimensions (units of measure) of inputs and outputs. A variety of DEA extension models such as the BCC (named after Banker, Charnes, and Cooper) model [3], the SBM (slack-based measure) [4], the additive DEA model [5] and the super-efficiency model [6] have been proposed for efficiency evaluation. However, these models are all based on one particular perspective, which may render evaluation results risky, uncertain, and incomprehensive [7]. Therefore, it is of great significance to propose a new method of efficiency evaluation by combining multiple DEA models in some way, recognizing that, in the classification and regression trees [8], the Gini criterion can be used to measure the information impurity (namely uncertainty) presented in the model and assign a corresponding weight to a given model. Thus, multiple DEA models combined together under the Gini criterion will undoubtedly mitigate the uncertainty originated from estimating a single model.
Hence, the purpose of this study is twofold. Firstly, it attempts to calculate the environmental efficiency scores of 36 industries in China for the 2006–2015 period by using a multiple DEA model with the Gini criterion approach. Secondly, it aims at identifying the pollution sources and exploring their dynamics in the study period based on a ranking and clustering analysis. We argue that the second purpose is particularly important, as the environmental efficiency of each industry will change dramatically with time (due to technological improvement, environmental regulation, etc.), as will the pollution sources. However, the pollution sources identified by the Census are based only on the industrial development in 2007 and are time-invariant, which apparently fails to truly reflect the current status quo of industrial pollution; as a result, China’s current industrial development policies based on these time-invariant pollution sources can be misleading.
This study contributes to the existing literature in several respects. First, we combine different DEA models using a Gini criterion to measure environmental efficiency—such a method has not been seen before in environmental efficiency evaluation literature. Second, existing studies consider only labour, energy input, and economic output variables when measuring the environmental efficiency, only to ignore other important variables such as non-energy inputs and undesirable outputs. In this study, all key variables are considered as much as possible. Third, most studies of environmental efficiency in China to date have focused mainly on a state-level, region-level, or city-level, rather than an industry-level, analysis. This study may thus enrich our understanding of the environmental performance of Chinese industries over time and help government formulate and implement more targeted policies.
The rest of the paper is structured as follows. Section 2 reviews relevant studies. Section 3 describes the DEA model, the multiple DEA model with a Gini criterion and clustering analysis. Section 4 provides some background information on China’s industry, as well as the index system and data sources used for the empirical analysis. Section 5 reports the empirical results. The final section summarizes the main findings and draws some relevant policy implications.
2. Literature Review
Environmental efficiency, as an important indicator of environmental quality, is frequently used by scholars to assess environmental performance. It was originally introduced by the World Business Council for Sustainable Development (WBCSD) in the 1992 Rio Summit as the ratio of product (or service) value to environment load. Since then, many methods have been put forward to measure environmental efficiency. These mainly include: Life cycle assessment (LCA) [9,10], stochastic frontier analysis (SFA) [11,12], the input-output table method [13], the computable general equilibrium (CGE) method [14], and data envelopment analysis (DEA). Relatively speaking, while CGE and input-output table methods are not frequently used to evaluate environmental efficiency, the LCA, SFA, and DEA methods are. All three methods have their pros and cons. For instance, the LCA method is subject to some methodological drawbacks, mainly problems with inconsistencies in LCA results for the same situation under different assumptions and issues related to data quality [15]. The SFA model is limited to only one single output and subject to strong assumptions on the production frontier specification, both of which can affect the measurement of environmental efficiency. In contrast, DEA can take into account multiple-output productions of decision units and use linear (non-parametric) programming technology to measure efficiency. Thus, a large number of scholars use this method to evaluate environmental and energy efficiency.
The DEA model for evaluating environmental efficiency was formally proposed by Färe et al. [16], who inspired a stirring of interest in studies of environmental efficiency with the DEA model. At first, most scholars used the single-factor energy efficiency index to measure environmental efficiency including only energy as an input, but Hu and Wang [17] argued that energy alone cannot produce just any economic output: Other inputs must be put together with energy in model evaluation. Consequently, they introduced the index of total-factor energy efficiency (TFEE) and used it to measure the energy efficiency of China’s 29 administrative regions during 1995–2002. They found that there was a U-shaped relationship between TFEE and per capita income. Xie et al. [18] argued that these methods only considered the economic output and ignored the undesirable output of environmental pollutants, resulting in inaccurate efficiency measurement. In their study examining the environmental total factor productivity (TFP) index of electric power industries in 26 OECD (Organization for Economic Cooperation and Development) and BRIC (Brazil, Russia, India and China) countries from 1996 to 2010, they applied the slack-based measure DEA (SBM-DEA) model, which accounts for undesirable output, as well as the Tobit regression model, and they found that the fuel structure change and technological progress are the main driving forces to enhance the environmental efficiency.
Besides the models mentioned above, it can be noted that other related models have been used to evaluate environmental performance. For instance, Al-refaie et al. [19] combined DEA window technology and the Malmquist index to analyse the energy efficiency and productivity of Jordan’s industrial sector. Liu et al. [20] and Han et al. [21] introduced undesirable output with ranking priority and information entropy, respectively, to refine the DEA cross-efficiency model proposed by Geng et al. [22] and then used the improved model to evaluate the ecological efficiency of thermal power plants and the carbon emission efficiency of China’s industrial sectors. Song et al. [23] proposed a slack-based endogenous directional distance function model (SREDDF) when assessing the environmental efficiency of China’s power industry. They found that the overall environmental efficiency of China’s power industry is low, suggesting that different regions exhibit different patterns of reductions. Combining the economic input-output life cycle assessment (EIO-LCA) and data envelopment analysis (DEA) methods to assess the environmental and economic efficiency of 26 industries in China, Xing et al. [24] showed that more than 70% of the industry is less efficient, with the electricity production and supply sector being the largest energy use and CO2 emissions industry.
Clearly, DEA models have been widely used in the environmental efficiency literature. As far as China is concerned, most studies using such models to evaluate China’s environmental performance focus mainly on the regional level. For instance, Zhang et al. [25] evaluated the (dynamic) low-carbon economic efficiencies of 30 provinces in mainland China from 2005 to 2012 by using a super-efficient SBM model with undesirable outputs and the Malmquist productivity index. Their main finding was that China’s overall low-carbon economic efficiency is low, and the regional efficiency differences are substantial. Using a meta-frontier DEA approach to analyse the total factor energy efficiency in China’s provincial industrial sectors for the 2000–2014 period, Feng and Wang [26] found that total factor energy efficiency and energy-saving potential efficiency are low in general, and the sources of energy inefficiency and potential energy savings in China’s industrial sectors are spatially distinct. Lv et al. [27] used the SBM model while incorporating learning effects to evaluate the different impacts of learning effects on the efficiency of sulphur dioxide, soot, and dust in the Eastern and Western regions of China. The results show that most regions of China have a greater potential for energy conservation and emission reductions, and the learning effect has a greater effect on sulphur dioxide emission reduction than on soot and dust. Wang et al. [28] used a DEA window analysis technique, accounting for both desirable and undesirable outputs as well as energy and non-energy inputs, to measure the energy and environmental efficiency of 29 administrative regions of China during 2000–2008. They found that the energy and environmental efficiency is highest in East China and worst in the West. Wu et al. [29] calculated the output efficiency of seven input indicators in 29 provinces in China using an improved model of DEA, incorporating one undesirable output and seven inputs. They found that only Beijing, Tianjin, and Shanghai are optimal in input-output efficiency. Wang et al. [30] accounted for industrial heterogeneity in the region using a meta-frontier Malmquist index analysis method combined with a three-level common frontier model to estimate the CO2 emissions efficiency and dynamics of China’s industries and regions in 2010–2015. They found that the Eastern region has the highest emission efficiency, and the tertiary industry has higher emission efficiency than the primary industry and the secondary industry. Yang and Wei [31] used the game cross-efficiency DEA model to study the urban total factor energy efficiency of China’s 26 inter-provincial cities from 2005 to 2015, and they concluded that the city scale and economic development can improve the energy efficiency of city, while the investment and endowment will lower the urban energy efficiency.
Turning to China’s industries, studies assessing environmental performance from the industry level are relatively rare, and the empirical results are mixed. On the one hand, some scholars have concluded that, in general, the environmental performance of China’s industrial sector shows an upward trend. Yu et al. [32] examined the economic and potential environmental gains from the command-and-control and carbon emissions trading mechanisms for the 38 industries in China during 2006–2014. The empirical results showed that the carbon emission of some industries increases and is accompanied by an improvement in economic efficiency, but the overall carbon emission of industries decreases. On the other hand, other scholars have found that the environmental performance of China’s industries is far from satisfactory and remains to be improved to a great extent. For instance, Chen and Golley [33] estimated the green total factor productivity growth of 38 industries in China from 1980 to 2010 by a directional distance function (DDF) and the Malmquist-Luenberger productivity index technique, and their results showed that China’s industries had not yet embarked on the road to achieving sustainable low-carbon growth. Wu et al. [34] divided 38 industries into four categories through cluster analysis and used a DEA model with non-homogeneous inputs and outputs to evaluate the energy and environmental efficiencies of 38 industries in China’s industry from 2007 to 2011. The results showed that the energy and environmental efficiency of China’s industry is generally low, the variation is large, and the efficiency has increased in five years. The clustering results showed that more than 60% of the industries belong to the inefficiency category, and only two industries belong to the highest efficiency category. It should be mentioned that when examining the environmental efficiency of China’s industrial industry, their analysis focused mainly on the theoretical part (DEA expansion model) instead of the applied part. In other words, the time horizon of their study was relatively short and old (2007–2011), and their selection indicators were not comprehensive.
To sum up, there have been emerging studies on the evaluation of industrial environmental performance, and these studies have made great progress. However, these studies focus on a more aggregated level such as national, state, or regional; rarely seen is an industry-level analysis. In addition, most studies only evaluate environmental efficiency from a certain perspective. Few have analysed environmental efficiency comprehensively from multiple perspectives when applying DEA models. This study aims to fill these gaps.
3. Empirical Models
This section first introduces four commonly used DEA models that are selected to measure the environmental efficiency of China’s industries, then chooses a Gini criterion to combine these four measurement results to obtain a comprehensive efficiency score for each industry, and finally analyses the efficiency differences and changing patterns of industries using a clustering analysis.
3.1. A Multiple DEA with Gini Criterion Model
Data envelopment analysis is a linear programming–based technique for measuring the relative efficiency of decision-making units (DMUs). This method was originally proposed by Charnes et al. [2] and has been widely used in many disciplines. The first and fundamental model is the CCR model (named after its developers Charnes, Cooper, and Rhodes), which considers multiple inputs that DMUs consume and multiple outputs that they produce under the assumption that they are in a state of constant returns to scale. In particular, assuming that there are J DMUs (j = 1, 2,…, J), M inputs xm,j,0 (m = 1, 2,…, M), and S outputs ys,j,0 (s = 1, 2,…, S), then the CCR model is formulated as the following problem:
where vi and ur are the input and the output weight vector, respectively. The constraint indicates that the ratio of “virtual output” to “virtual input” should not exceed 1 for each DMU. The objective is to obtain the input weights vi and the output weights ur that maximize the ratio of DMUs. Under this constraint, the optimal solution obtained θ = θ*, which is up to 1. If there is at least one set of optimal weight vectors (vi, ur) satisfying v* > 0 and u* > 0, then the CCR is said to be valid. Otherwise, the DMU is invalid.
The basic CCR model has two models: Input-oriented (Equation (1)) and output-oriented. Both models are evaluated for efficiency under the assumption of constant returns-to-scale, and the efficiency values are generally the same. Based on the CCR model, many improved DEA models are extended. The most commonly used ones are the BCC model, with variable returns-to-scale, and the slacks-based measure (SBM) model. Different models measure efficiency from different angles and have their own shortcomings. However, most scholars rely on one particular model or perspective in efficiency evaluation. To avoid the biasedness and uncertainty of evaluating performance using a particular DEA model, Soleimani-damaneh and Zarepisheh [35] used an analytical hierarchy process (AHP) technique [36] to select five DEA models and Shannon entropy theory [37] to measure their uncertainty. They then combined the efficiency results of several different DEA models to obtain a more realistic ranking. However, in their study, the difference of allocated weights by entropy theory to different DEA models was too large (the minimum weight was 0.02571 and the maximum weight was 0.48725), which could affect the empirical results. To reduce the uncertainty of performance evaluation based on a given DEA and improve the discriminative power, this study follows Xue et al. [38] to combine a Gini criterion with several DEA models (i.e., multiple DEA-Gini criterion models).
In general, the evaluation of the multiple DEA-Gini criterion model is mainly divided into two parts. First, several DEA models are selected to measure the environmental efficiency values of the Chinese industrial industry. Assuming that there are k DEA models and j DMUs, hence, Ejk indicates the efficiency score of the j-th DMU obtained from the k-th model. Second, after obtaining all the efficiency scores, a unique set of overall efficiency is obtained in three steps based on the Gini criterion. In the first step, the Gini criterion measures the information complexity (i.e., uncertainty) by the Gini coefficient (G), defined as G = 1 − Σpj2, where pj = Ej/ΣEj. In general, the larger the Gini coefficient, the smaller the information purity d = Σpj2, i.e., the greater the information heterogeneity, the greater the uncertainty; in the second step, according to the uncertainty size, the corresponding weight Wk = dk/Σdk is given to each DEA model. Generally, when the variation of a set of efficiency results from a particular DEA model is smaller (larger), it implies that the model has a larger (smaller) uncertainty in evaluation, and then a lower (higher) weight will be assigned to that DEA model. Eventually, after assigning the corresponding weights to each DEA model, a unique set of more objective and realistic industrial environmental pollution level assessment results, i.e., overall efficiency, can be calculated by θj = ΣWkEjk.
This study aims to use the multiple DEA model with a Gini criterion model to evaluate the environmental performance of 36 industries in China from 2001 to 2015. It is well known that DEA models can be generally divided into four types—namely, radial and output-oriented, radial and input-oriented, radial and non-oriented, or non-radial and non-oriented—but given that fact that constant returns-to-scale are often inconsistent with the reality and that the super-efficiency DEA model can be more efficient in ranking DMUs than traditional DEA models [6], this study used two radial DEA models (input- and output-oriented super-efficiency BCC models) and two non-radial DEA models (output-oriented super-efficiency SBM model and super-efficiency additive SBM model) with variable returns-to-scale. DEA Solver Pro 5.0 software (Saitech Inc., Holmdel, NJ, USA) was used to calculate the efficiency scores of these four DEA models. R software (Lucent Technologies Inc., Murray Hill, NJ, USA) was used to combine the environmental efficiency scores measured with different DEA models by the Gini criterion to obtain the overall environmental efficiency score for each industry.
3.2. Cluster Analysis Model
Clustering analysis is an effective statistical analysis technique which can divide research objects (which can be persons, firms, or countries) into homogeneous groups or clusters. After clustering, the objects in the same cluster usually have a lot of similarity, while the objects between different clusters have a greater difference.
At present, clustering analysis has been widely used in various fields including solving environmental problems [39]. Among them, the system clustering method is the best and most applied. The basic principle of the system clustering method is to gather the most similar objects according to the depth of closeness between cases or variables. The primary method of measuring the degree of closeness between data is to measure the distance between samples (Euclidean distance, squared Euclidean distance, Chebyshev distance, block distance, Minkowshi, and Cosine) and that between subclasses, subclasses, and subclasses (nearest neighbour, furthest neighbour, between-groups linkage, within-groups linkage, centroid clustering, median clustering, and Ward’s Method). The clustering methods mainly include hierarchical cluster analysis, k-means cluster, and two-step cluster. The algorithm for the hierarchical cluster has the following steps:
(i) Treat each object as an independent cluster (n).
(ii) Identify the two clusters with the lowest distance and merge them to one cluster, which reduces the number of clusters by 1.
(iii) Calculate the distance between the new cluster and all remaining clusters respectively.
(iv) Repeat (ii) and (iii) (n − 1) times until all objects form one remaining cluster or until certain termination conditions such as the desired number of clusters are satisfied.
Based on the efficiency score data obtained from the multiple DEA model with the Gini criterion as introduced in Section 3.1, this study used SPSS 24 software (IBM, Armonk, NY, USA) for hierarchical clustering analysis, where we chose the most widely used Ward’s clustering method or Gu et al. [40] to determine distances between samples or subclasses.
4. Data Sources
In order to comprehensively evaluate the environmental performance of China’s industries and also consider the availability of data, this study chose 36 non-agriculture industries in China as the study units for the 2006–2015 period, according to the classification of national economy industries (GB/T 4754-2017) issued and implemented by China’s National Bureau of Statistics in 2017 (see Appendix A Table A1). This study made the following three adjustments to the data: (1) Since a new industrial classification system for industry codes (GB/T 4754-2017) was adopted to replace the old one (GB/T 4754-2012), to keep industry classification consistent, the ‘Automobile Manufacturing’ industry and the ‘Railway, Shipbuilding, Aerospace, and Other Transportation Equipment Manufacturing’ industries were grouped into one classification as ‘Transportation Equipment Manufacturing’ industry; (2) the rubber products industry and the plastic products industry were grouped into the ‘Rubber and Plastic Products’ industry; (3) data from the four sub-sectors of ‘Ancillary Activities for Exploitation, Mining of Other Ores,’ ‘Other Manufactures,’ and ‘Recycling and Disposal of Waste’ are seriously missing. In order to ensure the integrity of data, these four industries were not selected as research objects. The data used in this study come from several official statistical yearbooks published yearly by China Statistical Press during 2006–2017 in China, namely, China Statistical Yearbook, China Energy Statistical Yearbook, China Labour Statistical Yearbook, China Science and Technology Statistical Yearbook and China Environmental Statistical Yearbook. However, some indicators in annual yearbooks are not consistent with each other, given the different statistical calibre. In order to ensure the integrity of data, study units from 2011 to 2015 are these enterprises with annual sales of RMB 5 million or above, and those from 2006–2010 are these medium- and large-scale enterprises.
Traditionally, the input indicators used to measure the efficiency of the industrial environment include labour, energy consumption, capital stock, and other indicators. The desirable output indicator is mainly gross industrial output value or industrial value added, while the undesirable output indicators include such indicators as waste gas, waste water, solid waste, and SO2 and CO2 emissions. Most indicators chosen by previous studies are not complete as they failed to account for all the indicators that can affect the efficiency of industrial environment. Hence, for empirical analysis, this study first established a systematic environmental evaluation index of China’s industries from the perspectives of input and output (Table 1). Some major input-output indicators and related data processing are described as follows:
(i) Desirable outputs. Most studies use gross industrial output value or industrial value added as a desirable output variable; however, the data for these two variables in recent yearbooks are not complete. As such, this study chose two variables: Industrial sales and industrial profit. These data were released by the National Bureau of Statistics.
(ii) Undesirable outputs. This study used eight kinds of pollutants. All emission data for these pollutants, except CO2, can be directly retrieved from the China Environmental Statistical Yearbook. As industrial emissions of smoke and dust are reported separately in the yearbooks during 2006–2010, we summed these two emissions together to keep statistical calibre consistent with those reported in subsequent yearbooks (2011–2015). In addition, there are no officially published data for industrial CO2 emissions. Following Zheng et al. [41] and Xu et al. [42], this study used energy consumption data for eight different sources of energy (namely crude oil, coal, natural gas, kerosene, gasoline, diesel oil, fuel oil, and coke), which allowed us to calculate the amount of CO2 emitted by various types of fuel using an internationally recognized method, i.e., that used by the Intergovernmental Panel on Climate Change (IPCC). The formula applied in estimating industrial CO2 emissions is prescribed by the 2006 IPCC Guidelines for National Greenhouse Gas Inventories [43] and is defined as
where CO2i represents industrial carbon dioxide emission from the i-th fuel type, C represents the total amount of fuel consumption, and CV is the calorific value of the fuel (say, measured in joules) which can be obtained from the China Energy Statistical Yearbook. EF is the carbon emission factor of the i-th fuel, which is provided by IPCC; OF is the carbon oxidation factor measuring how much of the carbon as a percentage in each fuel is oxidized into CO2 during combustion; and 44 and 12 are the molecular weights of CO2 and carbon, respectively. The carbon emission coefficient can be obtained by multiplying the four terms CV, EF, OF and (44/12) in Equation (2). Due to different measurement methods and different standards of carbon emission coefficient, carbon emission measurement results are inconsistent. Following Chen et al. (2018), this study uses the following number as the carbon emission factor for each fuel type: Crude oil (3.065), coal (1.978), natural gas (2.184), kerosene (3.097), gasoline (2.985), diesel oil (3.161), fuel oil (3.237), and coke (3.043). It is worth mentioning that, in the standard DEA model, the undesirable pollutants should be reduced to improve the inefficiency if inefficiency exists in the production. Nevertheless, decreases in outputs are not allowed and only inputs are allowed to decrease in the model, which cannot reflect the true production process. To deal with that issue, Seiford and Zhu [44] provided an alternative method, the linear monotone decreasing transformation, to model the production system, which allows for increasing desirable outputs and decreasing the undesirable outputs simultaneously. This study followed their method to process data of environmental pollution outputs.
CO2i = Ci × CVi × EFi × OFi × (44/12) (i = 1, 2,…, 8)
(iii) Labour force: This study considered the labour input from the quantity and quality of the labour force. As the statistical yearbooks do not provide the industry-level indicator of the education degree of the labour force, this study chose the number of science and technology personnel within each industry as a proxy for labour force quality, a number taken from the China Science and Technology of Statistical Yearbook. According to the yearbook, science and technology personnel are defined as those who are engaged directly in science and technology activities and those whose working hours account for 10% and above of their yearly working hours spent on managing science and technology activities and providing direct services for science and technology activities. It is worth mentioning that such data are not available after the 2009 yearbook; thus, this study uses the number of Research and Development personnel within each industry for the 2009–2015 period.
5. Empirical Results
5.1. Industrial Environmental Efficiency Scores
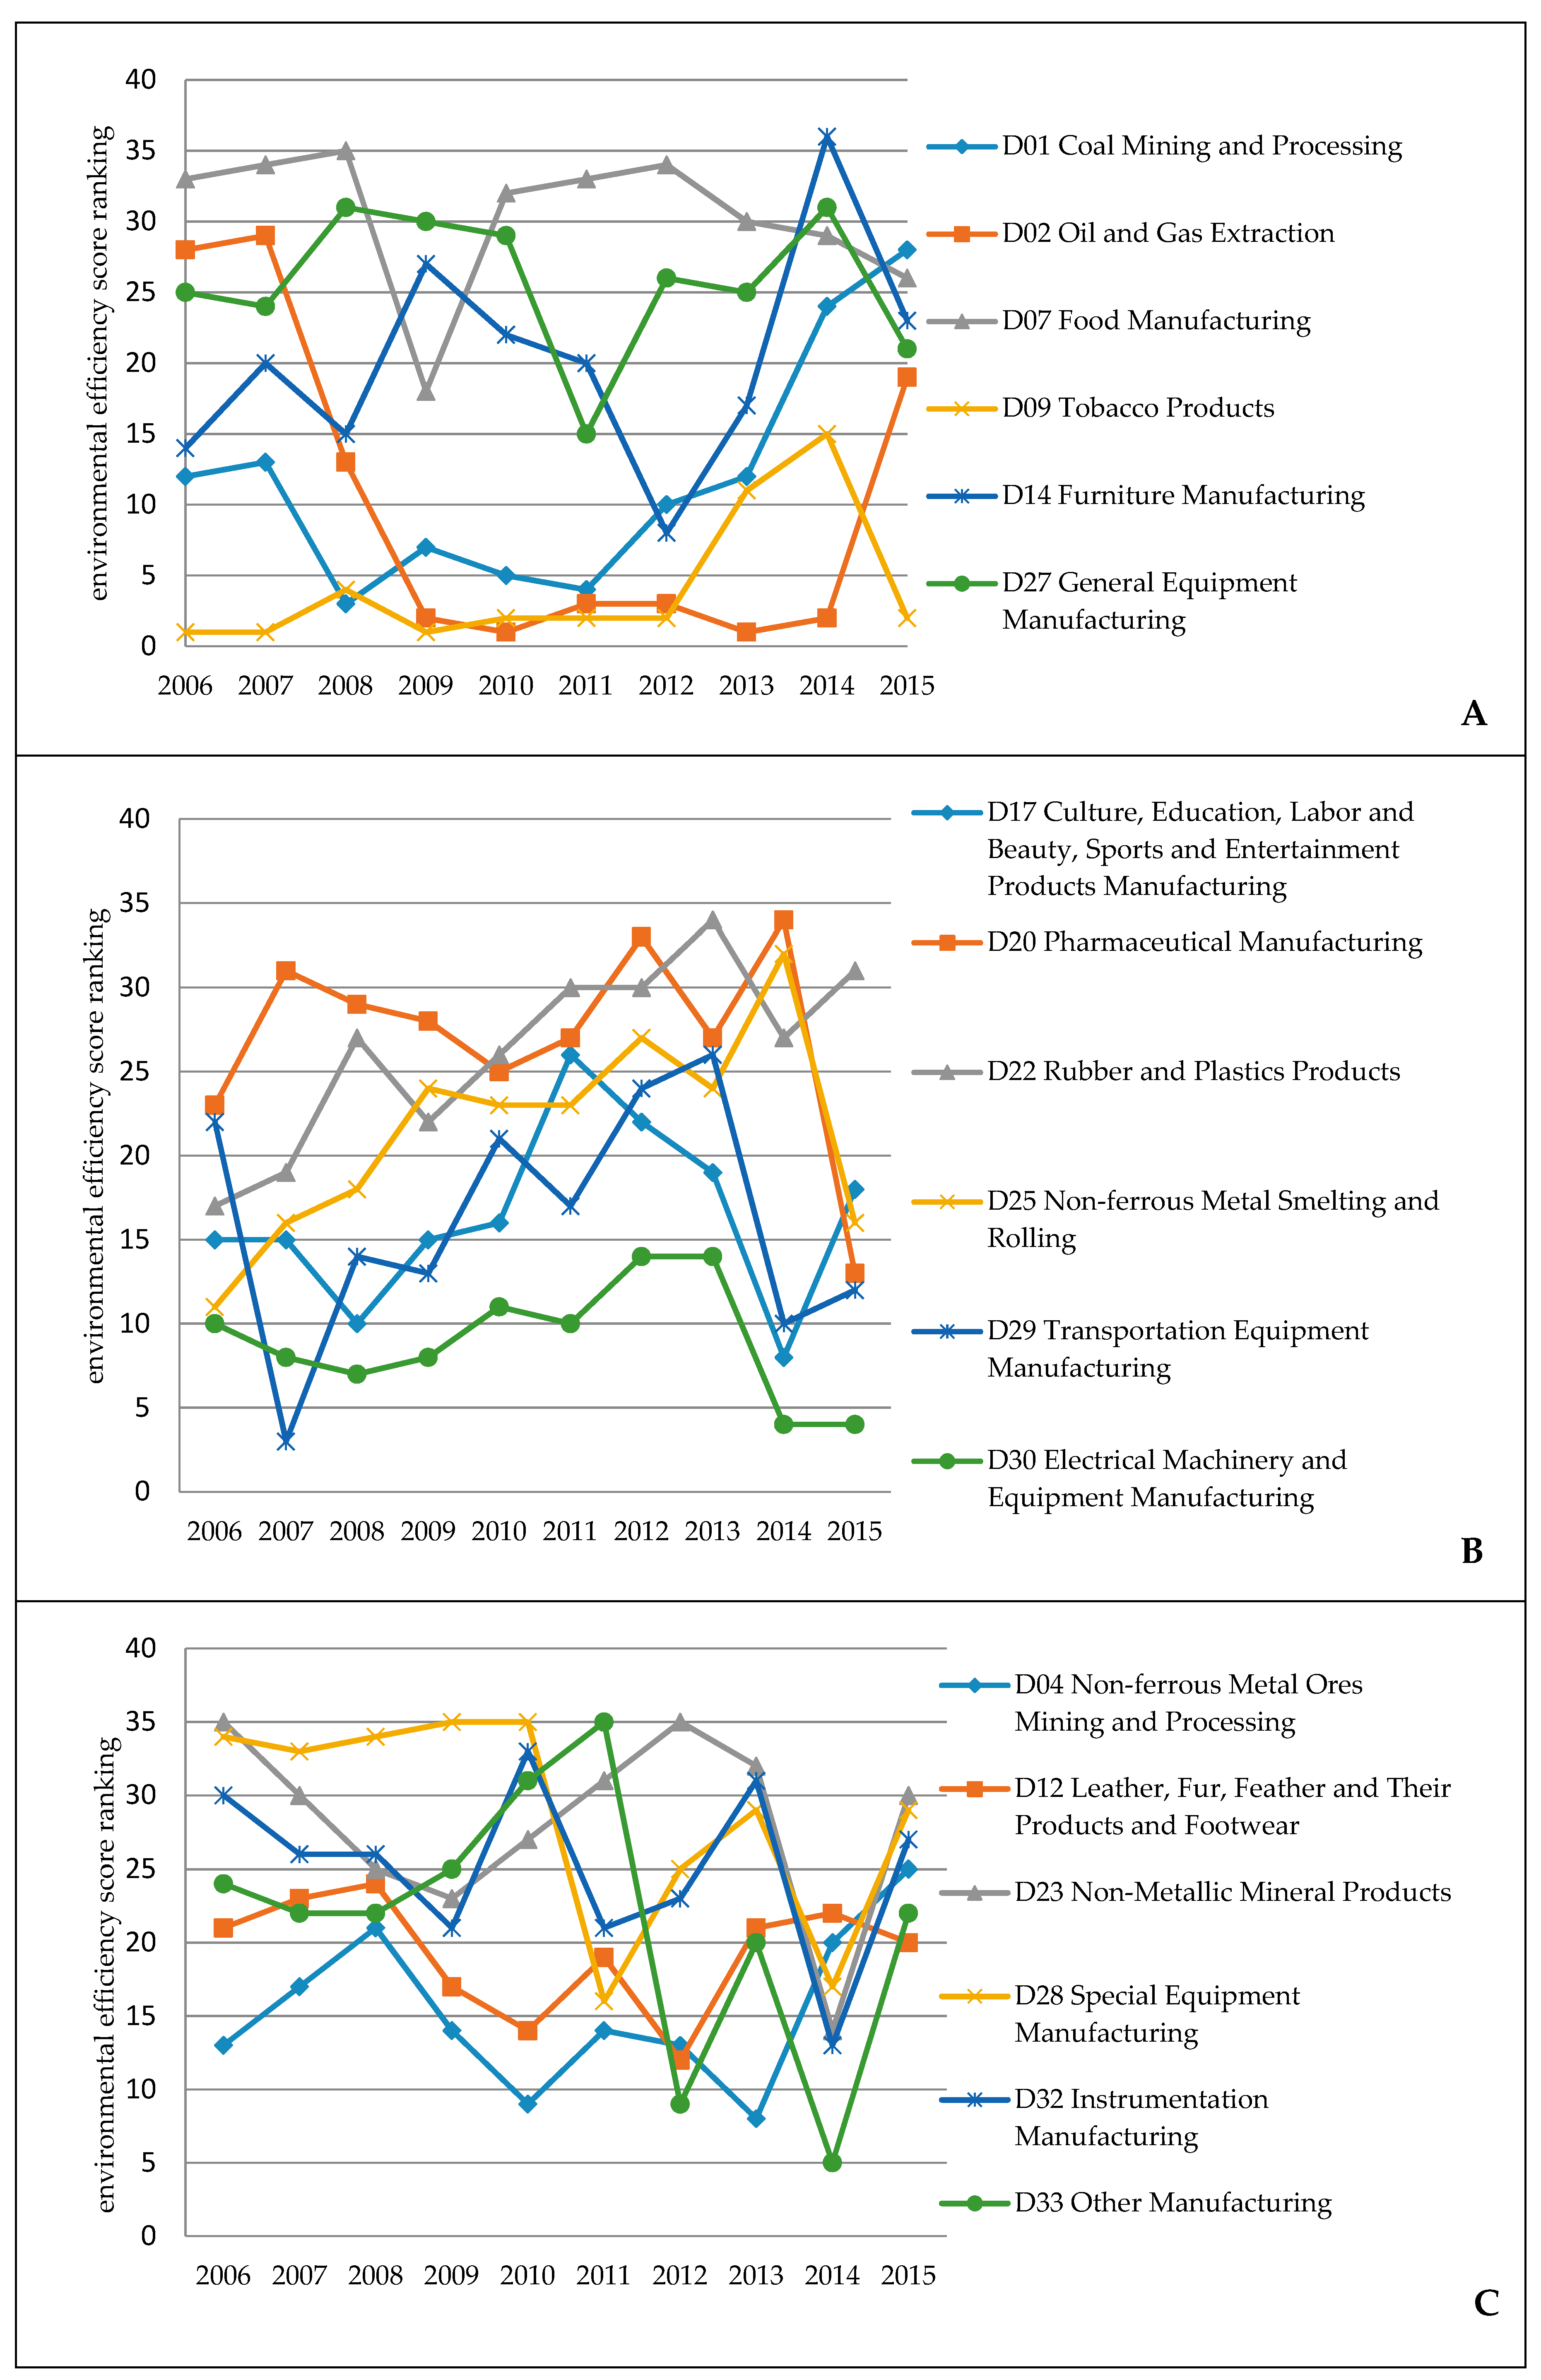
In this part, we report the estimated environmental efficiency scores of 36 industries from 2006 to 2015 by the multiple DEA model with a Gini criterion, and analyse the differences and changing patterns of the 36 industries by dividing them into six categories according to their changing patterns (Figure 1 and Figure 2). In general, the environmental efficiency scores for these 36 industries over the 2006–2015 period exhibit different changing patterns, which can be divided into six types: U-shaped curve, inverted U-shaped curve, W-shaped curve, growing-type, declining-type, and stable-fluctuating type.
Figure 1A shows the U-shaped patterns of six industries over time: Coal mining and processing (D01), oil and gas extraction (D02), food manufacturing (D07), tobacco products (D09), furniture manufacturing (D14), and general equipment manufacturing (D27). It can be seen that the food manufacturing (D07) ranks the worst in efficiency, with seven times of ranking after the 30th in the decade; the oil and gas extraction industry (D02) and tobacco products (D09) have maintained high environmental efficiency for a long time and are relatively stable. From the perspective of the time period covered in this study, the study period can be divided into two periods: One during the 11th Five-Year Plan period (2006–2010) and one during the 12th Five-Year Plan period (2011–2015). It can be observed that, overall, the level of environmental pollution for these six industries displays a downward sloping pattern during the period of the 11th Five-Year Plan and an upward-sloping pattern during the period of the 12th Five-Year Plan. The major turning points occurred in 2008–2009 and 2011–2012, when the environment efficiency and quality of the coal mining and processing (D01), oil and gas extraction (D02), and food manufacturing industries (D03) improved significantly in 2008; during 2011–2012, the environmental efficiency of coal mining and processing (D01), tobacco products (D09), furniture manufacturing (D14), and general equipment manufacturing (D27) decreased significantly, and the environmental status became relatively worse. One possible reason is that, during the 11th Five-Year Plan, China made remarkable progress because of its priority of developing its energy industry and encouraging its light industry to improve its manufacturing levels, whilst in the early stage of the 12th Five-Year Plan—in order to revive the national economy affected by the economic and financial crisis of 2008—China entered into a vital period of industrial restructuring and transformation and invested a large amount of money on the development of green technology upgrading and large-scale heavy industries. As a result, the development of the petrochemical industry and light industry was relatively weak.
Figure 1B shows the inverted U-shaped patterns of six industries from 2006 to 2015. From the perspective of the environmental efficiency score, the electrical machinery and equipment manufacturing industry (D30) has a high rank in China’s 12th Five-Year Plan period, and its environmental quality is better, while the environmental efficiency of the non-ferrous metal smelting and rolling processing (D25), culture, education, labour and beauty, sports and entertainment products manufacturing (D17), and transportation equipment manufacturing industries (D29) are at a moderate level. Both rubber and plastic products (D22) and pharmaceutical manufacturing (D20) rank low in environmental efficiency, and the environmental pollution is relatively serious. The rising stage of the inverted-U curve corresponds to the early stage of China’s “12th Five-Year Plan” when energy conservation and major energy-saving technologies were promoted vigorously in the petrochemical, nonferrous metals, machinery, light industry, and other industries. The environmental problems left over from the previous period and the time lag of initial policy implementation jointly contributed to the rise of environmental pollution levels, and the effectiveness of policy implementation appeared to be significant until in the mid-to-late period of the 12th Five-Year Plan, during which the environmental pollution levels in these industries showed a substantial decline. In particular, the pharmaceutical manufacturing industry (D17), whose efficiency level has been at a very low level, has rapidly ameliorated its efficiency since 2014, right after the 12th Five-Year Plan, among which one key reform is to deepen the reform of the medical and health system.
Figure 1C shows that the environmental efficiency rankings have undergone two sudden drops and rises, showing similar W-shaped patterns, for the following six industries: Non-ferrous metal ores mining and processing (D04), leather, fur, feather and their products and footwear (D12), non-metallic mineral products (D23), special-equipment manufacturing (D28), instrumentation manufacturing (D32), and other manufacturing industries (D33). Especially in the last five years, the fluctuation range of these rankings has been drastic and very unstable. Particularly, the non-ferrous metal ores mining and processing industry (D04) and leather, fur, feather and their products and footwear industry (D12) had a relatively high level of environmental efficiency after 2009, while special-equipment manufacturing (D28), instrumentation manufacturing (D32), and other manufacturing industries (D33) changed from relatively low efficiency to high efficiency in 2011. The nonferrous metal ores mining and processing industry (D04) has the highest efficiency of these six industries for most of the time (seven out of ten years). However, it is still at the medium level, which could be due to that the non-ferrous metal industry has long produced a large amount of wastewater containing pollutants, which is difficult to regulate thoroughly in a short time. Non-metallic Mineral products (D23) and special-equipment manufacturing (D28) were found to be the least efficient, ranking below 24th on eight occasions, which can be attributed to factors such as lack of independent innovation ability and the backward technology of the industry.
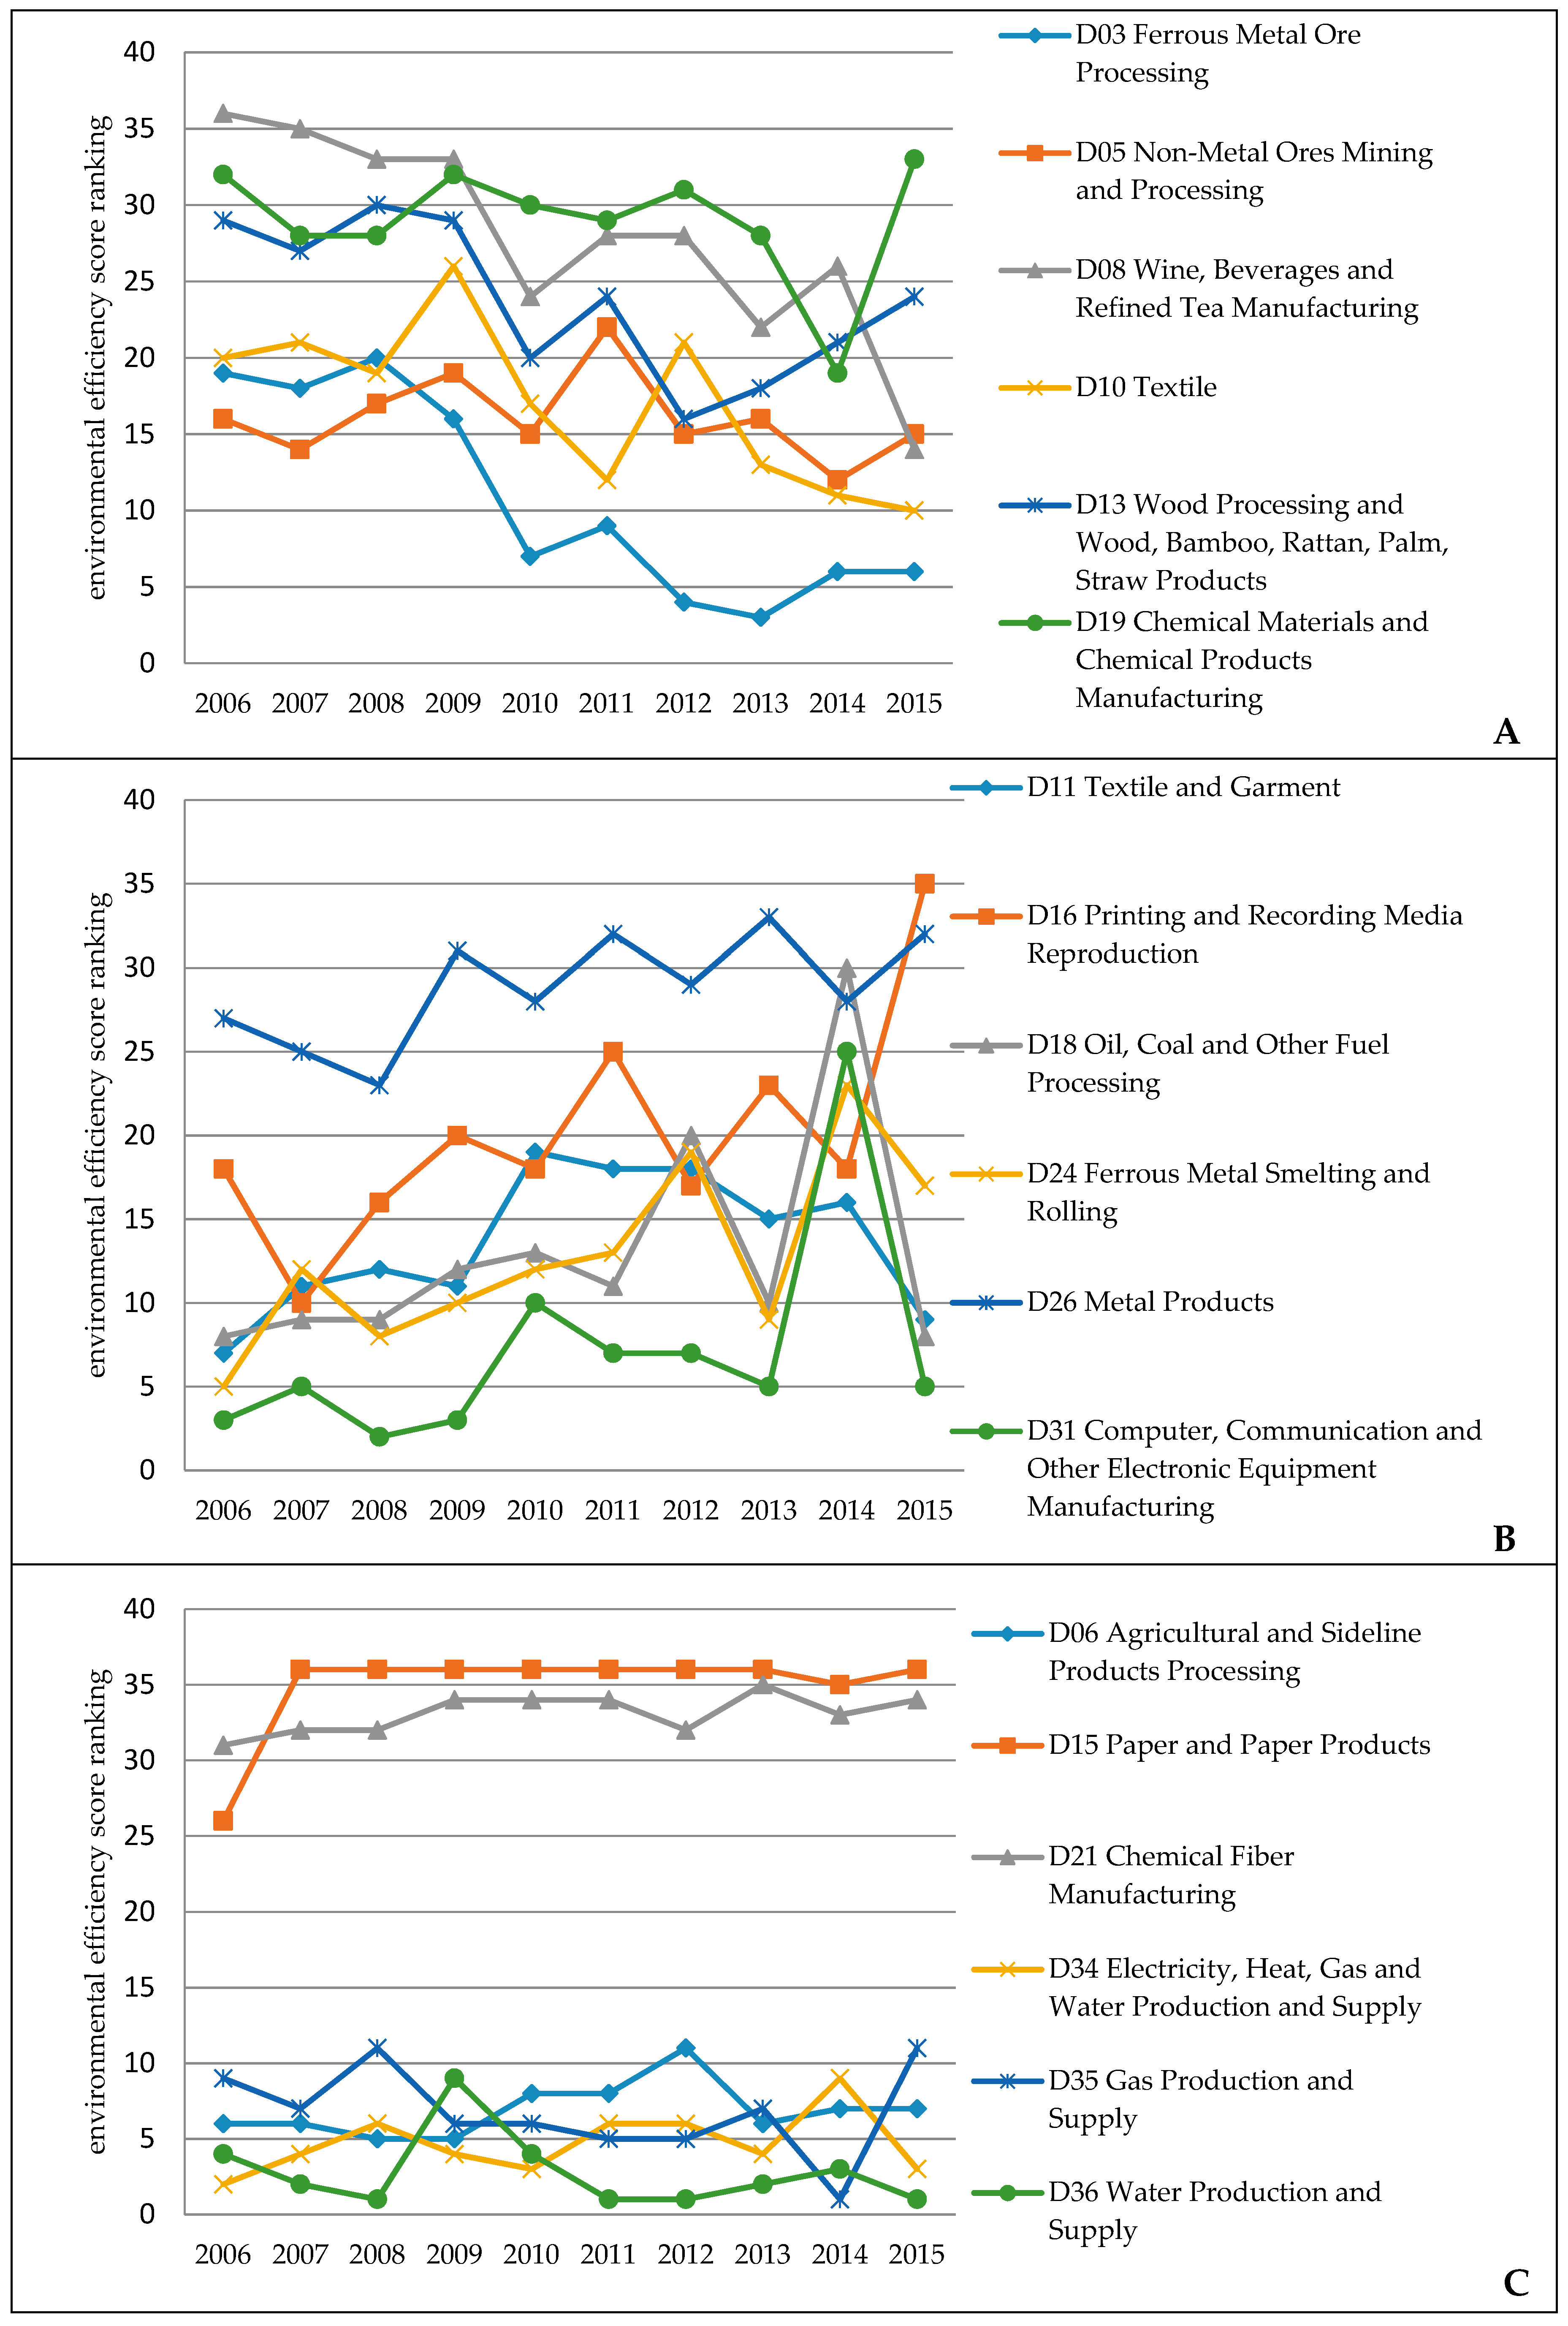
Figure 2A shows the six industries whose environmental efficiency ranking fluctuated in a downward trend from 2006 to 2015. The environmental efficiency of these six industries has been increasing over the past decade, which is partly related to the fact that energy conservation and emission reduction tasks in the steel, petrochemical, and textile industries have been the focus of the 11th and 12th Five-Year Plan periods. Though the long-term pollution level of the chemical material and chemical products manufacturing industry (D19) is very high, the efficiency has been significantly improved from 2012 to 2014, which is consistent with the findings by Kang et al. [45]. The environmental efficiency of ferrous metal mining and processing (D03) was found to be relatively high, ranking in the top 10 for more than six times. The wine, beverages, and refined tea manufacturing industry (D08) ranks low and has a high pollution level, but its environmental quality appears to be improving gradually with time. The efficiency of these two industries is rising at the fastest rate, especially during the 11th Five-Year Plan period, in which one focus was tuned to the technological innovation in ecology of the brewing industry and harmonious development of the environment; the environmental quality improvement of the wine, beverage, and refined tea manufacturing industry (D08) seems obvious, which is in line with Wu [9].
Figure 2B shows the six industries whose environmental efficiency is in a stage of ‘growing.’ Most are heavy industries and traditional manufacturing industries, which are typical industries with high emissions and low efficiency. Computer, communication, and other electronic equipment manufacturing (D31), a technical industry with low energy efficiency and low emission reduction, ranks relatively high in efficiency, with nine times ranking in the top 10; the metal products industry (D26) ranks low, and the environmental quality is relatively poor; other industries are in the middle level. In terms of efficiency volatility, the efficiency ranking for the textile and garment industry (D11) and the metal products industry (D26) varied slightly and was relatively stable. The efficiency score of the following four industries declined sharply in 2014: Printing and recording media reproduction (D16); oil, coal, and other fuel processing (D18); ferrous smelting and rolling (D24); and computer, communication, and other electronic equipment manufacturing (D31). The reason may be that the new Environmental Protection Law promulgated in 2014 engendered environmental protection pressures to these slow emission-reducing industries, increased environmental protection investment and production costs, and slowed down the progress in environmental governance.
Figure 2C shows the six industries whose environmental efficiency is at a stage of ‘stable-fluctuating’. It is obvious that the following four industries rank in the top 10 for efficiency almost every year: Agricultural and side-line products processing (D06); electricity, heat, gas, and water production and supply (D34); gas production and supply (D35); and water production and supply (D36). Among these four industries, the water production and supply industry (D36) ranked in the top five in all years except 2009, indicative of high environmental quality. The paper and paper products industry (D15) and the chemical fibre manufacturing industry (D21) ranked the lowest in efficiency. The paper and paper products industry (D15) ranked after 35 in all years except 2006, implying that its environmental pollution is severe, which can be highly related with its relatively backward green technology and difficulty in development transition. As a highly polluting chemical industry, the chemical fibre manufacturing industry (D21) produces waste water, waste gas, waste liquid, and other pollutants. The cost of waste treatment is high, resulting in low long-term environmental efficiency for this industry.
5.2. Industrial Clusters
In conducting the clustering analysis, we found that the efficiency interval calculated for each industry by the Ward method varies greatly in different years, which leads to an inconsistent statistical calibre and makes group-wise comparisons difficult. To make comparisons feasible across clusters, this study took the comprehensive environmental efficiency of industries from 2006 to 2015 as the clustering variable and used the system clustering method to divide 36 industries into nine categories, and then adjusted the efficiency value to five categories: Light-pollution industries, medium- and low-pollution industries, medium-pollution industries, medium- and high-pollution industries, and high-pollution industries. The corresponding ranges of efficiency are (3–17), (1.75–3), (1.3–1.75), (1.15–1.3), and (0.21–1.15), respectively. The industry clusters by years are summarized in Table 2, where more detailed results of the cluster analysis (say, a cluster dendrogram) are omitted to conserve space. Some of the key findings in this part of clustering analysis can be summarized herein.
First, from the perspective of yearly industrial classification: (i) The light-pollution industries (i.e., high environmental efficiency industries) are mainly clean industries and high-tech industries with low energy use and emission. These include oil and gas extraction (D02), water production and supply (D36), and computer, communication, and other electronic equipment manufacturing (D31), which, relatively speaking, are state monopolies or industries with more state supports (Kang et al., 2018). These industries also have the characteristics of high technology, low energy intensity, and low emissions, as well as relatively high levels of clean production technology and high awareness of environmental protection, which are helpful for improving production efficiency, energy saving, and emission reduction. (ii) Medium-pollution industries mainly include some light industries and the heavy chemical industry among the main industries of the country. The agricultural and side-line products processing industry (D06) and light industries like the textile industry (D10) and the textile and garment industry (D11) belong to the labour-intensive industries: Though technological updates and industrial upgrades within these industries are relatively difficult, and they use more resources that produce more pollutants in the production process, China has a large amount of cheap labour, so the efficiency of this kind of industry will be relatively higher. Turning to the heavy chemical industries, they have the characteristics of high energy consumption and high emissions and, hence, higher pollution levels. However, such industries, which include oil, coal, and other fuel processing (D18) and ferrous metal smelting and rolling processing (D24), belong to the main industries of the nation and thus tend to obtain more government investment and financial support for improving emission reduction technology and reducing pollution. As such, these industries belong to the cluster of moderate sources of pollution. (iii) The medium- and high-pollution industries account for approximately one-third of all the industries, and most of these industries belong to China’s traditional consumption-based manufacturing industry and non-ferrous metal industry. The consumption-based manufacturing industry includes leather, fur, feather, and their products and footwear (D12), wood processing and wood, bamboo, rattan, palm, straw products industry (D13), furniture manufacturing (D14), printing and recording media reproduction industry (D16), and culture, education, labour and beauty, sports, and entertainment products manufacturing (D17). These industries have the characteristics of having outdated production technologies, slow update speeds, large resource consumption, generally low efficiency of production, and, in the majority of cases, being dominated by small and medium-sized enterprises. The factors such as using harmful and toxic raw materials, the backwardness of clean production technology, and the discharge of waste water all contribute to the high level of pollution and low environmental efficiency for this type of industry cluster. In terms of the non-ferrous metal processing industry, as a key industry of the nation to solve overcapacity, such an industry will produce a large amount of heavy metal waste water in the production process. China still has a long, hard way to go to combat pollutions in these industries. (iv) High-pollution industries include food manufacturing (D07), wine, beverage, and refined tea manufacturing (D08), and paper and paper products (D15). These industries are characterized by high consumption of resources and energy, difficulty in upgrading green technologies, high pollution emission per unit of economic output, large scale of pollution emissions, and great environmental damage. For example, the environmental efficiency of paper and paper products in most of the year is the lowest among all industries, which is closely related to the low overall level of papermaking technology in China, the small scale of papermaking enterprises, the large consumption of resources and energy, the variety of pollutants produced, the high emission intensity, and the imperfect technology innovation system.
In general, the clustering results of 36 industries in China suggest that most industries belong to the medium- and high-pollution categories of industry. Except for the following three industries—agricultural and side-line products processing (D06), oil, coal, and other fuel processing (D18), and electricity, heat, gas production and supply (D34)—the environmental performance assessment of other industries is basically the same as that of China’s 11 high-pollution industries and 16 key pollution sources, which were listed in the First National Pollution Sources Census proposed by the State Council. This study argues that the reasons for this difference may be due to the fact that, after ten years of policy regulations on ‘Three-Rurals’ (agriculture, rural villages, and farmers) and on energy conservation and emission reduction, the environmental efficiency of these three industries (D06, D18, and D34) has been effectively improved. In addition, the pollution situation has been improved by means of improving clean production, pollution control technology, and the recycling capacity of resources. Looking back at the existing literature, Li and Shi [46] examined the environmental efficiency of 36 industries in China. Their results showed that the energy efficiency levels of the agricultural and side-line products processing industry (D06) and the oil, coal, and other fuel processing industry were higher than the industry average; similarly; Wang et al. (2017) used a clustering analysis to find that the oil, coal, and other fuel processing industry, as well as the electricity, heat, and gas production and supply industry in Beijing, belong to high-efficiency industries. This study proved to be consistent with all three of the above studies.
Second, from the perspective of the stability of industrial pollution level for the 2006–2015 period: When speaking of ‘stability,’ we mean that a particular industry is classified as a same cluster (i.e., one of the five clusters as shown below) for multiple times during the study period—seven times in this study—as will be illustrated shortly. Among the 36 industries studied, chemical products manufacturing (D19) and chemical fibre manufacturing (D21) were two high-pollution industries in the annual clustering; oil, coal, and other fuel processing (D18), furniture manufacturing (D14), paper and paper products (D15), and special-equipment manufacturing (D28) were classified as moderate (or above) in nine out of ten years. 11 industries such as computer, communication, and other electronic equipment manufacturing (D31) were classified in the same category seven to eight times; 12 industries such as non-metal ores mining and processing (D05) and food manufacturing (D07) were classified into the same industry five to six times, and the other two industries (D02 and D03) were classified in the same industry fewer than five times. The more times a particular industry appears in a certain cluster—that is, the higher the frequency is—the more stable the environmental performance of this industry is. Only tobacco products (D09) and water production and supply (D36) are classified as mild-pollution industries, and they fell into this category seven times in the past decade. In order to make group-wise comparisons convenient and analyse the differences between industries with different levels of environmental performance and identify both green industries and polluted industries in Chinese industries, this study defined a stable industry as one that has appeared in the same cluster more than seven times in the study period. The five clusters for these stable industries are presented in Table 3.
It is shown that, during the two Five-Year Plan periods, the following 13 industries have long been at high pollution levels: Non-metal ores mining and processing (D05), food manufacturing (D07), wine, beverages, and refined tea manufacturing (D08), leather, fur, feather, and their products and footwear (D12), furniture manufacturing (D14), paper and paper products (D15), culture, education, labour and beauty, and sports and entertainment products manufacturing (D17), chemical materials and chemical products manufacturing (D19), chemical fibre manufacturing (D21), rubber and plastics products (D22), non-metallic mineral products (D23), metal products (D26), and special-equipment manufacturing (D28). We can find that most of the 13 high-pollution industries belong to either labour-intensive industries or energy-intensive heavy chemical industries with high emissions. For the former type, a labour-intensive light industry has the characteristics of small enterprise scale, difficulty in structure transformation and slow speed of technological update. Therefore, this kind of industry is inefficient in the production process, with serious waste of resources and high pollution emission intensity. In addition, most policies such as energy saving, emission reduction, technological innovation, and green industry transfer policies have relatively low effects on the labour-intensive light industry, which is another reason for the high pollution level. For the latter type, though, the heavy chemical industry has received substantial financial and policy supports from the government and indeed played a vital role in the development of China’s industry. However, the development of China’s heavy chemical industry was initially developed in an extensive (as opposed to intensive) mode of production, and China’s ability in technological innovation and green system construction lags far behind that of developed countries in the world. These factors make the traditional heavy chemical industry difficult in renovating towards green development, transforming and updating its industrial structure, and innovating and applying green technology. Thus, in order to promote the improvement of the overall environmental quality of China’s industries, as well as achieve the energy conservation and emission reduction targets proposed by the Chinese government, these industries should be given priority attention.
6. Concluding Remarks
Using the data of 36 Chinese industries from 2006 to 2015 and a multiple DEA model with a Gini criterion with a clustering analysis, this study has evaluated the environmental performance of all 36 industries by calculating their environmental efficiency score, ranking their performance, and analysing their differences and changing patterns using a cluster analysis. Empirical analysis revealed that there are different changing patterns in the environmental efficiency levels of 36 industrial sub-sectors in China from 2006 to 2015, which can be divided into six types: U-shaped curve (D01, D02, D07, D09, D14, D27), inverted U-shaped curve (D17, D20, D22, D25, D29, D30), W-shaped curve (D04, D12, D23, D28, D32, D33), growing-type (D03, D05, D08, D10, D13, D19), declining-type (D11, D16, D18, D24, D26, D31), and stable-fluctuating type (D06, D15, D21, D34, D35, D36). Overall, changing patterns exhibit substantial differences in the level of environmental efficiency between the six industries: The environmental efficiency of the U-shaped and the stable-fluctuating industries varies greatly, mainly in high-efficiency industries and inefficient industries; in the inverted U-shaped curve, W-shaped curve, and growing-type evolution, the overall environmental efficiency of these industries is at a medium to low level. Those industries with a declining-type evolution trend are generally at a medium to high efficiency level. In particular, the environmental efficiency differences among the industries with similar growth dynamic are also relatively large: The high environmental efficiency industries mainly include D01, D02, D06, D09, D30, D31, D34, D35, and D36, whose ranking of environmental efficiency is at least seven times in the top 12 of 36 industries between 2006 and 2015. The low environmental efficiency industries mainly include D07, D08, D15, D19, D20, D21, D23, D25, D26, D27, and D28, and the environmental efficiency ranking of these industries is at least seven times in the last 12 of 36 industries between 2006 and 2015. The other 16 industries (D03, D04, D05, D10, D11, D12, D13, D14, D16, D17, D18, D22, D24, D29, D32, and D33) are at medium environmental efficiency levels. This result is conducive to policy makers to grasp the laws of the industry and can provide direction for the future environmental investment and governance of various sectors of the industrial sector.
Based on the results of dynamic evaluation, this paper classified 36 industries into five categories by applying a cluster analysis: Low-pollution industries and medium-low pollution industries, medium-pollution industries, middle- and high-pollution industries, and high-pollution industries. Among them, the industries with low- and medium-low pollution (or high environmental efficiency) are mainly the clean industries and high-tech industries with low energy consumption and emission. In addition, some industries belong to the state monopolistic or supportive industries which have paid much attention to the environmental issues in the production process. This is another important reason for high environmental efficiency. The medium-pollution industries are mainly light industries and heavy chemical industries. However, with China’s labour advantage weakening and capital accumulation advantage increasing, the government must solve the transformation of labor-intensive light industry if it wants to ensure environmental efficiency in the future. The middle- and high-pollution industries mainly consisted of traditional living materials manufacturing and non-ferrous metals industries, which are characterized by lagged technology updates, long-term environmental pollution, and high environmental treatment costs. The high-pollution industries are dominated by pollution-intensive industries, whose low environmental efficiency is closely related to the coexistence of low production output, high pollution output, and poor technological innovation. These two types of highly polluting industries are different from the key pollution source census industries reported in the State Council’s 2007 First National Pollution Sources Census Program, showing that the environment efficiency of some industries (D06, D18, D34) has been increased since several years of government regulation on environmental investment and governance. This paper adds a new empirical basis for policy formulation to adapt to the current development of the industry.
Through the comparison of the stability of pollution levels in various industries from 2006 to 2015 after cluster analysis, we found that there were two lightly polluted industries (D09 and D36) that were relatively stable and belonged to the green industry of China’s industrial sector. Thirteen industries have been classified as medium-high pollution industries (D05, D12, D14, D17) and high-pollution industries (D07, D08, D15, D17, D19, D21, D22, D23, D26, D28) for more than seven years in a decade, which are likely to be the key pollution sources of China’s industries. The labour-intensive light industry and high-energy-consumption and high-emission heavy chemical industry account for a large proportion of these 13 industries, and China’s own industry characteristics and low green technology innovation ability are important reasons for low efficiency. Only by identifying high-polluting industries in the industry can we find the key to improve the overall environmental efficiency of the industrial sector and promote China’s economy sustainably.
In order to narrow the difference of environmental pollution levels in China’s industries, improve the overall environmental quality of industry, and achieve the coordinated development of economy and environment, this study proposes the following suggestions. First, different environmental policies should be formulated for different industries. Such a suggestion is also supported by other studies such as Liao and He [47] and Sun et al. [48]. In particular, more policies should be targeted on the 13 key pollution-source industries as identified in this study (i.e., paper and paper products, chemical materials and chemical products manufacturing, and special equipment manufacturing). For instance, the government may transfer some financial funds invested in other industries with high environmental performance to these 13 industries to improve their environmental performance, encourage and guide key pollution-source industries to learn from light pollution-source industries and to introduce technologies for energy conservation, emission reduction, and environmental governance, and increase education and Research and Development investment in these industries. On the other hand, the government may put forward targeted policies that are conducive to industrial transferring and upgrading. As the use of emission reduction policies and clean technologies varies by region and industry, it is imperative to strengthen environmental supervision and establish negative lists in underdeveloped areas and sensitive areas of ecosystems.
Second, increasing green investment should be accelerated. Studies have shown that green investment is an important measure to deal with environmental degradation and make environmental regulation more effective, while regional economic development, industrial structure upgrading, and energy structure transformation are closely related to green investment [49]. At present, China’s regional economic development is not fully balanced, and the secondary industry’s share of the three industries is still relatively large. In addition, the results of this study reveal that most of the heavily polluted industries in China are pollution-intensive industries with high pollution and high emissions which are characterized by high energy consumption and a difficulty for industrial structure transformation and green technology innovation. To this end, we must first promote economic growth in underdeveloped areas, which could lead to capital accumulation that will drive enterprises’ investment in green industries. Industrial structure upgrading measures (such as increasing the proportion of high-tech industries in the industrial sector) and energy-saving structural transformation measures (including improving energy-saving and emission-reducing technologies and increasing subsidies for renewable energy production) can promote investment to the green industry.
Third, traditional industrial energy efficiency should be improved. Energy efficiency has become a priority for many countries or regions around the world to address environmental and economic issues [50]. The empirical results show that the low environmental efficiency of China’s industries is mainly restricted by the development of traditional industries. Thus, to improve the quality of the industrial environment, two directions of endeavours can be taken: One is to improve the energy use efficiency of the traditional light industry, which is dominated by small and medium-sized enterprises, by increasing the government’s technical support, encouraging enterprises to develop new products and technologies on their own, and merging enterprises of the same type or bundling them in the industrial parks to achieve common improvement in energy efficiency between enterprises. The other is to change the growth mode of the traditional heavy chemical industry, strengthen the depth of opening, introduce advanced technologies of clean production and environmental management, grasp the strategic opportunity of the Belt and Road, and promote energy efficiency through trade integration and regional cooperation [51].
This study is not without limitations. Due to the lack of data, this study only covered 36 of the 41 industries in the industrial sector. In addition, this study did not explore the influencing factors and impact mechanisms of environmental efficiency in China’s industrial sub-sectors. Future studies can target on all industrial sub-sectors and other departments and examine the factors that affect the environmental efficiency of various industries in order to find a breakthrough to improve environmental efficiency. Besides, although this study has identified the key polluting industries, it does not perform a detailed analysis on the industrial structure, development mode, specific energy saving, and emission reduction direction within each key polluting industry. This can be another avenue of future research.
Author Contributions
All authors contributed equally to this paper.
Funding
This research was funded by the National Natural Science Foundation of China grant number [71573074], China Postdoctoral Science Foundation grant number [2018T110172], and the the National Social Science Foundation of China grant number [15BJL099].
Conflicts of Interest
The authors declare no conflict of interest with respect to the research, authorship, and/or publication of this paper.
Appendix A

Table A1.
Classification of industries.
| Code | Industry | Code | Industry |
|---|---|---|---|
| D01 | Coal Mining and Processing | D19 | Chemical Materials and Chemical Products Manufacturing |
| D02 | Oil and Gas Extraction | D20 | Pharmaceutical Manufacturing |
| D03 | Ferrous Metal Ore Processing | D21 | Chemical Fiber Manufacturing |
| D04 | Non-ferrous Metal Ores Mining and Processing | D22 | Rubber and Plastics Products |
| D05 | Non-Metal Ores Mining and Processing | D23 | Non-Metallic Mineral Products |
| D06 | Agricultural and Sideline Products Processing | D24 | Ferrous Metal Smelting and Rolling |
| D07 | Food Manufacturing | D25 | Non-ferrous Metal Smelting and Rolling |
| D08 | Wine, Beverages and Refined Tea Manufacturing | D26 | Metal Products |
| D09 | Tobacco Products | D27 | General Equipment Manufacturing |
| D10 | Textile | D28 | Special Equipment Manufacturing |
| D11 | Textile and Garment | D29 | Transportation Equipment Manufacturing |
| D12 | Leather, Fur, Feather and Their Products and Footwear | D30 | Electrical Machinery and Equipment Manufacturing |
| D13 | Wood Processing and Wood, Bamboo, Rattan, Palm, Straw Products | D31 | Computer, Communication and Other Electronic Equipment Manufacturing |
| D14 | Furniture Manufacturing | D32 | Instrumentation Manufacturing |
| D15 | Paper and Paper Products | D33 | Other Manufacturing |
| D16 | Printing and Recording Media Reproduction | D34 | Electricity and Heat Production and Supply |
| D17 | Culture, Education, Labor and Beauty, Sports and Entertainment Products Manufacturing | D35 | Gas Production and Supply |
| D18 | Oil, Coal and Other Fuel Processing | D36 | Water Production and Supply |
References
- Mao, X.; He, C. A trade-related pollution trap for economies in transition? Evidence from China. J. Clean. Prod. 2018, 200, 781–790. [Google Scholar] [CrossRef]
- Charnes, A.; Cooper, W.; Rhodes, E. Measuring the efficiency of decision making units. Eur. J. Oper. Res. 1978, 2, 429–444. [Google Scholar] [CrossRef]
- Banker, R.; Charnes, A.; Cooper, W. Some models for estimating technical and scale inefficiencies in data envelopment analysis. Manag. Sci. 1984, 30, 1078–1092. [Google Scholar] [CrossRef]
- Tone, K. A slacks-based measure of efficiency in data envelopment analysis. Eur. J. Oper. Res. 2001, 130, 498–509. [Google Scholar] [CrossRef] [Green Version]
- Charnes, A.; Cooper, W.; Golany, B.; Seiford, L.; Stutz, J. Foundations of data envelopment analysis for Pareto-Koopmans efficient empirical production functions. J. Econ. 1985, 30, 91–107. [Google Scholar] [CrossRef]
- Anderson, P.; Petersen, N. A procedure for ranking efficient units in data envelopment analysis. Manag. Sci. 1993, 39, 1261–1264. [Google Scholar] [CrossRef]
- Cooper, W.; Sieford, L.; Tone, K. Data Envelopment Analysis: A Comprehensive Text with Models, Applications, References and DEA Solver Software; Springer: New York, NY, USA, 2006. [Google Scholar]
- Breiman, L.; Friedman, J.; Stone, C.; Olshen, R. Classification and Regression Trees; Chapman & Hall/CRC: New York, NY, USA, 1983. [Google Scholar]
- Wu, L. Efficiency improvement in China’s energy-intensive industries and their contributions to carbon emission reduction targets. In China’s Energy Efficiency and Conservation; Su, B., Thomson, E., Eds.; Springer: New York, NY, USA, 2016; pp. 39–65. [Google Scholar]
- Sokka, L. Wood-based energy as a strategy for climate change mitigation in the Arctic-perspectives on assessment of climate impacts and resource efficiency with life cycle assessment. In Interconnected Arctic-UArctic Congress 2016; Latola, K., Savela, H., Eds.; Springer: Cham, Switzerland, 2016; pp. 61–66. [Google Scholar]
- Orea, L.; Wall, A. Measuring Eco-Efficiency Using the Stochastic Frontier Analysis Approach. In Advances in Efficiency and Productivity; Aparicio, J., Lovell, C.A.K., Pastor, J., Eds.; Springer: Cham, Switzerland, 2016; pp. 275–297. [Google Scholar]
- Jiang, L.; Folmer, H.; Ji, M.; Tang, J. Energy efficiency in the Chinese provinces: A fixed effects stochastic frontier spatial Durbin error panel analysis. Ann. Reg. Sci. 2016, 58, 301–319. [Google Scholar] [CrossRef]
- Canals, L.; Bauer, C.; Depestele, J.; Dubreuil, A.; Knuchel, R.; Gaillard, G.; Michelsen, O.; Müller-Wenk, R.; Rydgren, B. Key elements in a framework for land use impact assessment within LCA. Int. J. Life Cycle Assess. 2007, 12, 5–15. [Google Scholar] [CrossRef]
- Cole, M.A.; Rayner, A.; Bates, J. Trade liberalisation and the environment: The case of the Uruguay Round. World Econ. 1998, 21, 337–347. [Google Scholar] [CrossRef]
- Yellishetty, M.; Haque, N.; Dubreuil, A. Issues and challenges in life cycle assessment in the minerals and metals sector: A chance to improve raw materials efficiency. In Non-Renewable Resource Issues; Sinding-Larsen, R., Wellmer, F.-W., Eds.; Springer: New York, NY, USA, 2012; pp. 229–246. [Google Scholar]
- Färe, R.; Grosskopf, S.; Lovell, C.A.K.; Pasurka, C. Multilateral productivity comparisons when some outputs are undesirable: A nonparametric approach. Rev. Econ. Stat. 1989, 71, 90–98. [Google Scholar] [CrossRef]
- Hu, J.; Wang, S. Total-factor energy efficiency of regions in China. Energy Policy 2005, 34, 3206–3217. [Google Scholar] [CrossRef]
- Xie, B.; Shang, L.; Yang, S.; Yi, B. Dynamic environmental efficiency evaluation of electric power industries: Evidence from OECD (Organization for Economic Cooperation and Development) and BRIC (Brazil, Russia, India and China) countries. Energy 2014, 74, 147–157. [Google Scholar] [CrossRef]
- Al-Refaie, A.; Hammad, M.; Li, M. DEA window analysis and Malmquist index to assess energy efficiency and productivity in Jordanian industrial sector. Energy Effic. 2016, 9, 1299–1313. [Google Scholar] [CrossRef]
- Liu, X.; Chu, J.; Yin, P.; Sun, J. DEA cross-efficiency evaluation considering undesirable output and ranking priority: A case study of eco-efficiency analysis of coal-fired power plants. J. Clean. Prod. 2016, 142, 877–885. [Google Scholar] [CrossRef]
- Han, Y.; Long, C.; Geng, Z.; Zhang, K. Carbon emission analysis and evaluation of industrial departments in China: An improved environmental DEA cross model based on information entropy. J. Environ. Manag. 2018, 205, 298–307. [Google Scholar] [CrossRef]
- Geng, Z.; Dong, J.; Han, Y.; Zhu, Q. Energy and environment efficiency analysis based on an improved environment DEA cross-model: Case study of complex chemical processes. Appl. Energy 2017, 205, 465–476. [Google Scholar] [CrossRef]
- Song, M.; Wang, J. Environmental efficiency evaluation of thermal power generation in China based on a slack-based endogenous directional distance function model. Energy 2018, 161, 325–336. [Google Scholar] [CrossRef]
- Xing, Z.; Wang, J.; Zhang, J. Expansion of environmental impact assessment for eco-efficiency evaluation of China’s economic sectors: An economic input-output based frontier approach. Sci. Total Environ. 2018, 635, 284–293. [Google Scholar] [CrossRef]
- Zhang, J.; Zeng, W.; Wang, J.; Yang, F.; Jiang, H. Regional low-carbon economy efficiency in China: Analysis based on the Super-SBM model with emissions. J. Clean. Prod. 2015, 163, 202–211. [Google Scholar] [CrossRef]
- Feng, C.; Wang, M. Analysis of energy efficiency and energy savings potential in China’s provincial industrial sectors. J. Clean. Prod. 2017, 164, 1531–1541. [Google Scholar] [CrossRef]
- Lv, K.; Bian, Y.; Yu, A. Environmental efficiency evaluation of industrial sector in China by incorporating learning effects. J. Clean. Prod. 2017, 172, 2464–2474. [Google Scholar]
- Wang, K.; Yu, S.; Zhang, W. China’s regional energy and environmental efficiency: A DEA window analysis based dynamic evaluation. Math. Comput. Model. 2013, 58, 1117–1127. [Google Scholar] [CrossRef]
- Wu, X.; Chen, Y.; Guo, J.; Gao, G. Inputs optimization to reduce the undesirable outputs by environmental hazards: A DEA model with data of PM2.5 in China. Nat. Hazards 2017, 90, 1–25. [Google Scholar] [CrossRef]
- Wang, Y.; Duan, F.; Ma, X.; He, L. Carbon emissions efficiency in China: Key facts from regional and industrial sector. J. Clean. Prod. 2019, 206, 850–869. [Google Scholar] [CrossRef]
- Yang, Z.; Wei, X. The measurement and influences of China’s urban total factor energy efficiency under environmental pollution: Based on the game cross-efficiency DEA. J. Clean. Prod. 2019, 209, 439–450. [Google Scholar] [CrossRef]
- Yu, Y.; Zhang, W.; Zhang, N. The potential gains from carbon emissions trading in China’s industrial sectors. Comput. Econ. 2018, 52, 1175–1194. [Google Scholar] [CrossRef]
- Chen, S.; Golley, J. ‘Green’ productivity growth in China’s industrial economy. Energy Econ. 2014, 44, 89–98. [Google Scholar] [CrossRef]
- Wu, J.; Li, M.; Zhu, Q.; Zhou, Z.; Liang, L. Energy and environmental efficiency measurement of China’s industrial sectors: A DEA model with non-homogeneous inputs and outputs. Energy Econ. 2019, 78, 468–480. [Google Scholar] [CrossRef]
- Soleimani-damaneh, M.; Zarepisheh, M. Shannon’s entropy for combining the efficiency results of different DEA models: Method and application. Expert Syst. Appl. 2009, 36, 5146–5150. [Google Scholar] [CrossRef]
- Satty, T. The Analytic Hierarchy Process; McGraw-Hill: New York, NY, USA, 1980. [Google Scholar]
- Shannon, C. A mathematical theory of communication. Bell Syst. Tech. J. 1948, 27, 379–423. [Google Scholar] [CrossRef]
- Xue, H.; Zheng, Z.; Xie, Q. An Approach on the Performance Evaluation Problems on Multiple DEA Models and Criterion—Evaluation the Performance of Universities in China. Chin. J. Manag. Sci. 2014, 22, 98–104. (In Chinese) [Google Scholar]
- Caballero, S.; Esclapez, R.; Galindo, N.; Mantilla, E.; Crespo, J. Use of a passive sampling network for the determination of urban NO2 spatiotemporal variation. Atmos. Environ. 2012, 63, 148–155. [Google Scholar] [CrossRef]
- Gu, F.; Hall, P.; Nicholas, J. Performance evaluation for composites based on recycled polypropylene using principal component analysis and cluster analysis. J. Clean. Prod. 2016, 115, 343–353. [Google Scholar] [CrossRef]
- Zheng, X.; Zhang, L.; Yu, Y.; Lin, S. On the nexus of SO2 and CO2 emissions in China: The ancillary benefits of CO2 emission reductions. Reg. Environ. Chang. 2011, 11, 883–891. [Google Scholar] [CrossRef]
- Xu, H.; Li, Y.; Huang, H. Spatial research on the effect of financial structure on emission. Energy Procedia 2017, 118, 179–183. [Google Scholar] [CrossRef]
- Eggelston, S.; Buendia, L.; Miwa, K.; Ngara, T.; Tanabe, K. 2006 IPCC Guidelines for National Greenhouse Gas Inventories; Institute for Global Environmental Strategies (IGES): Kanagawa, Japan, 2006. [Google Scholar]
- Seiford, L.; Zhu, J. Modeling undesirable factors in efficiency evaluation. Eur. J. Oper. Res. 2002, 142, 16–20. [Google Scholar] [CrossRef]
- Kang, Y.; Xie, B.; Wang, J.; Wang, Y. Environmental assessment and investment strategy for China’s manufacturing industry: A non-radial DEA based analysis. J. Clean. Prod. 2018, 175, 501–511. [Google Scholar] [CrossRef]
- Li, H.; Shi, J. Energy efficiency analysis on Chinese industrial sectors: An improved Super-SBM model with undesirable outputs. J. Clean. Prod. 2014, 65, 97–107. [Google Scholar] [CrossRef]
- Liao, N.; He, Y. Exploring the effects of influencing factors on energy efficiency in industrial sector using cluster analysis and panel regression model. Energy 2018, 158, 782–795. [Google Scholar] [CrossRef]
- Sun, Y.; Zou, X.; Shi, X.; Zhang, P. The economic impact of climate risks in China: Evidence from 47-sector panel data, 2000–2014. Nat. Hazards 2019, 95, 289–308. [Google Scholar] [CrossRef]
- Liao, X.; Shi, X. Public appeal, environmental regulation and green investment: Evidence from China. Energy Policy 2018, 119, 554–562. [Google Scholar] [CrossRef]
- IEA. Market Report Series: Energy Efficiency 2017; International Energy Agency: Paris, France, 2017. [Google Scholar]
- Han, L.; Han, B.; Shi, X.; Su, B.; Lv, X.; Lei, X. Energy efficiency convergence across countries in the context of China’s Belt and Road initiative. Appl. Energy 2018, 213, 112–122. [Google Scholar] [CrossRef]
Figure 1.
Environmental efficiency showing a “U-,” “inverted U-,” and “W-” shaped changing patterns (A–C).
Figure 1.
Environmental efficiency showing a “U-,” “inverted U-,” and “W-” shaped changing patterns (A–C).

Figure 2.
Environmental efficiency showing a “Declining,” “Growing,” and “Stable-fluctuating” changing patterns (A–C).
Figure 2.
Environmental efficiency showing a “Declining,” “Growing,” and “Stable-fluctuating” changing patterns (A–C).

Table 1.
China’s industry environmental performance evaluation index system.
| First-Level Index | Second-Level Index | Third-Level Index | Unit | |
|---|---|---|---|---|
| Input index | Labor force | Quantity of labor force | Number of employees at the end of the year in urban units | Thousands |
| Resources | Quality of labor force | Number of science and technology personnel | Persons | |
| Energy | Consumption of crude oil/coal/natural gas/kerosene/gasoline/diesel oil/fuel oil/coke | 104 ton | ||
| Consumption of electricity consumption | 109 kWh | |||
| Assets | Fixed assets of enterprise | 109 yuan | ||
| Liquid assets of enterprise | 109 yuan | |||
| Scale | Number of business units | |||
| Environmental governance input | Industrial waste gas treatment facility operating costs | 104 yuan | ||
| Industrial wastewater treatment facility operating costs | 104 yuan | |||
| Number of industrial waste gas treatment facilities | ||||
| Number of industrial waste water treatment facilities | ||||
| Comprehensive utilization of industrial solid waste | 104 ton | |||
| Output index | Technology | New product | Expenditure on the development of new products by enterprises | 104 ton |
| Number of new product projects | ||||
| Patent | Number of effective invention patents | |||
| Desirable output | Economic output | Industrial sales value | 109 yuan | |
| Total profit | 109 yuan | |||
| Undesired output | Environmental pollution output | Waste gas emissions | 109 m3 | |
| Waste water discharge | 104 ton | |||
| Solid waste production | 104 ton | |||
| Ammonia nitrogen/chemical oxygen demand/smoke and dust/sulphur dioxide emissions | Ton | |||
| Carbon dioxide emissions | 104 ton |
Table 2.
Clustering results of environmental pollution levels in industries.
| Low Pollution | Medium-Low Pollution | Medium Pollution | Medium-High Pollution | High Pollution | |
|---|---|---|---|---|---|
| 2006 | D09 | D24, D31, D34, D36 | D06, D11, D18, D25, D30, D35 | D01, D03, D04, D05, D10, D12, D14, D15, D16, D17, D20, D22, D26, D27, D29, D33 | D02, D07, D08, D13, D19, D21, D23, D28, D32 |
| 2007 | D09, D29, D34, D36 | D06, D30, D34, D35 | D01, D04, D05, D11, D16, D17, D18, D24, D25 | D03, D10, D12, D14, D22, D27, D33 | D02, D07, D08, D13, D15, D19, D20, D21, D23, D26, D28, D32 |
| 2008 | D36 | D31 | D01, D02, D06, D09, D11, D17, D18, D24, D30, D34, D35 | D03, D04, D05, D10, D12, D14, D16, D22, D23, D25, D26, D29, D32, D33 | D07, D08, D13, D15, D19, D20, D21, D27, D28 |
| 2009 | D09 | D01, D02, D06, D30, D31, D34, D35, D36 | D03, D04, D07, D11, D12, D17, D18, D24, D29 | D05, D16, D22, D23, D32 | D08, D10, D13, D14, D15, D19, D20, D21, D25, D26, D27, D28, D33 |
| 2010 | D02, D09 | D01, D03, D04, D06, D31, D34, D35, D36 | D05, D12, D18, D24, D30 | D10, D11, D13, D14, D16, D17, D25, D29 | D07, D08, D15, D19, D20, D21, D22, D23, D26, D27, D28, D32, D33 |
| 2012 | D36 | D02, D09 | D03, D31, D34, D35 | D01, D04, D05, D06, D10, D11, D12, D13, D14, D16, D17, D18, D24, D30, D33 | D07, D08, D15, D19, D20, D21, D22, D23, D25, D26, D27, D28, D29, D32 |
| 2013 | D02, D36 | D03, D31, D34 | D04, D06, D09, D18, D24, D35 | D01, D05, D08, D10, D11, D12, D13, D14, D17, D30, D33 | D07, D15, D16, D19, D20, D21, D22, D23, D25, D26, D27, D28, D29, D32 |
| 2014 | D02, D09, D36 | D03, D31, D34 | D05, D06, D10, D11, D18, D24, D30, D33, D35 | D01, D04, D12, D13, D14, D17, D20, D25, D29 | D07, D08, D15, D16, D19, D21, D22, D23, D26, D27, D28, D32 |
| 2015 | D09, D036 | D30, D31, D34 | D03, D06, D10, D11, D18, D35 | D01, D02, D04, D05, D07, D08, D12, D13, D14, D17, D20, D25, D27, D29, D32, D33 | D01, D15, D16, D19, D21, D22, D23, D26, D28 |
Table 3.
Stable industries for different clusters.
| Low Pollution | Medium-Low Pollution | Medium Pollution | Medium-High Pollution | High Pollution | |
|---|---|---|---|---|---|
| Industry | D09, D36 | D31, D34 | D18, D24 | D05, D12, D14, D17 | D07, D08, D15, D19, D21, D22, D23, D26, D28 |
© 2019 by the authors. Licensee MDPI, Basel, Switzerland. This article is an open access article distributed under the terms and conditions of the Creative Commons Attribution (CC BY) license (http://creativecommons.org/licenses/by/4.0/).
Share and Cite
MDPI and ACS Style
Xie, L.; Chen, C.; Yu, Y. Dynamic Assessment of Environmental Efficiency in Chinese Industry: A Multiple DEA Model with a Gini Criterion Approach. Sustainability 2019, 11, 2294. https://0-doi-org.brum.beds.ac.uk/10.3390/su11082294
AMA Style
Xie L, Chen C, Yu Y. Dynamic Assessment of Environmental Efficiency in Chinese Industry: A Multiple DEA Model with a Gini Criterion Approach. Sustainability. 2019; 11(8):2294. https://0-doi-org.brum.beds.ac.uk/10.3390/su11082294
Chicago/Turabian StyleXie, Li, Chunlin Chen, and Yihua Yu. 2019. "Dynamic Assessment of Environmental Efficiency in Chinese Industry: A Multiple DEA Model with a Gini Criterion Approach" Sustainability 11, no. 8: 2294. https://0-doi-org.brum.beds.ac.uk/10.3390/su11082294
Note that from the first issue of 2016, this journal uses article numbers instead of page numbers. See further details here.