Improving the Sustainability of Open Government Data


1
School of Economics & Management, Xiamen University of Technology, Xiamen 361005, China
2
Graduate Institute of Industrial and Business Management, National Taipei University of Technology, Taipei 10608, Taiwan
3
Department of Industrial Engineering and Management, National Taipei University of Technology, Taipei 10608, Taiwan
4
Department of Trade and Economics, Ningbo Institute of Education, Ningbo 315016, China
*
Author to whom correspondence should be addressed.
Sustainability 2019, 11(8), 2388; https://0-doi-org.brum.beds.ac.uk/10.3390/su11082388
Submission received: 22 February 2019
/
Revised: 15 April 2019
/
Accepted: 16 April 2019
/
Published: 22 April 2019
Abstract
:In the context of big data, opening government data to society for development and utilization would improve the transparency of government work and promote harmonious social development. Improving the sustainability of open government data (OGD) is an important and challenging issue, and has received the attention of multiple governments. The goals of this study are to construct a new evaluation model for the sustainability of OGD that explores the main influential factors and amends the priorities. We used a combination of the Decision-Making Trial and Evaluation Laboratory (DEMATEL) method and the Analytical Network Process (ANP) method known as DANP to construct an influential network relationship map (INRM) of the evaluation system and calculate the criterion weights. The INRM and weights can help decision makers understand the complex assessment system and set priorities for improving OGD. The results demonstrate that the improvement priorities of dimensions have the following order: impact (D4), use (D3), data (D2), and environment (D1). Economic, social, and political values are the three critical factors for improvement of the sustainability of OGD. Some implications for management are also provided.
1. Introduction
Governmental departments generate, acquire, and preserve large amounts of data resources in the process of fulfilling their administrative duties. These data are public resources for the whole society. Open government data (OGD) refers to government data that anyone or any organization can access, use, and share freely [1,2]. Continuously opening government data to society for development and utilization will help improve the transparency of government work and promote public participation in governance [3]. OGD is easy for the public to reuse and redevelop for any purpose, to generate new services, stimulate innovation, and provide new economic opportunities, thus creating social and economic value [4,5]. OGD can stimulate the public to participate in government events and affairs, so that political value can be created by improving the transparency and public service quality of the government departments [6]. Hence, OGD is one of the key paths for sustainable development [7].
The US government launched the open data platform data.gov in 2009, and, since then, other countries have also established web portals to promote the sustainability of OGD, which has been progressing rapidly all around the world. As of 2016, 106 of the 193 member states of the United Nations have provided open data directories through “government websites” on topics such as the environment, transportation, and health [7]. Governments are actively boosting cooperation. As of April 2019, 79 countries have joined the Open Government Partnership (OGP), which was established in September 2011 [8]. Governments have thus aroused much attention toward the sustainability of OGD.
Local government OGD platforms have been put into use in areas such as Beijing, Shenzhen, and Guizhou, with the aim of helping people freely access government data. Individuals and businesses are developing applications by downloading government data, such as “I love health” and “Travel in Beijing”. These efforts are conducive to creating “smart” lifestyles and promoting sustainable social development. According to the 2016 Global Open data Barometer Report (Fourth Edition), China ranks 71 out of 114 in this respect [9]. Although the Chinese government actively promotes OGD, in general, this is insufficient. Therefore, it is important to improve the sustainability of OGD in China [10]. In other words, it is important to identify the factors influencing the sustainability of OGD and to propose improvement strategies.
Evaluation is an important way to increase the performance of the public sector [11]. Administrations can identify weaknesses and develop improvement strategies to promote the sustainability of OGD by assessing the capability and effect of OGD [12]. OGD is mainly evaluated by international organizations and scholars. The Global Open Data Barometer Report assessed the stage of open data readiness, execution, and influence, including economic, political, and social impacts [9]. The Open Global Data Index assessment is organized by the Open Knowledge Foundation of the United Kingdom, and has a citizen perspective on 15 first-level indicators [13]. The Open Data Readiness Assessment is implemented by the World Bank’s Open Data Working Group, and is evaluated based on eight dimensions and three levels [14]. The OGD Index is assessed by the Economic and Development Organization, and evaluates three aspects: communication infrastructure, capacity to promote and use communication technologies, and the possibilities for online services [15]. The Government Data Openness Survey evaluates 193 member countries of the United Nations by accessing government portals and data [7]. Based on the International Government Data Open Assessment Project, the World Wide Web Foundation and the New York University Governance Laboratory have proposed a common OGD assessment framework that includes four dimensions: environment, data, use, and impact [16]. The Digital and Mobile Governance Laboratory of Fudan University evaluates the China Open Forest Index for OGD for 46 provinces and cities in China, based on three dimensions: the data layer, platform, and readiness levels [17]. Some research has evaluated OGD from the perspective of service capabilities, data quality, and producing impact. The OGD service capabilities can be evaluated by open data policies, website usability, entrepreneurial data services, and user satisfaction [18,19,20]. Data quality has also been evaluated in terms of the data source, data integrity, and data service [21,22,23,24]. Other studies have focused on evaluation of the value and effectiveness of OGD, including organizational, economic, and social benefits [25,26,27,28,29].
In general, OGD evaluation methods include qualitative analyses, such as case analysis [9,22,23] and expert interviews [15], as well as quantitative methods, such as the analytic hierarchy process (AHP) [20,24], artificial neural networks (ANNs) [25], and structural equation modeling (SEM) [18,27]. The contents and indicators for evaluation are diverse. Previous studies have mainly focused on the evaluation of OGD projects, but little attention has been given to the sustainability of OGD.
In this paper, the term sustainability means to apply government data that has been continuously open to the public through the platform and to maximize the benefits of OGD. “Promote just, peaceful and inclusive societies” is one of the 17 sustainable development goals developed by the United Nations [30]. Sustainable OGD can continuously improve government performance and transparency, and encourage public participation in social governance [3]. Sustainability of OGD as an enabler of transparent, accountable, and effective public administration institutions can support sustainable development [7]. Additionally, sustainability of OGD can continuously generate new services, stimulate innovation, and provide new economic opportunities by reusing and redeveloping the opening data [4,5]. Sustainable OGD can contribute in many ways to the achievement of sustainable development goals, and can drive progress towards sustainable development [7]. Sustainable OGD is an important way to promote sustainable development. The ways to improve sustainability of OGD remain a very meaningful research issue. Thus, this study aims to reveal the influential factors and impact effects of sustainable OGD, as well as to propose strategies for improvement. In sum, the investigation aimed to:
- (1)
- Define the evaluating factors and establish the evaluation model for the sustainability of OGD.
- (2)
- Investigate the influence of degrees between factors.
- (3)
- Put forward suggestions to improve the sustainability of OGD.
The improvement of sustainable OGD is a multiple-attribute decision-making problem. Relevant variables usually have certain degrees of correlation, especially the interaction between important variables, such as dependence and feedback effects. The Decision-Making Trial and Evaluation Laboratory (DEMATEL) method combined with the Analytic Network Process (ANP) method can solve the problem by constructing an interaction between the evaluation dimensions and the criteria of sustainable OGD. This method has been widely used to examine emergency strategies, transportation, green buildings, network reputation, service quality, and other applications [31,32,33,34,35,36,37]. However, it is rarely used on OGD. The DANP is a new method to construct evaluation models of sustainability of OGD. Based on the DEMATEL and ANP methods, the relationships and weights of each influential factor can be calculated. The derived influential network relationship map (INRM) is used to represent the influence of relationships between dimensions and criteria in sustainable OGD. This will help government administrators understand the influencing factors in complex relationships and propose suggestions to improve the sustainability of OGD.
The remainder of this paper is organized as follows. Section 2 reviews the relevant literature to form the key factors for sustainability of OGD. Section 3 introduces the DANP method that was used to build the INRM and find the weights of the criteria. The data analysis and results are presented in Section 4. A discussion and the implications are discussed in Section 5, and Section 6 presents the conclusions.
2. Literature Review on Establishment Indicator Framework
This study adopts the OGD assessment draft framework proposed by ODI and New York University [17] and integrates OGD ecosystem theory [38]. We evaluate the sustainability of OGD from environment, data, use, and impact dimensions.
2.1. Definition of Sustainability of OGD
Sustainability refers to the ability to sustain or support objective things permanently or indefinitely. From a dynamic point of view, it means that healthy existence and development of the system can be continuously or indefinitely maintain or supported [38]. Sustainability was first proposed by ecologists, and this is now called ecological sustainability [39].
An ecosystem can be understood as “a system of people, practices, values and technologies in a particular local environment” [40]. There are various ecosystem analogies, such as the business ecosystem, digital ecosystem, and open government ecosystem [38,40,41,42]. The concept of a data ecosystem has seen growing use in research on data-driven government. In open data ecology, there are four archetypal sustainable value generating mechanisms. They are information transparency, collective impact, data-driven efficiency, and data-driven innovation. The sustainable value generation is influenced by: the incentives provided, the level of technical and legal openness of data, the maturity of resource (data) governance, the general data-related capabilities in society, and the technological maturity and prevalence [43]. In general, open data ecosystems can be seen as being composed of a number of elements, such as participants (actors), data resources, design, and interdependencies [41].
We also think of OGD as an ecosystem. The sustainability of OGD is a new area of research that links the concepts of sustainability and OGD. Generally, sustainable OGD emphasizes the realization of long-term continuous OGD and the reuse of data to generate political, economic, and social value [12,41]. Opening and using data encounters numerous impediments, such as availability and access, findability, usability, understandability, quality, metadata, and so on [44]. The OGD ecosystem includes stakeholders, processes of data, and benefits associated [6,38]. The components of the OGD ecosystem mainly include stakeholders, the process of utilization, benefit, and external environment [42]. An OGD ecosystem is defined as one driven by the realization of value [40]. The environment is the infrastructure of OGD ecosystem. The data is the basic and most important resource of the OGD ecosystem [6,38]. Impacts on politics, economy, and society will be created by using data resources [45]. The impacts are the sustainable value that sustainable OGD will generate [40,43]. This study adopts the OGD ecosystem and the OGD assessment draft framework proposed by ODI and New York University [16]. The research framework includes the environment, data, use, and impact dimensions with 18 criteria, which are discussed below.
2.2. Environment Dimension
The environment dimension refers to the background conditions for providing sustainable OGD. It is the premise for OGD implementation and provides protection and a technical foundation, including laws and regulations, political will and leadership, and technical capacity [28,37]. Laws and regulatory factors provide an implementation framework for sustainable OGD, to ensure that government data are continuously open for a long time, to improve the transparency of government information, and to stimulate the use and value creation of OGD [25,28].
OGD is open data that was generated by government management, and the open data is stored in various parts of the government [2,46]. Political will and leadership will strengthen collaboration among government departments to build a unified data set that can be sustainably opened to the public [45]. If leaders do not pay attention, sustainable OGD cannot be effectively developed [47]. As a basic policy to improve government transparency, sustainable OGD requires time and money to implement. OGD requires strong government support and a strong political will to mobilize government data and other related resources [48].
Public supervision, consultation, and participation in OGD will promote government transparency and social equity, as well as trust in society and social connectedness [3]. The more active the public is in OGD, the more sustainable OGD becomes [10]. Enthusiasm among the public for the access and reuse of open data is a prerequisite for OGD to create value [29].
Technical capacity provides technical support for improving the quality of sustainable OGD and promoting its effective use. Linked data technology realizes the association and integration between different datasets, data, and OGD platforms, as well as the semantic expression and integration of open data [49,50,51]. Ontology enhances the discovery capability of unstructured data and the reusability of mapping information [52]. Thus, this study uses laws and regulations, political will and leadership, general public, and technical capacity as indicators to assess the sustainability of OGD under the environmental dimension.
2.3. Data Quality Dimension
Data quality has significant direct effects on OGD adoption and sustainable value generation [43,53]. Data quality is a measure of the data content and reusability provided by sustainable OGD, which is the basis for the public reuse of data [22]. Moreover, data quality is critical in the implementation of sustainable value generation [40,43]. OGD should provide complete, accurate, timely, and easy-to-use data to improve the quality of OGD services and increase public satisfaction [17,54]. Open data may conflict with privacy, security, and transparency. When opening government data, the data should be densified and access controlled [55]. Completeness refers to the type of OGD and the richness of datasets. The richer the open data, the more value can be generated by reusing data, while protecting national security, trade secrets, and personal privacy [18,20,22,23,56,57]. The value of big data in social domain can only be created if the outcomes are correctly interpreted [58].
Accuracy is a measure of the correctness of data. Only suitably accurate data can be used to make decisions for the public. Correct data can help the public to make scientific decisions [20,22,23,54,57]. Timeliness refers to whether OGD provides timely data updates, whether the data is up-to-date, the frequency and cycle of data updates, and when the last data update has been made. Data timeliness is one of the important indicators for data quality evaluation [22,23,54,56,57]. Understandability means that keywords, titles, and descriptions in OGD are easy to understand not only by experts, but also by the general public [18,20,22,53]. The public can only use the data after understanding OGD.
Accessibility means that the public has equal access to open data without having to be questioned about the desired purpose, and the use of the data is not restricted [15,56]. Data usability refers to the basic data format provided to facilitate public access, downloading, and reuse [18,20]. Data usability can be divided into three levels: non-machine format (such as PDF), automatically processed structured formats (such as XLS), and inclusion elements, structured format descriptions, and semantic formats of data (such as XML and RDF) [57]. Non-machine-formatted data could potentially hamper the efficient reuse of open data [22]. This study uses completeness, accuracy, timeliness, understandability, accessibility, and usability as indicators to assess the openness of government data under the data quality dimension.
2.4. Use Dimension
The use dimension evaluates the convenience of public access to an OGD platform. Simple and convenient operation results in a good experience for the public. The interface refers to the user’s experience when visiting an OGD website, and is evaluated based on the design of the platform. If the interface experience is good, the public’s satisfaction with OGD will increase [18,53]. The data index is used to classify the OGD platform dataset by subject, institution, data format, or other qualities, as well as keyword search and advanced search operation, whether the evaluation data classification directory is reasonable, the convenience of retrieval [18], and whether the online help function will be user-friendly [20].
Data acquisition refers to whether the public requires complicated operations, such as registration or filling in personal information. The public’s use of OGD is affected by whether the platform’s operation steps are simple and whether obtaining the data is complicated [18]. Data display refers to whether the OGD is displayed to users in various forms, provides personalized previews and information displays, and provides multi-language support, which all affect the reuse of OGD [20]. Interactive communication refers to whether the OGD website allows providers to collect dataset ratings and comments. The OGD platform should provide forums and other interactive communication functions to encourage the public to use OGD and improve service satisfaction [18]. Thus, this study uses the interface, index, acquisition, presentation, and instructiveness factors as indicators of the openness of government data in the use dimension.
2.5. Impact Dimension
Impact refers to the effects and value generated after the data are opened and utilized. This is the goal of OGD [24,44] and promotes sustainable OGD [12]. OGD generates benefits in social, political, and economic aspects [20]. Social impact is generated through public participation and their use of OGD. The OGD platform should allow the public to query relevant information quickly, simplify government workflow, improve work efficiency, and improve quality of life [20,27]. OGD can change the public from passively communicating to actively participating in the model by letting them supervise, negotiate, and participate in governance [3,59].
The government is the provider of OGD. OGD can improve the transparency of public administration and its procedures, reduce the abuse of public power, and help fight corruption. OGD stimulates and improves the government’s serviceability and improves public satisfaction [27,59]. OGD could advance the democratic process, promote sustainable development, and thus could have a political impact [20]. An enterprise information system could directly access the OGD platform and process the data to create new products, provide new services, and create new jobs, economic growth, and enterprise innovation to generate economic value [60]. For example, using the government’s open traffic data, enterprises could develop a “mobile bus” application, and enterprises could gain economic benefits. This study uses social impact, political influence, and economic impact as indicators to assess the openness of government data under the impact dimension. Table 1 shows all of the discussed indicators from the relevant literature used to assess sustainable OGD.
3. Methodology
This study established an evaluation model of sustainable OGD by introducing the DANP model, which integrates DEMATEL with ANP. The DANP method has been applied to construct evaluation models in education, marketing, traffic, and other fields [34,35,36,37,61]. It is the new method for building an evaluation model for the sustainability of OGD. We calculated the influential weights (IWs) of DANP to find the causal relationships associated with each dimension and criterion. We used the results to derive the INRM. Both the weights and the INRM could help Chinese government administrators to improve their priorities for improving OGD. The details of this have been described in the literature [34,61,62,63,64,65,66].
3.1. DEMATEL Method
The Geneva Battelle Research Center [67,68] first proposed DEMATEL to construct structural analysis models to solve specific societal problems. DEMATEL is used to identify the correlation between factors. An INRM is constructed to clarify the sources of effect indexes, and can be used to improve system performance [69,70,71]. The details are as follows.
Step 1: Build the average direct influence relation matrix A = . Questionnaires were used to collect data, and indicators were compared in pairs. Experts were invited to select the degree of influence, as well as positive and negative directions according to the scale. The results were recorded in the form of a matrix. Scales of 0–4 were used to represent the range from “absolutely no influence” (0) to “very high influence” (4). The number of experts is H, and the number of factors (the criteria) is n. The average scores of the H experts were , is the degree of direct influence of the criterion i on the criterion j, and is the score of the expert k. The direct influence–relation average matrix A is obtained by calculating the average of the same factor in N matrices of the respondents. A is expressed in Equation (1), where n is the number of criteria.
Step 2: Formulate the normalizing direct influence–relation average matrix X. We obtained the normalized initial direct influence–relation matrix X by normalizing the average matrix A. X is the product of s and A, and is obtained from Equations (2) and (3).
Step 3: Construct the total influence matrix T. In Equation (4), the total influence relation matrix is an matrix formed as , and I is an unit matrix. Element is the degree of direct influence of the criterion i on criterion j.
Step 4: Obtain the INRM using the total matrix T. Using Equations (5) and (6), we can calculate each column sum (cj) and row sum (ri) from matrix T.
The cj is the sum of the direct and indirect influences of factor j on the other factors in matrix T, which is called the degree of influence. ri is the sum of direct and indirect influences of other factors on factor i in matrix T, which is called the degree of effect. When i = j, ri + ci reflects the intensity affected given by and received from factor i; that is, the centrality of index i. ri – ci is called the degree of causality. Clearly, if ri – ci is greater than zero, the criterion i is an influencing element, but if ri – ci is less than zero, the criterion i is an effective element [33]. Consequently, based on ri + ci and ri – ci, we can draw the INRM.
Step 5: Derive the total influence relation matrices TC, based on criteria, and TD, based on dimensions. The matrix T can be transformed into TC (as shown in Equation (7)) based on the criteria and TD (as shown in Equation (8)) based on the dimensions. n is the number of dimensions, and mi is the number of criteria in dimension i.
3.2. Obtaining the Influence Weights through the DANP
In 1996, Satty proposed ANP based on AHP. The ANP technique is used to build un-weighted and weighted super-matrices that consider the mutual influence of various factors or adjacent layers. Nevertheless, there are some weaknesses in the original ANP technique. First, we must assume the relationship structure of the evaluation system before using ANP. Second, the ANP questionnaire is difficult to understand, due to its complexity [72] and the time-consuming process of pairwise comparison. Thus, consistent results are difficult to obtain. Third, the hypothesis that every dimension has the same weight seems unreasonable because of conflicts of influence among the dimensions, or because the clusters are different in the real world [73]. Accordingly, the DEMATEL-based ANP (DANP) was proposed by Tzeng et al. [60,61,74] to solve these problems. The DANP method is used to solve real-world problems with feedback and interaction between criteria or dimensions, and to determine the affecting weights [61,62,63,75,76]. The DANP technique is summarized as follows.
Step 6: Construct the unweighted super-matrix W. The matrix can be obtained by normalizing matrix TC, which is shown in Equation (7). For example, , which is a submatrix of TC, can be normalized into , as shown in Equations (9) and (10). The matrix can be transposed to an unweighted matrix super-matrix Wpq, as shown in Equation (12).
For example, , which is a submatrix of TC, can be normalized into , as shown in Equation (9) and Equation (10).
![Sustainability 11 02388 i001]()

The matrix can be transposed to unweighted matrix super-matrix Wpq, as shown in Equation (12).
Step 7: Calculate the weighted super-matrix . Referring to step 5, we can calculate the total influence–relation matrix of the dimension’s matrix, TD. Matrix can be obtained by dividing the matrix TD by , i = 1, 2, …, n, as shown in Equations (13) and (14). The weighted super-matrix can be obtained from the normalized total influence–relation matrix and the un-weighted super-matrix Wpq, as shown in Equation (15).
![Sustainability 11 02388 i002]()

The weighted super-matrix can be gained by the normalized total influence–relation matrix and the un-weighted super-matrix Wpq, as described in Equation (15).
Step 8: Limit weighted super-matrix . If the weighted super-matrix is multiplied by itself many times, we can obtain the limit super-matrix, which converges and becomes stable. Therefore, we can find the IWs (also called the DANP weights) by using Equation (16), where λ is the number of multiplication iterations.
4. Data Analysis and Results
Data were collected from 10 experts to obtain the average matrix (Table A1 of Appendix A). The details of the questionnaire for the data collection are illustrated in Appendix B. The DEMATEL method was then used to calculate the influential relationships among dimensions and criteria based on pairwise comparisons (Table A1), and the INRM was constructed. Finally, the influential weights of the dimensions and criteria were determined by DANP.
4.1. Descriptive Analysis of Data Collection
We collected data from 10 experts who have more than 10 years of experience in the OGD industry. Four of the experts were government officials engaged in OGD management, three were scholars engaged in OGD-related research, and three were senior managers who use OGD for application-development enterprises. We collected all standard data through an expert questionnaire in July 2018. Every expert took 40–60 min to complete the survey. The average matrix A was calculated from the means of all experts’ responses to the questionnaires, and is presented in Table A1 in Appendix A. The confidence level of the 10 questionnaires was 95.3% (a little more than 95%), and consistency gaps were 4.7% (little smaller than 5%). The results show that there is a good consistency, and the 10 questionnaires can reflect most real situations.
4.2. Assembling the Influence Network via the DEMATEL Method
Using Equations (2) and (3), we can obtain the normalized directed-relation matrix. Consequently, the total influence matrix T can be calculated with Equation (4). Table A2 in Appendix A presents the equations, which show that all of the criteria of the relationships have complex interrelationships. We can calculate the matrix of overall influence dimensions by averaging the influence matrix T within each dimension. Table A3 in Appendix A shows the detailed steps. Table A4 indicates the sum of influences given by and received from the criteria and dimensions. We obtained the sum using Equations (5) and (6) in step 4.
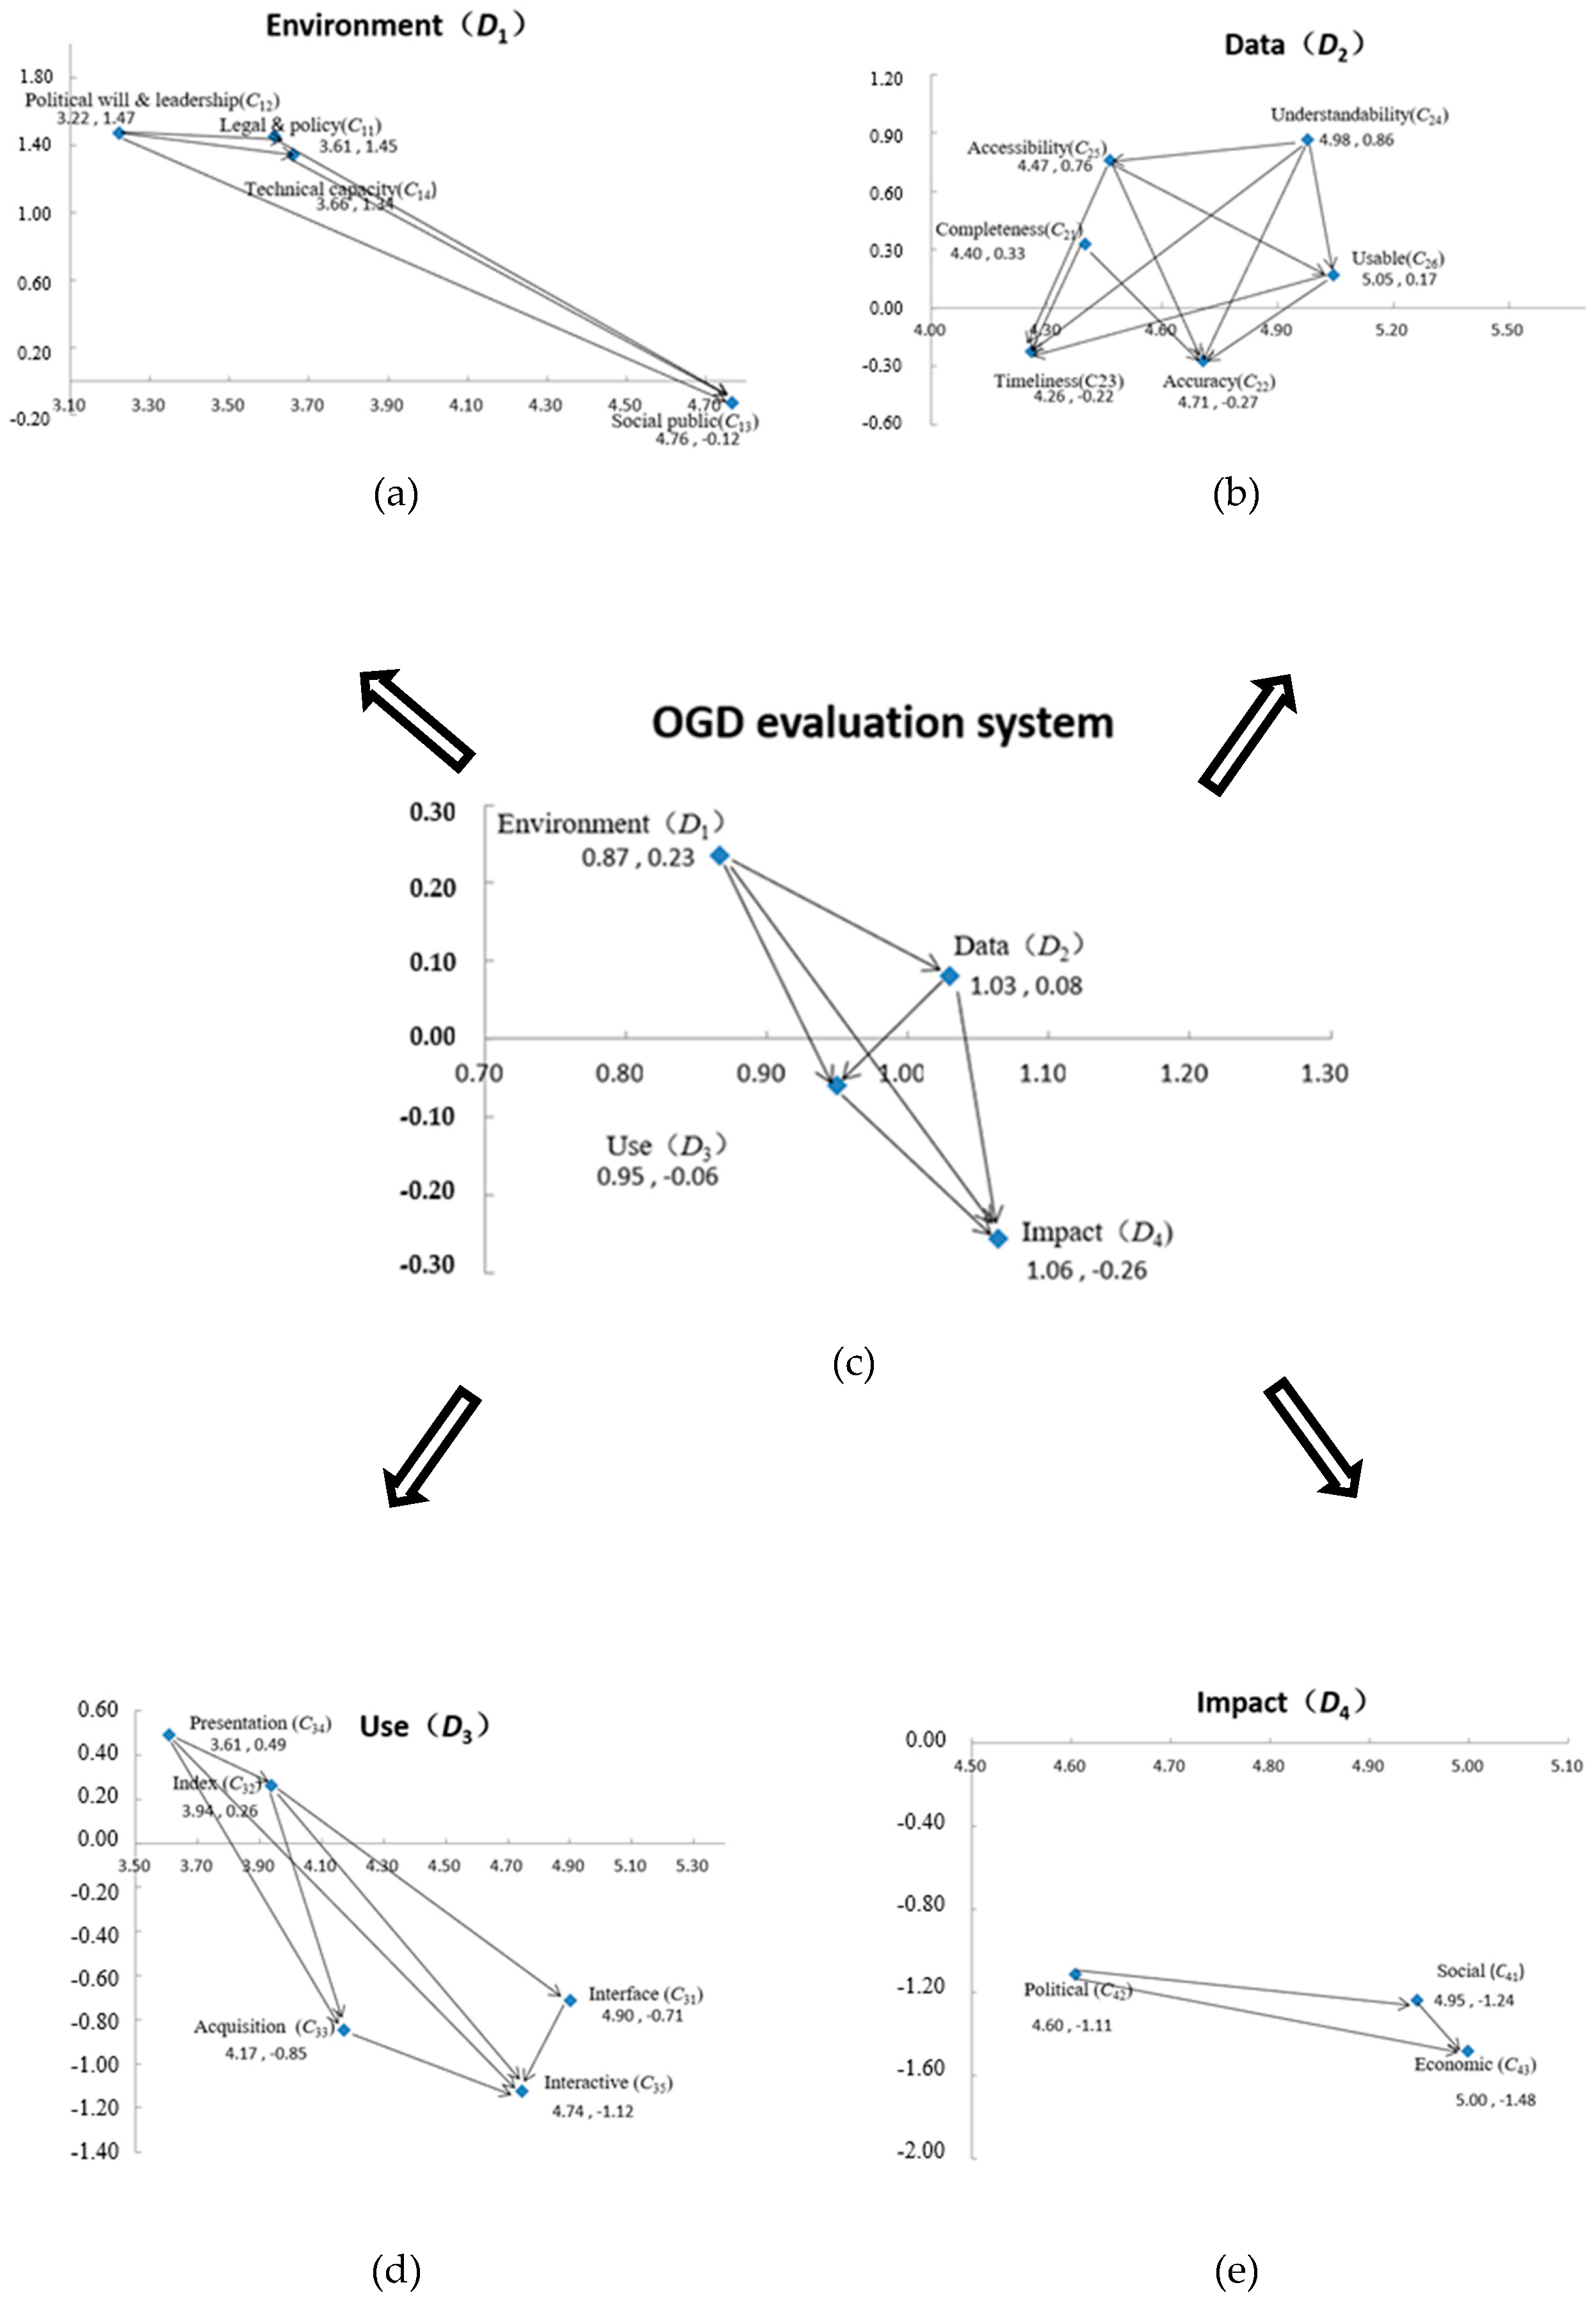
Table A4 shows that “environment” (D1) (ri – ci) had the largest positive value (0.234), which indicates the most influential dimension in the OGD evaluation system. Furthermore, the environment has a deep influence on the other dimensions. However, “impact” (D4) (ri – ci) had the smallest negative value (−0.306), which indicates it is the most easily influenced by other dimensions. Accordingly, “environment” should be considered a crucial factor in OGD improvement, and “impact” should be considered as the affected dimension. In addition, “data” (D2) (ri + ci) had the highest positive value (1.129). “Data” should be considered the most interactive relationship with other dimensions, and had the most interactive dimension from the perspective of experts.
It is well acknowledged that the environment of laws, policies, political will, and leadership influence the completeness of opening data, the usability of data, and other factors [29]. By reusing government data, stakeholders create new value that is impacted by data attributes, such as completeness, accuracy, timeliness, understandability, accessibility, and usability of data [58]. Therefore, data affects the other dimensions, such as use and impact, and is also affected by the environment. In contrast, “environment” (D1) (ri + ci) had the lowest relation (0.867) to other dimensions, meaning that it has the smallest total degree of influence among the dimensions. From Table A4, the INRM can be drawn by illustrating the influence network relationship of the four dimensions and 18 criteria, as shown in Figure 1.
4.3. Discovering the Influential Weights in DANP
The influential weights can be calculated from Equation (16), as shown in Table 2. The results indicate that “impact” (D4) has the largest IW, followed by “use” (D3), “data” (D2), and “environment” (D1). The “economic” (C43) (12.3%), “social” (C41) (11.22%), and “political” (C42) (10.77%) criteria are the three most significant, followed by “interactive” (C35), “general public” (C13), and “interface” (C31). On the other hand, “political will and leadership” (C12) (2.18%), “laws and policy” (C11) (2.82%), and “technical capacity” (C14) (2.99%) are the least important criteria in the OGD sustainability evaluation system.
5. Discussion and Implications
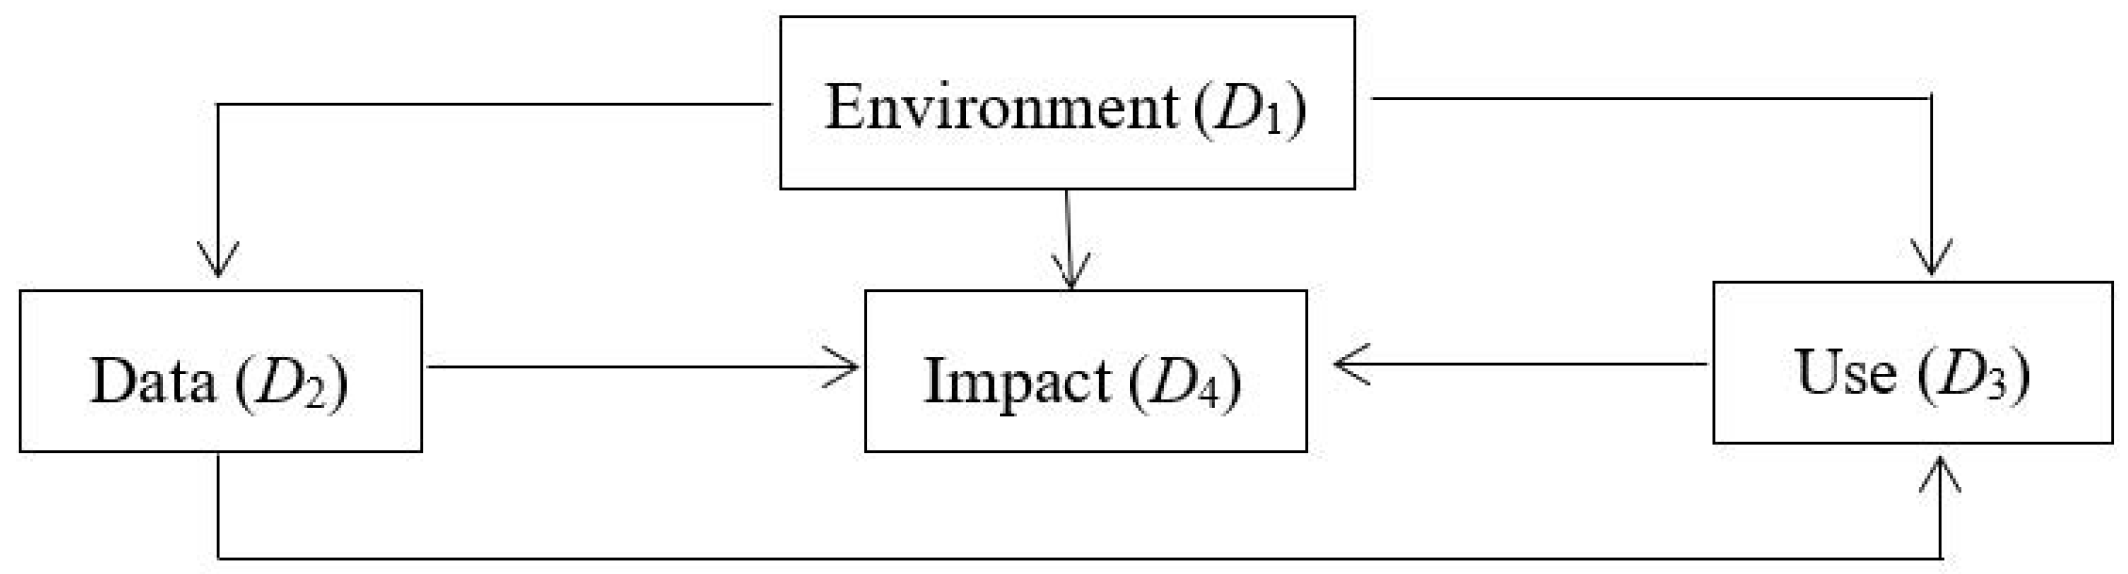
The evaluation system for OGD sustainability is illustrated in Figure 1, with “environment” (D1) on the top and “impact” (D4) on the bottom. “Environment” (D1) influences other dimensions, such as “data” (D2), “use” (D3), and “impact” (D4). This shows that “environment” (D1) is the main influential factor that affects the other dimensions, such as “data” (D2), “use” (D3), and “impact (D4).” “Impact” (D4) is an important result factor that is influenced by “environment” (D1), “data” (D2), and “use” (D3). “Data” (D2) is on the left, and is a mixed factor that influences “impact” (D4) and is influenced by “environment” (D1) and “use” (D3).
The major influence route between dimensions can also be formed, as shown in Figure 2, where the primary cause is “environment” (D1), and “impact” (D4) is located in the center of the OGD sustainability evaluation system. This means that “environment” (D1) is the most important influential factor. Therefore, the environment is the basis of OGD that provides useful conditions. To improve the sustainability of OGD, the government should strengthen environmental development. Furthermore, “impact” (D4) was affected by other dimensions, which means that it is an important element. Using the DANP method, we can calculate the IWs shown Table 2. “Impact” (D4) and “use” (D3) are the two most important dimensions, and the cumulative total proportion is 61.5% in the OGD sustainability evaluation system. Therefore, the government should consider the usability of the OGD platform, and make it easy to use for public operation and data reuse. Improving the impact of OGD will create social value, political value, and economic value, and will promote sustainable OGD.
Figure 1 shows that the factors that affect other indicators in each dimension criterion are “political will and leadership” (C12), “understandability” (C24), “presentation” (C34), and “political” (C42). Notably, “political will and leadership” (C12) has the highest priority, because OGD requires strong government political will and leadership [8,35]. In the “environment” (D1) dimension, “political will and leadership” (C12) influences “laws and policy” (C11), “social public” (C13), and “technical capacity” (C14), while “general public” (C13) is affected by other criteria. Thus, to improve the sustainability of OGD, government administrators must have a strong will and political leadership.
Moreover, “understandability” (C24) also deserves further attention, because users can only utilize data if they understand it. Therefore, the data description should be simple and easy for the public to understand. Government offices should also consider “presentation” (C34) because the data format is very important for the reuse of data. The OGD platform should provide a machine-readable format such as XLS, CSV, JSON, or XML. Citizens and organizations that access the data interface could develop applications to create value and to achieve the goals of OGD [3]. Furthermore, additional attention should be given to the “political” factor (C42). Political values, such as government transparency and public participation, are conducive to creating social and economic value.
The IWs between dimensions were calculated by DANP to evaluate OGD sustainability (Table 2), and the dimensions have the following ranking in terms of priority for making improvements: “impact” (D4), “use” (D3), “data” (D2), and “environment” (D1). For government officials, the result is clear and simple, and provides improved prioritization for many complex criteria. “Economic” (C43), “social” (C41), and “political” (C42) are the three most significant criteria, with weights of 0.123, 0.1122, and 0.1077, respectively. These indicators constitute the “impact” (D4) dimension. The format and timeliness of OGD are the basis of data utilization. The government should provide a variety of machine-readable data formats and update the data promptly to eliminate “zombie” data. Citizens and organizations should be able to reuse the open data easily to create economic value by downloading or directly importing it to their computer systems. The government should open as much data as possible in all areas to improve government transparency and generate political value.
Furthermore, the following three criteria are important: “interactive” (C35), “general public” (C13), and “interface” (C31)”, which have weights of 0.0676, 0.0666, and 0.0664, respectively. Hence, government officials should pay attention to the interactive functions and improve the user-friendliness of the OGD platform’s interface operations. Strengthening personal privacy protection in the process of OGD could enhance users’ trust and increase the degree of public support and participation in OGD. The three indicators with the weakest weights were “political will and leadership” (C12), “laws and policy” (C11), and “technical capacity” (C14), which had weights of 0.0218, 0.0282, and 0.0299, respectively. Thus, these three indicators play relatively small roles in the OGD sustainability evaluation system.
For long-term enhancement, the government should play a leading role in the continuous opening of government data, which requires strong political will and leadership in the government. Therefore, the government should pay full attention to OGD, actively promote it, and provide corresponding policy and technical support. This study shows that social, political, and economic value are important indicators for the evaluation of OGD sustainability. Therefore, government officers should promote the value generated by data.
6. Conclusions
This study used 18 criteria to establish an evaluation system for OGD sustainability. The results indicated that “environment” (D1) is the main factor that influences other dimensions, and “impact” (D4) is an important result. The three most significant criteria were the “economic” (C43),” “social” (C41),” and “political” (C42) criteria, which had about 34% of the total evaluation weight. A new mixed model was constructed as an evaluation system of OGD sustainability by integrating the DEMATEL and DANP methods. We identified complex relationships among criteria dimensions, and the INRM was constructed using the DEMATEL method. The INRM can reflect the causal relationships between the dimensions and criteria. The IWs of the dimensions and criteria can be calculated by applying the DANP method. Some limitations remain that require further study. First, this study only established an evaluation system for OGD sustainability, but the model was not applied to evaluate an OGD project. Therefore, in the future, to validate the model and improve the sustainability of OGD, we will apply this system to evaluate existing cases of OGD. Second, the assessment model included environment, data, use, and impact dimensions. The other possible dimensions of sustainability of OGD were not considered, such as data security or privacy protection. The other dimensions could be included to improve the evaluation model in the future work. Third, to help government managers identify the key factors and priorities for improving the sustainability of OGD, we calculated the weights of dimensions and criteria using the DANP method. Future studies could use additional multi-criteria approaches, such as data envelopment analysis (DEA), to estimate the relative IWs for the sustainability of OGD. The results of these studies could then be compared with those presented here.
Author Contributions
H.J. designed the research and drafted the manuscript; Q.S. interviewed experts and collected data; J.J.H.L. provided the research technique and method; T.S. analyzed data; X.S. collected relevant literature and polished the language; J.J.H.L. revised the paper.
Funding
This research was funded by the National Statistical Science Research General Project under Grant 2018LY64, China; Youth Project of the Humanities and Social Sciences of the Ministry of Education under Grant 18YJC630140, China.
Acknowledgments
The authors are extremely grateful for the Sustainability Journal editorial team’s valuable comments on improving the quality of this article.
Conflicts of Interest
The authors declare no conflict of interest.
Appendix A. Results in Detail
We used the DEMATEL-based ANP (DANP) method to establish the evaluation structure for the sustainability of OGD and analyze the relationships and degree of influence of the four dimensions and 18 criteria. We collected questionnaires from 10 experts and obtained an 18 × 18 average initial direct influence matrix A to form the average responses, as shown in Table A1. Table A2 and Table A3 show the degree of influence among the 18 criteria and the influential relations among the four dimensions. Table A4 presents the sum of influences received or given from four dimensions and criteria within their dimension. The dimension of “environment” (D2) had the largest net influence (ri – ci) among all dimensions, so it is the main influencing dimension in the OGD evaluation system. The weights of criteria were calculated according to the specific steps of DANP. Table A5 presents the unweighted super-matrix, which was obtained by transposing the normalized influence matrix Tc, based on Equations (9)–(12). The weighted super-matrix W can be obtained using Equations (13)–(15), as shown in Table A6.

Table A1.
The average direct influence relation matrix A.
| C11 | C12 | C13 | C14 | C21 | C22 | C23 | C24 | C25 | C26 | C31 | C32 | C33 | C34 | C35 | C41 | C42 | C43 | |
|---|---|---|---|---|---|---|---|---|---|---|---|---|---|---|---|---|---|---|
| C11 | 0.000 | 3.700 | 3.500 | 3.600 | 1.300 | 2.600 | 0.600 | 1.500 | 1.400 | 1.100 | 0.900 | 0.900 | 0.900 | 0.000 | 1.000 | 0.800 | 0.500 | 0.700 |
| C12 | 3.000 | 0.000 | 3.000 | 3.800 | 1.200 | 1.500 | 1.500 | 1.400 | 1.500 | 1.000 | 1.700 | 1.100 | 1.200 | 0.000 | 0.000 | 0.700 | 0.000 | 0.500 |
| C13 | 3.500 | 2.600 | 0.000 | 2.800 | 1.500 | 1.400 | 1.100 | 0.800 | 1.200 | 1.000 | 0.900 | 1.300 | 1.200 | 0.800 | 0.700 | 0.400 | 0.400 | 1.500 |
| C14 | 3.000 | 2.600 | 3.200 | 0.000 | 2.400 | 1.200 | 1.300 | 1.500 | 1.400 | 1.200 | 1.100 | 1.300 | 1.300 | 1.000 | 0.400 | 0.700 | 0.400 | 0.900 |
| C21 | 0.000 | 0.300 | 1.000 | 0.000 | 0.000 | 2.800 | 1.900 | 2.700 | 1.800 | 3.200 | 2.000 | 2.100 | 2.200 | 1.000 | 0.500 | 1.100 | 0.500 | 0.900 |
| C22 | 0.300 | 0.000 | 1.000 | 0.200 | 1.700 | 0.000 | 1.700 | 2.400 | 1.700 | 2.700 | 1.800 | 1.600 | 1.600 | 0.600 | 1.200 | 1.300 | 1.100 | 1.600 |
| C23 | 0.000 | 0.000 | 1.000 | 0.400 | 1.800 | 1.600 | 0.000 | 2.000 | 2.400 | 2.000 | 2.300 | 1.600 | 1.700 | 0.400 | 0.400 | 0.700 | 0.200 | 1.900 |
| C24 | 0.000 | 0.400 | 0.700 | 0.000 | 2.400 | 2.500 | 2.400 | 0.000 | 2.400 | 2.100 | 3.400 | 2.700 | 2.900 | 2.800 | 1.000 | 2.200 | 0.800 | 2.300 |
| C25 | 0.300 | 0.400 | 1.000 | 0.000 | 2.100 | 2.000 | 2.300 | 2.800 | 0.000 | 2.500 | 2.900 | 1.700 | 1.700 | 2.500 | 1.400 | 0.900 | 0.600 | 1.700 |
| C26 | 0.200 | 0.000 | 1.000 | 0.800 | 1.500 | 1.800 | 2.100 | 1.700 | 1.600 | 0.000 | 3.600 | 2.800 | 2.100 | 2.500 | 1.000 | 2.100 | 1.000 | 1.800 |
| C31 | 0.100 | 0.000 | 0.800 | 0.000 | 0.500 | 1.300 | 1.400 | 0.500 | 0.900 | 1.500 | 1.800 | 1.600 | 2.200 | 0.000 | 1.800 | 3.000 | 2.300 | 2.900 |
| C32 | 0.100 | 0.000 | 0.900 | 0.000 | 0.600 | 1.100 | 1.100 | 0.500 | 0.200 | 1.500 | 1.600 | 1.500 | 2.300 | 2.900 | 0.000 | 3.200 | 2.100 | 3.200 |
| C33 | 0.000 | 0.000 | 0.600 | 0.200 | 0.800 | 0.600 | 0.700 | 0.300 | 0.000 | 1.300 | 1.700 | 1.600 | 2.100 | 2.600 | 1.700 | 0.000 | 1.200 | 2.400 |
| C34 | 0.200 | 0.000 | 3.200 | 0.400 | 0.800 | 0.500 | 0.400 | 0.500 | 0.300 | 1.400 | 1.500 | 1.100 | 2.000 | 2.800 | 1.900 | 2.200 | 0.000 | 2.500 |
| C35 | 0.900 | 0.000 | 3.100 | 0.200 | 0.400 | 0.700 | 0.200 | 0.400 | 0.000 | 1.000 | 1.800 | 1.300 | 1.600 | 1.600 | 2.000 | 2.300 | 1.600 | 0.000 |
| C41 | 0.000 | 0.200 | 1.100 | 0.000 | 1.200 | 1.300 | 1.000 | 1.100 | 1.400 | 1.300 | 0.000 | 2.300 | 2.700 | 1.400 | 0.800 | 1.400 | 0.700 | 1.500 |
| C42 | 0.400 | 0.000 | 1.300 | 0.600 | 0.800 | 1.600 | 1.600 | 0.700 | 0.600 | 0.100 | 1.500 | 0.000 | 2.800 | 2.300 | 1.100 | 1.000 | 0.700 | 1.300 |
| C43 | 0.500 | 0.500 | 0.900 | 0.900 | 0.600 | 1.500 | 1.500 | 0.900 | 0.600 | 0.500 | 1.200 | 2.000 | 0.000 | 2.400 | 0.900 | 1.000 | 0.700 | 1.700 |
Note: The average gap ratio in consensus (%) = *100% = 4.7 < 5%, where k is the number of criteria (m = 18), s is the number of experts (s = 10), and significant confidence reached 95.3% (more than 95%).
Table A2.
Total influence matrix of criteria T.
| C11 | C12 | C13 | C14 | C21 | C22 | C23 | C24 | C25 | C26 | C31 | C32 | C33 | C34 | C35 | C41 | C42 | C43 | |
|---|---|---|---|---|---|---|---|---|---|---|---|---|---|---|---|---|---|---|
| C11 | 0.068 | 0.161 | 0.218 | 0.172 | 0.137 | 0.190 | 0.122 | 0.142 | 0.130 | 0.143 | 0.163 | 0.153 | 0.166 | 0.116 | 0.105 | 0.068 | 0.161 | 0.218 |
| C12 | 0.146 | 0.054 | 0.195 | 0.172 | 0.128 | 0.153 | 0.139 | 0.133 | 0.128 | 0.131 | 0.175 | 0.150 | 0.164 | 0.107 | 0.071 | 0.146 | 0.054 | 0.195 |
| C13 | 0.157 | 0.126 | 0.110 | 0.143 | 0.132 | 0.148 | 0.125 | 0.113 | 0.116 | 0.129 | 0.150 | 0.152 | 0.163 | 0.129 | 0.092 | 0.157 | 0.126 | 0.110 |
| C14 | 0.146 | 0.127 | 0.205 | 0.065 | 0.164 | 0.152 | 0.140 | 0.140 | 0.129 | 0.144 | 0.168 | 0.163 | 0.177 | 0.144 | 0.089 | 0.146 | 0.127 | 0.205 |
| C21 | 0.035 | 0.035 | 0.120 | 0.038 | 0.087 | 0.187 | 0.155 | 0.168 | 0.134 | 0.197 | 0.196 | 0.188 | 0.205 | 0.154 | 0.093 | 0.035 | 0.035 | 0.120 |
| C22 | 0.042 | 0.026 | 0.117 | 0.042 | 0.130 | 0.099 | 0.141 | 0.151 | 0.123 | 0.176 | 0.180 | 0.164 | 0.179 | 0.136 | 0.110 | 0.042 | 0.026 | 0.117 |
| C23 | 0.031 | 0.024 | 0.109 | 0.043 | 0.127 | 0.138 | 0.084 | 0.135 | 0.138 | 0.148 | 0.183 | 0.154 | 0.170 | 0.118 | 0.079 | 0.031 | 0.024 | 0.109 |
| C24 | 0.042 | 0.042 | 0.135 | 0.045 | 0.171 | 0.200 | 0.188 | 0.106 | 0.164 | 0.189 | 0.262 | 0.231 | 0.257 | 0.233 | 0.129 | 0.042 | 0.042 | 0.135 |
| C25 | 0.047 | 0.041 | 0.131 | 0.042 | 0.154 | 0.175 | 0.174 | 0.177 | 0.088 | 0.188 | 0.233 | 0.188 | 0.206 | 0.207 | 0.128 | 0.047 | 0.041 | 0.131 |
| C26 | 0.046 | 0.030 | 0.133 | 0.064 | 0.135 | 0.165 | 0.165 | 0.142 | 0.131 | 0.112 | 0.248 | 0.216 | 0.216 | 0.208 | 0.118 | 0.046 | 0.030 | 0.133 |
| C31 | 0.030 | 0.027 | 0.106 | 0.031 | 0.099 | 0.119 | 0.105 | 0.098 | 0.099 | 0.117 | 0.103 | 0.163 | 0.188 | 0.139 | 0.087 | 0.030 | 0.027 | 0.106 |
| C32 | 0.042 | 0.024 | 0.109 | 0.048 | 0.084 | 0.122 | 0.115 | 0.082 | 0.073 | 0.078 | 0.137 | 0.089 | 0.182 | 0.155 | 0.091 | 0.042 | 0.024 | 0.109 |
| C33 | 0.046 | 0.038 | 0.101 | 0.058 | 0.079 | 0.120 | 0.113 | 0.088 | 0.074 | 0.090 | 0.131 | 0.147 | 0.102 | 0.158 | 0.086 | 0.046 | 0.038 | 0.101 |
| C34 | 0.030 | 0.027 | 0.106 | 0.031 | 0.099 | 0.119 | 0.105 | 0.098 | 0.099 | 0.117 | 0.103 | 0.163 | 0.188 | 0.139 | 0.087 | 0.030 | 0.027 | 0.106 |
| C35 | 0.042 | 0.024 | 0.109 | 0.048 | 0.084 | 0.122 | 0.115 | 0.082 | 0.073 | 0.078 | 0.137 | 0.089 | 0.182 | 0.155 | 0.091 | 0.042 | 0.024 | 0.109 |
| C41 | 0.030 | 0.027 | 0.106 | 0.031 | 0.099 | 0.119 | 0.105 | 0.098 | 0.099 | 0.117 | 0.103 | 0.163 | 0.188 | 0.139 | 0.087 | 0.030 | 0.027 | 0.106 |
| C42 | 0.042 | 0.024 | 0.109 | 0.048 | 0.084 | 0.122 | 0.115 | 0.082 | 0.073 | 0.078 | 0.137 | 0.089 | 0.182 | 0.155 | 0.091 | 0.042 | 0.024 | 0.109 |
| C43 | 0.046 | 0.038 | 0.101 | 0.058 | 0.079 | 0.120 | 0.113 | 0.088 | 0.074 | 0.090 | 0.131 | 0.147 | 0.102 | 0.158 | 0.086 | 0.046 | 0.038 | 0.101 |
Table A3.
Total influence matrix of dimensions TD.
| D1 | D2 | D3 | D4 | |
|---|---|---|---|---|
| D1 | 0.142 | 0.138 | 0.109 | 0.162 |
| D2 | 0.061 | 0.148 | 0.142 | 0.204 |
| D3 | 0.059 | 0.090 | 0.140 | 0.155 |
| D4 | 0.055 | 0.098 | 0.113 | 0.138 |
Table A4.
Sum of influences given and received on criteria and dimensions.
| Dimensions | ri | ci | ri + ci | ri – ci | Criteria | ri | ci | ri + ci | ri – ci |
|---|---|---|---|---|---|---|---|---|---|
| D1 | 0.550 | 0.316 | 0.867 | 0.234 | C11 | 2.532 | 1.081 | 3.613 | 1.451 |
| C12 | 2.345 | 0.876 | 3.221 | 1.469 | |||||
| C13 | 2.320 | 2.444 | 4.764 | −0.124 | |||||
| C14 | 2.501 | 1.159 | 3.660 | 1.343 | |||||
| D2 | 0.613 | 0.516 | 1.129 | 0.097 | C21 | 2.365 | 2.035 | 4.400 | 0.330 |
| C22 | 2.217 | 2.490 | 4.707 | −0.273 | |||||
| C23 | 2.018 | 2.241 | 4.259 | −0.223 | |||||
| C24 | 2.920 | 2.058 | 4.978 | 0.863 | |||||
| C25 | 2.611 | 1.854 | 4.465 | 0.758 | |||||
| C26 | 2.607 | 2.438 | 5.046 | 0.169 | |||||
| D3 | 0.454 | 0.541 | 0.995 | −0.087 | C31 | 2.094 | 2.807 | 4.901 | −0.713 |
| C32 | 2.099 | 1.838 | 3.937 | 0.262 | |||||
| C33 | 1.663 | 2.509 | 4.172 | −0.846 | |||||
| C34 | 2.049 | 1.558 | 3.607 | 0.491 | |||||
| C35 | 1.810 | 2.934 | 4.744 | −1.124 | |||||
| D4 | 0.409 | 0.715 | 1.124 | −0.306 | C41 | 1.854 | 3.094 | 4.948 | −1.239 |
| C42 | 1.746 | 2.858 | 4.604 | −1.112 | |||||
| C43 | 1.759 | 3.240 | 4.999 | −1.482 |
Table A5.
The un-weighted super-matrix .
| C11 | C12 | C13 | C14 | C21 | C22 | C23 | C24 | C25 | C26 | C31 | C32 | C33 | C34 | C35 | C41 | C42 | C43 | |
|---|---|---|---|---|---|---|---|---|---|---|---|---|---|---|---|---|---|---|
| C11 | 0.109 | 0.260 | 0.352 | 0.278 | 0.159 | 0.220 | 0.141 | 0.165 | 0.151 | 0.165 | 0.338 | 0.317 | 0.345 | 0.204 | 0.184 | 0.222 | 0.137 | 0.252 |
| C12 | 0.258 | 0.095 | 0.344 | 0.303 | 0.158 | 0.188 | 0.171 | 0.164 | 0.158 | 0.161 | 0.357 | 0.306 | 0.336 | 0.224 | 0.148 | 0.239 | 0.121 | 0.268 |
| C13 | 0.293 | 0.234 | 0.206 | 0.267 | 0.173 | 0.194 | 0.164 | 0.148 | 0.152 | 0.169 | 0.323 | 0.327 | 0.350 | 0.231 | 0.165 | 0.195 | 0.128 | 0.280 |
| C14 | 0.268 | 0.234 | 0.377 | 0.120 | 0.189 | 0.175 | 0.161 | 0.161 | 0.149 | 0.166 | 0.330 | 0.322 | 0.349 | 0.248 | 0.153 | 0.214 | 0.130 | 0.256 |
| C21 | 0.153 | 0.153 | 0.527 | 0.168 | 0.093 | 0.202 | 0.167 | 0.181 | 0.144 | 0.213 | 0.333 | 0.319 | 0.348 | 0.248 | 0.151 | 0.225 | 0.131 | 0.246 |
| C22 | 0.185 | 0.114 | 0.517 | 0.184 | 0.158 | 0.120 | 0.172 | 0.185 | 0.151 | 0.215 | 0.344 | 0.314 | 0.342 | 0.211 | 0.169 | 0.217 | 0.147 | 0.256 |
| C23 | 0.151 | 0.116 | 0.524 | 0.209 | 0.164 | 0.179 | 0.109 | 0.176 | 0.179 | 0.193 | 0.361 | 0.304 | 0.334 | 0.222 | 0.149 | 0.209 | 0.117 | 0.302 |
| C24 | 0.159 | 0.159 | 0.512 | 0.170 | 0.168 | 0.196 | 0.184 | 0.105 | 0.161 | 0.186 | 0.349 | 0.308 | 0.343 | 0.261 | 0.144 | 0.222 | 0.122 | 0.250 |
| C25 | 0.180 | 0.156 | 0.504 | 0.159 | 0.161 | 0.183 | 0.182 | 0.185 | 0.092 | 0.197 | 0.372 | 0.300 | 0.328 | 0.270 | 0.167 | 0.193 | 0.122 | 0.248 |
| C26 | 0.167 | 0.111 | 0.487 | 0.235 | 0.159 | 0.194 | 0.194 | 0.167 | 0.154 | 0.132 | 0.364 | 0.318 | 0.318 | 0.259 | 0.147 | 0.224 | 0.131 | 0.239 |
| C31 | 0.173 | 0.111 | 0.551 | 0.166 | 0.133 | 0.196 | 0.190 | 0.134 | 0.138 | 0.208 | 0.329 | 0.302 | 0.369 | 0.150 | 0.168 | 0.246 | 0.173 | 0.264 |
| C32 | 0.172 | 0.109 | 0.555 | 0.164 | 0.144 | 0.199 | 0.187 | 0.139 | 0.112 | 0.220 | 0.320 | 0.300 | 0.380 | 0.245 | 0.095 | 0.242 | 0.158 | 0.261 |
| C33 | 0.159 | 0.110 | 0.534 | 0.198 | 0.165 | 0.187 | 0.180 | 0.135 | 0.105 | 0.228 | 0.323 | 0.306 | 0.371 | 0.272 | 0.180 | 0.135 | 0.146 | 0.268 |
| C34 | 0.151 | 0.098 | 0.583 | 0.168 | 0.164 | 0.180 | 0.161 | 0.146 | 0.125 | 0.224 | 0.328 | 0.292 | 0.380 | 0.260 | 0.176 | 0.222 | 0.087 | 0.256 |
| C35 | 0.207 | 0.097 | 0.550 | 0.146 | 0.154 | 0.205 | 0.157 | 0.150 | 0.115 | 0.219 | 0.344 | 0.302 | 0.355 | 0.230 | 0.197 | 0.246 | 0.165 | 0.161 |
| C41 | 0.152 | 0.141 | 0.545 | 0.161 | 0.156 | 0.187 | 0.164 | 0.154 | 0.156 | 0.183 | 0.227 | 0.359 | 0.414 | 0.245 | 0.153 | 0.220 | 0.131 | 0.252 |
| C42 | 0.187 | 0.106 | 0.489 | 0.217 | 0.151 | 0.220 | 0.208 | 0.148 | 0.132 | 0.141 | 0.337 | 0.217 | 0.446 | 0.277 | 0.163 | 0.195 | 0.129 | 0.236 |
| C43 | 0.189 | 0.158 | 0.414 | 0.239 | 0.141 | 0.212 | 0.200 | 0.156 | 0.132 | 0.160 | 0.344 | 0.386 | 0.269 | 0.277 | 0.151 | 0.193 | 0.127 | 0.252 |
Table A6.
The weighted super-matrix Ww.
| C11 | C12 | C13 | C14 | C21 | C22 | C23 | C24 | C25 | C26 | C31 | C32 | C33 | C34 | C35 | C41 | C42 | C43 | |
|---|---|---|---|---|---|---|---|---|---|---|---|---|---|---|---|---|---|---|
| C11 | 0.028 | 0.066 | 0.075 | 0.069 | 0.017 | 0.020 | 0.017 | 0.017 | 0.020 | 0.018 | 0.021 | 0.026 | 0.026 | 0.023 | 0.023 | 0.021 | 0.020 | 0.027 |
| C12 | 0.067 | 0.024 | 0.060 | 0.060 | 0.017 | 0.013 | 0.013 | 0.017 | 0.017 | 0.012 | 0.019 | 0.014 | 0.022 | 0.015 | 0.014 | 0.015 | 0.013 | 0.013 |
| C13 | 0.091 | 0.088 | 0.053 | 0.097 | 0.058 | 0.057 | 0.057 | 0.056 | 0.055 | 0.053 | 0.074 | 0.067 | 0.056 | 0.073 | 0.074 | 0.071 | 0.077 | 0.073 |
| C14 | 0.072 | 0.078 | 0.069 | 0.031 | 0.018 | 0.020 | 0.023 | 0.019 | 0.017 | 0.026 | 0.022 | 0.030 | 0.033 | 0.022 | 0.022 | 0.026 | 0.022 | 0.019 |
| C21 | 0.040 | 0.039 | 0.043 | 0.047 | 0.025 | 0.042 | 0.044 | 0.045 | 0.043 | 0.042 | 0.038 | 0.036 | 0.034 | 0.027 | 0.029 | 0.033 | 0.033 | 0.031 |
| C22 | 0.055 | 0.047 | 0.049 | 0.044 | 0.054 | 0.032 | 0.048 | 0.052 | 0.049 | 0.052 | 0.045 | 0.053 | 0.051 | 0.040 | 0.040 | 0.038 | 0.037 | 0.042 |
| C23 | 0.035 | 0.043 | 0.041 | 0.040 | 0.045 | 0.046 | 0.029 | 0.049 | 0.049 | 0.052 | 0.040 | 0.050 | 0.048 | 0.039 | 0.038 | 0.037 | 0.033 | 0.032 |
| C24 | 0.041 | 0.041 | 0.037 | 0.040 | 0.048 | 0.049 | 0.047 | 0.028 | 0.049 | 0.045 | 0.037 | 0.036 | 0.038 | 0.027 | 0.028 | 0.027 | 0.030 | 0.030 |
| C25 | 0.038 | 0.040 | 0.038 | 0.037 | 0.039 | 0.040 | 0.048 | 0.043 | 0.025 | 0.041 | 0.038 | 0.032 | 0.032 | 0.028 | 0.023 | 0.021 | 0.025 | 0.023 |
| C26 | 0.041 | 0.040 | 0.042 | 0.042 | 0.057 | 0.057 | 0.051 | 0.050 | 0.053 | 0.035 | 0.044 | 0.034 | 0.039 | 0.042 | 0.045 | 0.046 | 0.046 | 0.045 |
| C31 | 0.041 | 0.044 | 0.046 | 0.049 | 0.063 | 0.054 | 0.057 | 0.067 | 0.069 | 0.066 | 0.069 | 0.078 | 0.078 | 0.047 | 0.077 | 0.086 | 0.082 | 0.072 |
| C32 | 0.037 | 0.029 | 0.033 | 0.030 | 0.038 | 0.043 | 0.038 | 0.037 | 0.043 | 0.038 | 0.043 | 0.046 | 0.042 | 0.053 | 0.030 | 0.057 | 0.055 | 0.062 |
| C33 | 0.044 | 0.047 | 0.039 | 0.042 | 0.057 | 0.055 | 0.054 | 0.057 | 0.049 | 0.057 | 0.062 | 0.055 | 0.054 | 0.077 | 0.076 | 0.042 | 0.070 | 0.077 |
| C34 | 0.027 | 0.024 | 0.025 | 0.026 | 0.034 | 0.038 | 0.030 | 0.031 | 0.031 | 0.033 | 0.037 | 0.036 | 0.036 | 0.054 | 0.050 | 0.046 | 0.027 | 0.052 |
| C35 | 0.050 | 0.053 | 0.056 | 0.051 | 0.063 | 0.065 | 0.077 | 0.064 | 0.063 | 0.061 | 0.071 | 0.066 | 0.071 | 0.083 | 0.082 | 0.084 | 0.080 | 0.051 |
| C41 | 0.099 | 0.105 | 0.095 | 0.097 | 0.122 | 0.127 | 0.133 | 0.128 | 0.137 | 0.134 | 0.077 | 0.115 | 0.118 | 0.115 | 0.112 | 0.113 | 0.115 | 0.120 |
| C42 | 0.093 | 0.090 | 0.096 | 0.095 | 0.117 | 0.115 | 0.112 | 0.113 | 0.110 | 0.117 | 0.123 | 0.074 | 0.132 | 0.106 | 0.105 | 0.107 | 0.102 | 0.105 |
| C43 | 0.102 | 0.099 | 0.103 | 0.103 | 0.128 | 0.126 | 0.123 | 0.126 | 0.121 | 0.117 | 0.141 | 0.152 | 0.092 | 0.129 | 0.133 | 0.130 | 0.133 | 0.124 |
Appendix B. Questionnaire for sustainable OGD
Dear expert,
This is an academic study on “improving the sustainability of open government data,” aiming to explore the influence factors and relationship of sustainable open government data. Your profound knowledge and experience will be of great help to the results and reliability of this research. The information provided by you will only be used for academic statistical analysis, and will not be used for other purposes. Please feel free to fill in the information. Your support will be the key to the successful completion of this study. We sincerely hope that you can spare some time to fill in your insights, which will serve as a reference for this study. We would highly appreciate your participation.
The questionnaire is divided into four parts: personal information, dimensions and criteria, completion instructions, and the 18 criteria that affect the relationship evaluation.
I. Personal Information
1. Name:
2. Gender: □Male □Female
3. Education: □College □Bachelor □Master □PhD
4. Department: □Government □University or research institute □Company
5. Professional Title: □None □Intermediate □Associate professor □Professor
6. Age: □30≤ Age □30 < Age ≤ 40 □40 < Age ≤ 50 □50 < Age ≤ 60 □Age >60
7. Experience: □10≤ years □10 < years ≤ 20 □20 < years ≤ 30 □years >30
II. Descriptions of dimensions and criteria
Table A7.
Descriptions of dimensions and criteria.
| Dimensions | Criteria | Descriptions |
|---|---|---|
| Environment | Legal and policy | Related laws and policy on OGD. |
| Political will and leadership | Willingness and leadership of government agencies. | |
| Social public | The degree of public support and participation in OGD. | |
| Technical Capacity | Technological advancement in OGD. | |
| Data | Completeness | The number of OGD sets. |
| Accuracy | The data is accurate. | |
| Timeliness | Timely update of data. | |
| Understandability | The data description is easy for the public to understand. | |
| Accessibility | The data can be accessible to anyone for any purpose. | |
| Usable | Open data structure for easy to reuse. | |
| Use | Interface | User experience of operating OGD platform. |
| Index | Information systems or search engines. | |
| Acquisition | Whether the operation to obtain data is complex. | |
| Presentation | Data is presented in many forms. | |
| Interactive | OGD platform provides interaction with users. | |
| Impact | Social | The impact of OGD on society. |
| Political | The impact of OGD on political. | |
| Economic | The impact of OGD on economic. |
III. Instructions
Indicator description: 0 = no influence; 1 = low influence; 5 = middle influence; 3 = high influence; 4 = extremely high influence. For example, the degree of influence of A on B is extremely high, so fill in the position 4.
Table A8.
Indicator description.

Examples:
1. The influence of Legal and policy on Political will and leadership is (low influence), so fill in 1 in the box
2. The influence of Political will and leadership on Legal and policy is (extremely high), so fill in 4 in the box
Table A9.
The influence relationship may not be equal.
| Criteria | Legal & policy | Political will & leadership |
| Legal & policy | 1 | |
| Political will & leadership | 4 |
Please note that the influence relationship may not be equal.
IV. Pairwise comparisons between criteria
Table A10.
Pairwise comparisons between criteria.
| Dimension/Criteria | Environment | Data | Use | Impact | |||||||||||||||
|---|---|---|---|---|---|---|---|---|---|---|---|---|---|---|---|---|---|---|---|
| Legal & policy | Political will & leadership | Social public | Technical Capacity | Completeness | Accuracy | Timeliness | Understandability | Accessibility | Usable | Interface | Index | Acquisition | Presentation | Interactive | Social | Political | Economic | ||
| Environment | Legal & policy | ||||||||||||||||||
| Political will & leadership | |||||||||||||||||||
| Social public | |||||||||||||||||||
| Technical Capacity | |||||||||||||||||||
| Data | Completeness | ||||||||||||||||||
| Accuracy | |||||||||||||||||||
| Timeliness | |||||||||||||||||||
| Understandability | |||||||||||||||||||
| Accessibility | |||||||||||||||||||
| Usable | |||||||||||||||||||
| Use | Interface | ||||||||||||||||||
| Index | |||||||||||||||||||
| Acquisition | |||||||||||||||||||
| Presentation | |||||||||||||||||||
| Interactive | |||||||||||||||||||
| Impact | Social | ||||||||||||||||||
| Political | |||||||||||||||||||
| Economic | |||||||||||||||||||
The questionnaire is over. Please check again whether all the answers have been completed. Thank you very much for taking the time to fill the questionnaire. We appreciate your participation.
References
- Charalabidis, Y.; Charalampos, A.; Loukis, E. A taxonomy of open government data research areas and topics. J. Organ. Comput. Electron. Commer. 2016, 26, 41–63. [Google Scholar] [CrossRef]
- Kassen, M. A promising phenomenon of open data: A case study of the Chicago open data project. Gov. Inf. Q. 2013, 30, 508–513. [Google Scholar] [CrossRef]
- Ruijer, E.; Grimmelikhuijsen, S.; Meijer, A. Open data for democracy: Developing a theoretical framework for open data use. Gov. Inf. Q. 2017, 34, 45–52. [Google Scholar] [CrossRef]
- Janssen, M.; Charalabidis, Y.; Zuiderwijk, A. Benefits, adoption barriers and myths of open data and open government. Inf. Syst. Manag. 2012, 29, 258–268. [Google Scholar] [CrossRef]
- Attard, J.; Orlandi, F.; Scerri, S.; Aue, S. A systematic review of open government data initiatives. Gov. Inf. Q. 2015, 32, 399–418. [Google Scholar] [CrossRef]
- Dawes, S.S.; Vidiasova, L.; Parkhimovich, O. Planning and designing open government data programs: An ecosystem approach. Gov. Inf. Q. 2016, 33, 15–27. [Google Scholar] [CrossRef]
- United Nations Department of Economic and Social Affairs. United Nations E-Government Survey 2016 (E-Government in Support of Sustainable Development); United Nations Department Economic Social Affairs: New York, NY, USA, 2016. [Google Scholar]
- About OGP. What Is the Open Government Partnership? Available online: https://www.opengovpartnership.org/about/about-ogp (accessed on 15 April 2019).
- World Wide Web Foundation. Open Data Barometer-Global Report Fourth Edition. Available online: https://open-databarome ter.org/doc/4thEdition/ODB-4thEdition-GlobalReport.pdf (accessed on 12 June 2018).
- Gu, T.J.; Xia, Y.; Xu, K.W. Shanghai sustainable development research from opening information to opening data-based on the practice of 49 government department websites and government data service network. E Gov. 2015, 9, 14–21. [Google Scholar]
- Lin, M.I.; Lee, Y.D.; Ho, T.N. Applying integrated DEA/AHP to evaluate the economic performance of local governments in china. Eur. J. Oper. Res. 2011, 209, 129–140. [Google Scholar] [CrossRef]
- Alison, K.; Sabou, M. Sustainability implications of open government data: A cross-regional study. In Proceedings of the ACM Web Science Conference, Oxford, UK, 28 June–1 July 2015. [Google Scholar]
- Open Knowledge. Global Open Data Index: Tracking the State of Open Government Data. Available online: https://index.okfn.org (accessed on 10 June 2018).
- The World Bank’s Open Government Data Working Group. Open Data Readiness Assessment Users: Open Data Readiness Assessment Methodology. Available online: http://opendatatoolkit.worldbank.org/en/odra.html (accessed on 18 June 2018).
- OECD. Government at a Glance 2017. Available online: https://0-www-oecd--ilibrary-org.brum.beds.ac.uk /governance/ government-at-a-glance-2017_gov_glance-2017-en (accessed on 18 June 2018).
- ODI & New York University. Towards Common Methods for Assessing Open Data: Workshop Report & Draft Framework. Available online: http://opendataresear-ch.org/sites/default/files/ posts/common%20assessment%20work-shop%20 report.pdf (accessed on 18 June 2018).
- Digital and Mobile Governance Lab of Fudan University. Report of China Local Opening Government Data 2018. Available online: http://www.dmg.fudan.edu.cn (accessed on 15 July 2018).
- Ma, H.; Tang, S. Evaluation for service quality about website of government open data based on structural equation. J. Mod. Inf. 2016, 36, 10–15. [Google Scholar]
- Chatfield, A.T.R.; Reddick, C.G. A longitudinal cross-sector analysis of open data portal service capability: The case of Australian local governments. Gov. Inf. Q. 2017, 34, 231–243. [Google Scholar] [CrossRef]
- Kubler, S.; Robert, J.; Neumaier, S.; Umbrich, J.; Traon, Y.L. Comparison of metadata quality in open data portals using the Analytic Hierarchy Process. Gov. Inf. Q. 2018, 35, 13–29. [Google Scholar] [CrossRef]
- Sieber, R.E.; Johnson, P.A. Civic open data at a crossroads: Dominant models and current challenges. Gov. Inf. Q. 2015, 32, 308–315. [Google Scholar] [CrossRef]
- Vetrò, A.; Canova, L.; Torchiano, M.; Minotas, C.O.; Iemma, R.; Morando, F. Open data quality measurement framework: Definition and application to open government data. Gov. Inf. Q. 2016, 33, 325–337. [Google Scholar] [CrossRef]
- Viscusi, G.; Spahiu, B.; Maurino, A. Compliance with open government data policies: An empirical assessment of Italian local public administrations. Inf. Polity 2014, 19, 263–275. [Google Scholar] [CrossRef]
- Ji, Z.; Ma, H. Analysis and Evaluation of the Status of China’s Open Government Data. Libr. Inf. Stud. 2018, 12–19. Available online: http://xueshu.baidu.com/usercenter/paper/show?paperid=e7da51a -51aacb942426265045868d5f3&site=xueshu_se (accessed on 15 April 2019).
- Sandoval, A.R.; Gil-Garcia, J.R. Towards an evaluation model for open government: A preliminary proposal. In Proceedings of the International Conference on Electron. Government, Dublin, Ireland, 1–3 September 2014; pp. 47–58. [Google Scholar]
- Alberto, A.; Marta, O.U.C.; Carmen, D.P.; Meloda, H. A metric to assess open data reuse. EI Profesional de la Información 2014, 23, 582–588. [Google Scholar]
- Parycek, P.; Johann, H.; Ginner, M. Open government data implementation evaluation. J. Theor. Appl. Electron. Commer. Res. 2014, 9, 80–99. [Google Scholar] [CrossRef]
- Anneke, Z.; Janssen, M. Open data policies, their implementation and impact: A framework for comparison. Gov. Inf. Q. 2014, 31, 17–29. [Google Scholar]
- Alexopoulos, C.; Loukis, E.; Charalabidis, Y. A methodology for evaluating PSI E-infrastructures based on multiple value models. In Proceedings of the 16th Panhellenic conference on informatics, Piraeus, Greece, 5–7 October 2012; pp. 37–43. [Google Scholar]
- United Nations. Sustainable Development Goals. Available online: https://www.un.org/ sustainabledevelopment/peace-justice/ (accessed on 10 September 2018).
- Chen, S.H.; Lin, W.T. Analyzing determinants for promoting emerging technology. Technol. Forecast. Soc. Chang. 2018, 131, 94–110. [Google Scholar] [CrossRef]
- Babashamsi, P.; Yusoff, N.I.; Ceylan, H.; Nor, N.G.; Salarzadeh, J.H. Sustainable development factors in pavement life-cycle: Highway/Airport review. Sustainability 2016, 8, 248. [Google Scholar] [CrossRef]
- Hwang, B.N.; Huang, C.Y.; Wu, C.H. A TOE approach to establish a green supply chain adoption decision model in the semiconductor industry. Sustainability 2016, 8, 168. [Google Scholar] [CrossRef]
- Shao, Q.G.; Liou, J.H.; Weng, S.S.; Chuang, Y.C. Improving the green building evaluation system in china based on the DANP method. Sustainability 2018, 10, 1173. [Google Scholar] [CrossRef]
- Liou, J.H.; Hsu, C.C.; Chen, Y.S. Improving transportation service quality based on information fusion. Transp. Res. Part A Policy Pract. 2014, 67, 225–239. [Google Scholar] [CrossRef]
- Liou, J.H.; Lu, M.T.; Hu, S.K.; Cheng, C.H.; Chuang, Y.C. A hybrid MCDM model for improving the electronic health record to better serve client needs. Sustainability 2017, 9, 1819. [Google Scholar] [CrossRef]
- Hung, Y.H.; Huang, T.L.; Hsieh, J.C.; Tsuei, H.J.; Cheng, C.C.; Tzeng, G.H. Online reputation management for improving marketing by using a hybrid MCDM model. Knowl. Based Syst. 2012, 35, 87–93. [Google Scholar] [CrossRef]
- Harrison, T.M.; Pardo, T.A.; Cook, M. Creating open government ecosystems: A research and development agenda. Future Internet 2012, 4, 900–928. [Google Scholar] [CrossRef]
- World Commission on Environment and Development. Our Common Future; Oxford University Press: Oxford, UK, 1987. [Google Scholar]
- Heimstädt, M.; Saunderson, F.; Heath, T. From toddler to teen: Growth of an open data ecosystem. Open Gov. 2014, 6, 123–135. [Google Scholar] [CrossRef]
- Jetzek, T. Innovation in the open data ecosystem: Exploring the role of real options thinking and multi-sided platforms for sustainable value generation through open data. Anal. Innov. Excell. Driven Enterp. 2017, 4, 137–168. [Google Scholar]
- Liao, Z.; Deng, L.; Fan, X.; Yan, Z.; Hui, L.; Qi, X.; Yun, Z. Empirical research on the evaluation model and method of sustainability of the open source ecosystem. Symmetry 2018, 10, 747. [Google Scholar] [CrossRef]
- Jetzek, T.; Avital, M.; Bjørn-Andersen, N. Generating sustainable value from open data in a sharing society. In Proceedings of the International Working Conference on Transfer Diffusion IT TDIT 2014: Creating Value for All Through IT, Aalborg, Denmark, 2–4 June 2014; pp. 62–82. [Google Scholar]
- Zuiderwijk, A.; Janssen, M.; Choenni, S.; Meijer, R.; Sheikh, A.R. Socio-technical impediments of open data. Electron. J. E Gov. 2012, 10, 156–172. [Google Scholar]
- Eric, S.Z. Sustainability management, strategy and reform in local government. Public Manag. Rev. 2018, 20, 136–153. [Google Scholar]
- Solar, M.; Concha, G.; Meijueiro, L. A model to assess open government data in public agencies. In Proceedings of the International Conference EGOV, Kristiansand, Norway, 3–6 September 2012; Volume 2012, pp. 210–221. [Google Scholar]
- Mcdermott, P. Building open government. Gov. Inf. Q. 2010, 27, 401–413. [Google Scholar] [CrossRef]
- Bates, J. The strategic importance of information policy for the contemporary neoliberal state: The case of open government data in the United Kingdom. Gov. Inf. Q. 2014, 31, 388–395. [Google Scholar] [CrossRef]
- Suarez, D.S.; Jimenez-Guarin, C. Natural language processing for linking online news and open government data. In Proceedings of the International Conference on Conceptual Modeling, Atlanta, GA, USA, 27–29 October 2014; Volume 55, pp. 67–74. [Google Scholar]
- Corradi, A.; Foschini, L.; Ianniello, R. Linked data for open government: The case of Bologna. In Proceedings of the IEEE Symposium Computers Communication, Funchal, Portugal, 23–26 June 2014; pp. 1–7. [Google Scholar]
- Victorino, M.D.; Shiessl, M.; Oliveira, E.C.; Ishikawa, E. A proposal for big data ecosystem for the government linked open data analysis. Informacao Sociedade Estudos 2017, 27, 225–242. [Google Scholar]
- Park, H.; Smiraglia, R.P. Enhancing data curation of cultural heritage for information sharing: A case study using open government data. Metadata Semant. Res. 2014, 11, 27–29. [Google Scholar]
- Talukder, M.S.; Shen, L.; Talukder, M.F.H. Determinants of user acceptance and use of open government data (OGD): An empirical investigation in Bangladesh. Technol. Soc. 2019, 56, 147–156. [Google Scholar] [CrossRef]
- Zou, C.; Ma, H. Evaluation about government open data website based on neural network-taking 20 America government open data websites for example. J. Mod. Inf. 2016, 36, 16–21. [Google Scholar]
- Meijer, R.; Conradie, P.; Choenni, S. Reconciling contradictions of open data regarding transparency, privacy, security and trust. J. Theor. Appl. Electron. Commer. Res. 2014, 9, 32–44. [Google Scholar] [CrossRef]
- Veljković, N.; Bogdanović-Dinić, S.; Stoimenov, L. Benchmarking open government: An open data perspective. Gov. Inf. Q. 2014, 31, 278–290. [Google Scholar] [CrossRef]
- Fan, B.; Zhao, Y. The moderating effect of external pressure on the relationship between internal organizational factors and the quality of open government data. Gov. Inf. Q. 2017, 34, 396–405. [Google Scholar] [CrossRef]
- Choenni, S.; Netten, N.; Shoae-Bargh, M.; Choenni, R. On the Usability of Big (Social) Data. In Proceedings of the 2018 IEEE International Conference on Parallel & Distributed Processing Applications Ubiquitous Comput. & Communications Big Data & Cloud Comput. Social Comput. & Networking Sustainable Comput. & Communications, Melbourne, Australia, 11–13 December 2018; pp. 1167–1174. [Google Scholar]
- Annex, B. Reaping the benefits of cloud computing, web 2.0 and open data: OECD country experiences. In Denmark: Efficient e-Government for Smarter Public Service Delivery; OECD: Paris, France, 2010. [Google Scholar]
- Alexopoulos, C.; Diamantopoulou, V.; Charalabidis, Y. Tracking the evolution of OGD portals: A maturity model. In Proceedings of the International Conference Electron. Government, St. Petersburg, Russia, 4–7 September 2017; pp. 287–300. [Google Scholar]
- Tzeng, G.H.; Shen, K.Y. New Concepts and Trends of Hybrid Multiple Criteria Decision Making; CRC Press Taylor & Francis Group: Boca Raton, FL, USA, 2017; pp. 35–39. [Google Scholar]
- Tzeng, G.H.; Chiang, C.H.; Li, C.W. Evaluating intertwined effects in e-learning programs: A novel hybrid MCDM model based on factor analysis and DEMATEL. Expert Syst. Appl. 2007, 32, 1028–1044. [Google Scholar] [CrossRef]
- Yang, J.L.; Tzeng, G.H. An integrated MCDM technique combined with DEMATEL for a novel cluster-weighted with ANP method. Expert Syst. Appl. 2011, 38, 1417–1424. [Google Scholar] [CrossRef]
- Wang, Y.L.; Tzeng, G.H. Brand marketing for creating brand value based on a MCDM model combining DEMATEL with ANP and VIKOR methods. Expert Syst. Appl. 2012, 39, 5600–5615. [Google Scholar] [CrossRef]
- Qu, G.B.; Zhao, T.Y.; Zhu, B.W.; Tzeng, G.H.; Huang, S.L. Use of a Modified DANP-mV Model to Improve Quality of Life in Rural Residents: The Empirical Case of Xingshisi Village, China. Environ. Res. Public Health 2019, 16, 153. [Google Scholar] [CrossRef] [PubMed]
- Liu, C.H.; Tzeng, G.H.; Lee, M.H.; Lee, P.Y. Improving metro-airport connection service for tourism development: Using hybrid MCDM models. Tour. Manag. Perspect. 2013, 6, 95–107. [Google Scholar] [CrossRef]
- Gabus, A.; Fontela, E. World Problems, an Invitation to Further Thought within the Framework of DEMATEL; Battelle Geneva Research Centre: Columbus, OH, USA, 1972. [Google Scholar]
- Gabus, A.; Fontela, E. Perceptions of the World Problemata: Communication Procedure, Communicating with Those Bearing Collective Responsibility; DEMATEL Report No.1; Battelle Geneva Research Centre: Columbus, OH, USA, 1973. [Google Scholar]
- Peng, K.H.; Tzeng, G.H. A hybrid dynamic MADM model for problems-improvement in economics and business. Technol. Econ. Dev. Econ. 2013, 19, 638–660. [Google Scholar] [CrossRef]
- Chen, F.H.; Chi, D.J. Application of a new DEMATEL to explore key factors of China’s corporate social responsibility: Evidence from accounting experts. Qual. Quant. 2015, 49, 135–154. [Google Scholar] [CrossRef]
- Huang, K.W.; Huang, J.H.; Tzeng, G.H. New hybrid multiple attribute decision-making model for improving competence sets: Enhancing a company’s core competitiveness. Sustainability 2016, 8, 175. [Google Scholar] [CrossRef]
- Chen, I.S. A combined MCDM model based on DEMATEL and ANP for the selection of airline service quality improvement criteria: A study based on the Taiwanese airline industry. J. Air Transp. Manag. 2016, 57, 7–18. [Google Scholar] [CrossRef]
- Liou, J.J.H. Building an effective system for carbon reduction management. J. Clean. Prod. 2015, 103, 353–361. [Google Scholar] [CrossRef]
- Saaty, T.L. Rank from comparisons and from ratings in the analytic hierarchy/network processes. Eur. J. Oper. Res. 2006, 168, 557–570. [Google Scholar] [CrossRef]
- Hu, S.K.; Lu, M.T.; Tzeng, G.H. Exploring smart phone improvements based on a hybrid MCDM model. Expert Syst. Appl. 2014, 41, 4401–4413. [Google Scholar] [CrossRef]
- Hsu, C.C.; Liou, J.J.H. An outsourcing provider decision model for the airline industry. J. Air Transp. Manag. 2013, 28, 40–46. [Google Scholar] [CrossRef]
Figure 1.
Influential network relation map (INRM). (a) Impact relationship among criteria of environment; (b) impact relationship among criteria of data; (c) the impact relationship among all dimensions; (d) impact relationship among criteria of use; (e) impact relationship among criteria of impact. OGD = open government data.

Figure 2.
Major influence route.

Table 1.
The evaluation factors for sustainable OGD.
| Dimension | Criteria | Descriptions | References |
|---|---|---|---|
| Environment (D1) | Legal & policy (C11) | Related laws and policy on OGD. | [25,28] |
| Political will & leadership (C12) | Willingness and leadership of government agencies. | [47] | |
| Social public (C13) | The degree of public support and participation in OGD. | [3,28] | |
| Technical Capacity (C14) | Technological advancement in OGD. | [49,50,51] | |
| Data (D2) | Completeness (C21) | The number of OGD sets. | [22,54,56] |
| Accuracy (C22) | The data is accurate. | [22,54,56] | |
| Timeliness (C23) | Timely update of data. | [22,54,56] | |
| Understandability (C24) | The data description is easy for the public to understand. | [22,54,58] | |
| Accessibility (C25) | The data can be accessible to anyone for any purpose. | [22,54,58] | |
| Usable (C26) | Open data structure for easy to reuse. | [18,58] | |
| Use (D3) | Interface (C31) | User experience of operating OGD platform. | [18,54] |
| Index (C32) | Information systems or search engines. | [18,54] | |
| Acquisition (C33) | Whether the operation to obtain data is complex. | [18,20] | |
| Presentation (C34) | Data is presented in many forms. | [18,20] | |
| Interactive (C35) | OGD platform provides interaction with users. | [20,52] | |
| Impact (D4) | Social (C41) | The impact of OGD on society. | [20,27] |
| Political (C42) | The impact of OGD on politics. | [27,60] | |
| Economic (C43) | The impact of OGD on economics. | [18,60] |
Table 2.
Influence weights of the OGD evaluation system.
| Dimensions | Local Weight | Ranking | Criteria | Local Weight | Ranking | Global Weight |
|---|---|---|---|---|---|---|
| D1 | 0.1465 | 4 | C11 | 0.1925 | 17 | 0.0282 |
| C12 | 0.1490 | 18 | 0.0218 | |||
| C13 | 0.4546 | 5 | 0.0666 | |||
| C14 | 0.2039 | 16 | 0.0299 | |||
| D2 | 0.2385 | 3 | C21 | 0.1534 | 14 | 0.0366 |
| C22 | 0.1939 | 8 | 0.0462 | |||
| C23 | 0.1762 | 11 | 0.0420 | |||
| C24 | 0.1544 | 13 | 0.0368 | |||
| C25 | 0.1393 | 15 | 0.0332 | |||
| C26 | 0.1829 | 9 | 0.0436 | |||
| D3 | 0.2720 | 2 | C31 | 0.2442 | 6 | 0.0664 |
| C32 | 0.1598 | 10 | 0.0435 | |||
| C33 | 0.2114 | 7 | 0.0575 | |||
| C34 | 0.1360 | 12 | 0.0370 | |||
| C35 | 0.2485 | 4 | 0.0676 | |||
| D4 | 0.3430 | 1 | C41 | 0.3272 | 2 | 0.1122 |
| C42 | 0.3141 | 3 | 0.1077 | |||
| C43 | 0.3587 | 1 | 0.1230 |
© 2019 by the authors. Licensee MDPI, Basel, Switzerland. This article is an open access article distributed under the terms and conditions of the Creative Commons Attribution (CC BY) license (http://creativecommons.org/licenses/by/4.0/).
Share and Cite
MDPI and ACS Style
Jiang, H.; Shao, Q.; Liou, J.J.H.; Shao, T.; Shi, X. Improving the Sustainability of Open Government Data. Sustainability 2019, 11, 2388. https://0-doi-org.brum.beds.ac.uk/10.3390/su11082388
AMA Style
Jiang H, Shao Q, Liou JJH, Shao T, Shi X. Improving the Sustainability of Open Government Data. Sustainability. 2019; 11(8):2388. https://0-doi-org.brum.beds.ac.uk/10.3390/su11082388
Chicago/Turabian StyleJiang, Hongbo, Qigan Shao, James J.H. Liou, Ting Shao, and Xiaosheng Shi. 2019. "Improving the Sustainability of Open Government Data" Sustainability 11, no. 8: 2388. https://0-doi-org.brum.beds.ac.uk/10.3390/su11082388
Note that from the first issue of 2016, this journal uses article numbers instead of page numbers. See further details here.