Extreme Weather Events in Agriculture: A Systematic Review
by
 ,
,
Alessia Cogato
1,*, 
Franco Meggio
2 ,
,
Massimiliano De Antoni Migliorati
3 and
Francesco Marinello
1
1
Department of Land, Environmental, Agriculture and Forestry, University of Padova, 35020 Padova, Italy
2
Department of Agronomy, Food, Natural Resources, Animals and the Environment, University of Padova, 35020 Padova, Italy
3
Institute of Future Environment, Queensland University of Technology, Brisbane QLD 4001, Australia
*
Author to whom correspondence should be addressed.
Sustainability 2019, 11(9), 2547; https://0-doi-org.brum.beds.ac.uk/10.3390/su11092547
Submission received: 2 April 2019
/
Revised: 19 April 2019
/
Accepted: 27 April 2019
/
Published: 2 May 2019
(This article belongs to the Special Issue High Impact Events and Climate Change)
Abstract
:Despite the increase of publications focusing on the consequences of extreme weather events (EWE) for the agricultural sector, a specific review of EWE related to agriculture is missing. This work aimed at assessing the interrelation between EWE and agriculture through a systematic quantitative review of current scientific literature. The review analysed 19 major cropping systems (cereals, legumes, viticulture, horticulture and pastures) across five continents. Documents were extracted from the Scopus database and examined with a text mining tool to appraise the trend of publications across the years, the specific EWE-related issues examined and the research gaps addressed. The results highlighted that food security and economic losses due to the EWE represent a major interest of the scientific community. Implementation of remote sensing and imagery techniques for monitoring and detecting the effects of EWE is still underdeveloped. Large research gaps still lie in the areas concerning the effects of EWE on major cash crops (grapevine and tomato) and the agronomic dynamics of EWE in developing countries. Current knowledge on the physiological dynamics regulating the responses of main crops to EWE appears to be well established, while more research is urgently needed in the fields of mitigation measures and governance systems.
1. Introduction
The Intergovernmental Panel on Climate Change (IPCC) defines the extreme weather events (EWE) “as rare as or rarer than the 10th or 90th percentile of a probability density function estimated from observations” [1] The increasing frequency of EWE related to climate change (CC) represents a severe threat to agriculture. The long-lasting socio-economic costs of heat waves, floods, hailstorms, wildfires and other EWE pose serious challenges for the farmers and the communities [2]. According to the IPCC [1], CC is affecting the intensity, frequency, and spatio-temporal extent of EWE. An increase of extreme and uncertain events is characteristic of the most recent climate scenarios [3,4,5,6].
Research in this field has substantially increased in recent years, focusing on the impact of EWE on major crops. For example, a study on the effects of drought conditions in 2016 in the Northeastern United States reported yield losses higher than 30% for fruit and vegetable crops (Sweet et al. 2017). In Georgia (US) the photosynthesis rates of sweet corn decreased by at least 30% when the temperature exceeded 30 °C [7]. Similar responses have been reported for wheat, where both photosynthesis and yield reduction were amplified by the synergetic interaction of high temperature and drought stress [8]. Soybean is more tolerant to water stress than the above-mentioned crops, but some phenological stages (flowering and grain filling) are particularly sensitive to drought [9,10,11]. A study conducted in Oklahoma (US) on prairie, switchgrass and crop sites showed a reduction of net ecosystem exchange [12]. In grapevine, the increase of UV-B radiation is likely to influence the grape chemical composition [13]. Drought leads to the stomata closure and the photosynthesis reduction, negatively affecting the yield, and it has been observed that the combination of drought and heat waves can prevent complete berry maturation [14].
The overall impact of the EWE on the agricultural sector is therefore a very complex problem, requiring an urgent effort to establish efficient and sustainable managing systems. In recent decades, the interest of the scientific community on CC and its effects on agriculture, environment and economy has substantially increased. The number of publications dealing with the impact of CC on agriculture, its vulnerability and the best adaptation strategies has more than doubled between 2005 and 2010 [15], and this expanding trend has continued in subsequent years. This growing interest on the impact of CC on agriculture is on the one hand related to the importance of agriculture in the global economy, especially in developing countries. Conversely, the heterogeneity and unpredictability of global CC effects require a continuous improvement to predict and adapt to EWE. Measures to limit the stresses have been extensively studied, including resilient farming systems based on increased levels of biodiversity [16], enhancement of biotechnologies and genomic tools [17,18], selection of new varieties [19,20] and modification of the distribution of the current varieties [21]. A substantial part of the research on the effects and the risks for the plant communities related to the EWE focused on the tools and technologies for early detection or risk maps. Based on the meteorological data obtained from the weather stations, Tian et al. [22] evaluated the effectiveness of six different indices for the drought monitoring in the Central-South United States. Nguyen-Huy et al. [23] modelled the joint influence of 12 climate indices on Australian wheat yield. A large branch of the scientific literature, concerning the CC and the EWE, analyses the links between global warming and economic development. Two recent reviews focus on the topic of the relationship between CC and economic growth: the first one is dealing with the identification of the weather impacts [24], while the latter with the mechanisms linking CC and economic performance [25]. Both reviews stressed the great alarm expressed among economic and political institutions, caused by environmental modifications due to CC and, specifically, EWE.
Despite increased interest on the specific issue, to date a systematic review including all the issues related to the impact of EWE on the agricultural sector is missing. The review on the use of remote sensing applications for crop production forecasting of Parihar [26] includes a section on the crop assessment under some EWE (drought, floods and hailstorm). Singh and Kalra [27] analysed the potential of crop models to estimate the impact of EWE. Other reviews instead addressed the influence of EWE on insects and pathogen [28], and on food security [29].
The scientific literature was analysed using a quantitative method based on text mining techniques. The research on the EWE is inter-disciplinary, dealing with several sectoral topics. For this reason, the number of documents on the topic of EWE/agriculture relation is published in different subject categories of many journals, and a qualitative and narrative literature review would not be exhaustive. In fact, due to the vastness and the urgency of the specific topic, the framework of the literature review should use the following guidelines presented by Sacchelli et al. [30]:
- -
- inter-disciplinary, approaching the topic from a holistic perspective;
- -
- supporting decision-making from local to international level;
- -
- communicating clearly the state-of-the-art and the gaps of research.
A systematic quantitative approach represents the most effective methodology to achieve the aforementioned objectives.
The aim of the present analysis is to provide a comprehensive state-of-the-art review of the literature concerning EWE in agriculture. The specific objectives of this work are to (i) describe the trend of the publications in the years, and (ii) highlight the significant gaps of the research relating the EWE in the agricultural field, both in terms of topics and geographical areas, and (iii) categorise the interrelationships among the climatic and agricultural variables reported in the literature using cluster analysis.
The present analysis can support the scientific community in the focusing of future work.
2. Methodology
A systematic quantitative review was performed extracting documents from the Scopus database (www.scopus.com), using the advanced search to limit the field of interest. This approach is based on the selection of explicit and reproducible survey method [31], allowing a holistic approach to the literature. It enables presenting a clear and complete picture of the state-of-the-art, highlighting the key topics raised by the scientific community and performing cluster analysis. The analytic methodology approach makes it possible to map the gaps, not only from a theoretical point of view, but also from a methodological and geographic one. Some authors performed a quantitative literature review on some aspects concerning CC. Sacchelli et al. [30] applied this methodology to the CC and the adaptation strategies in the wine sector. Guidi et al. [32] published a literature analysis of the CC and the vulnerability assessment tools for forest ecosystems. A systematic review was developed about the methodologies to quantify the impacts of climate change on undernutrition [33]. A combination of quantitative review and meta-analysis has been carried out about the effects of EWE on Cryptosporidium and Giardia in fresh surface waters [34].
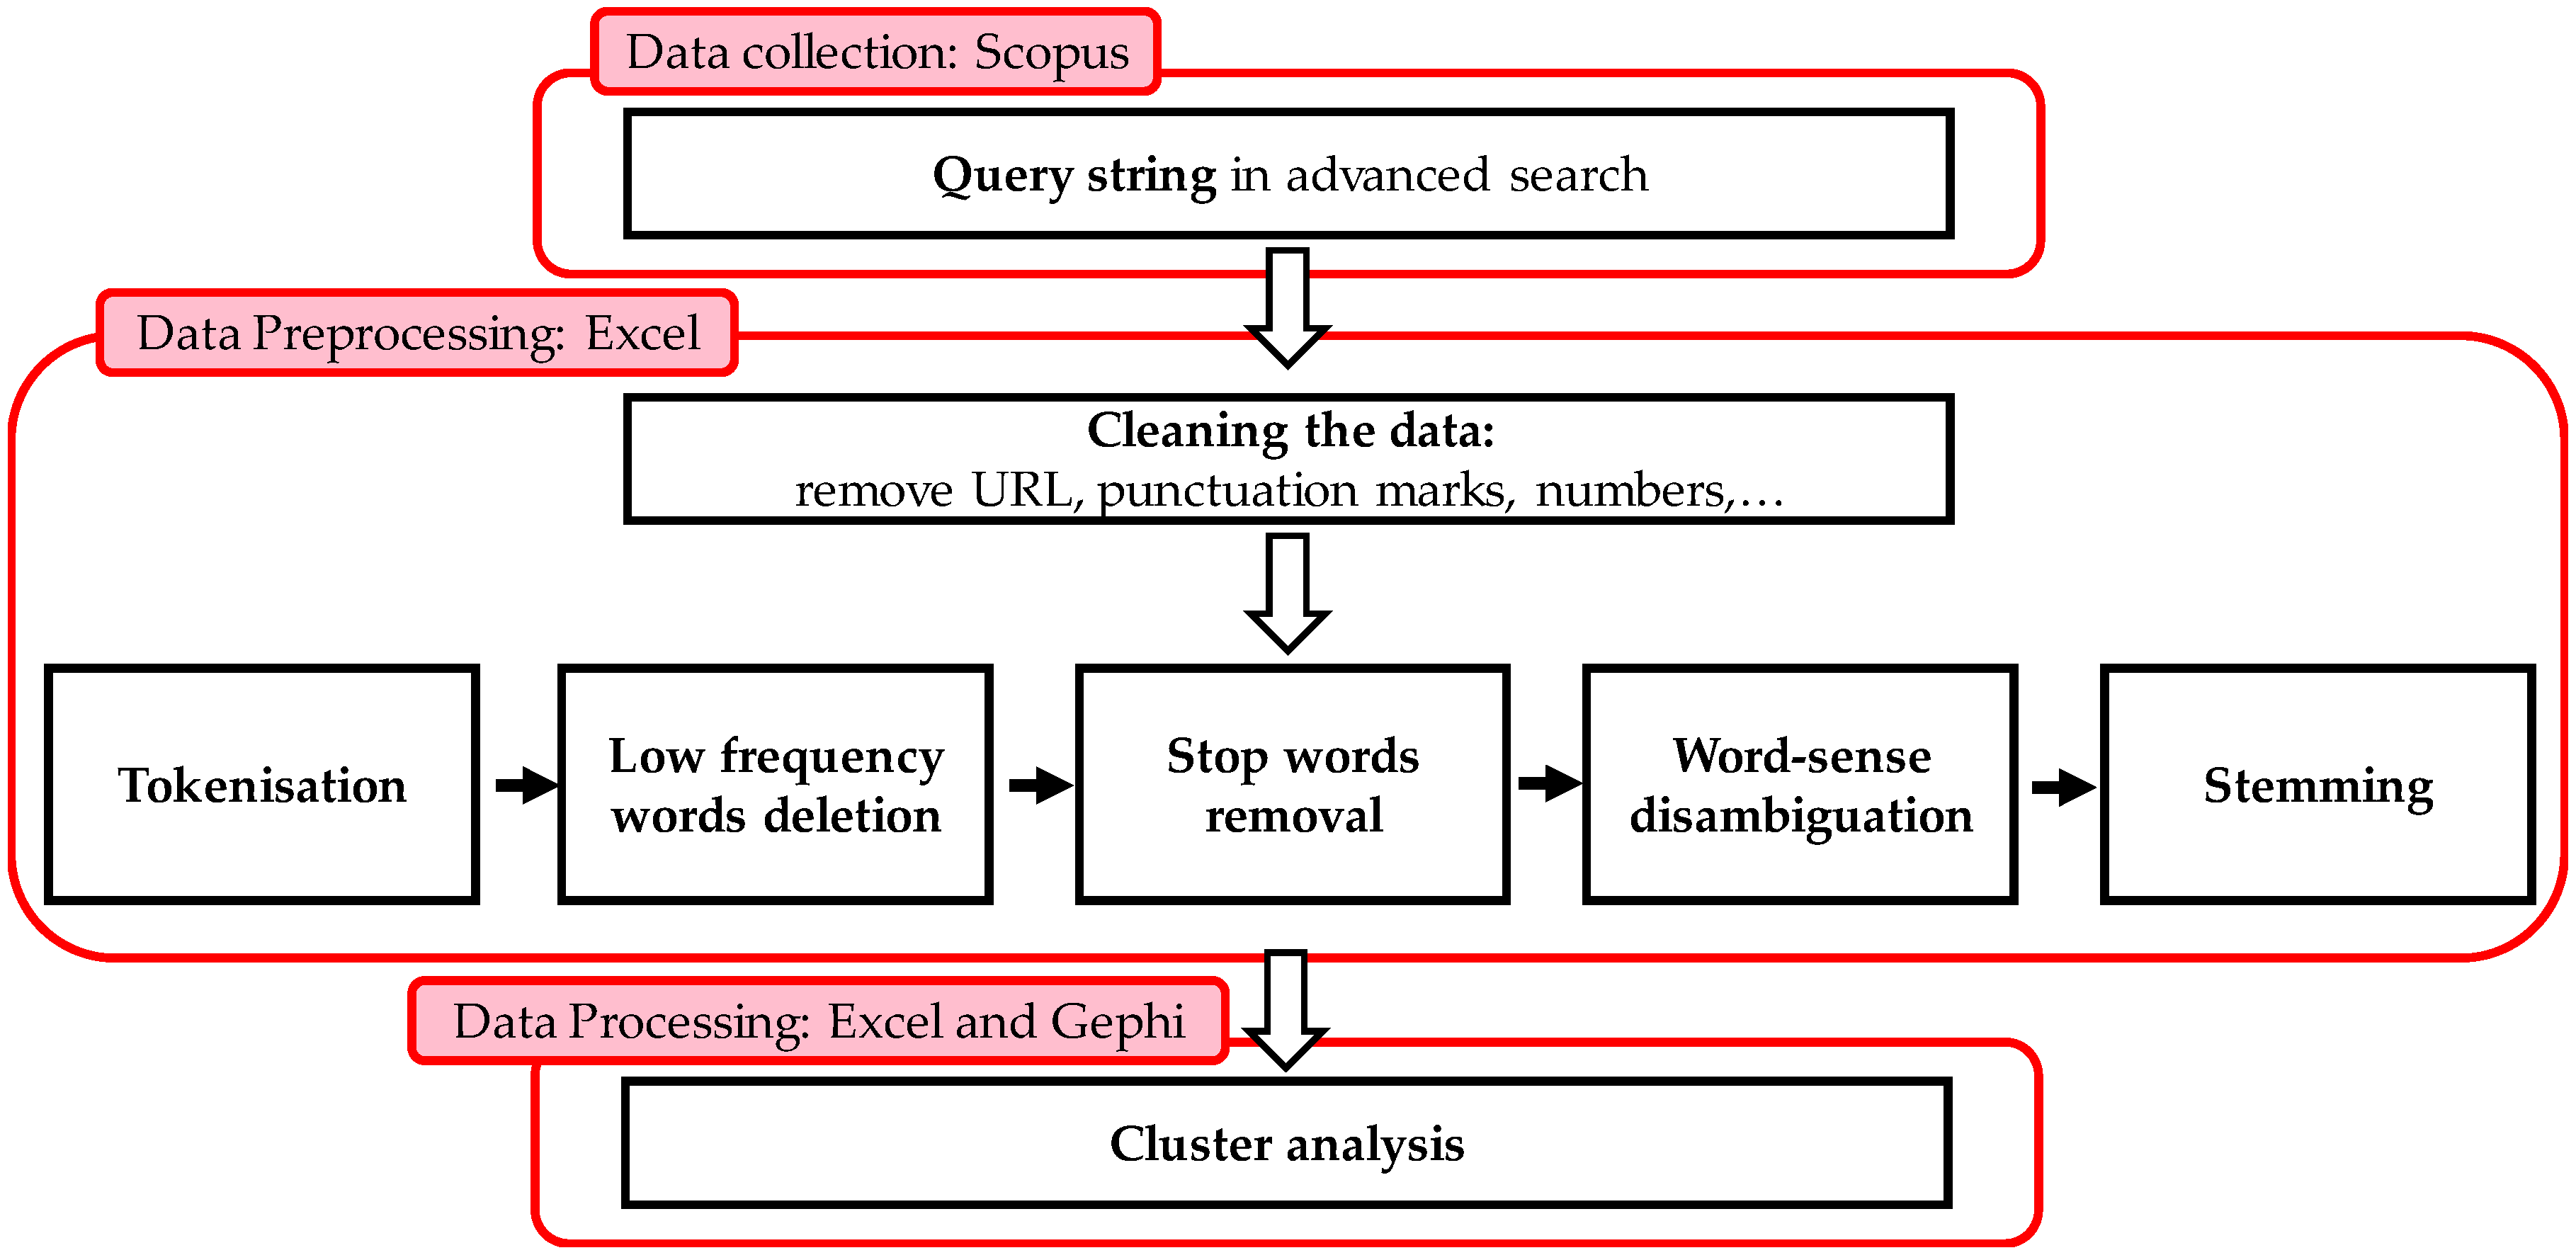
The words appearing in title, keywords and abstract were analysed with the text mining tool, taking advantage of the frequency functions available within Microsoft Excel and Gephi, an open source software for network analysis. Text mining is a process that analyses unstructured information (textual) by deriving meaningful numeric indices from the text. These indices provide the key to texts interpretation, obtaining high-quality information by applying statistical analysis.
The dataset extraction was based on a two-stage examination. The first stage aimed at realising a general review of the state-of-the-art research on the impact of EWE on agriculture. This aim was achieved by extracting documents concerning EWE in the subject area of Agriculture (Class 1). The search led to 1418 documents, including a total of 8441 words. Stage two enabled to refine the search, combining EWE and agriculture in the search form (Class 2). This search resulted in 806 documents and a total of 4866 words. The scripts used to extract the words submitted to text mining are reported in Table 1.
The extracted words were organised on a spreadsheet and pre-processed to improve the efficiency and effectiveness of the information retrieval [35]. The first process was tokenisation, which aims at breaking the sequence of strings into pieces, removing punctuation marks, hyphens and brackets. In most case, the outcome of the tokenisation is a list of single words. Special attention was paid to not separating compound words, which would have different meanings if separated (i.e., heat wave). The following step was the deletion of each word with very low frequency (words appearing 1 or 2 times) and the filtering of frequently recurring but meaningless words (i.e., connectors) with the “stop words” function. The dataset was finalised with the word-sense disambiguation and the stemming processes. The word-sense disambiguation aims to clarify the ambiguity between words with same or similar spelling but different meaning (i.e., acronyms). The stemming analysis allows for including in the dataset all variant forms of the same word (common root or same meaning) with a single lemma (i.e., contamination and contaminated or corn and maize). All the words subject to the stemming analysis are marked in this manuscript with an asterisk.
The Class 1 analysis was intended to provide a general overview of the state-of-the-art of research on EWE, examining the trend of the number of published documents from 1982 to July 2018. The words included in the dataset were then grouped in conceptual clusters to report the main topics concerning EWE tackled by the scientific community. The clusters identified were: “Climate”, “Methods”, “Ecosystems”, “Responses”, “Agriculture”, “Conditions”, “Areas” and “Implications”. For each cluster, a words frequency analysis was carried out to identify the research hotspots and tendencies. The conceptual classification model is reported in Figure 1.
In addition to the aforementioned analytical reports, the Class 2 dataset was built through an in-depth evaluation to provide a complete overview of the state-of-the-art research on EWE in the agricultural space. Frequency analysis was carried out within the categories of publications, contributing authors and countries. The extraction of the authors’ affiliation of the documents was used to analyse the geographical distribution of the contribution to research and to identify potential gaps. The words appearing in title, keywords and abstract were analysed to identify possible intercorrelations between topics and interconnections between EWE and the most widespread crops in the world.
3. Results
3.1. Class 1: Trend and Cluster Analysis
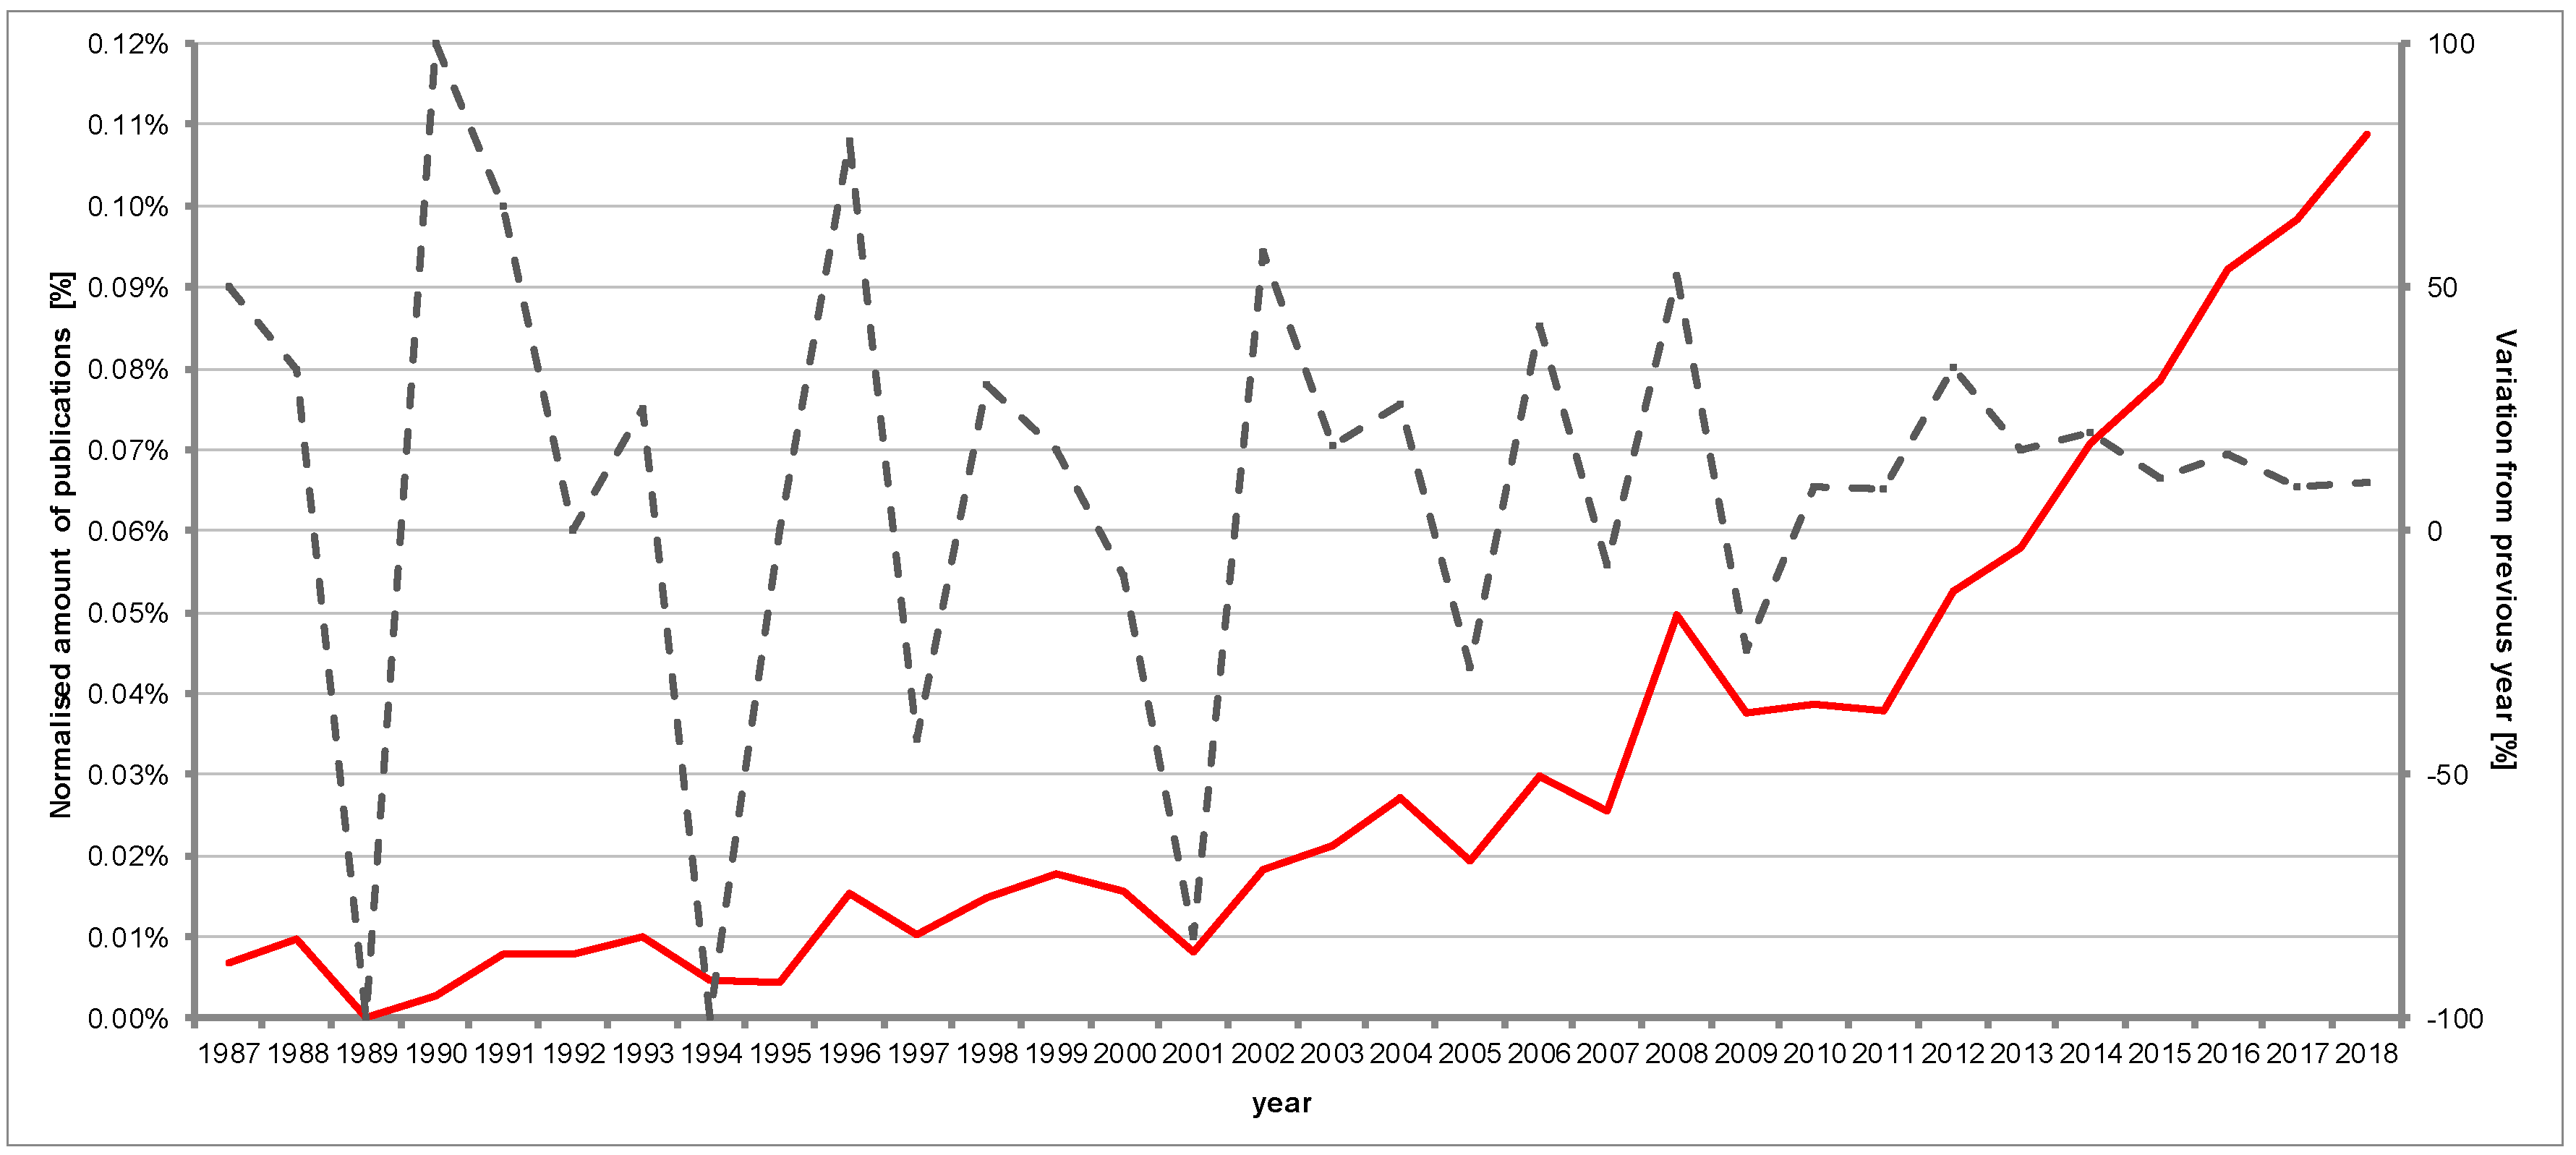
The total amount of publications revised in Class 1 from 1952 to July 2018 was 1418. From 1952 to 1986 the documents on topic EWE in the Scopus database were very limited (no more than one/year). Starting from 1987, the interest on EWE has slowly risen, with an average 16.4% per year growth (from 2 to 196 in 1987 and 2017, respectively). The topic became relevant only in the last ten years, considering that 85% of the documents have been published since 2008. Since 2008, the average annual growth was 13.8% (from 61 to 196 articles in 2008 and 2017, respectively). Figure 2 shows trend analysis normalised on the total amount of documents in subject area “Agricultural and Biological Sciences”. Natural oscillations are presented year by year.
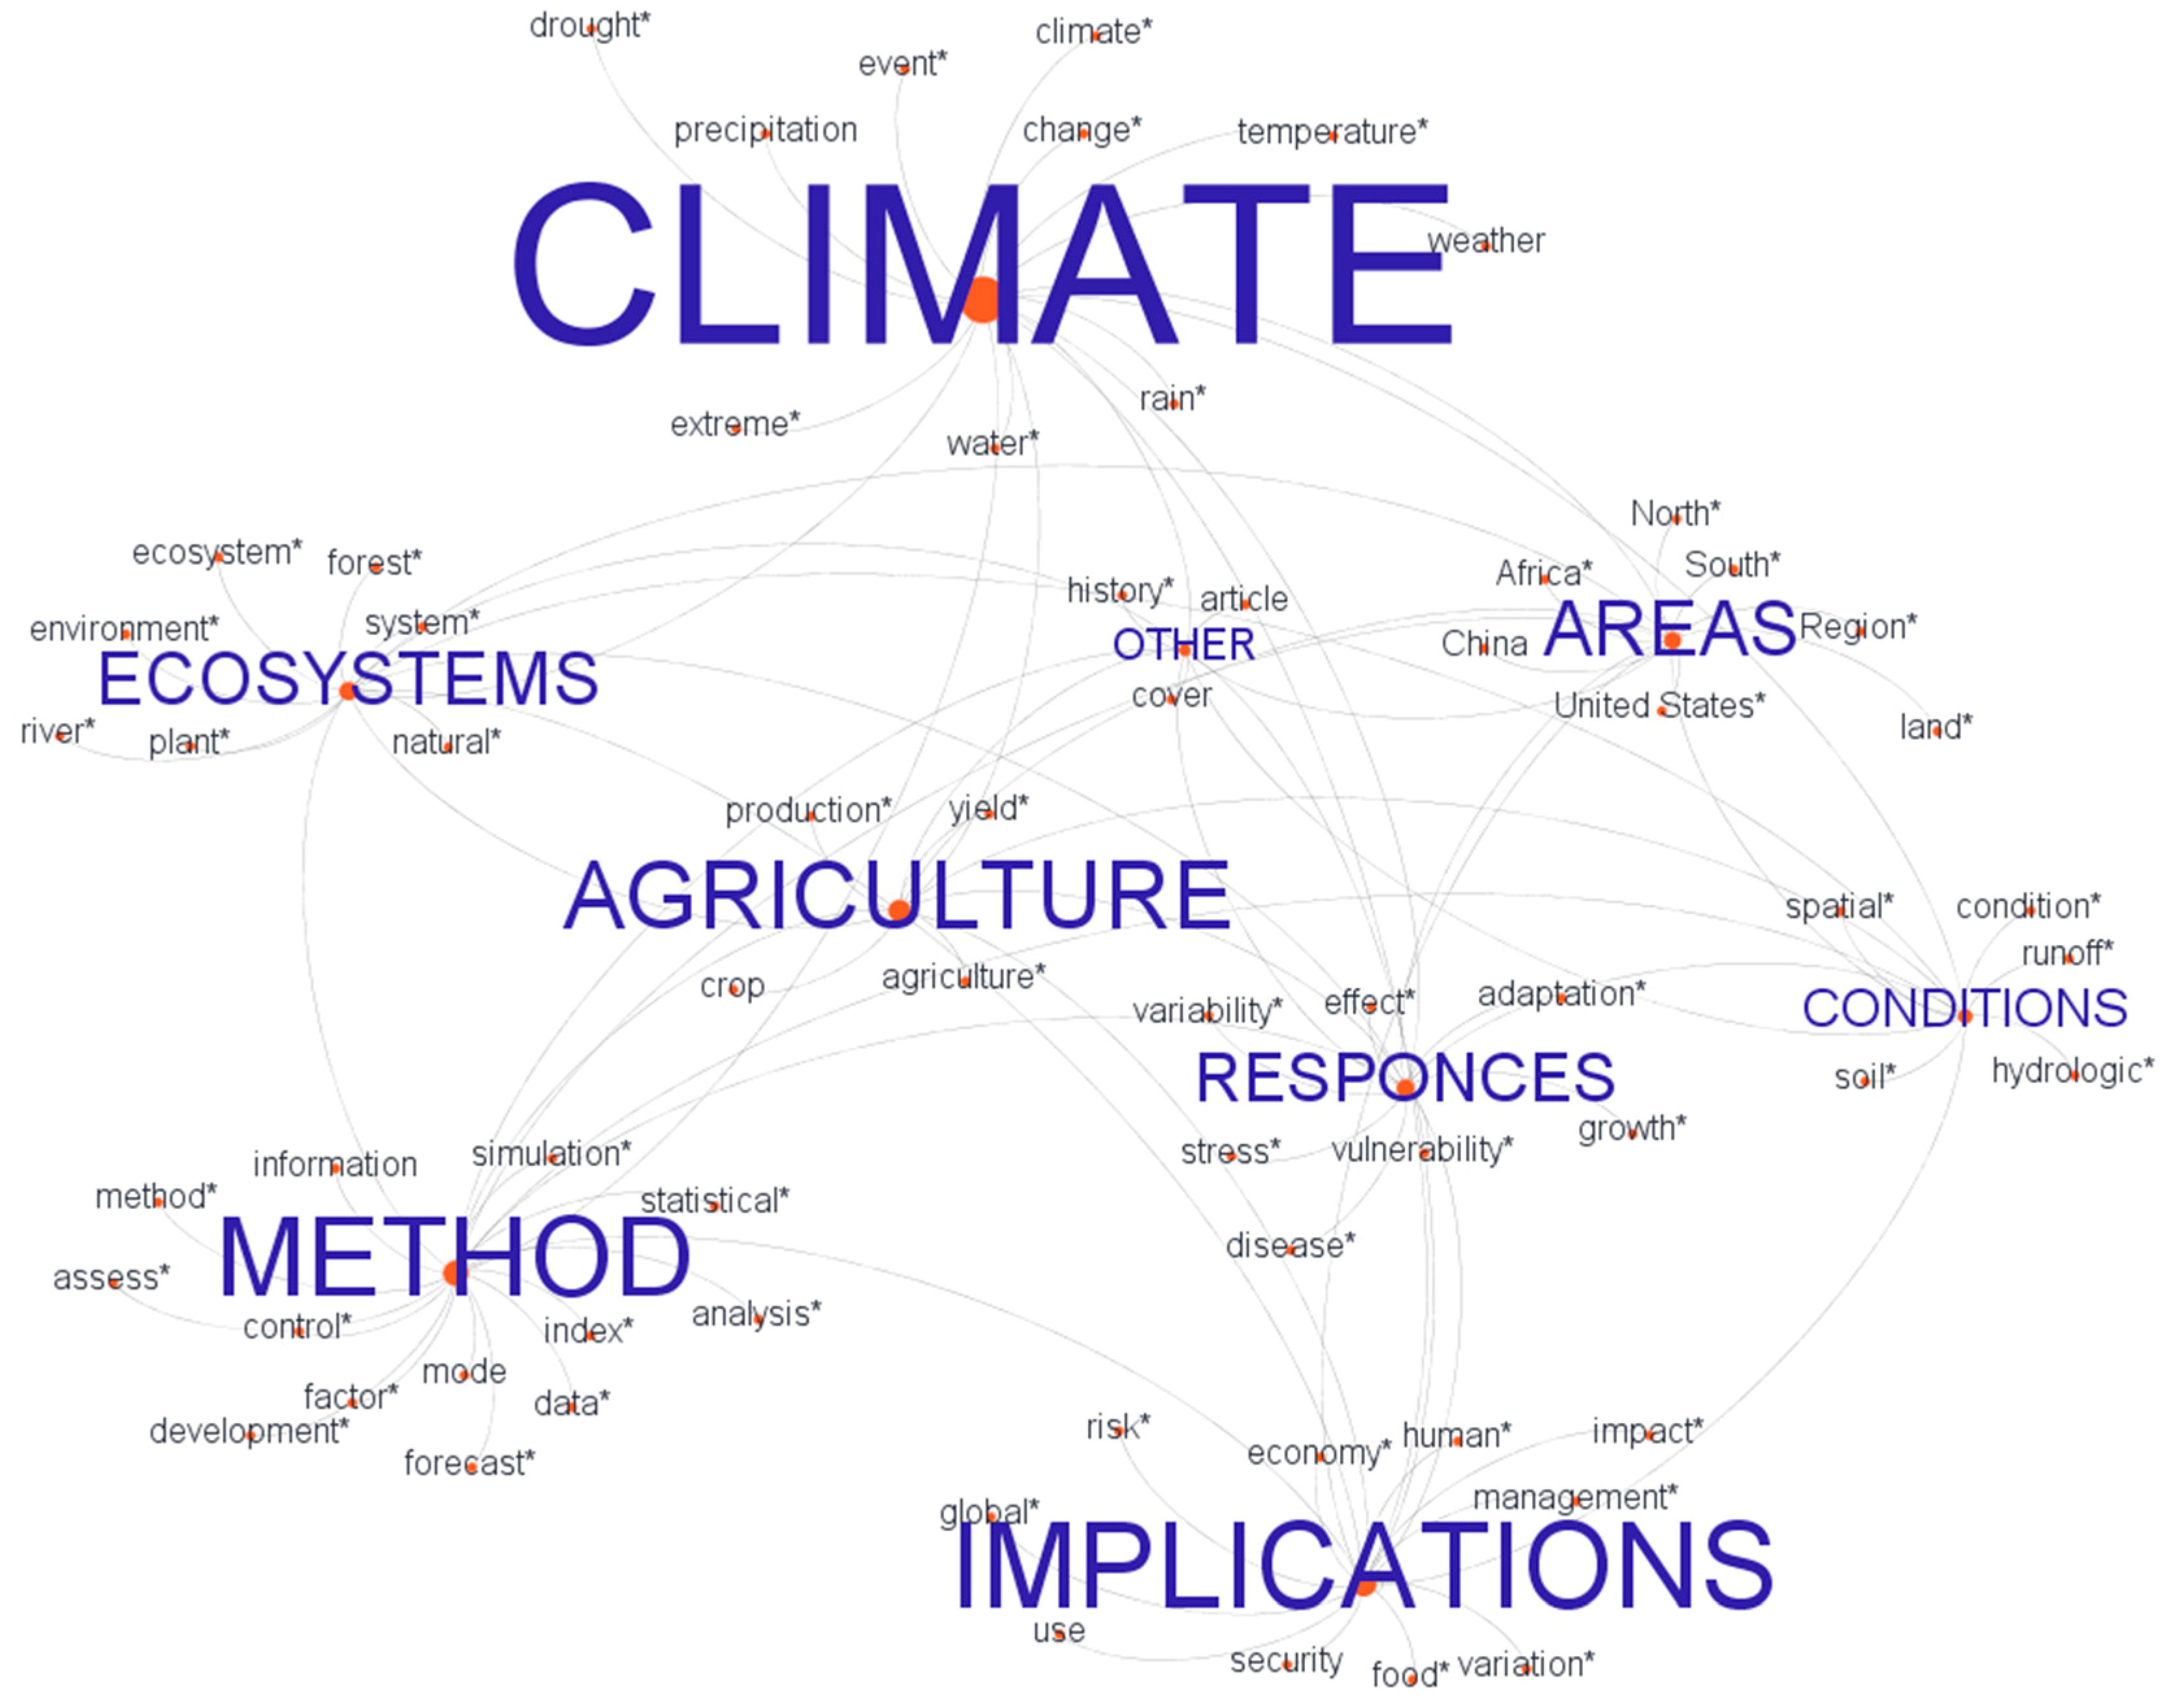
The first 500 words among the pre-processed ones of Class 1, which corresponds to 76% of total amount of this class, were grouped into eight conceptual clusters (Figure 3), plus one containing words regarding non relevant issues (not shown). To ease visualisation, the clusters represented in Figure 3 report only the top 20% of the 500 words. The cluster label dimension is proportionate to the weight of the cluster.
The largest cluster was the one concerning “Climate” which includes all words regarding climatology and weather conditions. The EWE included in the cluster were, in descending order: drought, heat waves, floods, wildfires, frost and hurricanes. Other relevant clusters were “Ecosystems”, “Methods” and “Responses” (Table 2). The cluster “Ecosystems” highlighted the lemmas associated with the environment, wildlife and forestry. The cluster “Methods” contained the words related to tools, technologies, models and protocols utilised to detect the EWE and their effects. The cluster “Responses” collected the terminology related to the effects on target, the target response and the strategies to face extreme climate conditions.
The main result from the analysis of the Cluster “Climate” was that the most relevant topics were temperature and drought, while precipitation showed a lower frequency. When excluding the first words (climate, change, extreme, weather and events), which are intended for focusing the topic of the documents, “temperature” had a weight equal to 4.7% of the total amount of the Cluster, while “water” and “drought” weighted 4.1% and 3.2%, respectively. Much lower was the frequency of other EWE, specifically “frost” (0.5%) and hurricanes (0.4%).
Within the cluster “Ecosystems”, the lemma “environment” was the most relevant (8.5%), followed by similar or linked concepts (i.e., “population”, “ecosystem”, “species”). The highest frequency words of the cluster “Methods” were connected to models (11.9%), analysis (9.1%) and weather forecast (3.9%). The frequency of some words related to the use of remotely sensed approaches were rather low (satellite 1%, remote sensing 0.8%, imagery 0.4%).
The cluster “Responses” highlights the significant interest on the effects (10.1%) and their occurrence, especially regarding growth (5.7%) and physiology (3.5%). Another interesting topic within this cluster, focusing on responses and consequences of EWE, is related to adaptation strategies (5.1%).
The analysis carried out on Class 1 provided a general overview of the state-of-the-art of the research on EWE, as a starting point for a more detailed dissection.
3.2. Class 2.1: Analysis of Trend and Geographical Distribution of Publications
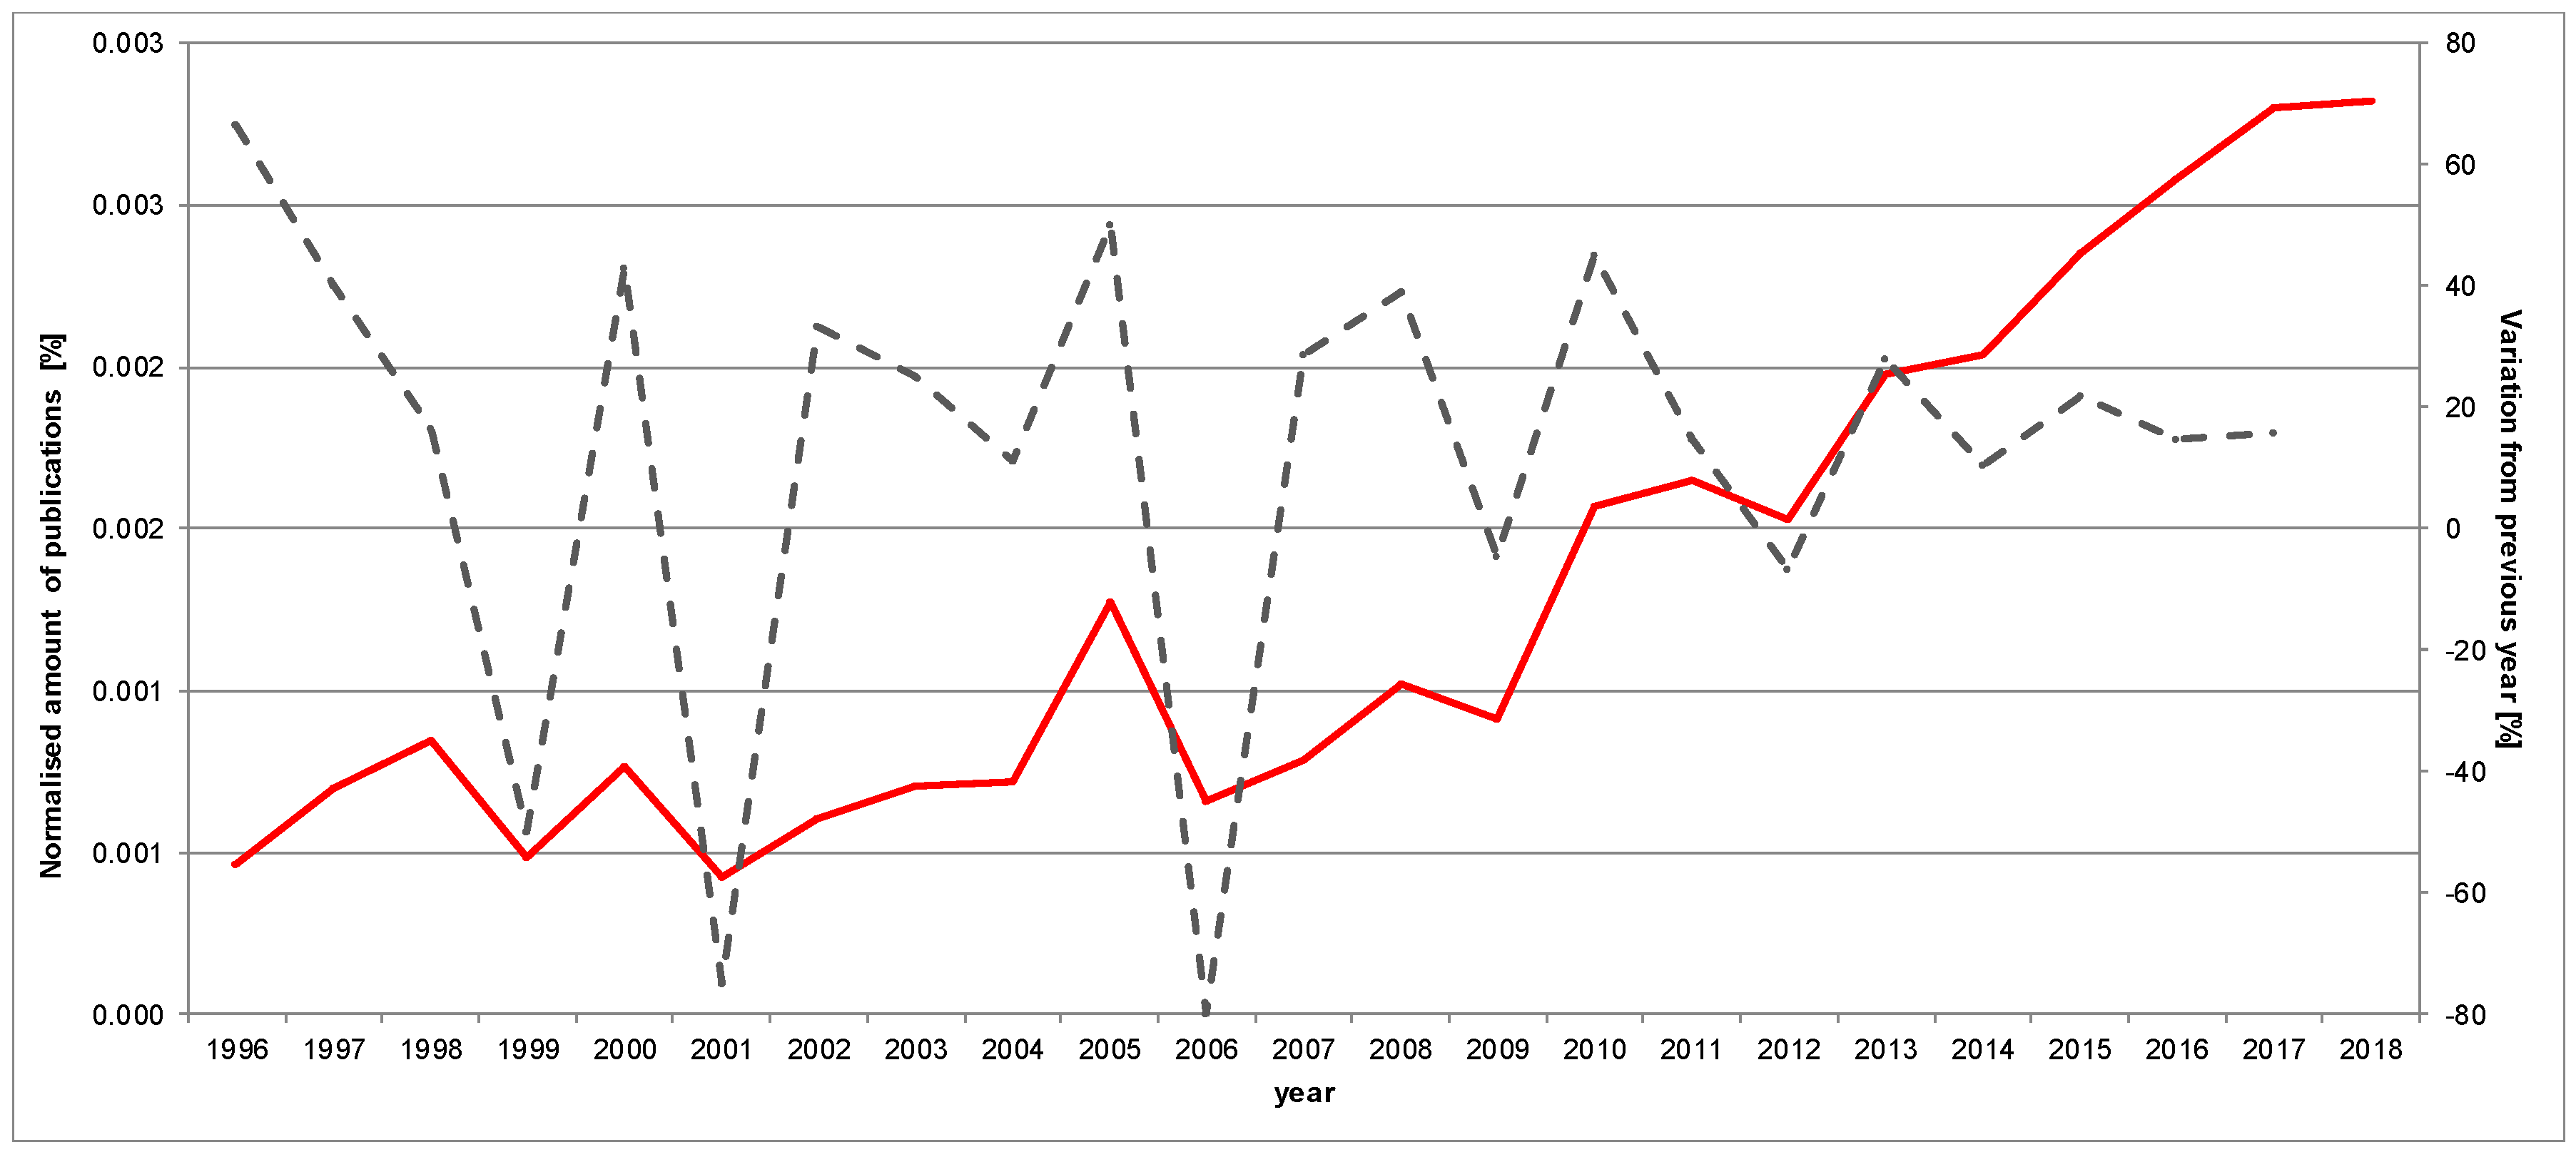
After refining the search, combining EWE and agriculture in the search form, Class 2 was created, and preliminary statistics preceded further cluster analysis. As for Class 1, the first analysis performed was the distribution of the publications over the years. The result of the advanced search in Scopus database was 806 documents published from 1970 to July 2018. In particular, 72% of the documents were classified as “article”, 11% as “conference papers”, 8% consisted of “book chapter”, 7% as “reviews”, the remaining 2% was categorised as “book” and “article in press”. The trend of the publications in the years was analysed starting from 1996 due to the sporadicity of documents published before 1995. 87% of scientific articles were published after 2007, with an average annual growth value of 24.1% (from 14 to 121 publications in 2007 and 2017, respectively). The average annual growth of the considered period was 25.5% (from 3 to 121 respectively in 1996 and 2017). Figure 4 shows trend analysis normalised on the total amount of documents including the word “agricult*” in title, keywords and abstract.
The second quantitative assessment performed was the research outputs stemming from intra-national or inter-national collaborations. Of 806 total documents, 614 are single-country contributions and 192 are international collaborative ones. All continents contributed to research, and four of them are represented in the top ten contributors. Among the top ten contributing countries, single-country documents prevailed in the top seven countries, while research groups in the other three (Italy, Switzerland and Netherlands) tended to collaborate more at international level. Based on to the number of single-country articles, India ranked second in the top ten contributors, but it showed relative lack of international collaboration (Table 3).
The US, Canada and Brazil are the three major contributors of the Americas; UK, Germany and Italy contributed the most in Europe. Within Europe, the Netherlands, Switzerland, Spain and France resulted to be the most active in terms of international collaborations.
The third country in Asia publishing research concerning EWE and agriculture, after China and India, is the Philippines. Despite reporting a minimal number of documents, South Africa, Nigeria and Kenya are the most operative countries in Africa. Australia and New Zealand are registered as equal contributors in Oceania.
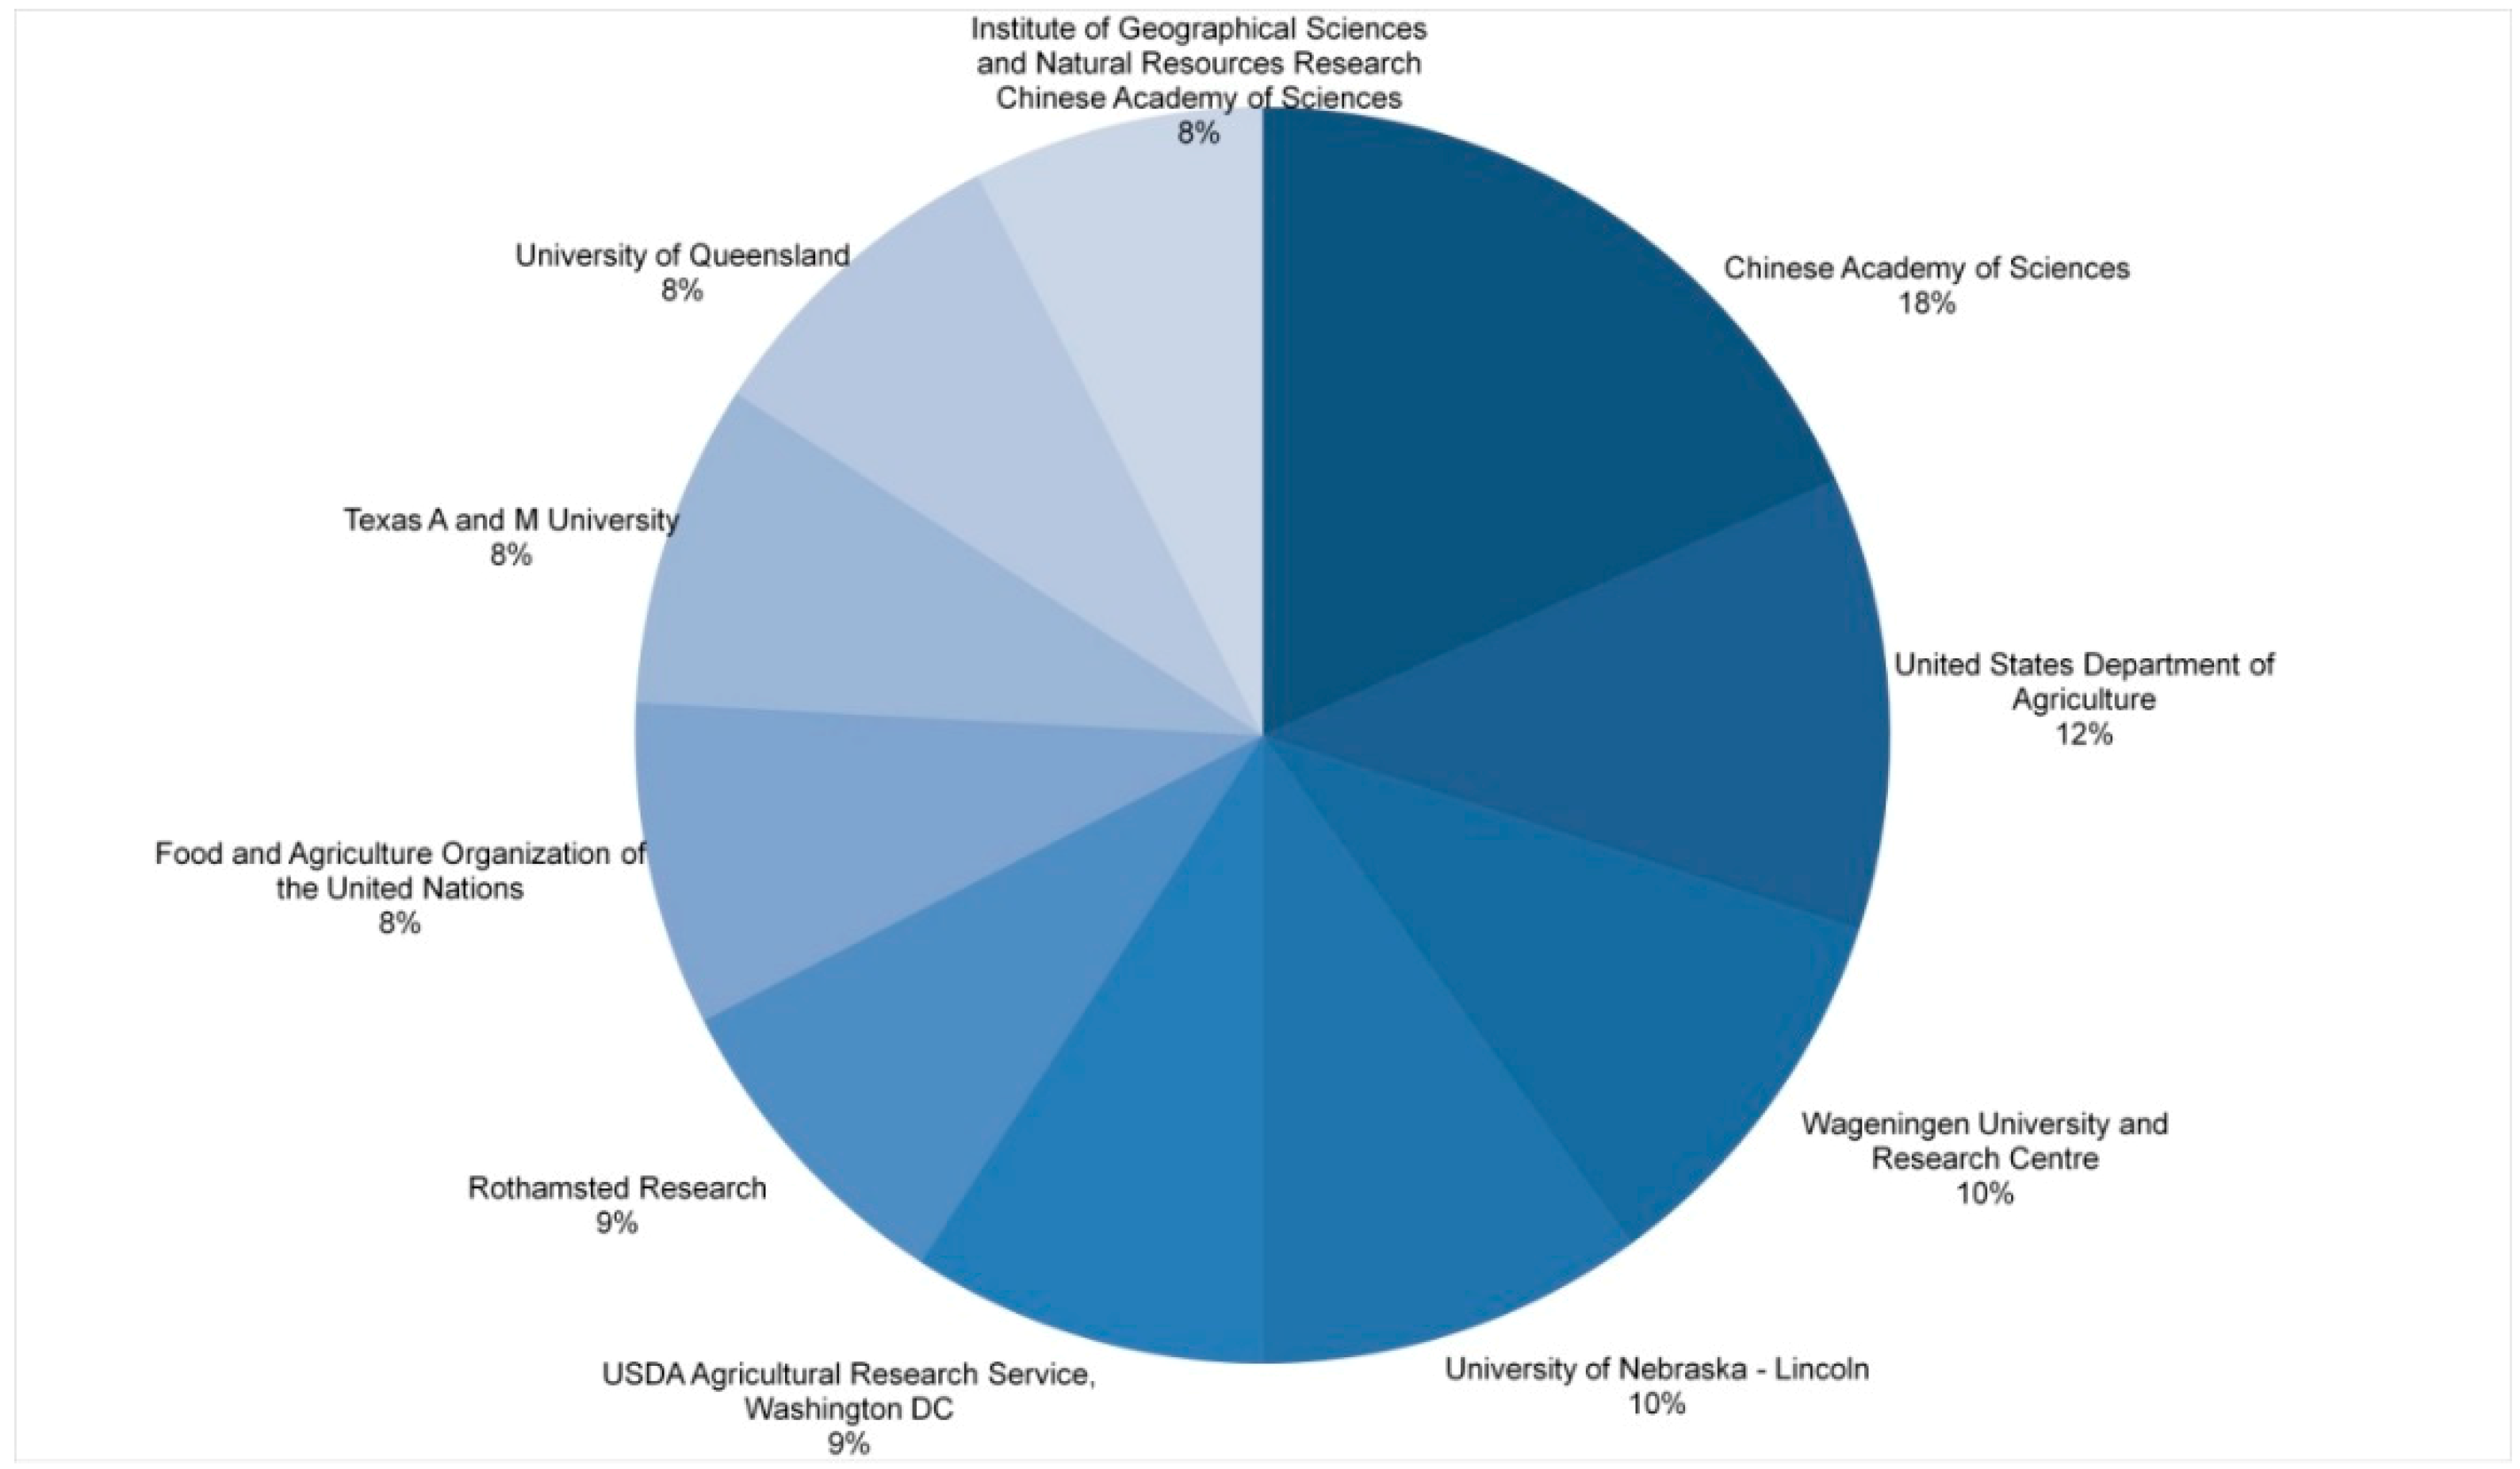
These findings were supported by the analysis of the authors’ affiliation, which confirmed that the US and China have the leadership in this field of research (Figure 5).
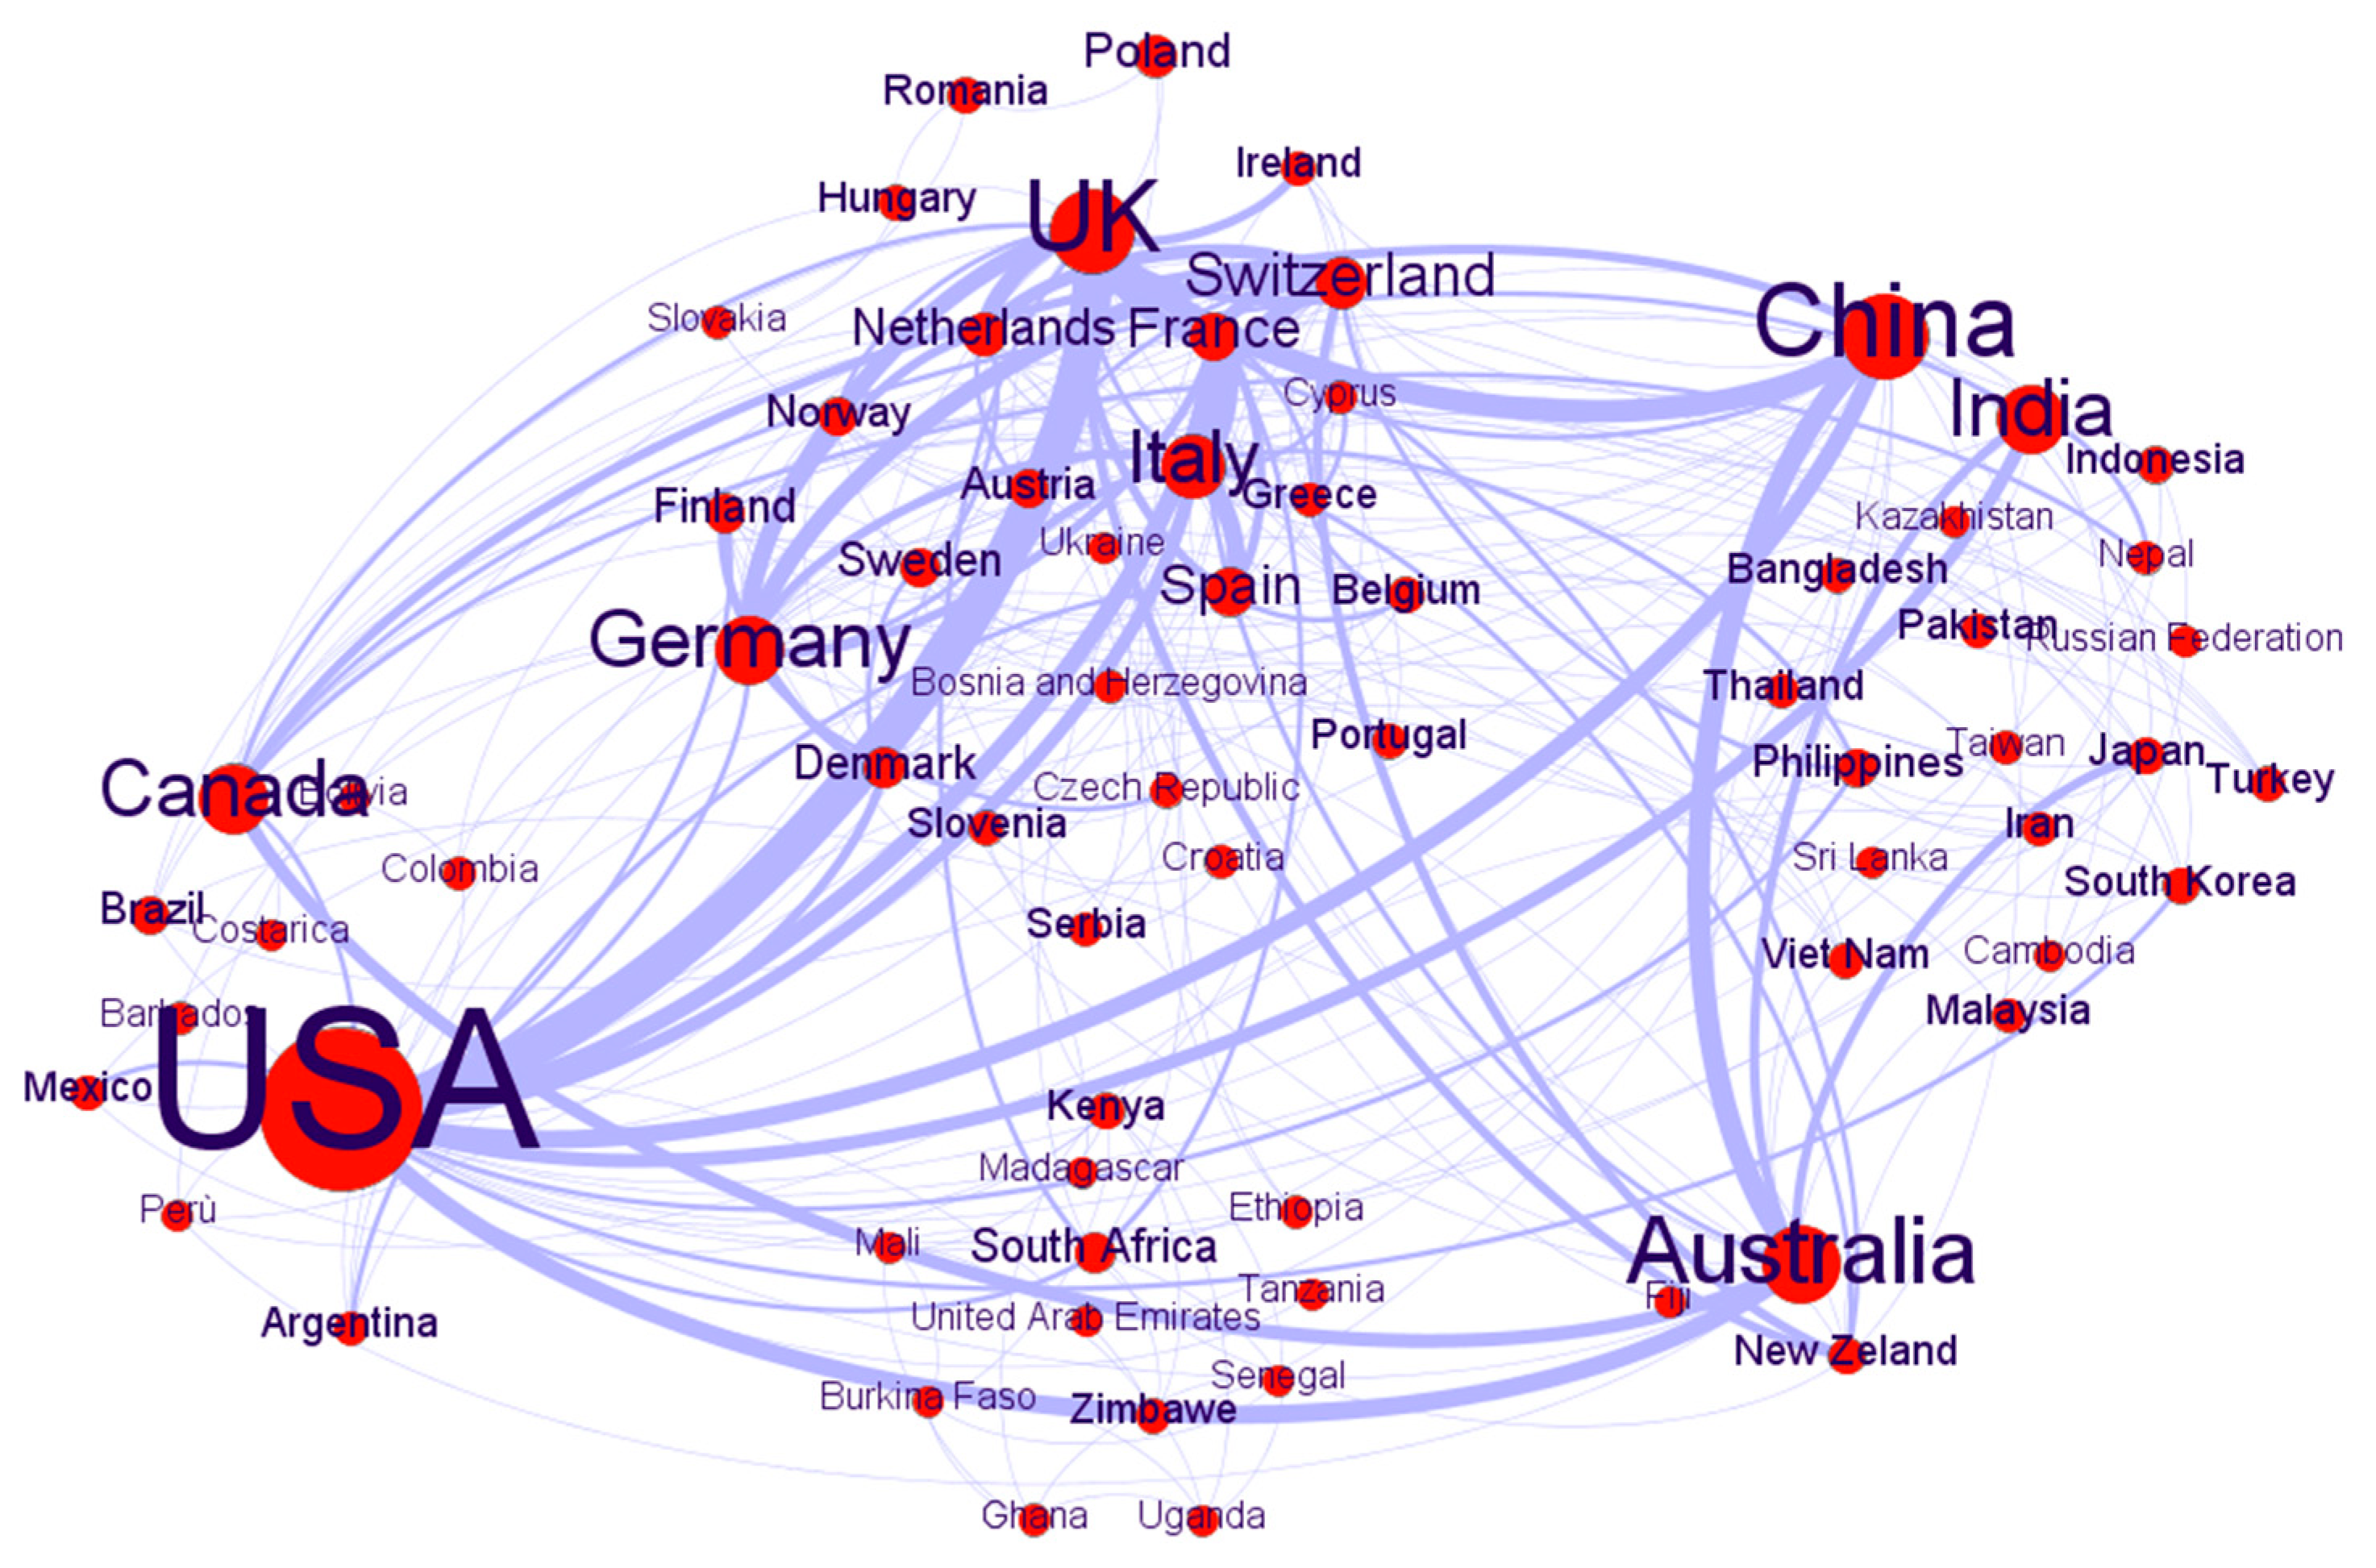
The international research collaboration was analysed through cluster analysis performed using the Gephi software. After importing the spreadsheet, the software recognised 71 Nodes (countries) and 413 Edges (links highlighting cooperation between different countries). The nodes were separated by continent in 5 clusters, running the Force Atlas layout. The node size indicates the weight of the country, intended as the total number of published documents (single-country and international collaboration). The edge thickness represents the intensity of international collaboration (Figure 6). US, UK and Australia rank first, second and third in cooperation with 62, 38 and 30 shared articles, respectively. In Europe, Italy and Germany rank second and third. Information about other countries is reported in Table 4. The most intense international collaboration was between the US and the UK, followed by the ones between France and the UK, China and the UK and China and Australia.
3.3. Class 2.2: Cluster Analysis
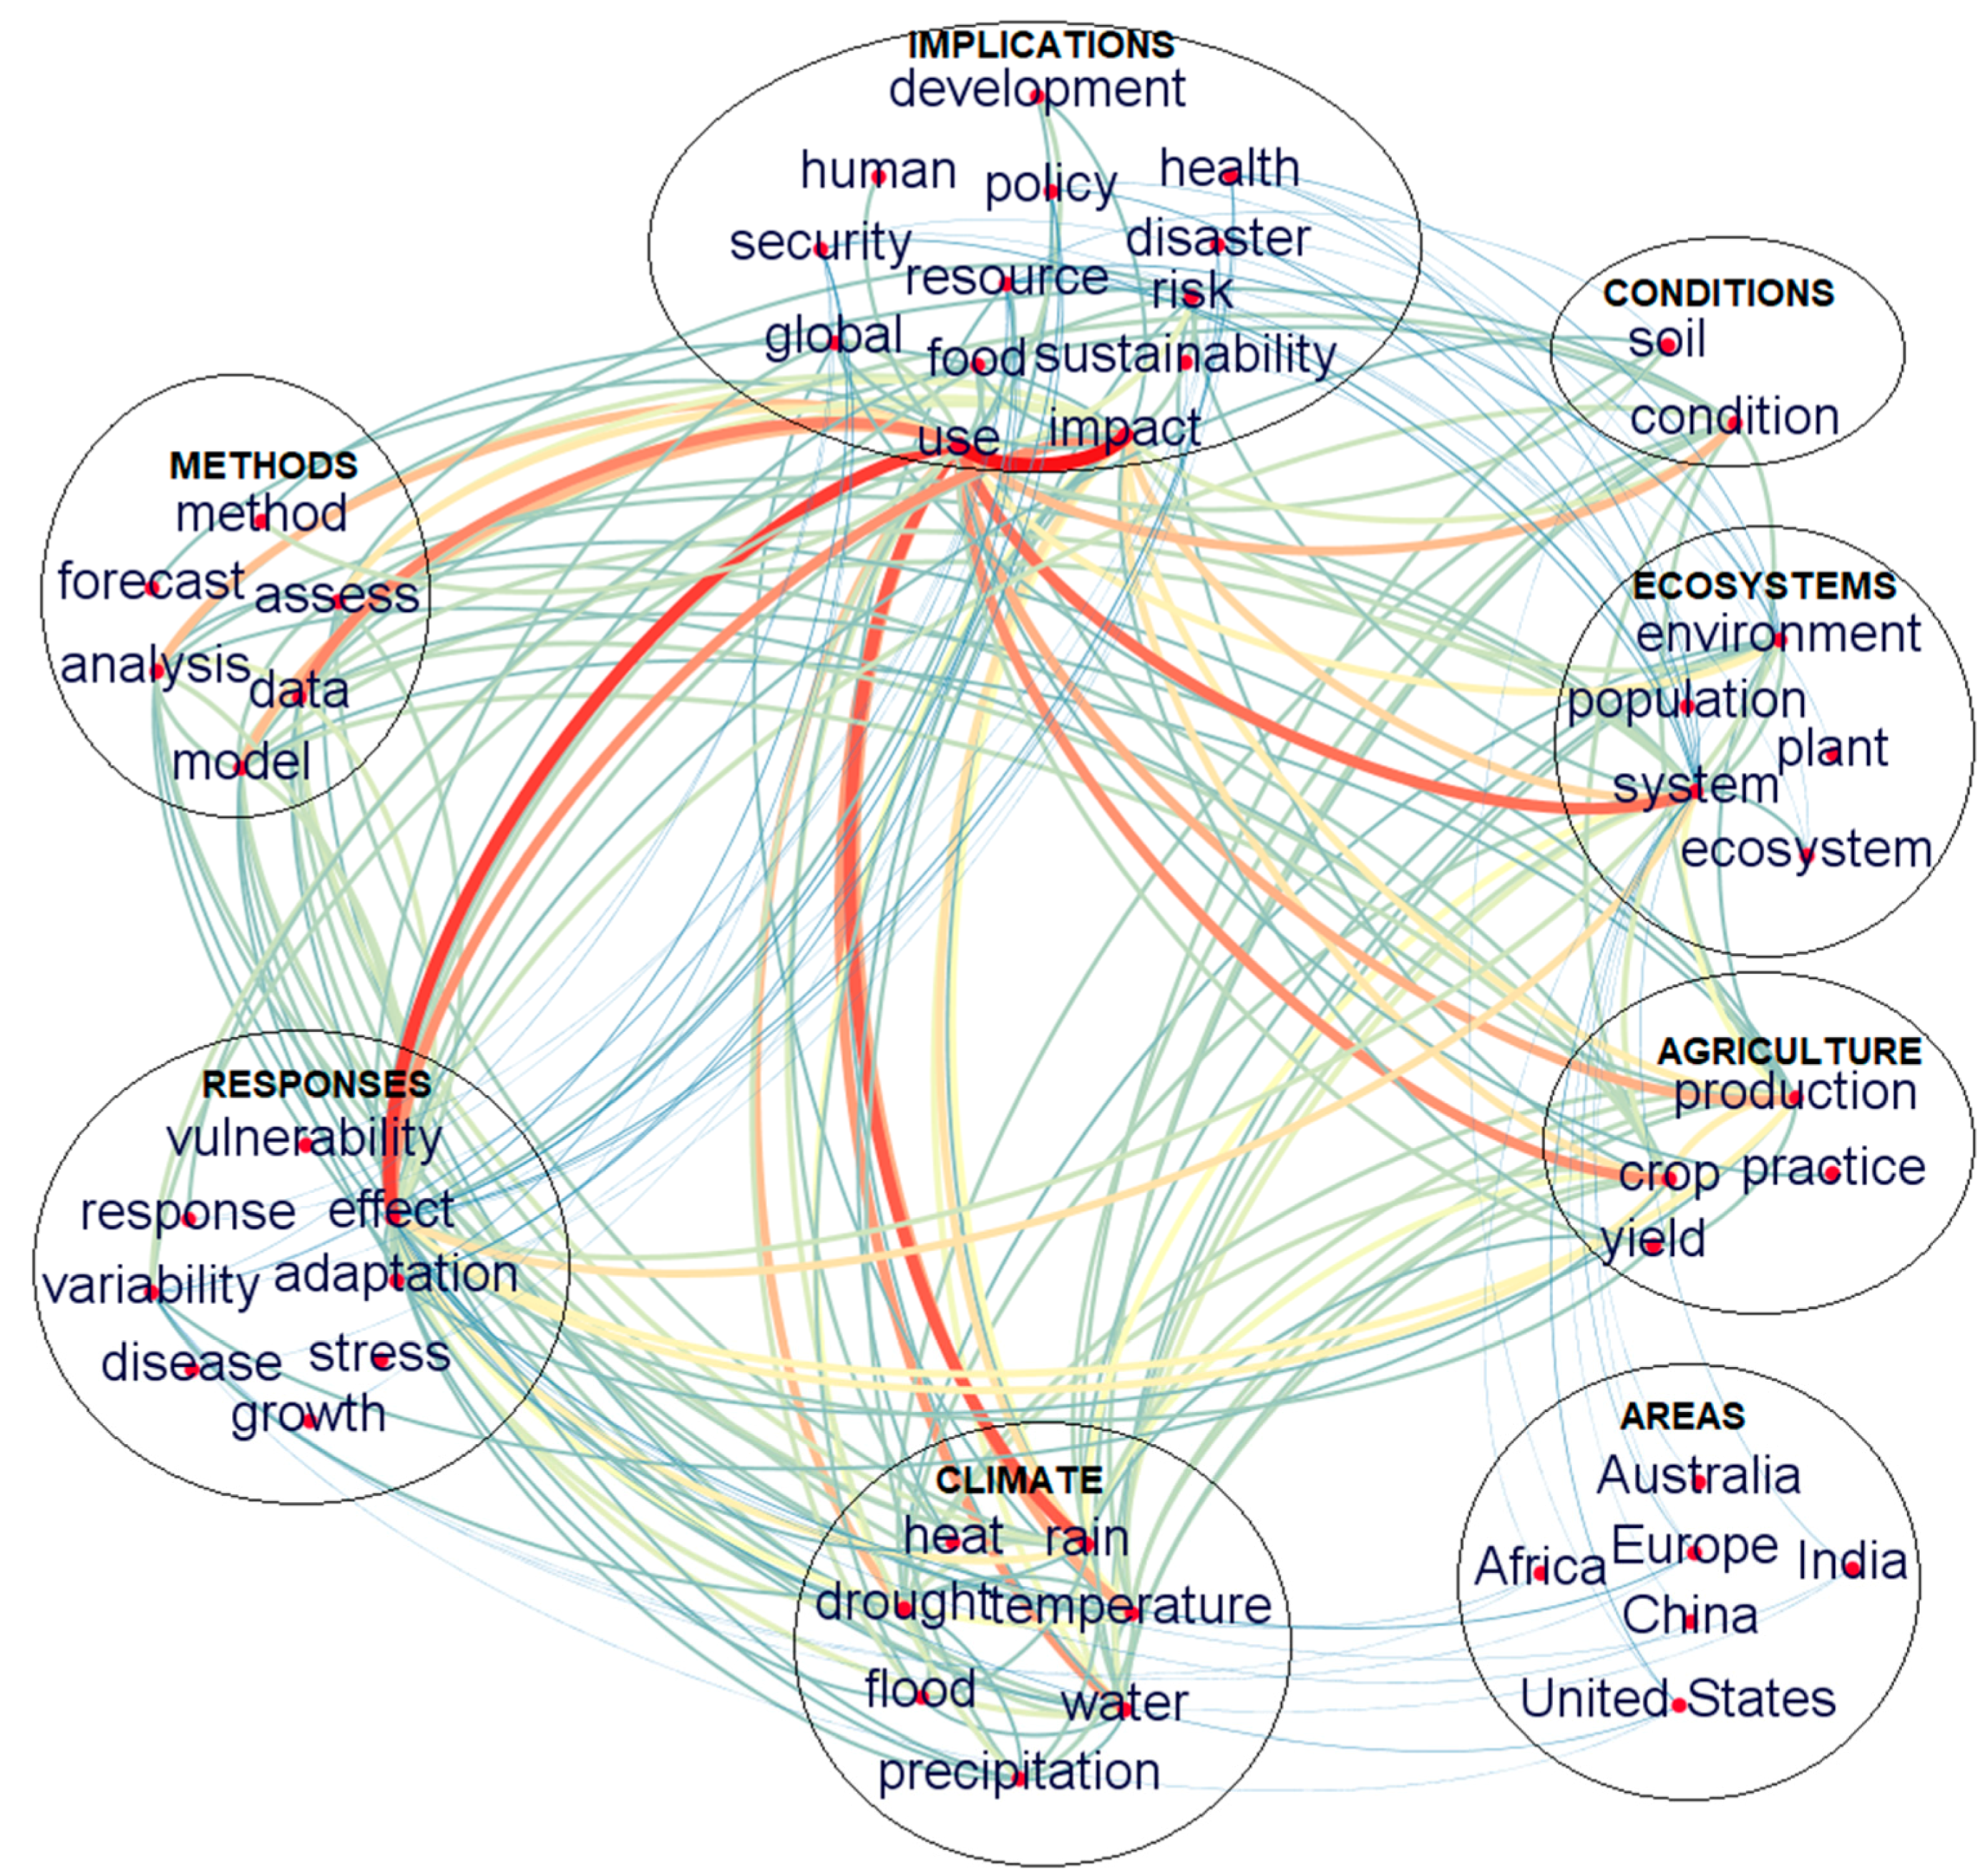
The pre-processed words of Class 2 (350, corresponding to 83% of total extracted words) were grouped in the same clusters as Class 1. Figure 7 provides an overview of the clusters and their relevant lemmas. For the sake of simplicity, only the first 20% of words are reported in the figure. The cluster label dimension is proportionate to the weight of the cluster.
Compared to Class 1 the clusters of Class 2 have different weights (Table 5). In this case, the most relevant groups resulted “Climate”, the largest one, “Implications”, “Methods” and “Agriculture”. The cluster “Implications” contains terminology highlighting the consequences of the EWE for communities: in this group the words concern situations of risk, management choices, repercussions on the economy and human health. The cluster “Agriculture” collects lemmas referring to the different crops and the management of agricultural operations.
The analysis of the cluster “Climate” led to similar results to those obtained for Class 1, and the most studied EWE were the ones related to drought stress (4.2%), increase of temperature (4.7%) and rainfall (3.6%). Other EWE faced from scientific literature were, in sequence, floods, heat waves, storm and, at lower frequency, frost and hurricanes.
Management (9.0%), risk (7.3%), impact (7.1%) and food security (6.3%) were the highest frequency words characterising cluster “Implication”. Much lower was the frequency of words related to mitigation measures (1.1%) and governance systems (0.7%).
Results for the cluster “Methods” were very similar to the ones already provided for Class.1, stressing the need for modelling and predicting weather extremes. Aside from some general lemmas, most recurrent words in this cluster were “model” (13.2%), “forecast” (5.7%), “simulation” (3.1%) and “index” (2.3%; during stemming analysis, all meteorological and climatic indices were grouped under this string). Within this group, the following principal arguments found were the ones related to remote sensing and satellite imagery (1.8%).
High-frequency words of the cluster “Agriculture” were partially devoid of real information, while it was more interesting to perform a specific statistic on different crops to verify the direction in which research is moving. After analysing only the frequencies of different crops, results showed that major attention was pointed to wheat, maize and rice, with values of 27%, 23% and 11%, respectively. A minority of documents dealt with potatoes, cotton and soybean (6%, 6% and 4%, respectively), with the other crops not contributing more than 3%.
An overview of the other clusters resulted in rivers, forests and sea appearing to be the most frequent topics of cluster “Ecosystems”, while carbon and pollution were the main causes of concern within the environmental emergencies. Reactions by plants and ecosystems were grouped in the cluster “Responses”. A reporting frequency of 16% clearly showed that the literature emphasises adaptation strategies. Variability, growth and vulnerability were hotspots of the academic research. The following lemmas are related to the consequences for the plants, in particular diseases. The terminology classified under the cluster “Conditions” dealt with abiotic agents different from climate, mainly concerning soil and hydrologic characteristics. The effects of EWE cannot be contemplated without considering concurrent factors which may contribute to enhance or, conversely, contain their impact. Furthermore, some EWE, such as precipitation and flood, are affecting, for their part, the stability of biotopes. When excluding the first overview words, the main arguments found within this cluster were related to the mechanisms dealing with the soil-air interface (runoff, 6%; surface, 5%, erosion 5%, catchment 4%).
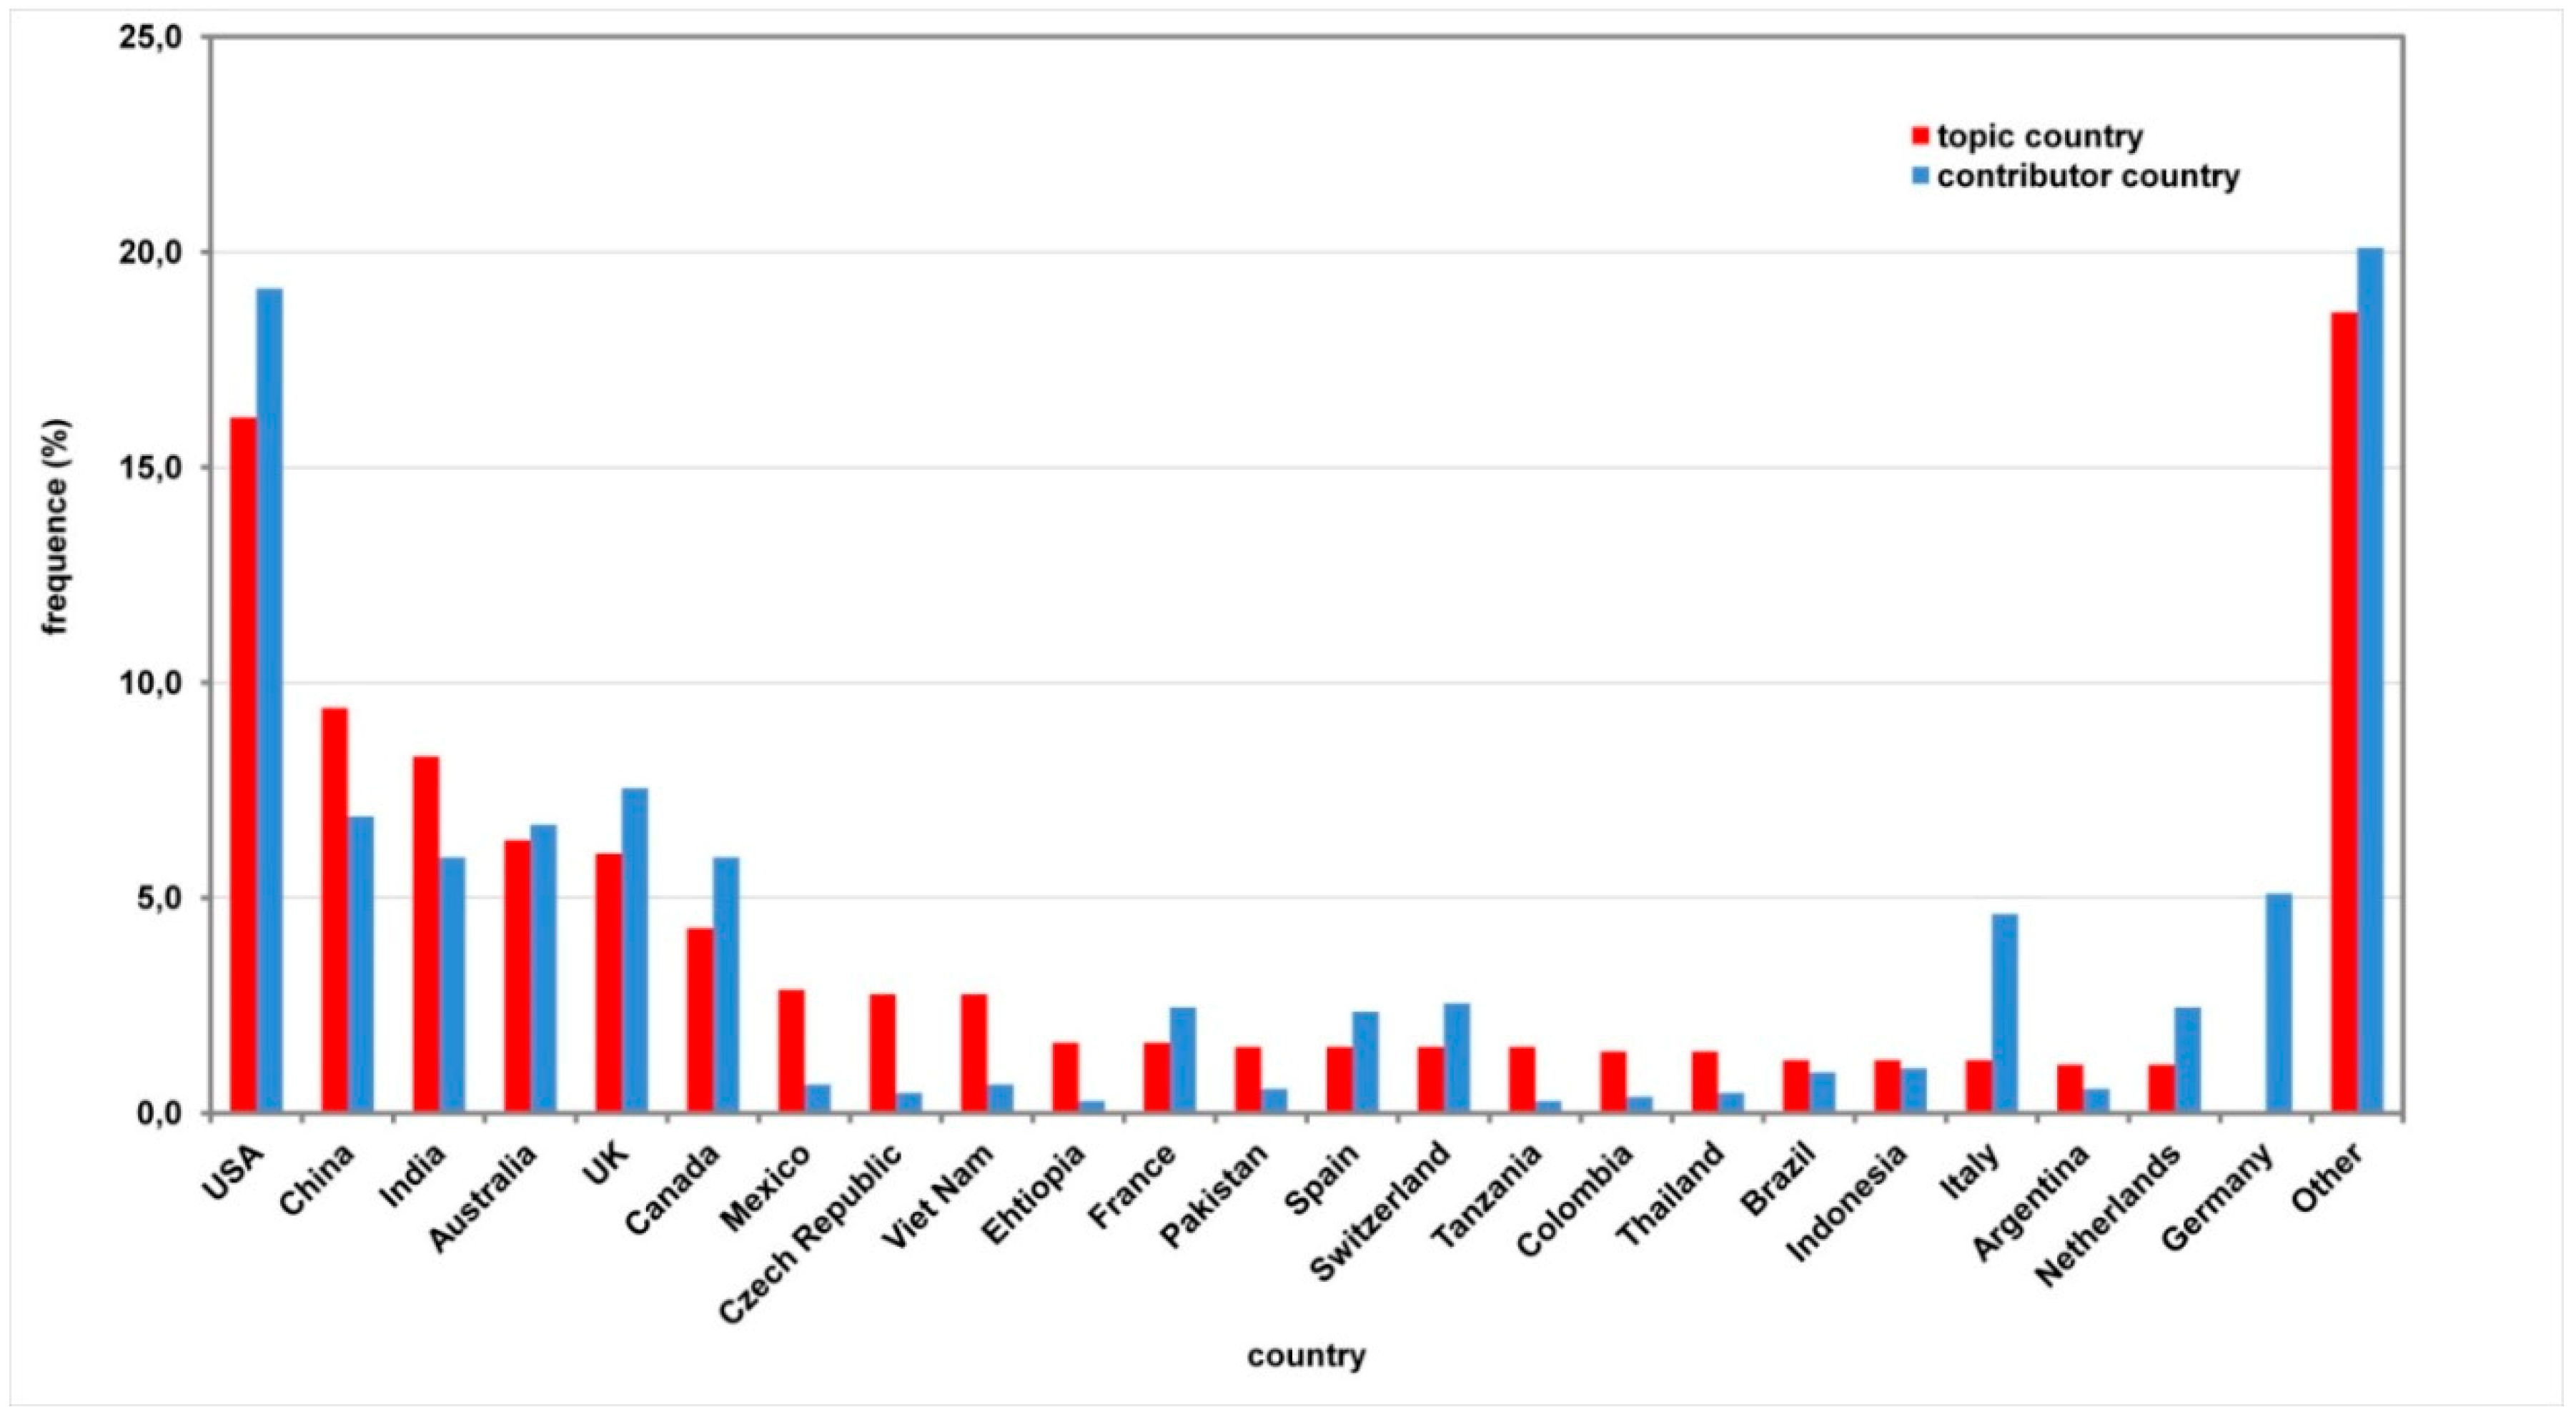
The cluster “Areas” was the collection of lemmas providing geographical details. As noticed for other clusters, some of the high-ranking words did not provide real information (i.e., “land”, “region”), and so a further analysis was performed to highlight which countries have been objective of scientific research. When focusing on top ranking countries, research was mainly biased toward largest and richest nations (United States 19.2%, United Kingdom 7.5%, Australia 6.7%) which are the less vulnerable [36,37,38]. Nevertheless, going through the list, it is noticeable that a substantial number of documents deal with developing countries (China 6.9%, India 5.9%, Viet Nam 0.7%).
By comparing the frequencies of the contributor countries and those of the countries appearing as topic in cluster “Areas” it resulted that some nations (i.e., Germany, Italy) focused their search mainly on other countries emergencies and, vice versa, others (i.e., Mexico, Viet Nam) are objective of international interest (Figure 8).
3.4. Class 2.3: Interrelationships among Variables
The words interrelations were analysed to provide specific information on how main topics belonging to the same or different clusters are addressed together. The words in the title, keywords and abstract sections were correlated to highlight the co-appearing words and their frequency. The investigation was performed on the highest frequency words of each cluster and led to a high number of interrelations (Figure 9).
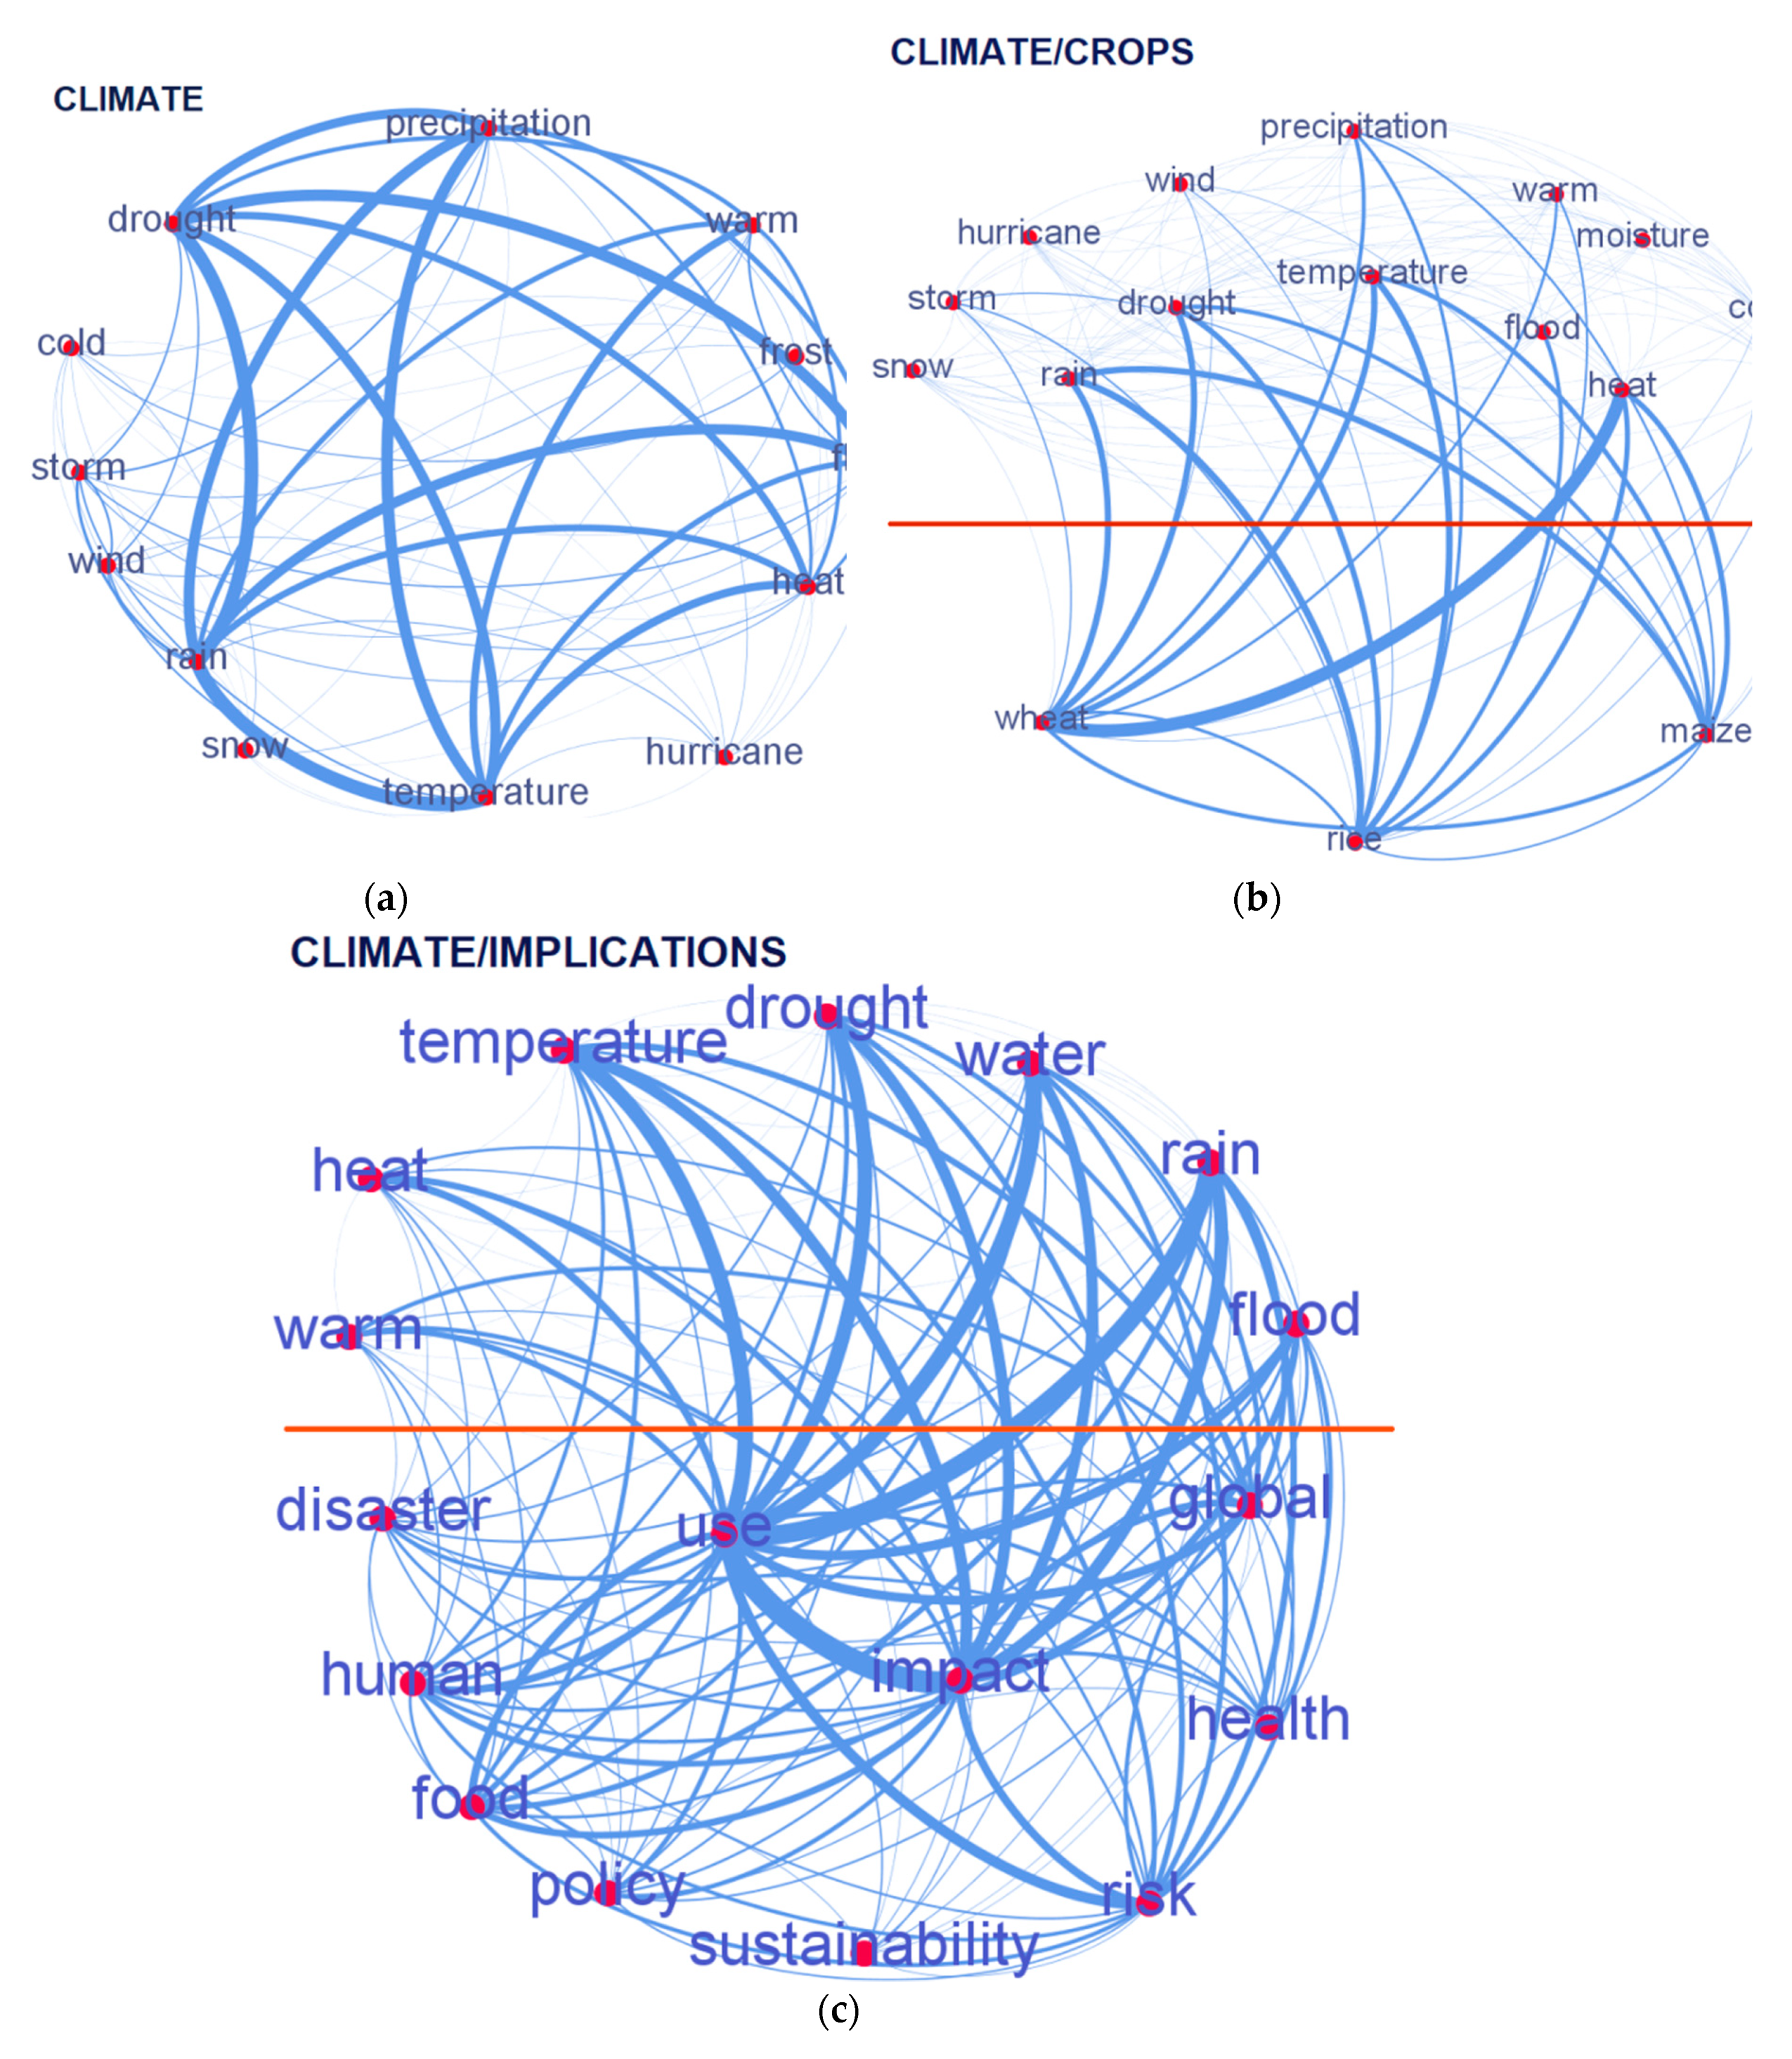
First of all, the connections within the cluster “Climate” were considered. The statistical analysis highlighted that the scientific community had researched all EWE (Figure 10a).
Figure 10b shows the analysis of the interconnections between EWE and the most widespread crops in the world. Drought stress and rainfalls were correlated to maize, wheat and rice. Heat waves seemed the most alarming weather event concerning wheat, while floods are relevant only for rice. For these crops, the correlations with other hazards, such as frost, hurricanes and moisture are very weak.
The analysis of the interactions between the lemmas belonging to the cluster “Climate” and the cluster “Implications” highlighted that drought stress and heavy rainfall had high correlations with many topics related to societies and, in particular, with food security (Figure 10c).
Drought stress and rainfall were the weather events more connected with words of the other clusters.
4. Discussion
The issues related to the EWE and their effects on the environment, agriculture and economy are a recent research topic. This aspect is confirmed by the fact that 85% of publications of Class 1 have been published starting after 2008 and 87% of Class 2 after 2007. In such a relatively short time span, all the most alarming EWE have been considered by the scientific community, as shown by the cluster analysis of both Class 1 and Class 2. These results are consistent with the evidence from the report of the Intergovernmental Panel on Climate Change (IPCC) claiming, as a result of climate observations since 1950, that EWE are very likely to occur through a decrease in cold temperature extremes and an increase in warm temperature extremes and heavy precipitation events [15].
4.1. Cluster Analysis: Trend and Gaps in the Research
The analysis of the methods and technologies currently in use (Cluster “Methods”) highlighted the reliance of scientists on models simulating different potential scenarios and the crucial role of the weather forecasting. “Model”, “analysis” and “forecast” were, indeed, the highest-ranking words of this Cluster both in Class 1 and Class 2 (Table 2 and Table 5). However, there seems to be a lack of research on remote sensing, sensors and imagery as tools for detection of EWE and their effects. Lemmas related to these tools showed frequency lower than 1.8% in both Classes. The application of sensors for field noninvasive analysis underlies precision agriculture, based on real-time crop mapping. Some application of sensor-based technologies to detect abiotic stress has been investigated, i.e., for detection of drought stress in barley using hyperspectral images [39] and in maize utilising spectral indices and IR-temperature [40]. Matese and Di Gennaro [41] tested the applicability of RGB, thermal and multispectral sensors to detect water stress index in vineyards. Despite examples mentioned of application of sensor-based technologies for early abiotic stress detection, the current review highlights the lack of exhaustive research in this field.
Based on the results of the specific analysis of different crops appearing in cluster “Agriculture”, the scientific community focuses primarily on wheat, maize and rice (27%, 23% and 11%, respectively). These crops are the top three crops in the world in terms of planted area [42,43]. Nevertheless, when considering the production value per square kilometer, tomatoes and grapes appear to be the most lucrative crops [44]. This quantitative review showed that the frequency of lemma “Vitis” in documents of Class 2 is very low (0.9%), while Class 1 and 2 do not contain any document dealing with tomatoes. The limited research on the effects of EWE in grapevine is particularly critical since grapevine is a perennial crop, meaning that the impact of EWE might be particularly severe because they could affect its production also in the following years.
In the cluster “Responses”, adaptation and plants’ response mechanisms are addressed using a framework approach, ranging from vulnerability to strategies to avoid or, conversely, taking advantage of EWE. Undoubtedly, the hotspot of research is adaptation strategies to cope with adverse environmental conditions. This information emerges particularly from cluster analysis of Class 2, where there is a difference of 13.6 percentage points between “adaptation” and the following analysed word.
Since words classified in cluster "Conditions" are contributing factors, they are equally and homogeneously considered by scientists, although it can be observed that there is a more significant interest on topsoil. The topsoil is the plant-root-soil interface, providing the majority of water and nutrients, and containing microorganisms which are crucial for plant’s growth. Considering the topsoil’s more significant influence on vegetation, scientists’ efforts have been focused on it.
The analysis of the cluster “Implications” highlighted the urgency to provide risk management practices to reduce the potential impact of EWE. Table 5 shows that “management”, “risk” and “impact” are the top-ranking lemmas of the cluster in Class 2 and the analysis of Class 1 led to similar results. A crucial topic of this cluster is “food”, as the main implications of CC and EWE on food could likely be the exacerbation of food insecurity, particularly in the emerging countries. For example, Knox et al. [45] estimated that by 2050, under a +1.6 °C scenario, the yields of wheat, maize, sorghum and millet in Africa and South Asia will decrease by 8% compared to current production levels. A recent research reports that a one degree Celsius warming would induce yield losses on 65% of maize-growing African areas [46]. A study about the effects of CC in the United States based on ten global circulation models forecasts a decrease of yield by 4.6% for each 1 °C simulated for maize and by 3.8% for wheat [47]. The effects of EWE could have negative consequences on global markets. The unpredictability of EWE increases the risk of the variability of production, leading to uncertainty for future price trends. This variability can be more or less pronounced depending on the phenological stage the crop is hit by the EWE. These considerations could explain why one of the high-ranking lemmas in cluster “Implications” is “economy”. Table 5 shows that “economy” appears within the highest-ranking words of Class 2 with a frequency of 3.7%. The development of adaptation strategies to cope with world hunger challenge is becoming a key issue for both the agricultural and the scientific community, as already discussed for Cluster “Responses”. The analysis of Cluster “Implications” highlighted that fewer documents handle crucial topics such as mitigation measures, with a frequency of 1.1% and governance systems, with a frequency of 0.7%. Mitigation measures and governance systems can be considered gaps and will have to be investigated in greater detail.
The evaluation of the topic “Ecosystems” highlighted that international research is focusing on the analysis of the dynamics of EWE related to different ecosystems. In particular, rivers, forests and sea resulted the most relevant concern. These topics were not related to the effects of EWE within the agricultural sector. This, however, was beyond the scope of this study and therefore the cluster “Ecosystems” was not further analysed.
Lastly, the analysis of the cluster “Areas” highlighted that there is a lack of research concerning the vulnerable countries, intended as developing countries where the effects of EWE could be more alarming as showed in Figure 8.
4.2. Geographical Distribution of Publications
The analysis of the geographic distribution of literature carried out through the examination of the authors’ affiliation (Figure 5) and contributor countries (Figure 8) showed that the most active nations are the US (19.2%), the UK (7.5%) and China (6.9%). The United States is undoubtedly the largest contributor country, but it might be noticed that US’s first publication is dated 1978, while the most productive Asian countries, China and India, started publishing later, in 2005 and 2004 respectively. The analysis highlighted the low level of international collaboration of the vulnerable countries. Figure 5 points that the vast majority of joint research concern the Americas and Europe, while, except for China, Asia and Africa are not very active in international collaboration. It must be underlined that most of the developing countries have only more recently been approached through international research. Furthermore, applied research fields, such as Agricultural Sciences shows high growth rates of international collaboration [48]. It is therefore likely that this gap will be partially filled in the next years.
4.3. Interrelationships among Variables
CC arises through an increase of co-occurring EWE, causing severe and unpredictable damage to agriculture. The correlations examination shown in Figure 10a highlighted the importance of studying multiple EWEs at the same time. The high value of co-occurrence of lemmas “rain”, “temperature” and “drought” indicated that the EWE rainfall and drought stress were frequently concurrently analysed. Contrarily to what it can be expected, the interrelation between drought and heat waves was less strong. The responses of the vegetation to a single event might, indeed, are different from one to a combination of simultaneous or subsequent EWE. In particular, Figure 10b shows that the effects of drought stress and rainfalls are considered a threat to maize, wheat and rice, while floods are relevant only for rice. Rice is in fact used as a model crop to develop possible adaptation and breeding strategies for other crops in relation to flooding, and thus hypoxia/anoxia tolerance. The analysis of the interactions between lemmas belonging to the cluster “Climate” and cluster “Implications” is reported in Figure 10c. It underlines that the most relevant concerns for communities related to global CC are the lack of water due to drought stress and heavy rainfall threatening food security.
The decision to perform a quantitative review allowed for the analysis of a high number of documents that would not have been possible through qualitative review. This method ensures replication of results and a reduction of the subjectivity, which might affect the choice of the documents and their interpretation. The high number of documents analysed enabled us to identify the hotspots and gaps, grouping the words into clusters. The knowledge of the hotspots and gaps may represent a user-friendly document, easy to navigate and to communicate.
5. Conclusions
Given the relatively recent expansion of interest in the topic of the EWE in agriculture, a literature review was necessary to take stock of the situation, contributing to a better understanding of the research structure. In this analysis, an extensive examination of impact, effects and strategies to cope with the EWE in the agricultural sector was presented. Despite the expansion of interest about EWE, the results of this research showed that some gaps still need to be filled. Specifically, the findings of the quantitative review suggest that a future effort should be focused on lucrative crops, such as tomatoes and grapes. The present review highlighted that, to date, studies on EWE effects on agricultural crops using remote and proximal sensing technologies are lacking, as compared to other methodologies, i.e., process-based modeling, field ecophysiological measurements and simulation scenarios. Remote and proximal sensing methodologies are playing an increasingly important role in the agriculture sector [49,50], and their application to the topic of EWE will need to be enlarged. Furthermore, as already stressed by other authors [51,52,53] this manuscript showed that there is a serious concern for food security and economic losses due to EWE. For this reason, future research will have to cope with mitigation measures and governance systems, addressing attention especially towards developing countries.
These findings should stimulate scientists towards deficient topics, contributing to the improvement of scientific research.
The approach used in this study allowed the analysis of a high number of documents and the identification of the gaps of research. On the other hand, the availability of single words extracted from title, keywords and abstract does not provide the global perspective and relations among lemmas. Moreover, it has to be taken into account that text analysis imposes the interpretation of single words linked to other sectors and not relevant to the objectives of the study.
Author Contributions
Conceptualisation, A.C., F.M. (Franco Marinello), F.M. (Francesco Meggio); collecting data and research methodology, A.C., F.M. (Franco Marinello); validation and formal analysis, A.C., F.M. (Franco Marinello), F.M. (Francesco Meggio); data curation, F.M. (Franco Marinello); writing—original draft preparation, A.C., M.D.A.M., F.M. (Franco Marinello), F.M. (Francesco Meggio); writing—review, A.C., M.D.A.M.; supervision, F.M. (Franco Marinello).
Funding
The present project is funded by Italian Ministry of Research and University (MIUR) in the frame of SIR 2014, cod. RBSI14H5R0.
Conflicts of Interest
The authors declare no conflict of interest.
References
- IPCC. Managing the risks of extreme events and disasters to advance climate change adaptation. In A Special Report of Working Groups I and II of the Intergovernmental Panel on Climate Change; Field, C.B., Barros, V., Stocker, T.F., Qin, D., Dokken, D.J., Ebi, K.L., Eds.; IPCC: Geneva, Switzerland, 2012. [Google Scholar]
- Motha, R.P. The Impact of Extreme Weather Events on Agriculture in the United States. In Challenges and Opportunities in Agrometeorology; Springer-Verlag: Berlin/Heidelberg, Germany, 2011; pp. 397–407. [Google Scholar]
- Frei, C.; Schöll, R.; Fukutome, S.; Schmidli, J.; Vidale, P.L. Future change of precipitation extremes in Europe: Intercomparison of scenarios from regional climate models. J. Geophys. Res. Biogeosci. 2006, 111, 1–22. [Google Scholar] [CrossRef]
- Schär, C.; Vidale, P.L.; Lüthi, D.; Frei, C.; Häberli, C.; Liniger, M.A.; Appenzeller, C. The role of increasing temperature variability in European summer heatwaves. Nat. Cell Boil. 2004, 427, 332–336. [Google Scholar] [CrossRef] [PubMed]
- Smith, M.D. The ecological role of climate extremes: Current understanding and future prospects. J. Ecol. 2011, 99, 651–655. [Google Scholar] [CrossRef]
- Fischer, E.M.; Beyerle, U.; Knutti, R. Robust spatially aggregated projections of climate extremes. Nat. Clim. Chang. 2013, 3, 1033–1038. [Google Scholar] [CrossRef]
- Ben-Asher, J.; Garcia, A.G.Y.; Hoogenboom, G. Effect of high temperature on photosynthesis and transpiration of sweet corn (Zea mays L. var. rugosa). Photosynthetica 2008, 46, 595–603. [Google Scholar] [CrossRef]
- Shah, N.; Paulsen, G. Interaction of drought and high temperature on photosynthesis and grain-filling of wheat. Plant Soil 2003, 257, 219–226. [Google Scholar] [CrossRef]
- Torrion, J.; Setiyono, T.D.; Cassman, K.; Specht, J. Soybean Phenology Simulation in the North-Central United States. Agron. J. 2011, 103, 1661–1667. [Google Scholar] [CrossRef]
- Souza, G.M.; Catuchi, T.A.; Bertolli, S.C.; Soratto, R.P. Soybean Under Water Deficit: Physiological and Yield Responses. In A Comprehensive Survey of International Soybean Research-Genetics, Physiology, Agronomy and Nitrogen Relationships; Board, J.E., Ed.; InTech: Rijeka, Croatia, 2013; pp. 115–157. [Google Scholar]
- Jha, P.K.; Kumar, S.N.; Ines, A.V. Responses of soybean to water stress and supplemental irrigation in upper Indo-Gangetic plain: Field experiment and modeling approach. Field Crop Res. 2018, 219, 76–86. [Google Scholar] [CrossRef]
- Raz-Yaseef, N.; Billesbach, D.P.; Fischer, M.L.; Biraud, S.C.; Gunter, S.A.; Bradford, J.A.; Torn, M.S. Vulnerability of crops and native grasses to summer drying in the U.S. Southern Great Plains. Agric. Ecosyst. Environ. 2015, 213, 209–218. [Google Scholar] [CrossRef] [Green Version]
- Schultz, H.R. Climate change and viticulture: A European perspective on climatology, carbon dioxide and UV-B effects. Aust. J. Grape Wine Res. 2000, 6, 2–12. [Google Scholar] [CrossRef]
- Chaves, M.M.; Zarrouk, O.; Francisco, R.; Costa, J.M.; Santos, T.; Regalado, A.P.; Rodrigues, M.L.; Lopes, C.M.; Costa, J.; Lopes, C. Grapevine under deficit irrigation: Hints from physiological and molecular data. Ann. Bot. 2010, 105, 661–676. [Google Scholar] [CrossRef] [PubMed]
- IPCC. Summary for Policymakers; IPCC: Geneva, Switzerland, 2014. [Google Scholar]
- Altieri, M.A.; Nicholls, C.I.; Henao, A.; Lana, M.A. Agroecology and the design of climate change-resilient farming. Agron. Sustain. Dev. 2015, 35, 869–890. [Google Scholar] [CrossRef]
- Tesfahun, W. Climate change mitigation and adaptation through biotechnology approaches: A review. Cogent Food Agric. 2018, 4, 1–12. [Google Scholar]
- Pace, C. Genomic tools and plant genes to mitigate impacts of climate change and extreme environments. CAB Rev. Perspect. Agric. Vet. Sci. Nutr. Resour. 2015, 10, 553–568. [Google Scholar] [CrossRef]
- Fraga, H.; Malheiro, A.; Moutinho-Pereira, J.; Santos, J.A. Future scenarios for viticultural zoning in Europe: Ensemble projections and uncertainties. Int. J. Biometeorol. 2013, 57, 909–925. [Google Scholar] [CrossRef]
- Yadav, S.S.; Redden, R.; McNeil, D.L.; Patil, S.A. Climate change and management of cool season grain legume crops. Clim. Chang. Manag. Cool Seas Grain Legum. Crop. 2010, 2010, 1–460. [Google Scholar]
- Kenny, P.; Harrison, G.J. The effects of climate variability and change on grape suitability in Europe The Effects of Climate Variability and Change on Grape Suitability in Europe. J. Wine Res. 1992, 3, 37–41. [Google Scholar] [CrossRef]
- Tian, L.; Yuan, S.; Quiring, S.M. Evaluation of six indices for monitoring agricultural drought in the south-central United States. Agric. Meteorol. 2018, 249, 107–119. [Google Scholar] [CrossRef]
- Nguyen-Huy, T.; Deo, R.C.; Mushtaq, S.; An-Vo, D.-A.; Khan, S. Modeling the joint influence of multiple synoptic-scale, climate mode indices on Australian wheat yield using a vine copula-based approach. Eur. J. Agron. 2018, 98, 65–81. [Google Scholar] [CrossRef]
- Dell, M.; Jones, B.F.; Olken, B.A. What Do We Learn from the Weather? The New Climate-Economy Literature †. J. Econ. Lit. 2014, 52, 740–798. [Google Scholar] [CrossRef] [Green Version]
- Castells-Quintana, D.; Lopez-Uribe, M.d.; McDermott, T.K.J. Geography, institutions and development: A review of the long-run impacts of climate change. Clim. Dev. 2017, 9, 452–470. [Google Scholar] [CrossRef]
- Parihar, J.S. FASAL concept in meeting the requirements of assessment and forecasting crop production affected by extreme weather events. Mausam 2016, 67, 93–104. [Google Scholar]
- Singh, K.K.; Kalra, N. Simulating impact of climatic variability and extreme climatic events on crop production. Mausam 2016, 67, 113–130. [Google Scholar]
- Trębicki, P.; Dáder, B.; Vassiliadis, S.; Fereres, A. Insect-plant-pathogen interactions as shaped by future climate: Effects on biology, distribution, and implications for agriculture. Insect Sci. 2017, 24, 975–989. [Google Scholar] [CrossRef] [PubMed]
- Phalkey, R.K.; Aranda-Jan, C.; Marx, S.; Höfle, B.; Sauerborn, R.; Jan, C.B.A. Systematic review of current efforts to quantify the impacts of climate change on undernutrition. Proc. Acad. Sci. USA 2015, 112, E4522–E4529. [Google Scholar] [CrossRef] [Green Version]
- Sacchelli, S.; Fabbrizzi, S.; Menghini, S. Climate change effects and adaptation strategies in the wine sector: A quantitative literature review. Wine Econ. Policy 2016, 5, 114–126. [Google Scholar] [CrossRef]
- Pickering, C.; Byrne, J. The benefits of publishing systematic quantitative literature reviews for PhD candidates and other early-career researchers. High. Educ. Res. Dev. 2014, 33, 534–548. [Google Scholar] [CrossRef]
- Guidi, C.; Di Matteo, G.; Grego, S. An overview of proven Climate Change Vulnerability Assessment tools for forests and forest-dependent communities across the globe: A literature analysis. J. For. 2018, 29, 1167–1175. [Google Scholar] [CrossRef]
- Borsato, E.; Tarolli, P.; Marinello, F. Sustainable patterns of main agricultural products combining different footprint parameters. J. Clean. Prod. 2018, 179, 357–367. [Google Scholar] [CrossRef]
- Young, I.; Smith, B.A.; Fazil, A. A systematic review and meta-analysis of the effects of extreme weather events and other weather-related variables on Cryptosporidium and Giardia in fresh surface waters. J. Water Health 2015, 13, 1–17. [Google Scholar] [CrossRef] [Green Version]
- Kannan, S.; Gurusamy, V. Preprocessing Techniques for Text Mining. IJCSC 2014, 5, 7–16. [Google Scholar]
- Felton, A.; Fischer, J.; Lindenmayer, D.B.; Montague-Drake, R.; Lowe, A.R.; Saunders, D.; Felton, A.M.; Steffen, W.; Munro, N.T.; Youngentob, K.; et al. Climate change, conservation and management: An assessment of the peer-reviewed scientific journal literature. Biodivers. Conserv. 2009, 18, 2243–2253. [Google Scholar] [CrossRef]
- Ho-Lem, C.; Zerriffi, H.; Kandlikar, M. Who participates in the Intergovernmental Panel on Climate Change and why: A quantitative assessment of the national representation of authors in the Intergovernmental Panel on Climate Change. Environ. Chang. 2011, 21, 1308–1317. [Google Scholar] [CrossRef]
- Kiparsky, M.; Brooks, C.; Gleick, P.H. Do Regional Disparities in Research on Climate and Water Influence Adaptive Capacity? Clim. Chang. 2006, 77, 363–375. [Google Scholar] [CrossRef] [Green Version]
- Behmann, J.; Steinrücken, J.; Plümer, L. Detection of early plant stress responses in hyperspectral images. ISPRS J. Photogramm. Sens. 2014, 93, 98–111. [Google Scholar] [CrossRef]
- Winterhalter, L.; Mistele, B.; Jampatong, S.; Schmidhalter, U. High throughput phenotyping of canopy water mass and canopy temperature in well-watered and drought stressed tropical maize hybrids in the vegetative stage. Eur. J. Agron. 2011, 35, 22–32. [Google Scholar] [CrossRef]
- Matese, A.; Di Gennaro, S.F. Practical Applications of a Multisensor UAV Platform Based on Multispectral, Thermal and RGB High Resolution Images in Precision Viticulture. Agriculture 2018, 8, 116. [Google Scholar] [CrossRef]
- USDA/NASS. Agricultural Statistics 2015; United States Government Printing Office: Washington, DC, USA, 2015.
- OECD and FAO. World Cereal Projections; OECD and FAO: Rome, Italy, 2018; pp. 9–10. [Google Scholar]
- FAOSTAT. Food and Agriculture Organization of the United Nations (FAO). FAOSTAT Database. 2016. Available online: http://faostat.fao.org/site/291/default.aspx (accessed on 1 September 2018).
- Knox, J.; Hess, T.; Daccache, A.; Wheeler, T. Climate change impacts on crop productivity in Africa and South Asia. Environ. Lett. 2012, 7, 034032. [Google Scholar] [CrossRef] [Green Version]
- Lobell, D.B.; Bänziger, M.; Magorokosho, C.; Vivek, B. Nonlinear heat effects on African maize as evidenced by historical yield trials. Nat. Clim. Chang. 2011, 1, 42–45. [Google Scholar] [CrossRef]
- Cammarano, D.; Tian, D. The effects of projected climate and climate extremes on a winter and summer crop in the southeast USA. Agric. Meteorol. 2018, 248, 109–118. [Google Scholar] [CrossRef]
- Coccia, M.; Bozeman, B. Allometric models to measure and analyze the evolution of international research collaboration. Scientometrics 2016, 108, 1065–1084. [Google Scholar] [CrossRef]
- Dubbini, M.; Pezzuolo, A.; De Giglio, M.; Gattelli, M. Last generation instrument for agriculture multispectral data collection. Agric. Eng. Int. CIGR J. 2017, 19, 87–93. [Google Scholar]
- Kayad, A.G.; Al-Gaadi, K.A.; Tola, E.; Madugundu, R.; Zeyada, A.M.; Kalaitzidis, C. Assessing the Spatial Variability of Alfalfa Yield Using Satellite Imagery and Ground-Based Data. PLoS ONE 2016, 11, 1–15. [Google Scholar] [CrossRef] [PubMed]
- Haile, M. Weather patterns, food security and humanitarian response in sub-Saharan Africa. Philos. Trans. Soc. B Boil. Sci. 2005, 360, 2169–2182. [Google Scholar] [CrossRef] [PubMed] [Green Version]
- Wheeler, T.; von Braun, J. Climate Cange Impacts on Global Food Security. Science 2011, 341, 508–513. [Google Scholar] [CrossRef] [PubMed]
- Chung, U.; Gbegbelegbe, S.; Shiferaw, B.; Robertson, R.; Yun, J.I.; Tesfaye, K.; Hoogenboom, G.; Sonder, K. Modeling the effect of a heat wave on maize production in the USA and its implications on food security in the developing world. Clim. Extremes 2014, 5, 67–77. [Google Scholar] [CrossRef] [Green Version]
Figure 1.
Conceptual classification model used in this study.

Figure 2.
Class 1. Normalised amount of publications per year. The red line shows the trend of publications across the years; the grey dashed line illustrates the variation from previous year (1987–2018).
Figure 2.
Class 1. Normalised amount of publications per year. The red line shows the trend of publications across the years; the grey dashed line illustrates the variation from previous year (1987–2018).

Figure 3.
Clusters in Class 1. The label size represents cluster weight. Words marked with an asterisk are the outcome of the lemming process.
Figure 3.
Clusters in Class 1. The label size represents cluster weight. Words marked with an asterisk are the outcome of the lemming process.

Figure 4.
Class 2. Normalised number of publications per year. The red line shows the trend of publications across the years; the grey dashed line illustrates the variation from previous year (1996–2018).
Figure 4.
Class 2. Normalised number of publications per year. The red line shows the trend of publications across the years; the grey dashed line illustrates the variation from previous year (1996–2018).

Figure 5.
Top ten contributors in EWE/Agriculture field of research. Chinese Academy of Sciences ranks first, United States Department of Agriculture second, the other Institutions are very close.
Figure 5.
Top ten contributors in EWE/Agriculture field of research. Chinese Academy of Sciences ranks first, United States Department of Agriculture second, the other Institutions are very close.

Figure 6.
Network diagram of international research cooperation in EWE/Agriculture. Nodes are separated by continent in 5 clusters. Node size indicates the weight of the country (total number of published documents); edge thickness represents the intensity of international collaboration.
Figure 6.
Network diagram of international research cooperation in EWE/Agriculture. Nodes are separated by continent in 5 clusters. Node size indicates the weight of the country (total number of published documents); edge thickness represents the intensity of international collaboration.

Figure 7.
Clusters in Class 2. The label size represents cluster weight. Words marked with an asterisk are outcomes of lemming process.
Figure 7.
Clusters in Class 2. The label size represents cluster weight. Words marked with an asterisk are outcomes of lemming process.

Figure 8.
Comparison between countries object of search and contributor countries.

Figure 9.
Interrelations between words appearing in title, keywords and abstract sections. The thickness and the darker color of the lines indicate a larger number of connections. The circles highlight different clusters.
Figure 9.
Interrelations between words appearing in title, keywords and abstract sections. The thickness and the darker color of the lines indicate a larger number of connections. The circles highlight different clusters.

Figure 10.
Co-occurrence of topics within cluster “Climate” (a) between cluster “Climate” and the main crops (b) and between cluster “Climate” and cluster “Implications” (c).
Figure 10.
Co-occurrence of topics within cluster “Climate” (a) between cluster “Climate” and the main crops (b) and between cluster “Climate” and cluster “Implications” (c).


Table 1.
Scripts for extraction of documents. The scripts are referred to classes 1 and 2.
| Class | Script for extraction |
|---|---|
| 1. Extreme weather events (subject area: Agriculture) | (TITLE-ABS-KEY (extreme AND weather AND event*) OR TITLE-ABS-KEY (severe AND weather AND event*)) AND (LIMIT-TO (SUBJAREA, "AGRI")) |
| 2. Extreme weather events—Agriculture | (((TITLE-ABS-KEY (extreme AND weather AND event*)) OR (TITLE-ABS-KEY (severe AND weather AND event*))) AND (TITLE-ABS-KEY (agricult*))) |
Table 2.
Main clusters of Class 1. The clusters are represented by highest frequency words.
| Cluster | Lemmas and relative occurrence [%] | Cluster percentage |
|---|---|---|
| Climate | Climate, 16.3%, Change 11.0%, Extreme 8.0%, Weather 7.5%r, Event 6.3%, Temperature 4.7%, Water 4.1%, Drought 3.2%, Precipitation 2.7%, Rain 2.7%… | 30% |
| Ecosystems | Environment 8.5%, Forest 7.7%, Population 6.1%, Animal 5.6%, Ecosystem 5.5%, Plant 4.6%, Sea 3.8%, Species 3.9%, System 3.1%, Carbon 2.8%… | 15% |
| Methods | Model 11.9%, Analysis 9.1%, Forecast 3.9%, Assess 3.1%, Data 3.0%, Simulation 2.7%… | 13% |
| Responses | Effect 10.1%, Stress 5.7%, Growth 5.7%, Adaptation 5.1%, Dynamic 5.0%, Response 5.0%, Disease 4.5%, Physiology 3.5%… | 11% |
| Other | 31% |
Table 3.
Top ten contributors in extreme weather events (EWE)/Agriculture field of research. The first column contains the total amount of documents published by single-country authors; the second column contains the number of documents written as international collaboration; the third column contains the total amount.
| Country | Single-Country | International | Total Amount |
|---|---|---|---|
| USA | 141 | 62 | 203 |
| China | 46 | 27 | 83 |
| UK | 42 | 38 | 80 |
| Australia | 41 | 30 | 71 |
| Canada | 40 | 23 | 63 |
| Germany | 32 | 22 | 54 |
| India | 50 | 13 | 63 |
| Italy | 22 | 27 | 49 |
| Switzerland | 11 | 16 | 27 |
| Netherlands | 8 | 18 | 26 |
Table 4.
Top ten international research cooperating countries.
| Country | no. Collaboration |
|---|---|
| USA | 62 |
| UK | 38 |
| Australia | 30 |
| China | 27 |
| Italy | 27 |
| Canada | 23 |
| Germany | 22 |
| France | 19 |
| Netherlands | 18 |
| Spain | 17 |
Table 5.
Main clusters of Class 2. The clusters are represented by highest frequency words.
| Cluster | Lemmas and Relative occurrence [%] | Cluster Percentage |
|---|---|---|
| Climate | Climate, 21.1%, Change 13.0%, Extreme 7.7%, Weather 7.4%r, Event 5.7%, Water 5.4%, Drought 4.2%, Temperature 4.7%, Rain 3.6%, Precipitation 2.9%… | 31% |
| Implications | Management 9.0%, Risk 7.3%, Impact 7.1%, Food 6.3%, Global 4.0%, Use 4.0%, Economy 3.7%, Human 3.1%, Variation 3.1%, Security 3.1%… | 14% |
| Methods | Model 13.2%, Analysis 9.0%, Forecast 5.8%, Assess 5.4%, Data 3.7%, Development 3.5%, Simulation 3.1%, Index 2.3%… | 14% |
| Agriculture | Agriculture 31.0%, Crop 14.6%, Production 9.7%, Yield 6%, Farm 5.5%, Wheat 4.3%, Maize 3.7%, Irrigation 3.4%, Quality 2.3%… | 11% |
| Other | 30% |
© 2019 by the authors. Licensee MDPI, Basel, Switzerland. This article is an open access article distributed under the terms and conditions of the Creative Commons Attribution (CC BY) license (http://creativecommons.org/licenses/by/4.0/).
Share and Cite
MDPI and ACS Style
Cogato, A.; Meggio, F.; De Antoni Migliorati, M.; Marinello, F. Extreme Weather Events in Agriculture: A Systematic Review. Sustainability 2019, 11, 2547. https://0-doi-org.brum.beds.ac.uk/10.3390/su11092547
AMA Style
Cogato A, Meggio F, De Antoni Migliorati M, Marinello F. Extreme Weather Events in Agriculture: A Systematic Review. Sustainability. 2019; 11(9):2547. https://0-doi-org.brum.beds.ac.uk/10.3390/su11092547
Chicago/Turabian StyleCogato, Alessia, Franco Meggio, Massimiliano De Antoni Migliorati, and Francesco Marinello. 2019. "Extreme Weather Events in Agriculture: A Systematic Review" Sustainability 11, no. 9: 2547. https://0-doi-org.brum.beds.ac.uk/10.3390/su11092547
Note that from the first issue of 2016, this journal uses article numbers instead of page numbers. See further details here.