Evolution of the Cultural Trade Network in “the Belt and Road” Region: Implication for Global Cultural Sustainability


1
Business School, Guangxi University, Nanning 530004, China
2
Division of Geography and Environmental Management, School of Science and the Environment, Manchester Metropolitan University, Manchester M15GD, UK
3
School of Law, Lancaster University, Lancaster LA14YX, UK
*
Author to whom correspondence should be addressed.
Sustainability 2019, 11(10), 2744; https://0-doi-org.brum.beds.ac.uk/10.3390/su11102744
Submission received: 22 March 2019
/
Revised: 24 April 2019
/
Accepted: 8 May 2019
/
Published: 14 May 2019
(This article belongs to the Collection Cultural Crossovers and Social Sustainability)
Abstract
:While there has been increasing concern with respect to the sustainable development of “the Belt and Road” region, the majority of studies have focused on economic and environmental dimensions. This paper focuses on the temporal cultural trade network between the 66 countries of this region between 1990 and 2016. A social network analysis method was used to analyze the cultural trade network and its temporal evolution, where results detected key nodes and cultural corridors. Furthermore, the conceptual point-line-polygon model, which summarizes the expansion of such cultural nodes and corridors between 1990 and 2016, reveals the rapid development of cultural exchanges within the region. Here, the varied roles of large and small-sized countries were found to be dominated by China, Russia, and India. While the cultural trade network has promoted the integration of cultural diversity into the global market, to achieve global cultural sustainability more active trading relations with small-sized countries should be encouraged.
1. Introduction
Sustainable development on a global scale (addressing issues such as climate change, migration, and cultural and religious conflicts) has been one of the largest challenges for policymakers at a variety of governmental levels (from the United Nations down to local community) and within academia, across a wide range of disciplines [1,2]. In the era of globalization, attention has increasingly been paid (since 2013) to sustainable development within “the Belt and Road” region, which is composed of 66 countries (all nations included are listed in the Table A1 in Appendix A) and other associated countries.
The current literature on sustainable development within this region has primarily focused on environmental and economic dimensions. Concerning environmental dimensions, empirical studies have reported a negative impact of tourism on “the Belt and Road” ecological environment [3,4,5], “the Belt and Road” initiative may promote permanent environmental degradation. We call for rigorous strategic environmental and social assessments, raising the bar for environmental protection worldwide [6]. When considering economic dimensions, the relationship between FDI and ecological footprint have been examined. For example, Baloch contends that economic growth, energy consumption, foreign direct investment (FDI), and urbanization pollute the environment by increasing ecological footprint [7]. In contrast, research concerning the social and cultural dimensions of sustainable development in this region has been limited, and thus these dimensions will be the primary focus of this study.
In addition to the complex economic interactions that characterize this region, an increase in cultural trade has also been identified. For example, the total volume of cultural trade between the 66 countries of the region was shown to increase from 35.67 billion US dollars in 1990 to 689.67 billion US dollars in 2016, with an average annual growth of 12.1% (UN Comtrade Database). In 2016, the distribution of such cultural trades was shown to demonstrate high spatial variation along “the Belt and Road”, where East Asia (11 countries) was found to account for 57.9% of the total cultural trade volume. As for the remainder, West Asia (18 countries) accounted for 17.1%, Central and Eastern Europe (16 countries) accounted for 4.6%, the Commonwealth of the Independent States (7 countries) accounted for 6.3%, South Asia (8 countries) accounted for 12.7%, and Central Asia (5 countries) accounted for 1.4%. Using a network perspective, this study aims to identify the roles of these countries in temporal cultural trading, and how cultural trading contributes to socio-cultural sustainability in this region. After the introduction, Section 2 presents a review of the literature that covers relevant concepts and theories concerning cultural trade networks and cultural sustainability. Section 3 explains the network analysis methods. Section 4 reports the analytical results and interpretations, which is followed by discussions in Section 5 and conclusions in Section 6.
2. Literature Review
2.1. Cultural Trade Network
Early research studies focused more closely on strategic resources for human survival and development. The trade network has been strongly affected by global economics, politics, military, and diplomacy. Here, resources for trading were found to primarily include petroleum [8], rare metals [9], ore [10], electric power [11,12], and natural gas [13]. Due to their economic standing in the world, countries such as the United States, France, Canada, Germany, and the United Kingdom, were found to have strong controlling capacities in governing the trade network. However, other social and cultural factors such as common languages or colonial ties have also contributed to these trade networks. For example, a common language has been shown to reflect the same consumption preferences between trade parties, and colonial ties provide trade parties with a similar institutional basis [14], for example, the US, Canada, and the UK all share a similar language and culture.
Although scholars have performed in-depth studies on the trade network relations of strategic resources, it cannot reflect the structural characteristics of general products the trade network, therefore, some scholars began to research on the trade network evolution incorporates the trade of living (agricultural) goods including cotton [15], wood [16], seafood [17], and wheat [18]. Individual countries were found to have weak control over the trade network due to the impacts of globalization [19]. The trade network of agricultural and associated products was shown to be influenced by geographical proximity, where trading in the same area was found to be more frequent and stable than trade between distant regions within the network [20]. With the rapid development of economic globalization, trade network studies have attracted more attention across different areas.
In general, there is little research literature on the trade network of cultural products (such as books, artwork, and antiquity). Initial work conducted by Biao and Jia on cultural trade networks only analyzed films as a typical cultural product to understand the main characteristics of such global cultural trade networks [21]. However, by only including films this research does not represent an appropriate and complete picture of the cultural trade network, and thus conclusions can be argued to be limited. Further, Biao and Jia, which focused on one year (2004), was found to be lacking in the dynamic analysis of the network evolution. To address these limitations, this paper expands the cultural trade network analysis to include all cultural products within the “the Belt the Road” region and does so from a network dynamics perspective.
2.2. Cultural Sustainability
In regional studies on sustainable development, less attention has been paid to socio-cultural dimensions due to an unbalanced emphasis on economic dimensions [22] and the lack of well-balanced and satisfactory solutions being available to address increasingly serious cultural problems [23]. Previous studies on culturally sustainable development have been found to focus primarily on structural factors and potential countermeasures. Where the former includes historical and cultural heritage [24], religious beliefs [25], official or local languages [26], folk customs [27], race [28], cultural diversity [29], modernization or changing environmental conditions [30], and human mobility (immigration and outmigration). In many articles, the meanings of cultural sustainability were associated with cultural heritage [31]. The basic assumption was that cultural heritage, both intangible and tangible heritage, comprises a stock of cultural capital that has been inherited from previous generations and can be handed onto future generations [32]. So, it is a top-down cultural policy. The view of culture constructed is cumulative in temporal terms, but local in spatial terms. The main challenge related to the conservation and preservation of heritage is derived from the increasing effects of globalization [31]. Whereas, studies focused on the latter aim to improve cultural competitive power by strengthening cultural exchanges between countries [33], reducing trade friction [34] and promoting cultural protection [35]. While it has been recognized that the sustainable development of social culture should strike the correct balance between economic, social, and cultural development, allowances should be made to allow for trade-offs in light of environmental constraints [36].
Furthermore, current literature on cultural sustainability has been found to address the issue from a national rather than international level. Critics have noted that cultural sustainability at the national level is threatened by the expansion and invasion of foreign cultures, and thus international factors should be included [37]. In particular, industrial expansion has been shown not only to be a driving force of economic globalization but also encourages “cultural hegemony” [38]. Indeed, cultural hegemony has been found to cause the complete substitution of local and traditional cultures by invading cultures, particularly in small-sized countries [39].
However, the key to cultural sustainability is often argued to be cultural diversity [40] which, highlights equality in the presence, inheritance, and development of different cultures [41]. The development of cultural product trade in small-sized countries enables the integration of local cultural products into a global market by increasing the competitive capacities of cultural products and services [42,43]. Here, cultural sustainability is promoted by international networks, such as cultural trade at an international level, by increasing the mobility of diverse cultural products between countries [44].
Methodologically previous studies of cultural sustainability have been dominated by qualitative methods and often lack the creation of quantitative evidence needed for policy making due to the limited availability of data [45]. Using the emerging region of ‘the Belt and the Road’ as a case study and based on quantitative analysis–social network analysis, this paper highlights the potential role of cultural trade in promoting mobility of cultural products within the region.
3. Data and Methods
3.1. Study Area
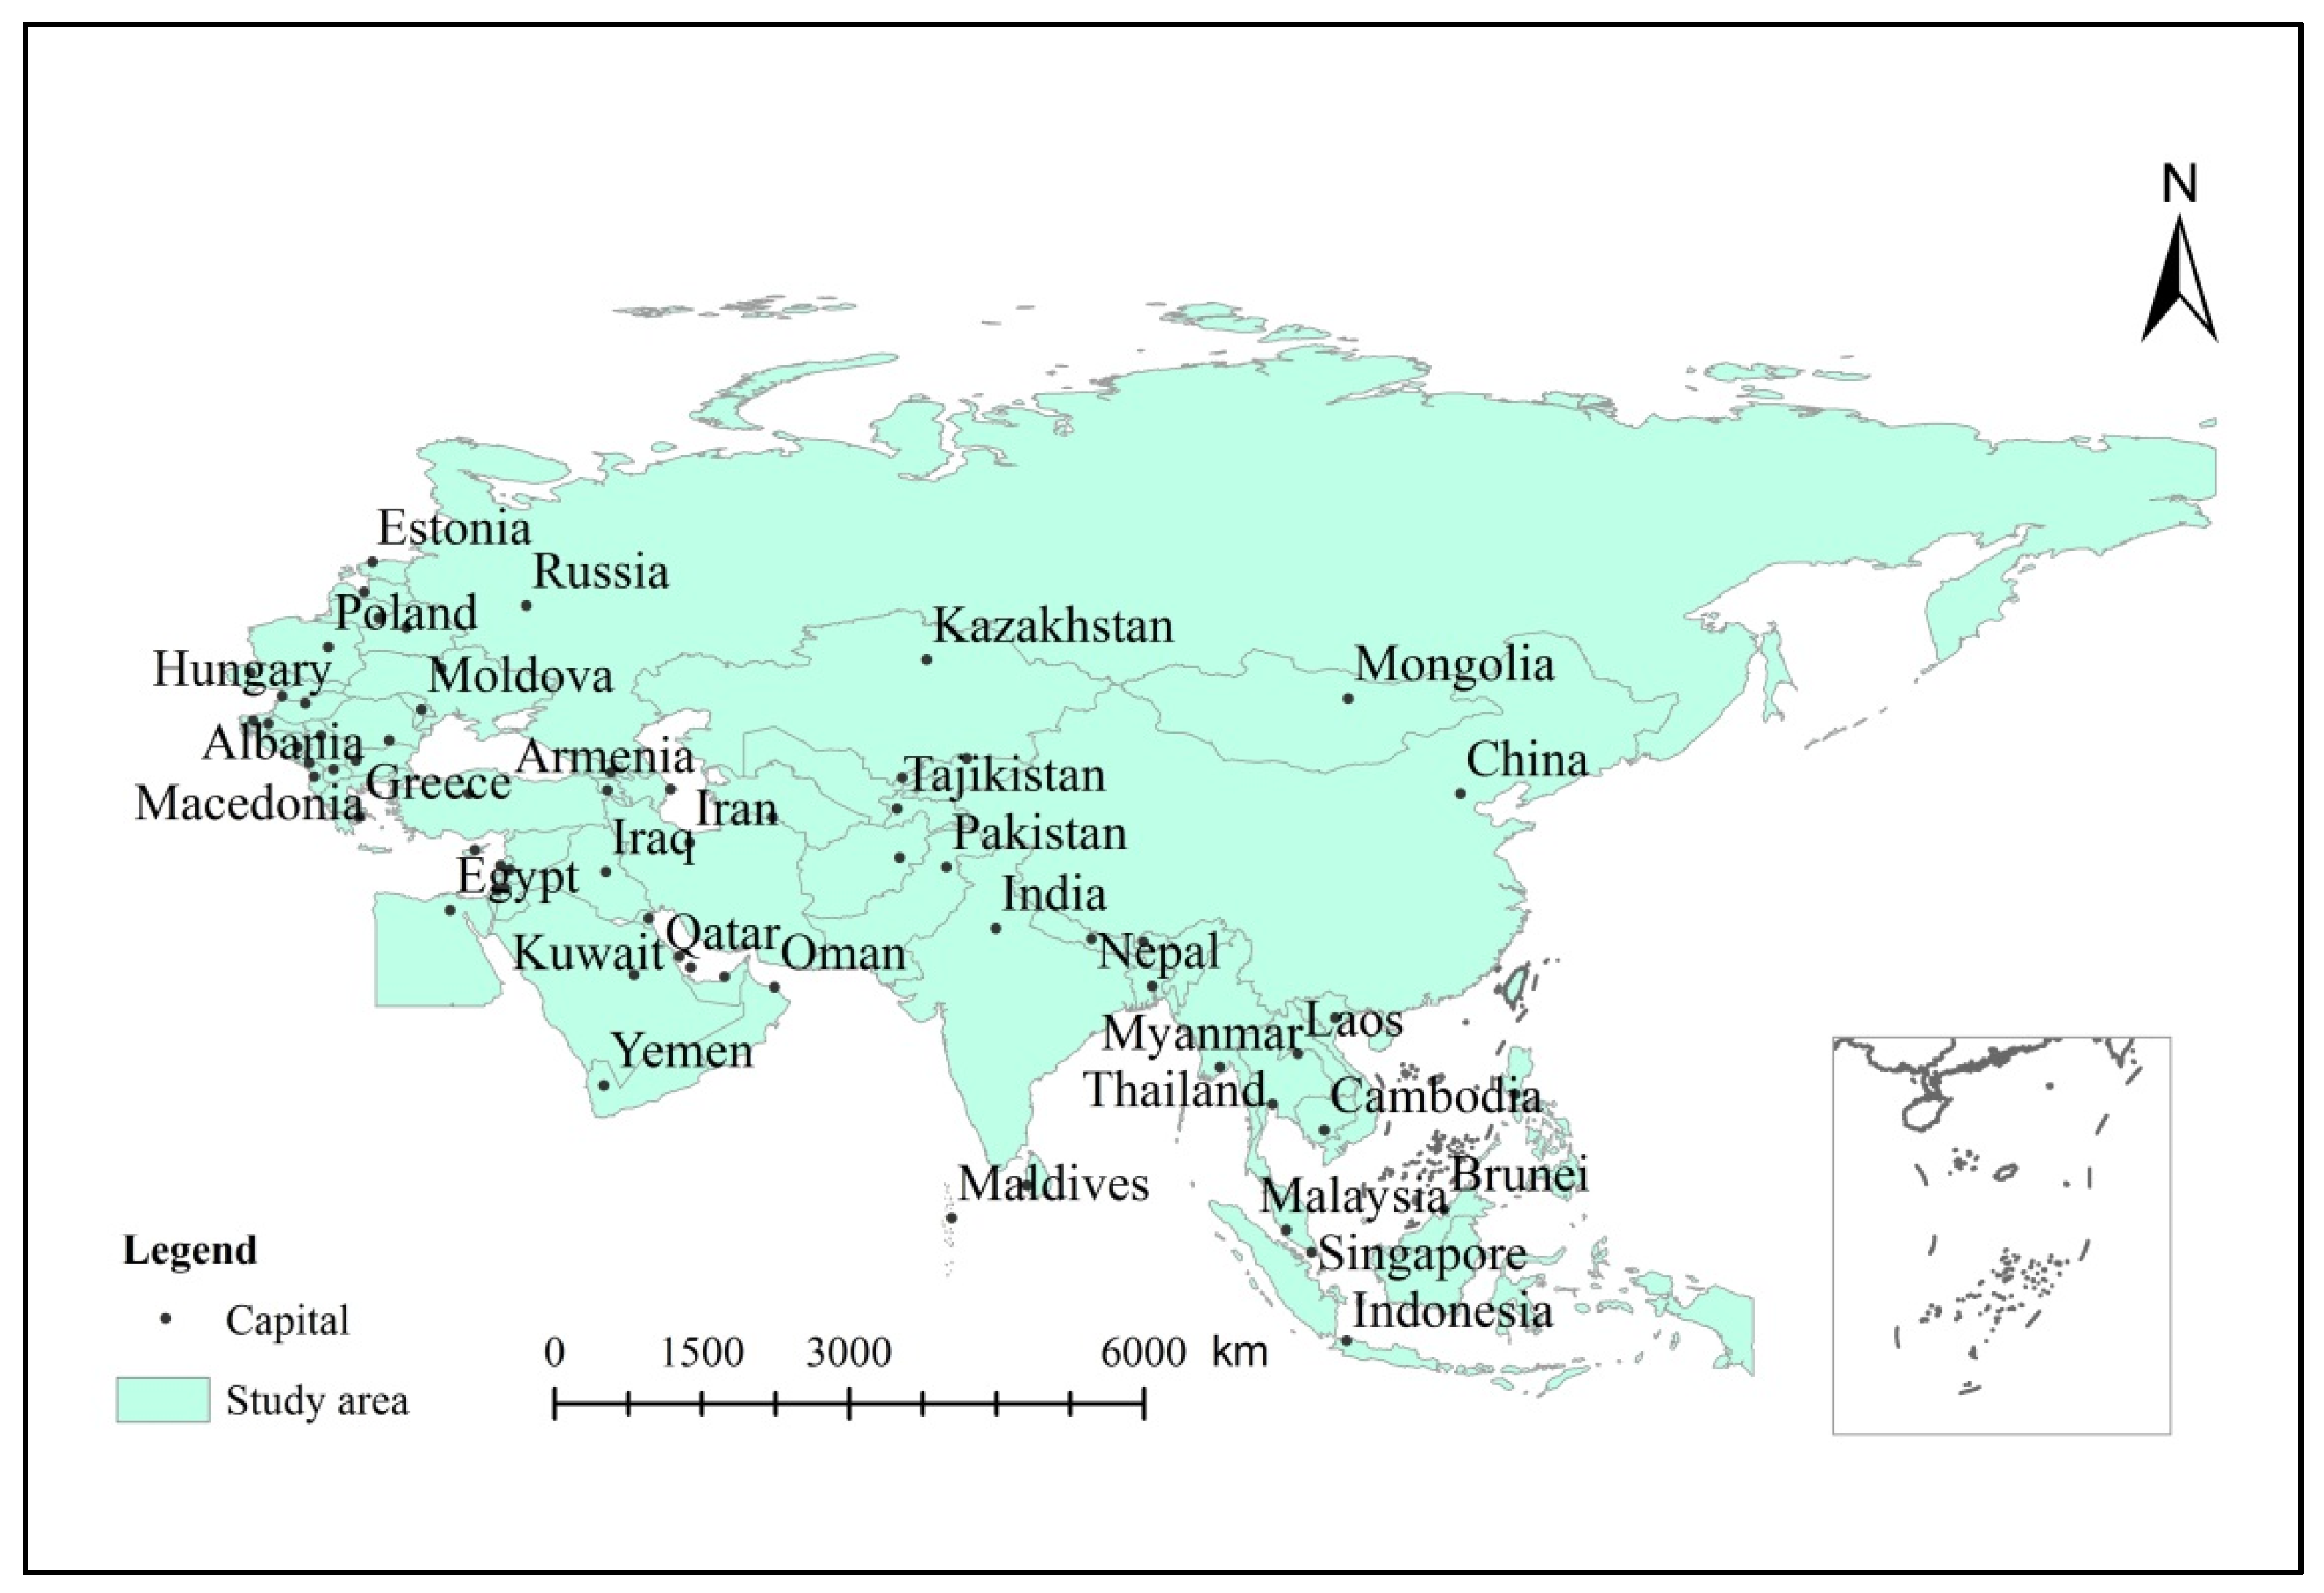
As a regional economic cooperation area, which is open internationally, member countries within “the Belt and Road” have been subject to ongoing change. Currently, the region consists of 66 countries [46], starting from China and including Mongolia in East Asia and including 10 countries in the ASEAN (Association of Southeast Asian Nations) region, 18 countries in West Asia, 8 countries in South Asia, 5 countries in Central Asia, 7 countries from the Commonwealth of the Independent States and 16 countries in Central and Eastern Europe (Figure 1).
3.2. Data Sources
Cultural trade data for this region, in the period from 1990–2016, was collected from the UN Comtrade Database (https://comtrade.un.org), which is provided by the United Nations. Using a 2-digit code system, the cultural trade data was structured as specified by The Harmonized Commodity Description and Coding System (HS) with trade products classified and summarized according to descriptions within Chapter 37 (photographic and film supplies), Chapter 49 (books, newspapers, printed drawings, etc.), and Chapter 97 (category 21 products: artwork, collections and antiquity). For missing values, the data set was estimated using a linear interpolation method or by using mirror data as a proxy.
3.3. Analytical Methods
Social network analysis (SNA) aims to explore the relationship between (social) actors and their influence on the network [47] and has been extensively deployed to analyze the relationships between social entities such as families, corporations, and nations [48]. Considering the cultural trade in the region as a social network, SNA enables the network structure, characteristics, and patterns to be explored.
3.3.1. The Representation of the Social Network
The social network of cultural products trade between the 66 countries along “the Belt and Road” can be presented as a 66 × 66 matrix, as shown by Table 1. Here, each column and row denote an individual country (abbreviated), where each matrix element represents the trade relation between countries and . The volume of cultural trade (import and export) from country to country is represented as and , as shown by Table 2.
3.3.2. Overall Network Characteristics
This paper employs network density, network flow, and network centrality metrics to analyze the (overall and individual) structural characteristics of the constructed trade flow network, as shown in Table 2. For example, in-degree () denotes the total number of countries that export cultural products from country as a node on the network, while out-degree () denotes the total number of countries that import cultural products from country [5], as shown by Equations (1) and (2).
If country imports culture product from ( = 1,2,3…N, N = 66), then = 1, otherwise, = 0; If country exports to j, then = 1, otherwise, = 0.
Node strength for country is split into in-strength () and out-strength (), which denote the total trade volume of cultural products imported into and exported from country , respectively (Equations (3) and (4)) [8], as shown by Equations (3) and (4).
where and represent import and export cultural trade volume of country to country . and represent the total volume of import and export cultural trade from country to all other countries.
represents the total number of import and export cultural trade from country to country [11], as shown by Equation (5).
While the avalanche scale measures the probability that the remaining nodes lose cultural trade opportunities when one country is paralyzed on the cultural trade network [12], as shown by Equation (6). Where represents the number of invalid countries on the network after the paralysis of country .
3.3.3. Individual Network Characteristics
Degree Centrality () is used to measure the central role of each country over the cultural trade network [11]. Where is the total number of countries that have trade relations with country .
Closeness Centrality () reflects the degree to which an individual country is not controlled by another [13]. Where represents the shortest distance between countries and .
Betweenness Centrality () measures the degree to which a country is in the “betweenness” of the other “country pairs” on the network [16].
where and , is the capacity of country to control the linkage between and . Hubness Measurement Index () measures the degree of mutual dependence between country to on the cultural trade network [18].
Finally, Cohesive Subgroups ( defines clusters formed by closely linked countries, where cultural trade network “circles of friends” relationships are formed over “the Belt and Road” [5].
where and represent the cultural trade volume (including import and export) of country and to all other countries. means the subgroup, where country is located in; if countries and are in the same subgroup, , otherwise .
4. Empirical Results
Based on the processed data set and the SNA metrics shown in Table 2, all results have been presented as graphs or maps using the SNA software package, Ucinet6.0, Visual tool, NetDraw, and ArcGIS 10.6.
4.1. Relative Node Degree
4.1.1. Node Degree Spatial Distribution
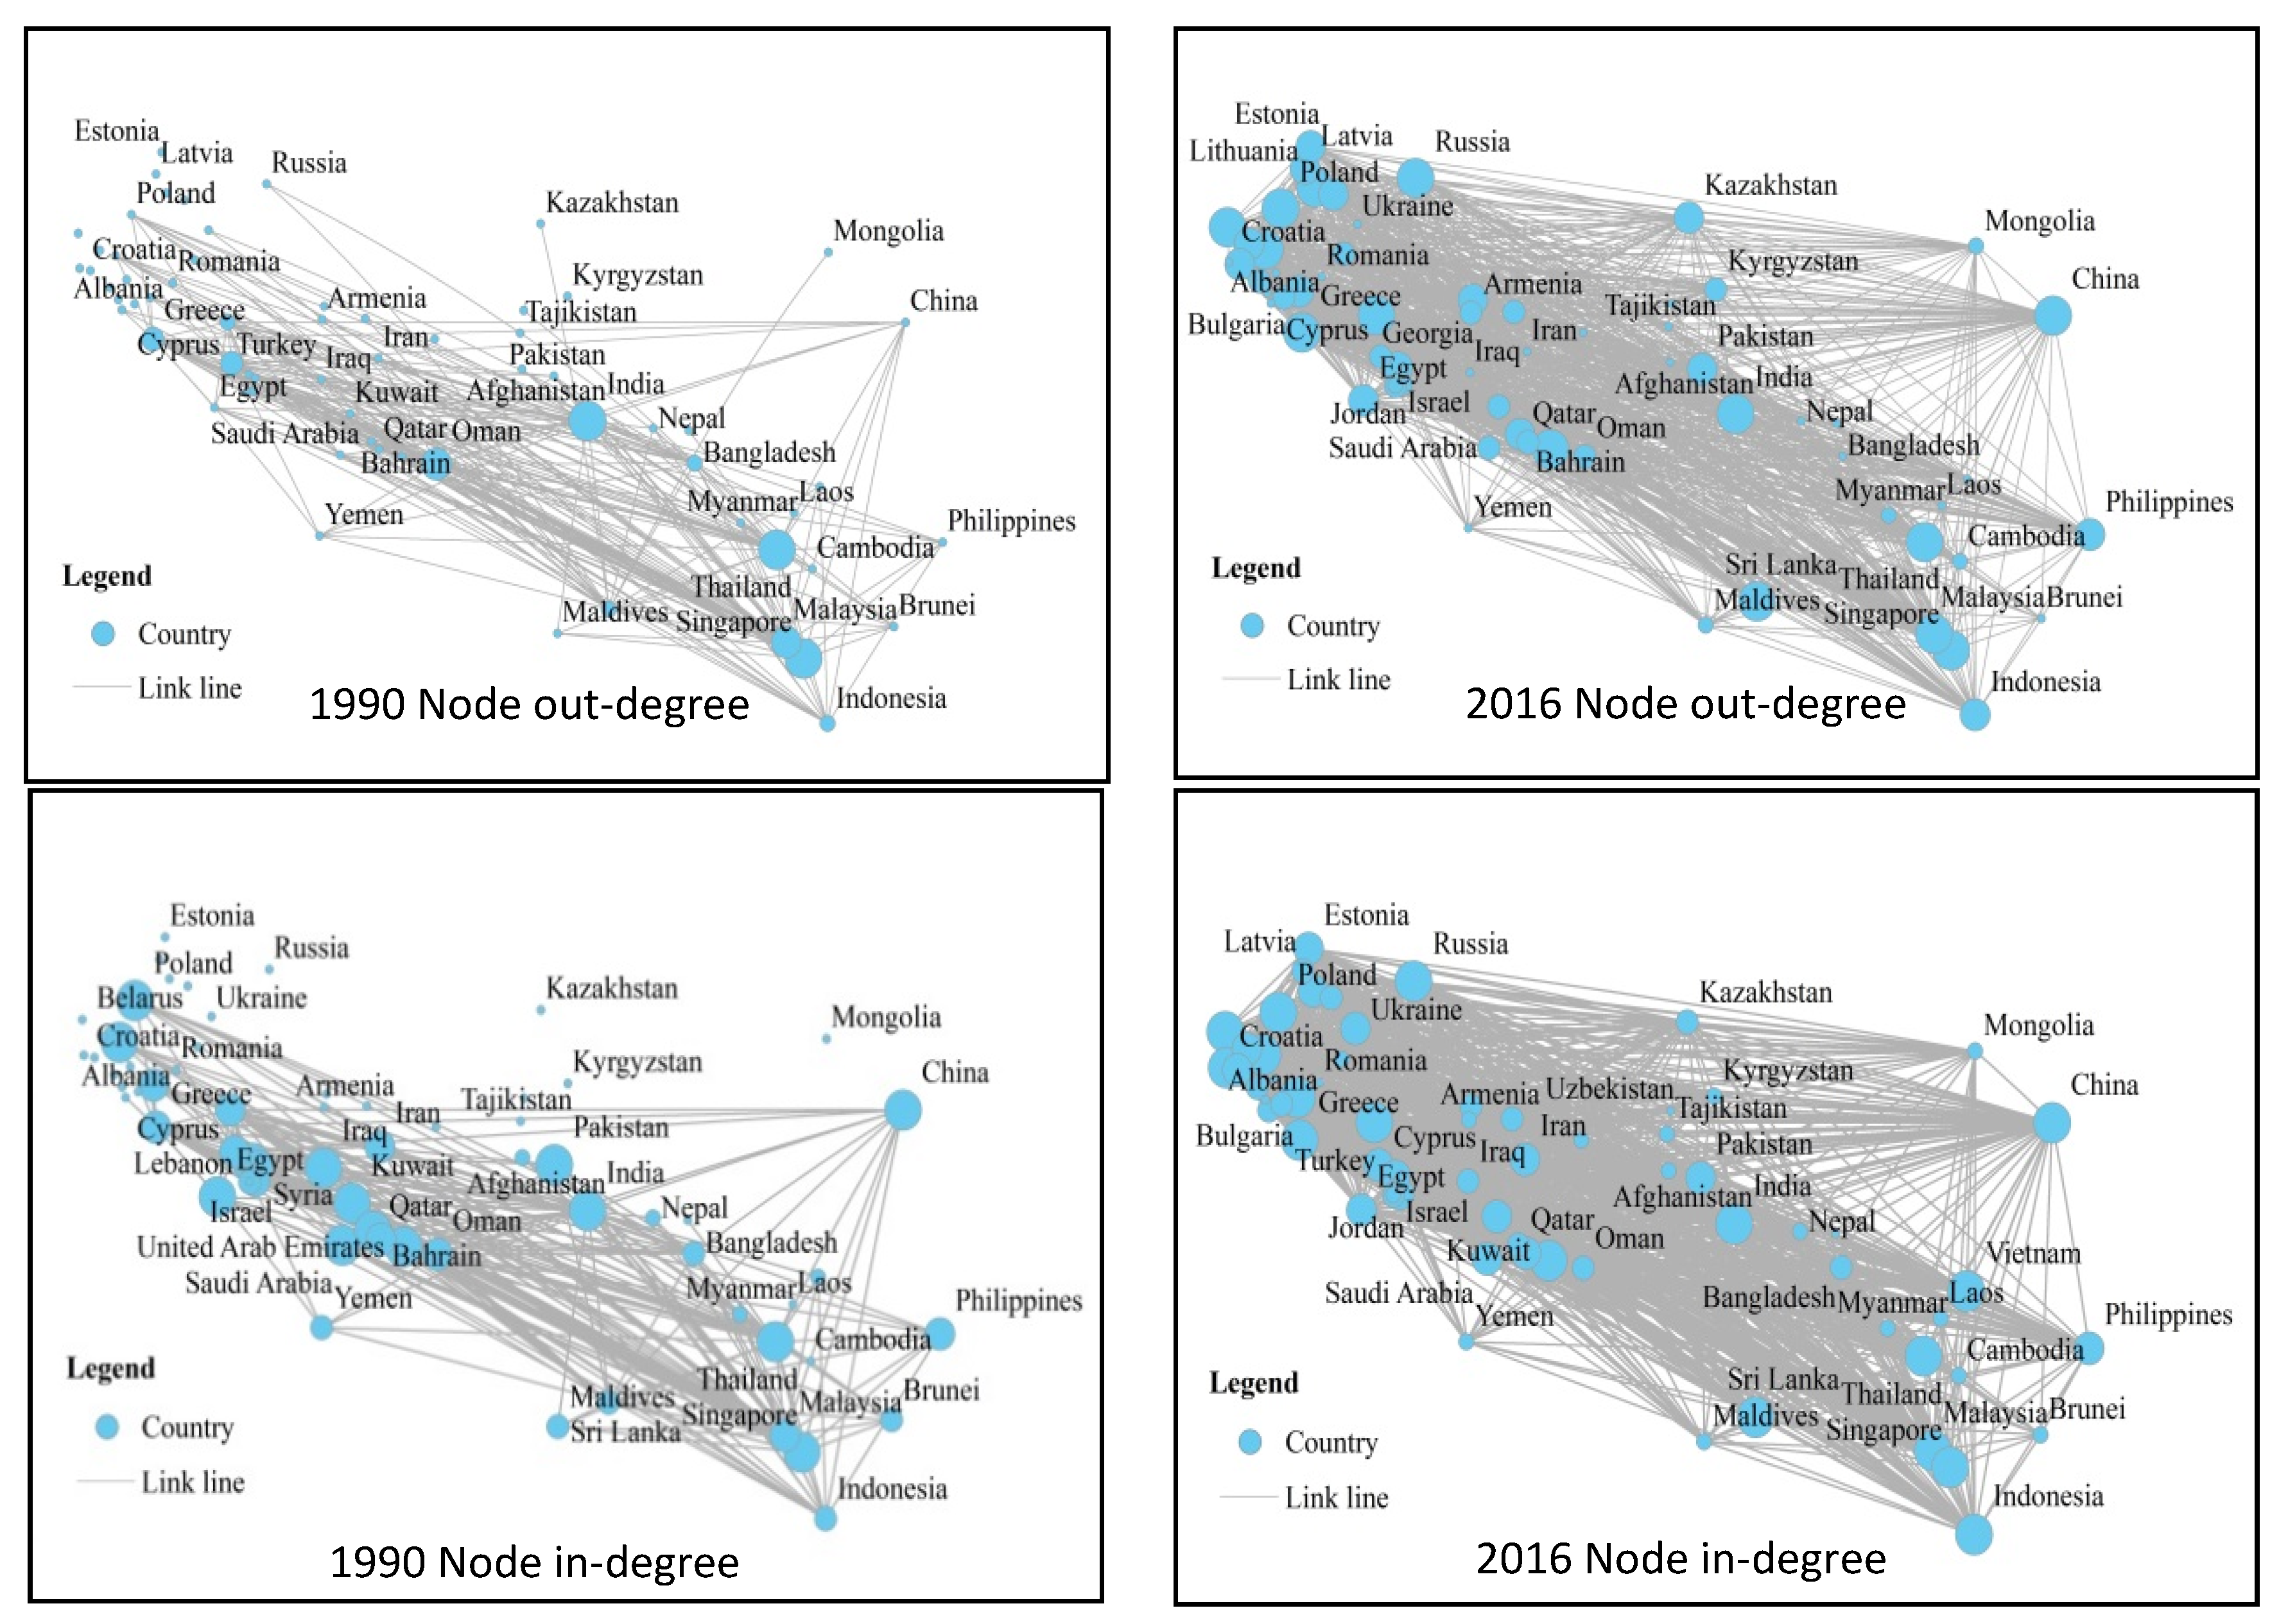
Figure 2 shows the calculated node values for out-degree and in-degree across the trade network for the years: 1990 and 2016, where dot size represents node degree as calculated by Equations (1) and (2).
When comparisons are made, significant results can be inferred from the four graphs in Figure 3. First, dot size was found to increase between 1990 to 2016 (both import and export), indicating that more countries have joined the “the Belt and Road” cultural trade network and that the quantity of trade relations between these countries has significantly increased. Second, in 1990 an increase in the frequency and size of dots in the in-degree graphs, compared to the out-degree graph, indicates that the cultural trade in the region during this early period was dominated by the import of cultural products. However, in 2016 the number and size of dots in both graphs (in-degree and out-degree) was found to be relatively equal, implying that cultural trade in this region achieved a balance between import and export. Third, in the period between 1990 and 2016, several countries, such as China and Russia, were found to have massively improved their cultural product exports (as shown in the two upper graphs). In contrast, several countries, such as Russia (but not China), were found to have massively improved their cultural product imports (as shown in the two lower graphs).
When viewed in more detail, 27 countries (including China) were found to only import cultural products in 1990. This indicates the overall low-levels of competition in cultural product trade over the network in that period. Here, the dominant export countries were found to include India, Malaysia, United Arab Emirates, Singapore, Thailand, and Greece. With the countries importing the largest-volume of cultural products from India were identified as the United Arab Emirates and Bangladesh. Several socio-cultural factors can be said to be contributing to this pattern. First, the dominant residents of the United Arab Emirates are Arabian, most of which have Islamic beliefs. In India, 12% of its population is reported to have Islamic beliefs as well. It is likely, that India, as one of the Four Great Ancient Civilizations in the world, has a wealth of historical and cultural heritage along with a precious traditional culture, and so has a comparable culture with the United Arab Emirates. Bangladesh on the other hand, albeit an Islamic country, has been reported to have weak geopolitical relationships with other Islamic countries. However, as it shares a land border to the East, West, and North with India. Its structure of language, belief, and race is also consistent with that found in India. As such, Bangladesh is in a unique position and has become an important cultural export country for India.
4.1.2. Node Degree Number Evolution
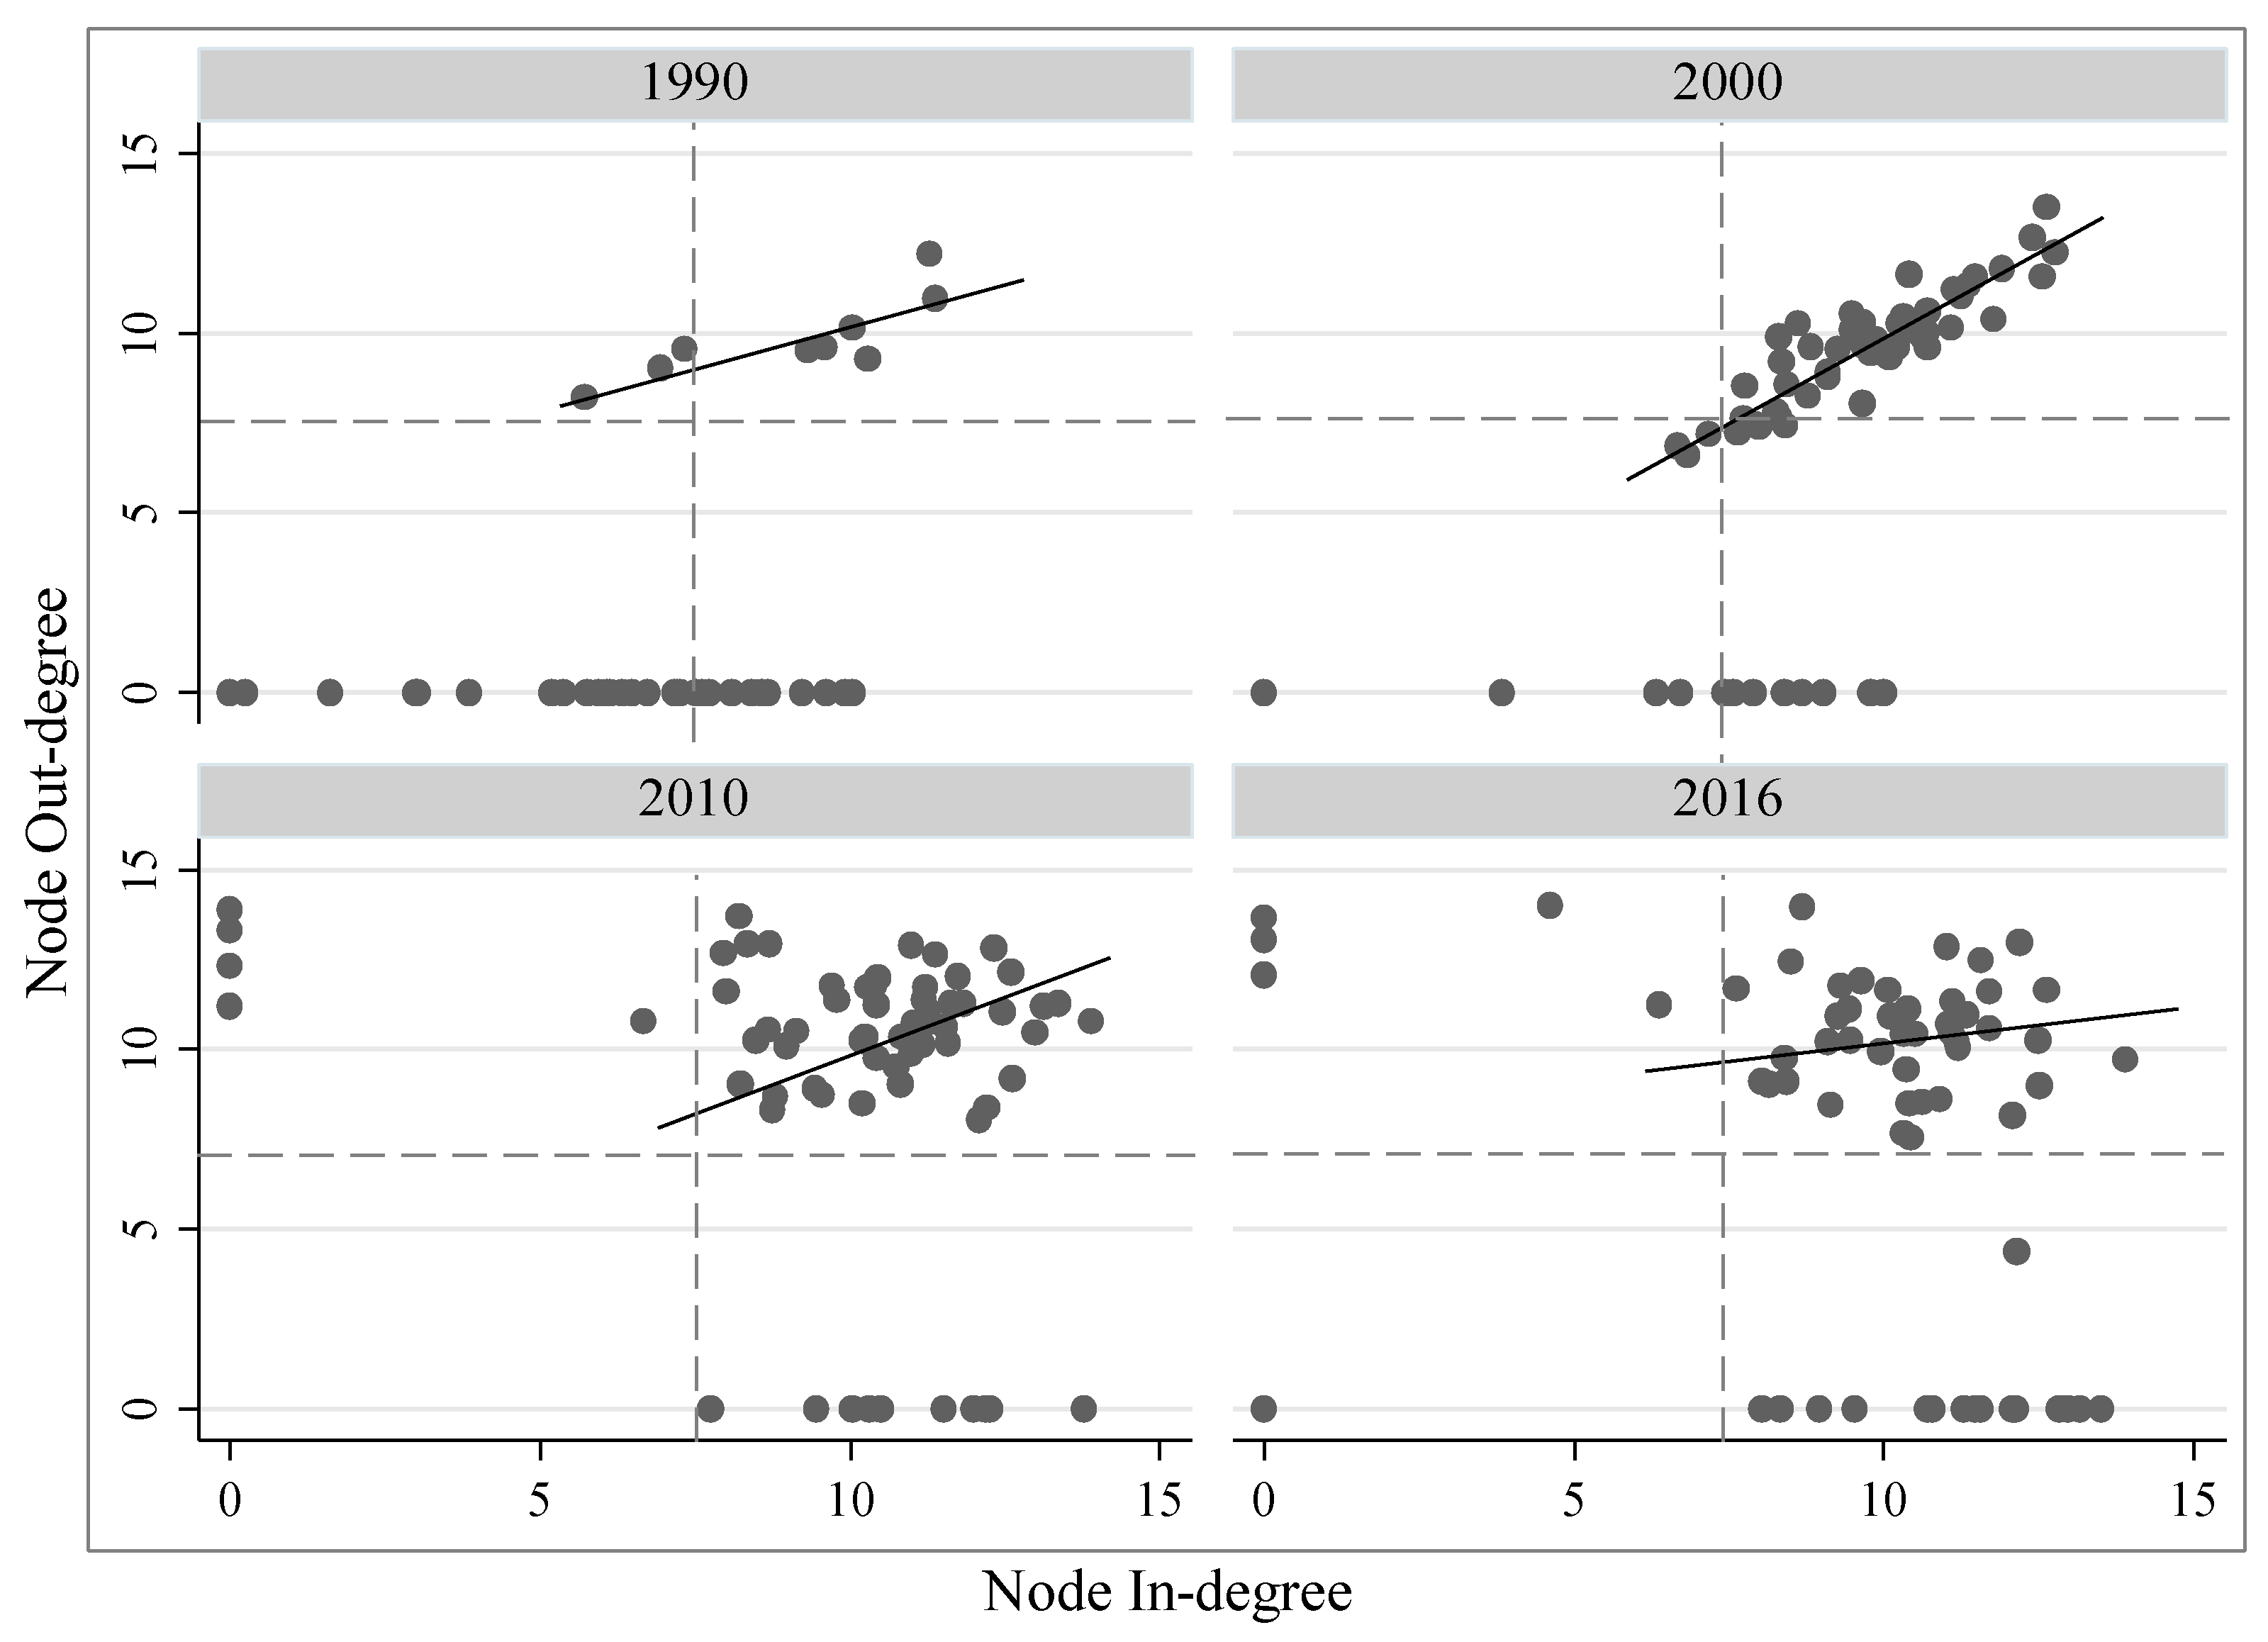
Figure 3 presents scatterplots showing the relationship between in-degree and out-degree values, in order to compare the temporal changes in import and export correlation during the period 1990–2016. The slope value of the best-fitting curve for 1990 is less than 1, indicating more cultural trade is imported than exported. The slope value of the curve for 2000 was estimated to be approximately 1, indicating synchronous growth or balanced development between import and export cultural trades. The best-fitting curve for 2010 again indicates a pattern where more trade is imported than exported. The inclination of the fitting curve in 2016 continues to shrink, where the trade deficit between the export and import of cultural products reached 11.32 billion USD$ (UN Comtrade Database), where 26 countries were found to import more cultural products than they export. Therefore, it can be said that “the Belt and Road” region, as a whole, has limited spatial radiation in exporting cultural trade.
4.2. Node and Flow Strength
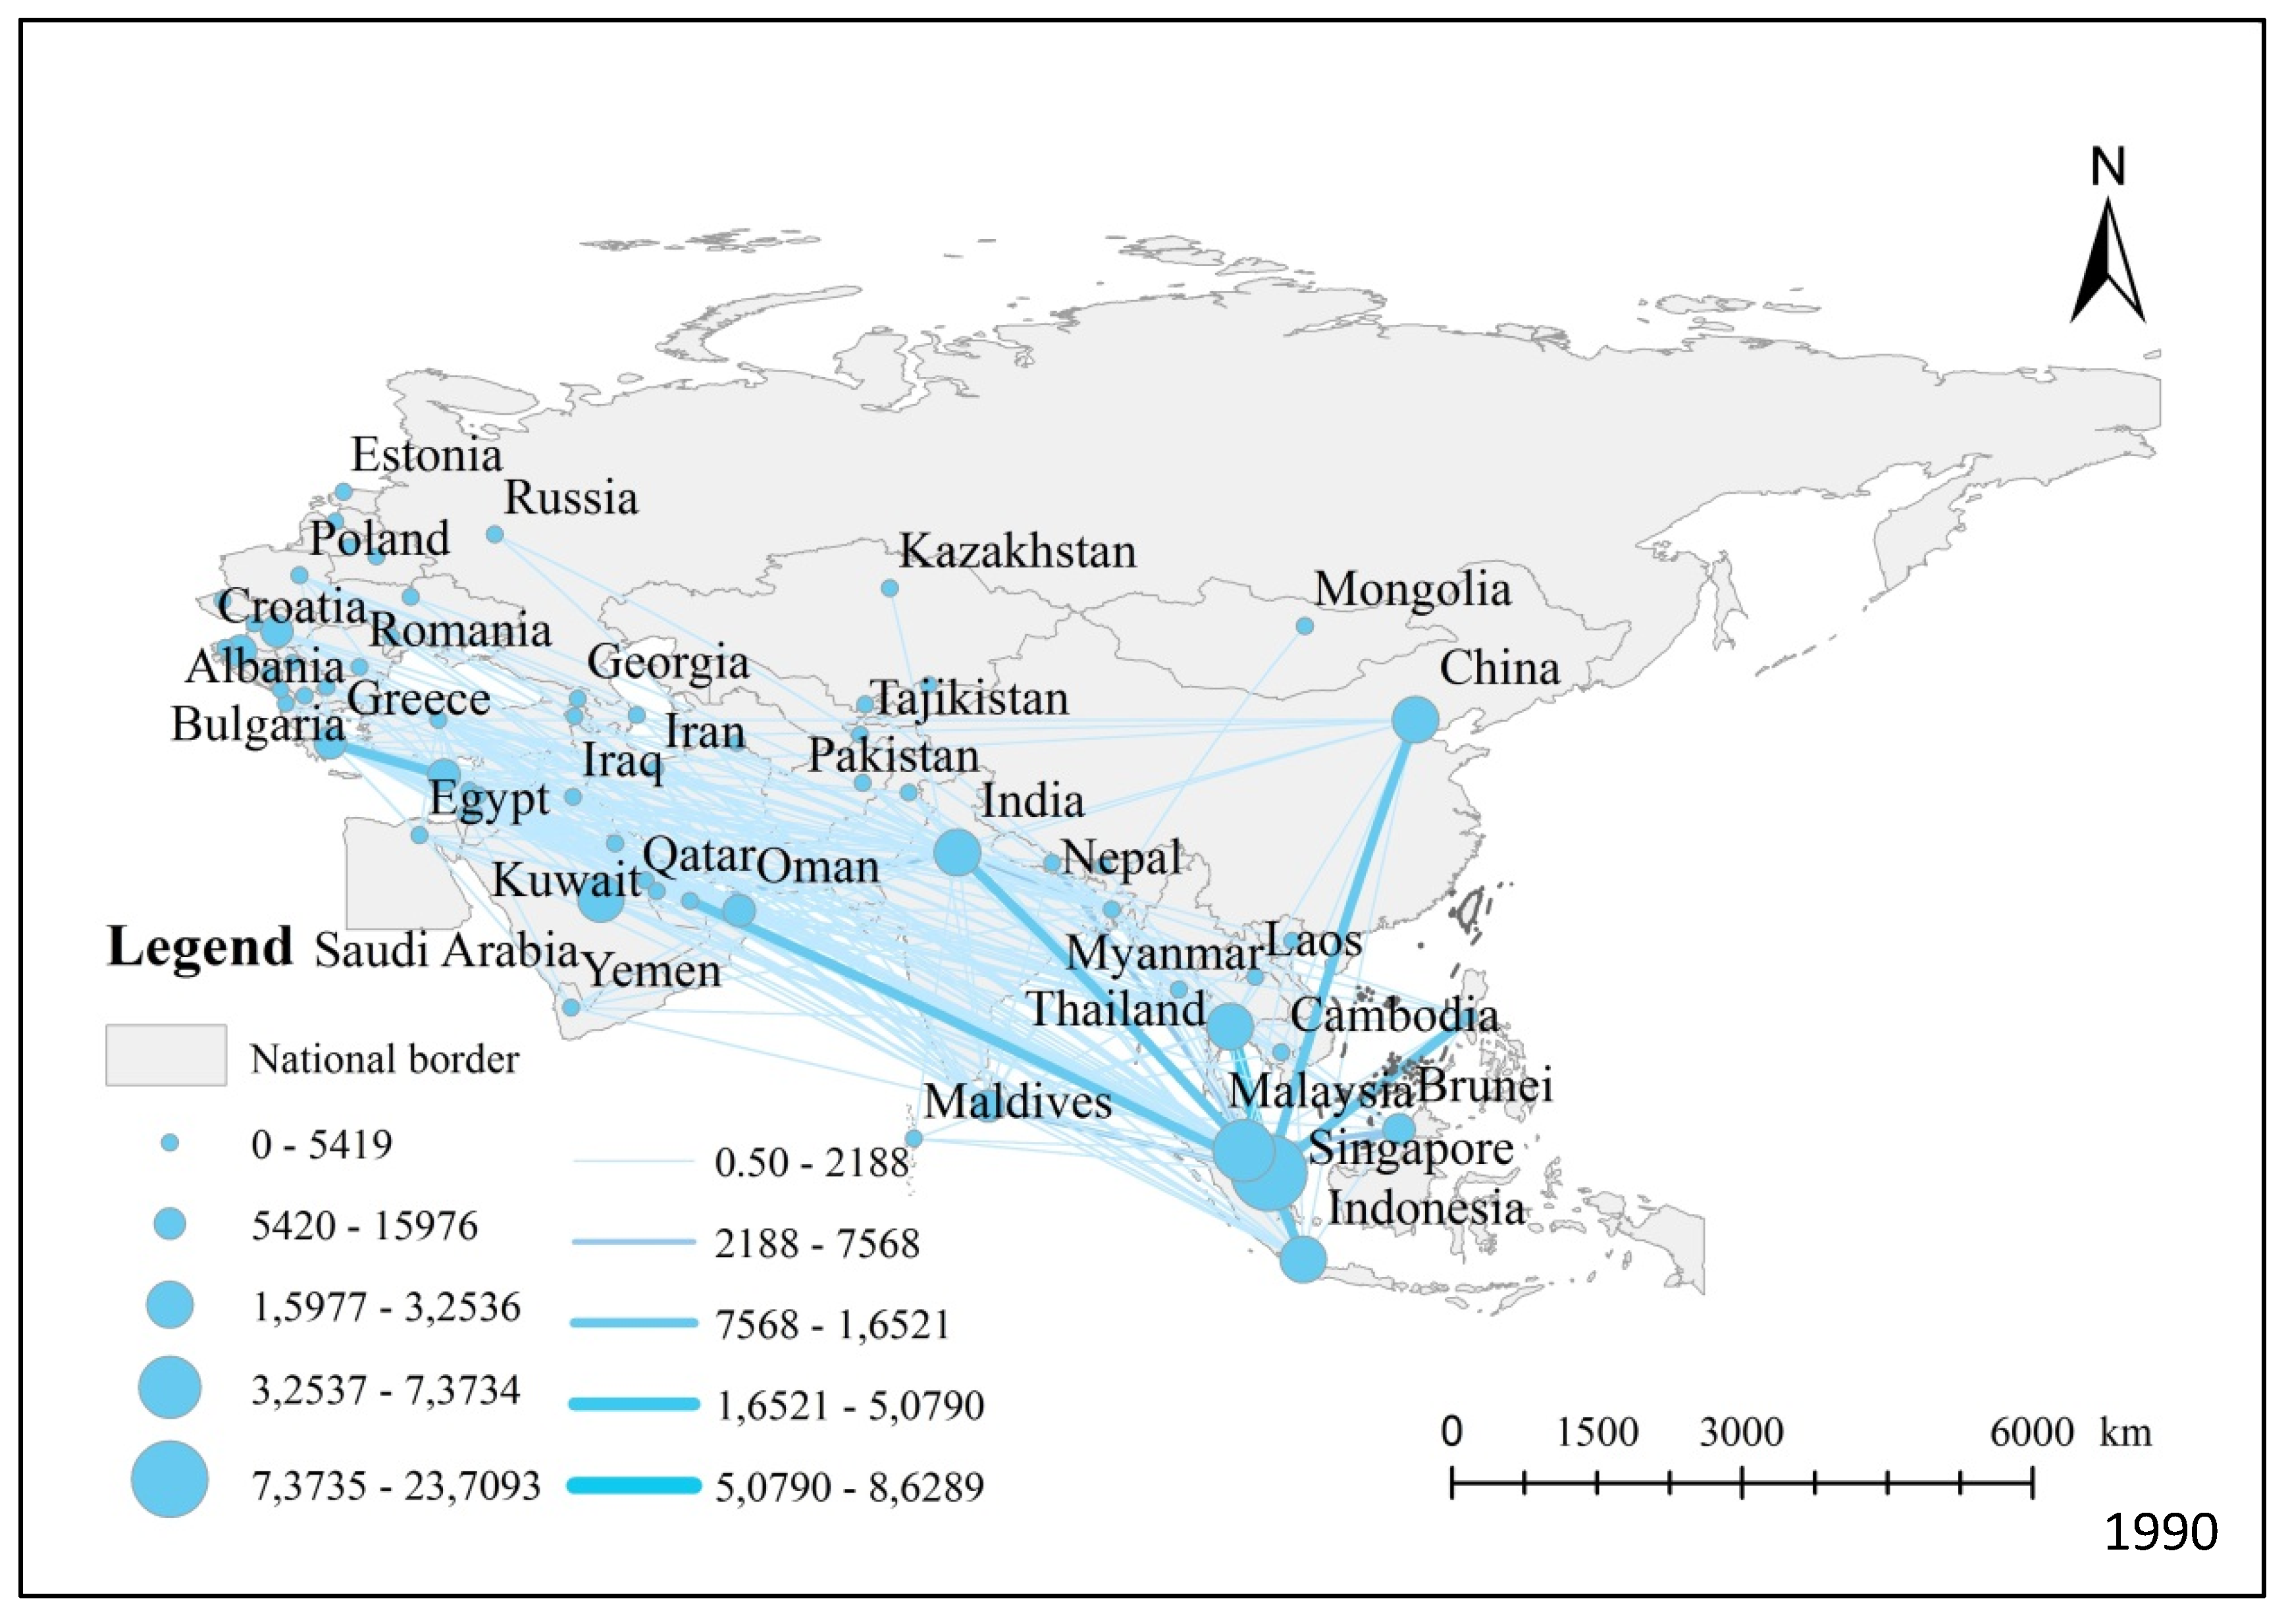
The node in-degree and out-degree (Equations (1) and (2)) values were calculated based on the number of (import and export) trade relations between countries in this region. However, these metrics do not consider the volume of trade flows between these countries, which vary from tens of dollars to hundreds of billions of dollars. Thereby, metrics of node strength, here, the node strength measure and flow strength (Equations (3) and (4)) that are based on the flow strength measure (Equation (5)), were utilized to further explore the evolution of cultural trade flows between the 66 countries between 1990 and 2016.
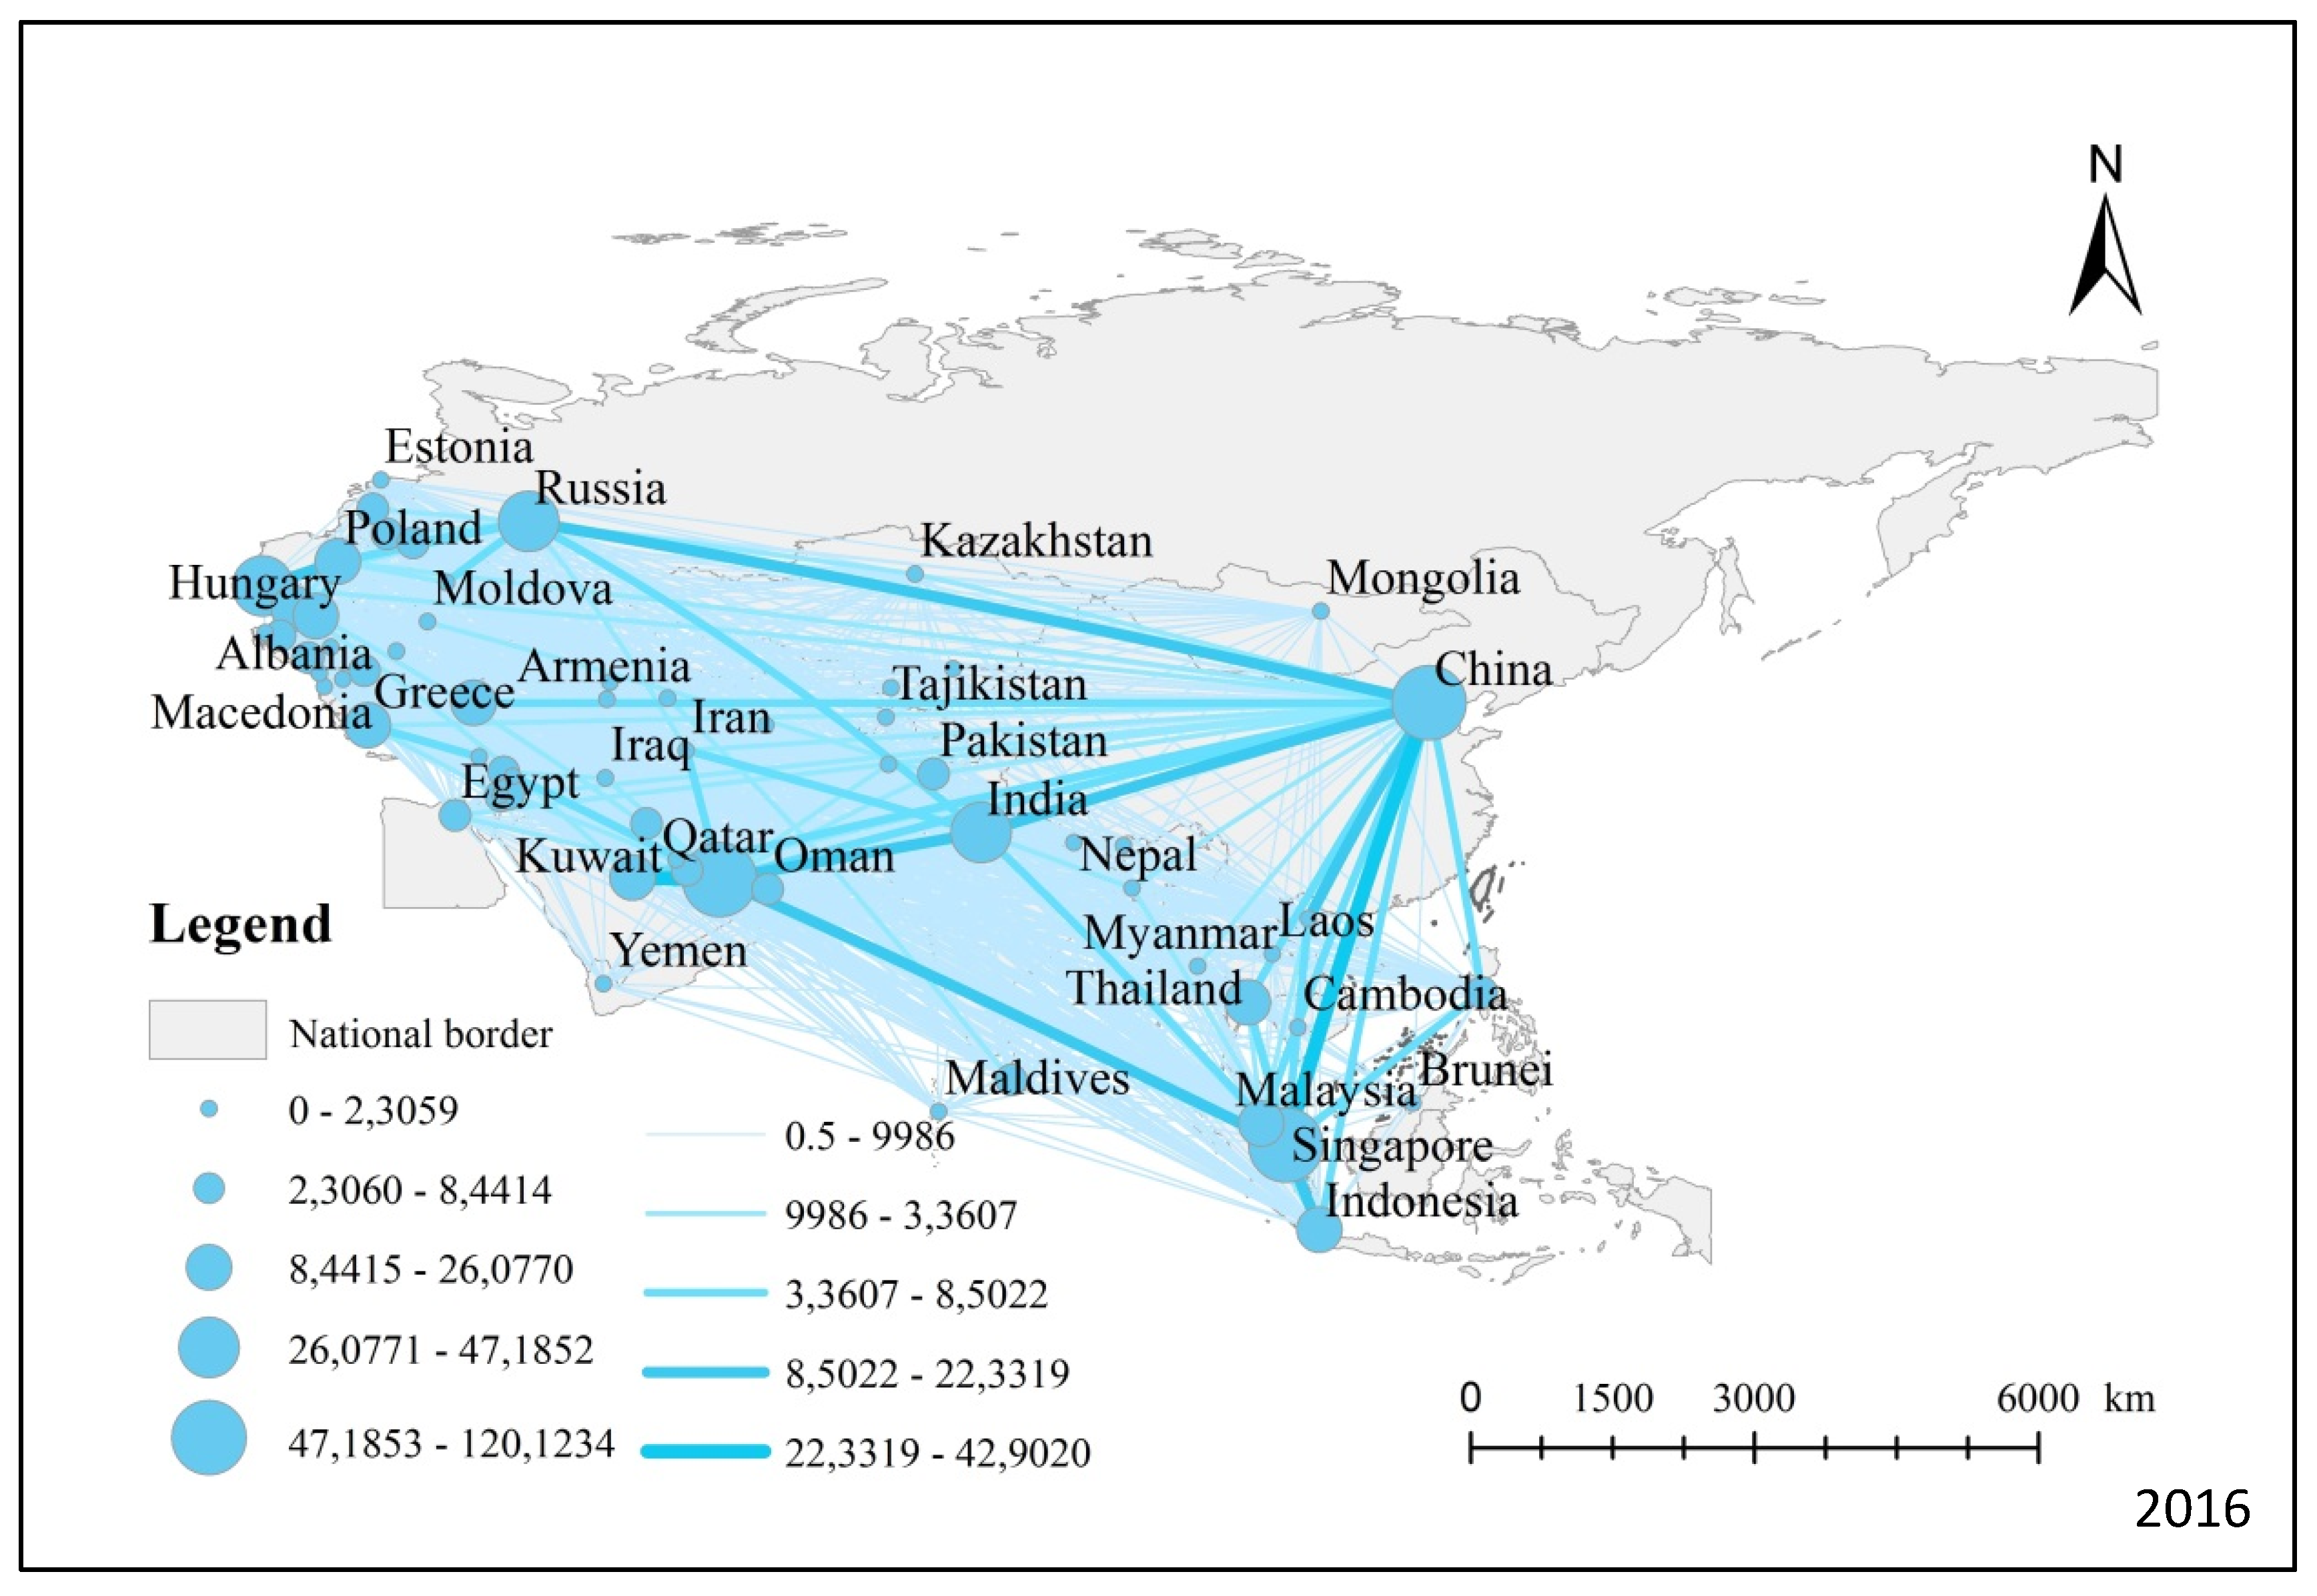
The spatial distribution of node strength in 1990 (upper Figure 4) indicates that the large-volume of cultural trade is primarily concentrated in the flows centered on Singapore. Specifically, flows are concentrated between Singapore and the five following countries; China, India, Thailand, Indonesia, and the Philippines. This indicates that these countries have formed strong partnerships over the network. By contrast, the spatial distribution of node strength in 2016 (lower Figure 4) reveals that the network has expanded to include several trade corridors including flows between China and Singapore, China and Russia, and Singapore and India and so on.
4.3. Network Survivability
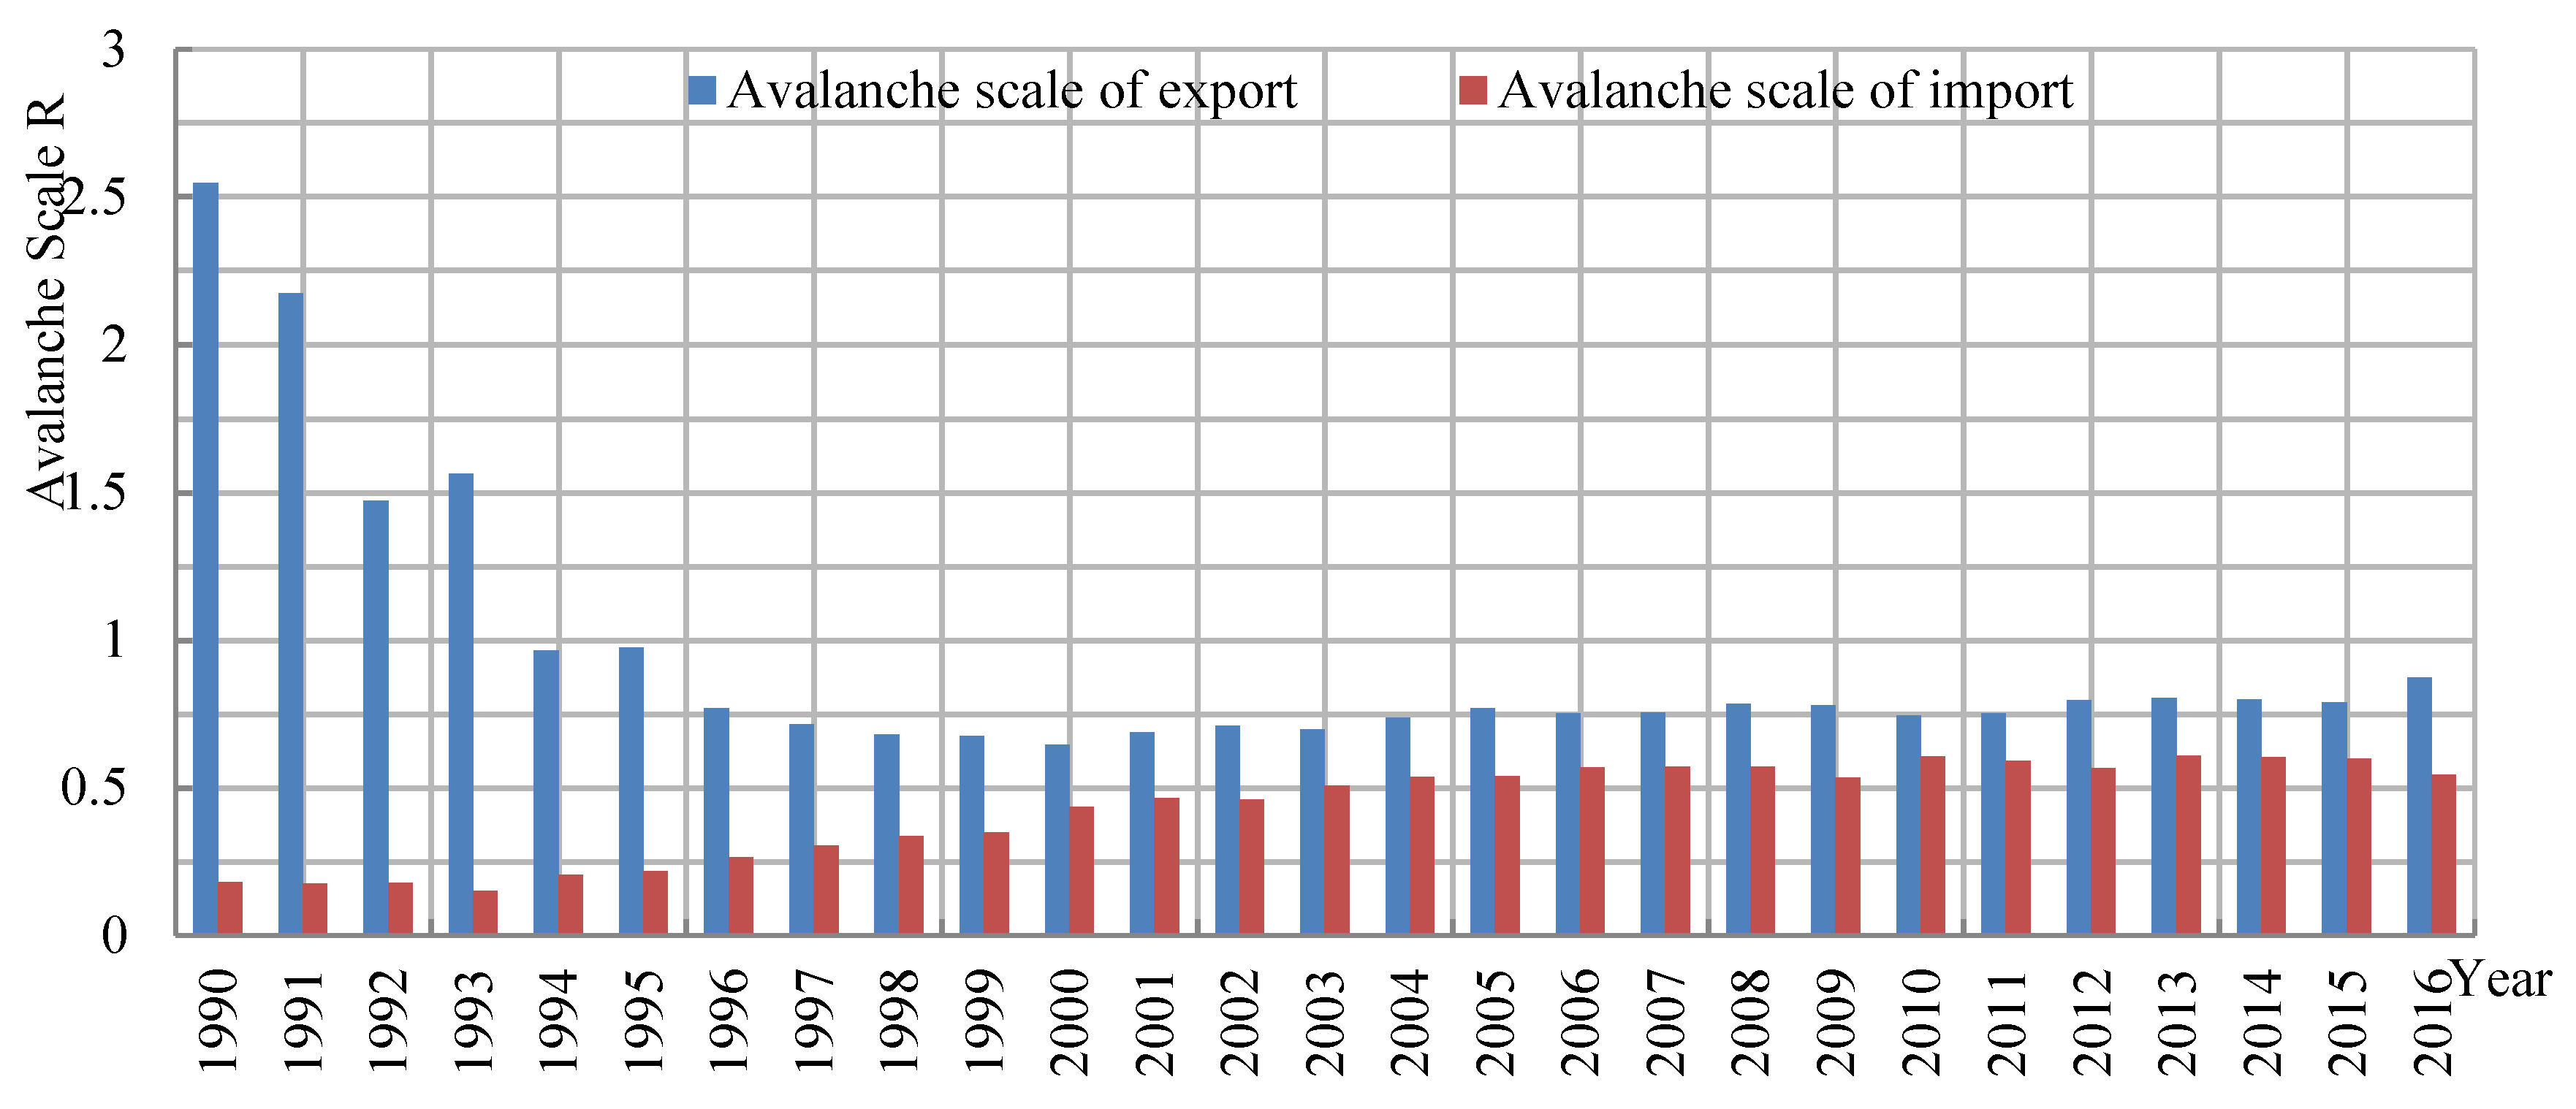
Figure 5 presents a time-series 1990–2016 of network avalanche scales (Equation (6)), which have been calculated for export and import, respectively. First, a clear trend of a sharp decrease in the export avalanche scale, particularly between 1990 and 1996, can be seen. This trend plateaus after 1996, maintaining an R-value of around 0.7 after 1998. By contrast, the import avalanche scales have slightly increased, but maintain an R-value of around 0.5 from 2000. Thereby, the survivability of current cultural trade network can be said to be stable, with the import sub-network being in a more stable position than the export sub-network.
4.4. Network Centrality
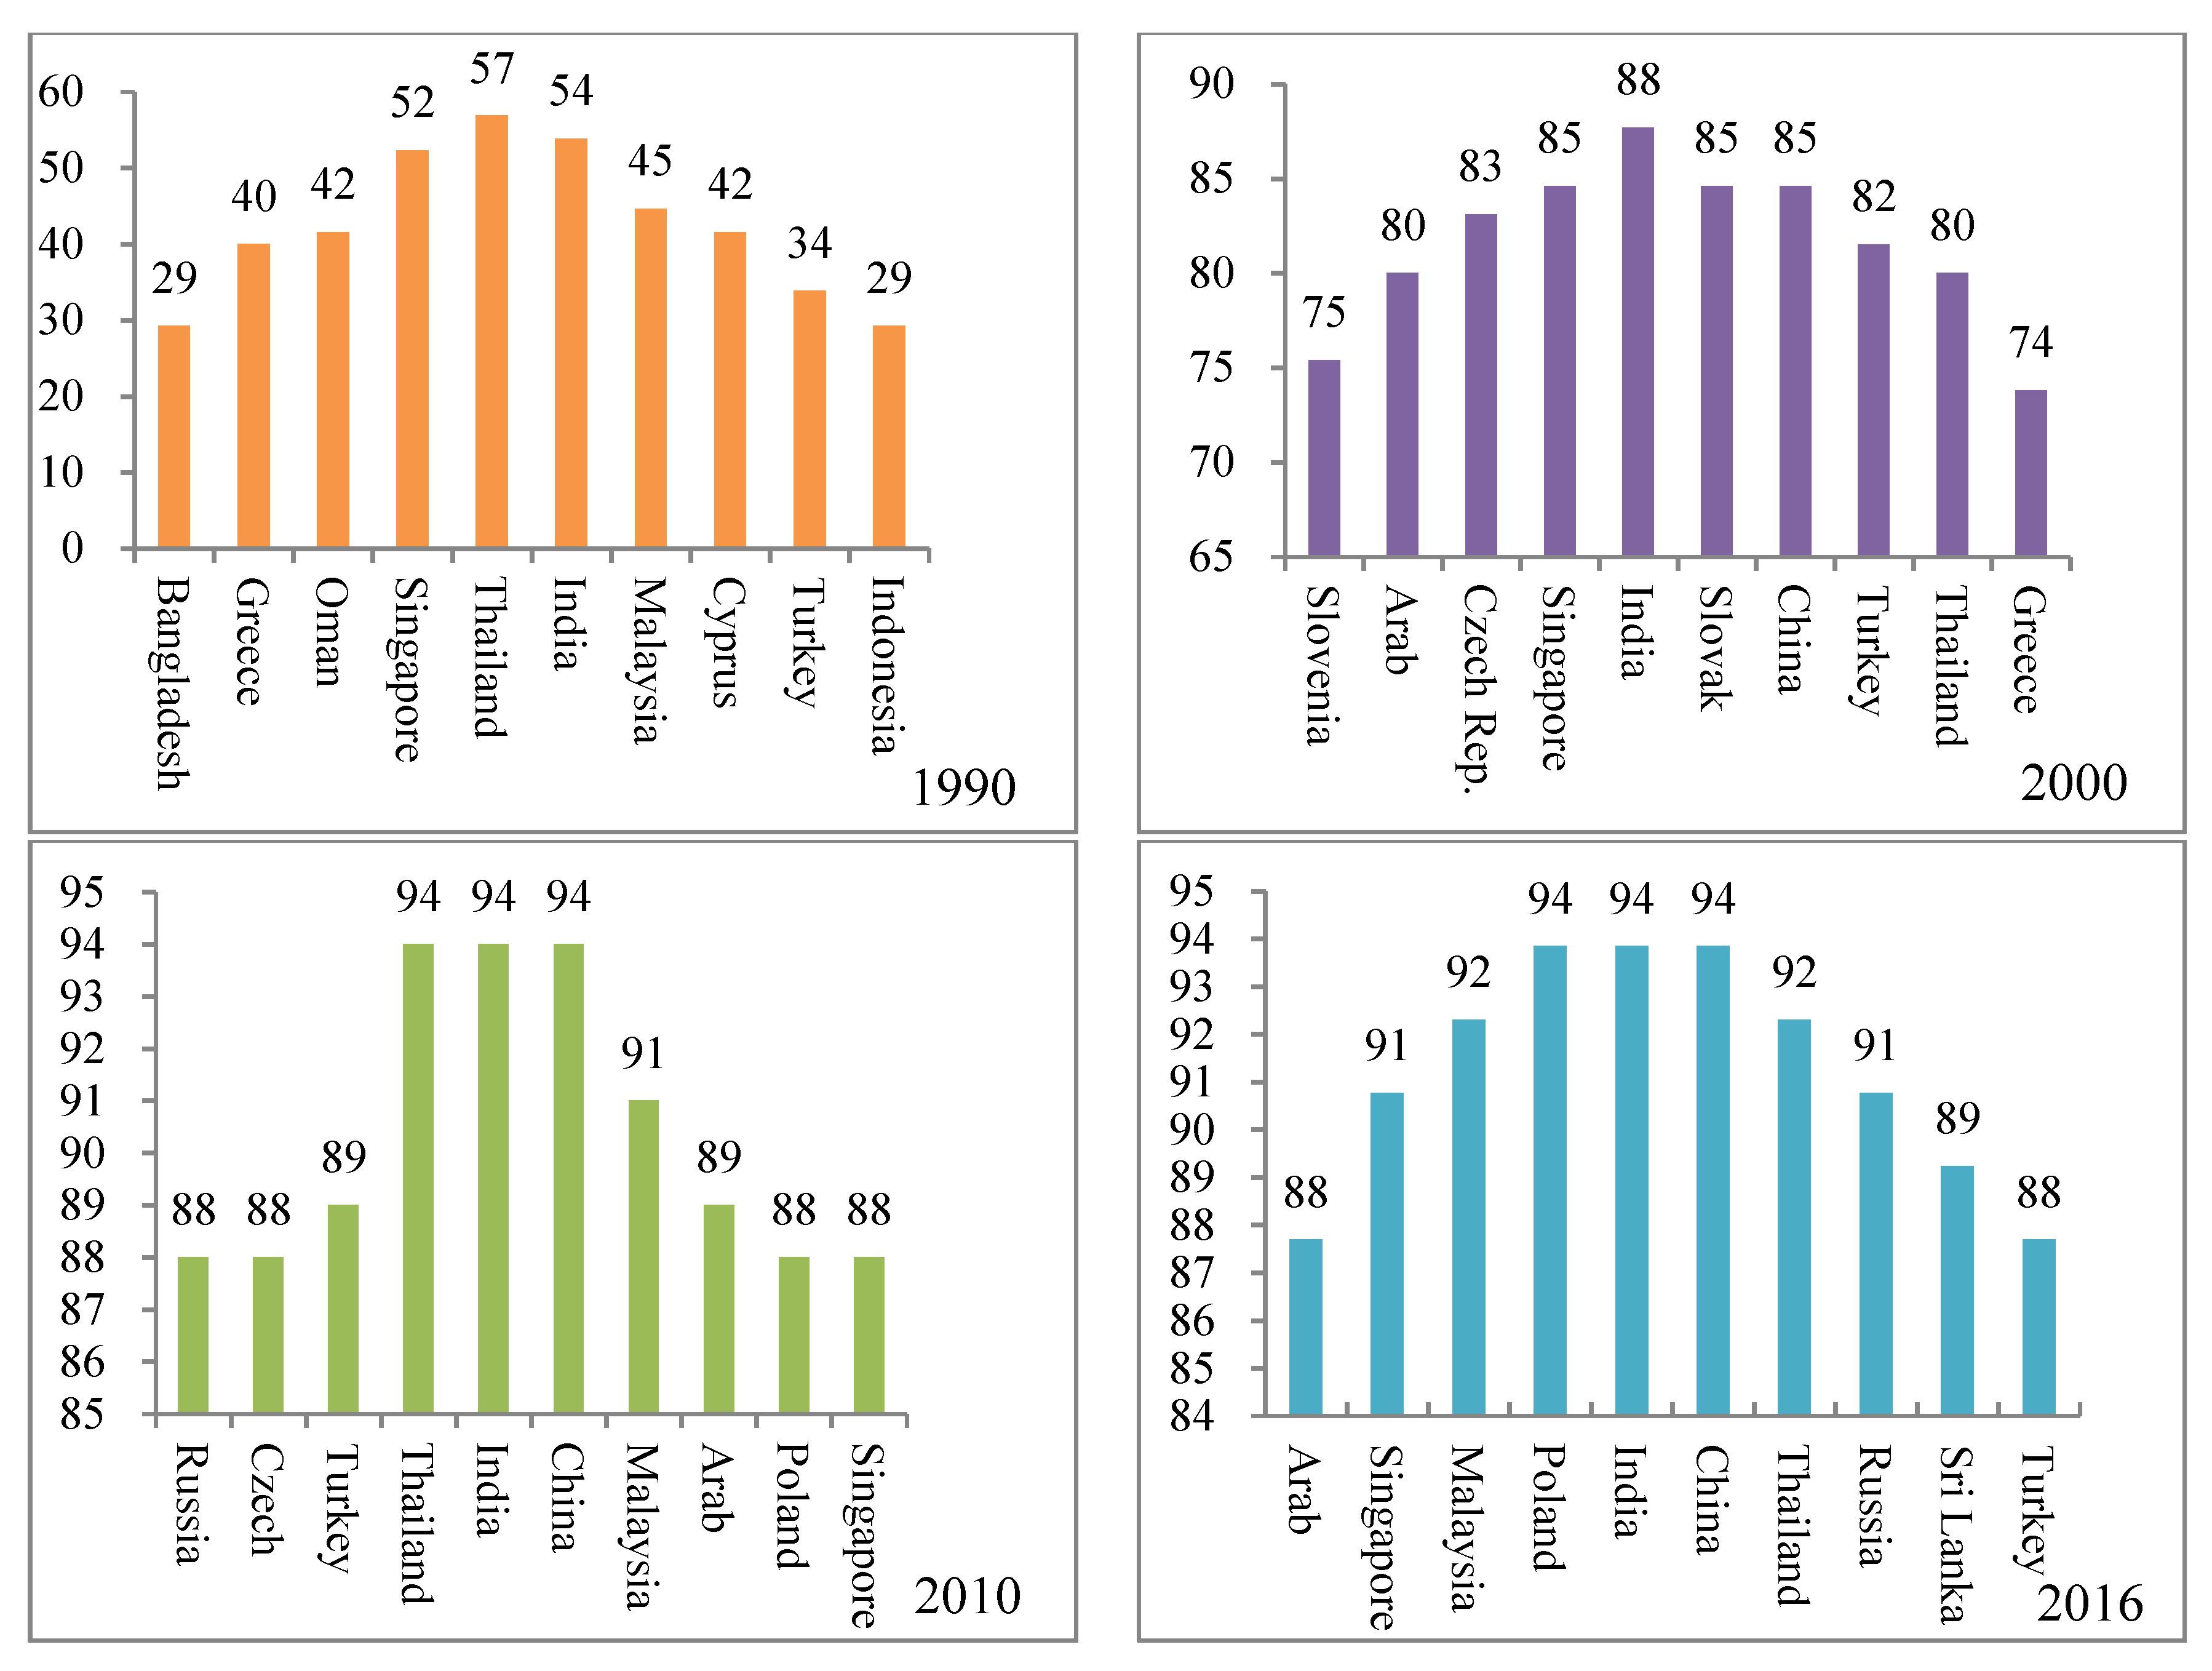
The network degree centrality (Equation (7)) measures the central role of each country and enables the comparison of the temporal changes during the period 1990–2016 between all countries within the cultural trade network (see Figure 6 for four separate years). For example, the top six countries with the highest degree of centrality values in 1990 were found to be Thailand, India, Singapore, Malaysia, Oman, and Cyprus. In 2016, these top six countries were found to have changed to China, India, Thailand, Russia, Poland, and Malaysia. It means that Cyprus, Oman, and Singapore have been replaced by China, Poland, and Russia in the period 1990 to 2016.
There are many political, religious beliefs and socio-economic factors that have been found to contribute to these temporal changes. Taking Thailand and India as an example, in the process of spreading Buddhist culture these countries also promoted the development of cultural trade in the early 1990s. Singapore, due to its geographic hub position and strong export-oriented economic capacities, became the center of the cultural trade network (see Figure 6). However, the traditional pattern of cultural trade has been challenged by the increasing development of transport infrastructure and network communication and growing attention to cultural soft-powers [49]. For example, many culturally powerful countries such as Greece and Thailand have lost their central positions on the cultural trade network within the region. On the other hand, China’s degree of centrality has exceeded that of India since 2006, making it first place in the region. This indicates that China’s cultural influence has spread away from the East and South Asia areas into other parts of the world with growing international cultural trade.
The closeness centrality (Equation (8)) was found to show a disparate pattern, when compared with the other measures mentioned above. The closeness centrality for the 66 countries in 1990 was found to have an average value of 3.65, a minimum value of 3.62, and a maximum value of 3.68. Comparatively, the closeness centrality for the 66 countries in 2016 was found to have an average value of 18.92, minimum value of 17.19, and a maximum value of 20 (see details in Table A1 and Table A2). This demonstrates an overall balanced pattern, meaning that each country is associated with other countries within the spatial network of cultural trade. There are diverse policies contributing to this balanced pattern including trade agreements signed between countries, the opening of new flight routes, and the reduction of cargo turnover time [50]. It is well known that the complementary nature of cultural resources between these countries, have constantly enhanced cultural interactions and promoted the development of diverse cultural markets.
The betweenness centrality (Equation (9)) of the cultural trade network enables the time where a node acts as the shortest bridge between two countries in the region to be described. In 2016, the total value of betweenness centrality for all 66 countries was 28.4 with the top 10 countries being; India, Poland, China, Thailand, Singapore, Malaysia, Sri Lanka, Russia, United Arab Emirates, and the Czech Republic. These countries were found to account for 52.15% of the whole system with a total value of 14.80 (see details in Table A3 and Table A4). With advantageous transport (road and sea) infrastructure and high-level economic growth, these countries play a strong role in coordinating cultural trade and communicating within the network. The bottom 10 countries were found to be; Afghanistan, Iraq, Burma, Yemen, Nepal, Turkmenistan, Uzbekistan, Serbia, Laos, and Cambodia and account for only 0.59% of the whole system with a total value of 0.17. Here, continuous civil war and regional conflict, undeveloped economies, and poor transport infrastructure [51] have decreased cultural trade activities with other countries, and thus decreased their role and position on the network.
4.5. Mutual Dependence
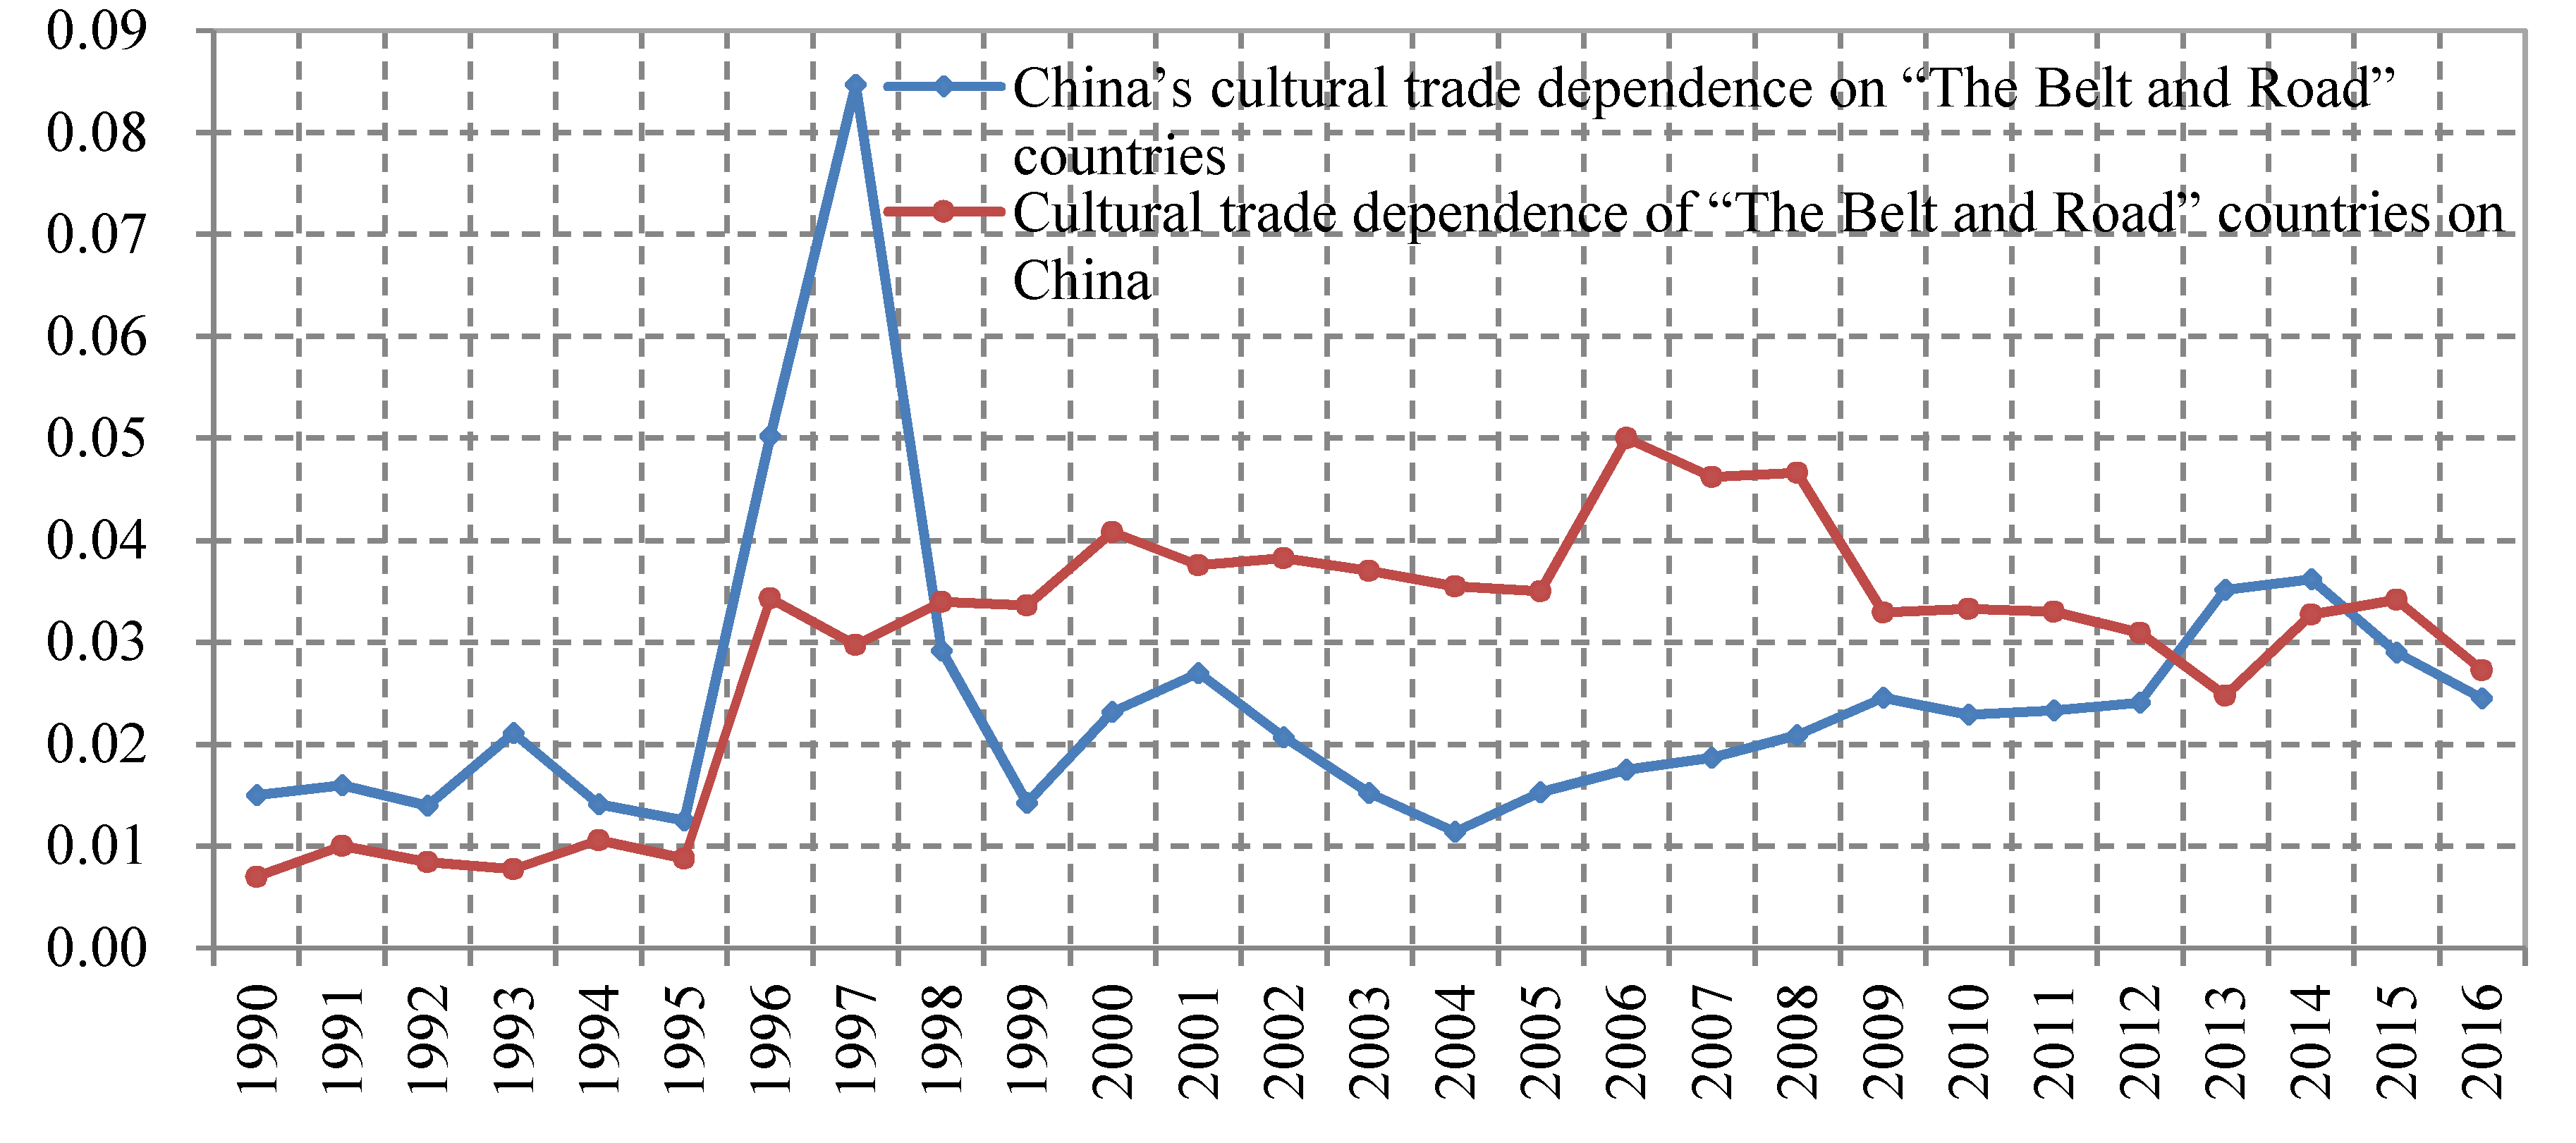
Due to the increasing role and position of China over the network, it is imperative to evaluate the evolution of mutual dependence between China and other countries in the region. Figure 7 presents the mutual dependence values (Equation (10)), where it is clear that 1998 is a watershed moment in the trade relationships between China and the other Belt and Road countries. China’s degree of dependence on the cultural trade network is higher than the other countries during the period 1990–1998, but the pattern is reversed between 1999 and 2012. This reversal was found to have occurred between 2013 and 2016, indicating a potential periodic pattern resulting from complicated interactions. However, it is certain that China has played a crucial role in shaping the cultural trade network.
To specify the temporal dependency between China and the other countries between 1992 and 2016, the top 10 countries which China has been dependent on and their (Equation (10)) values for selected years are listed in Table 3.
From Table 3, it is clear to see that in 1992 China’s cultural trade relied mainly on Singapore, Russia, and Iran, with HM values of 0.184, 0.079, and 0.043, respectively, accounting for 30.6% of the whole region (0.450). Comparatively, the dependence degree of China for Singapore and the United Arab Emirates was found to decrease, while for other countries such as Russia, India, Thailand, and Pakistan it was found to gradually increase. In addition, the total trade dependence degree of China on the 10 countries mentioned above, represented by SUM in Table 3, was found to increase from 45% in 1992 to 59.6% in 2016, reaching a high of 62.7% in 2005. This signifies the high concentration of China’s cultural trade on a few countries, such as South Asian and Southeast Asian markets, as well as North Asian markets (except Russia). Moreover, the dependence trends of China on Middle East countries were shown to increase temporally, and West Asian countries, including Saudi Arabia, United Arab Emirates, and Iran, have already been shown to be important trade partners with China in the trade of cultural products.
4.6. Cohesive Subgroups
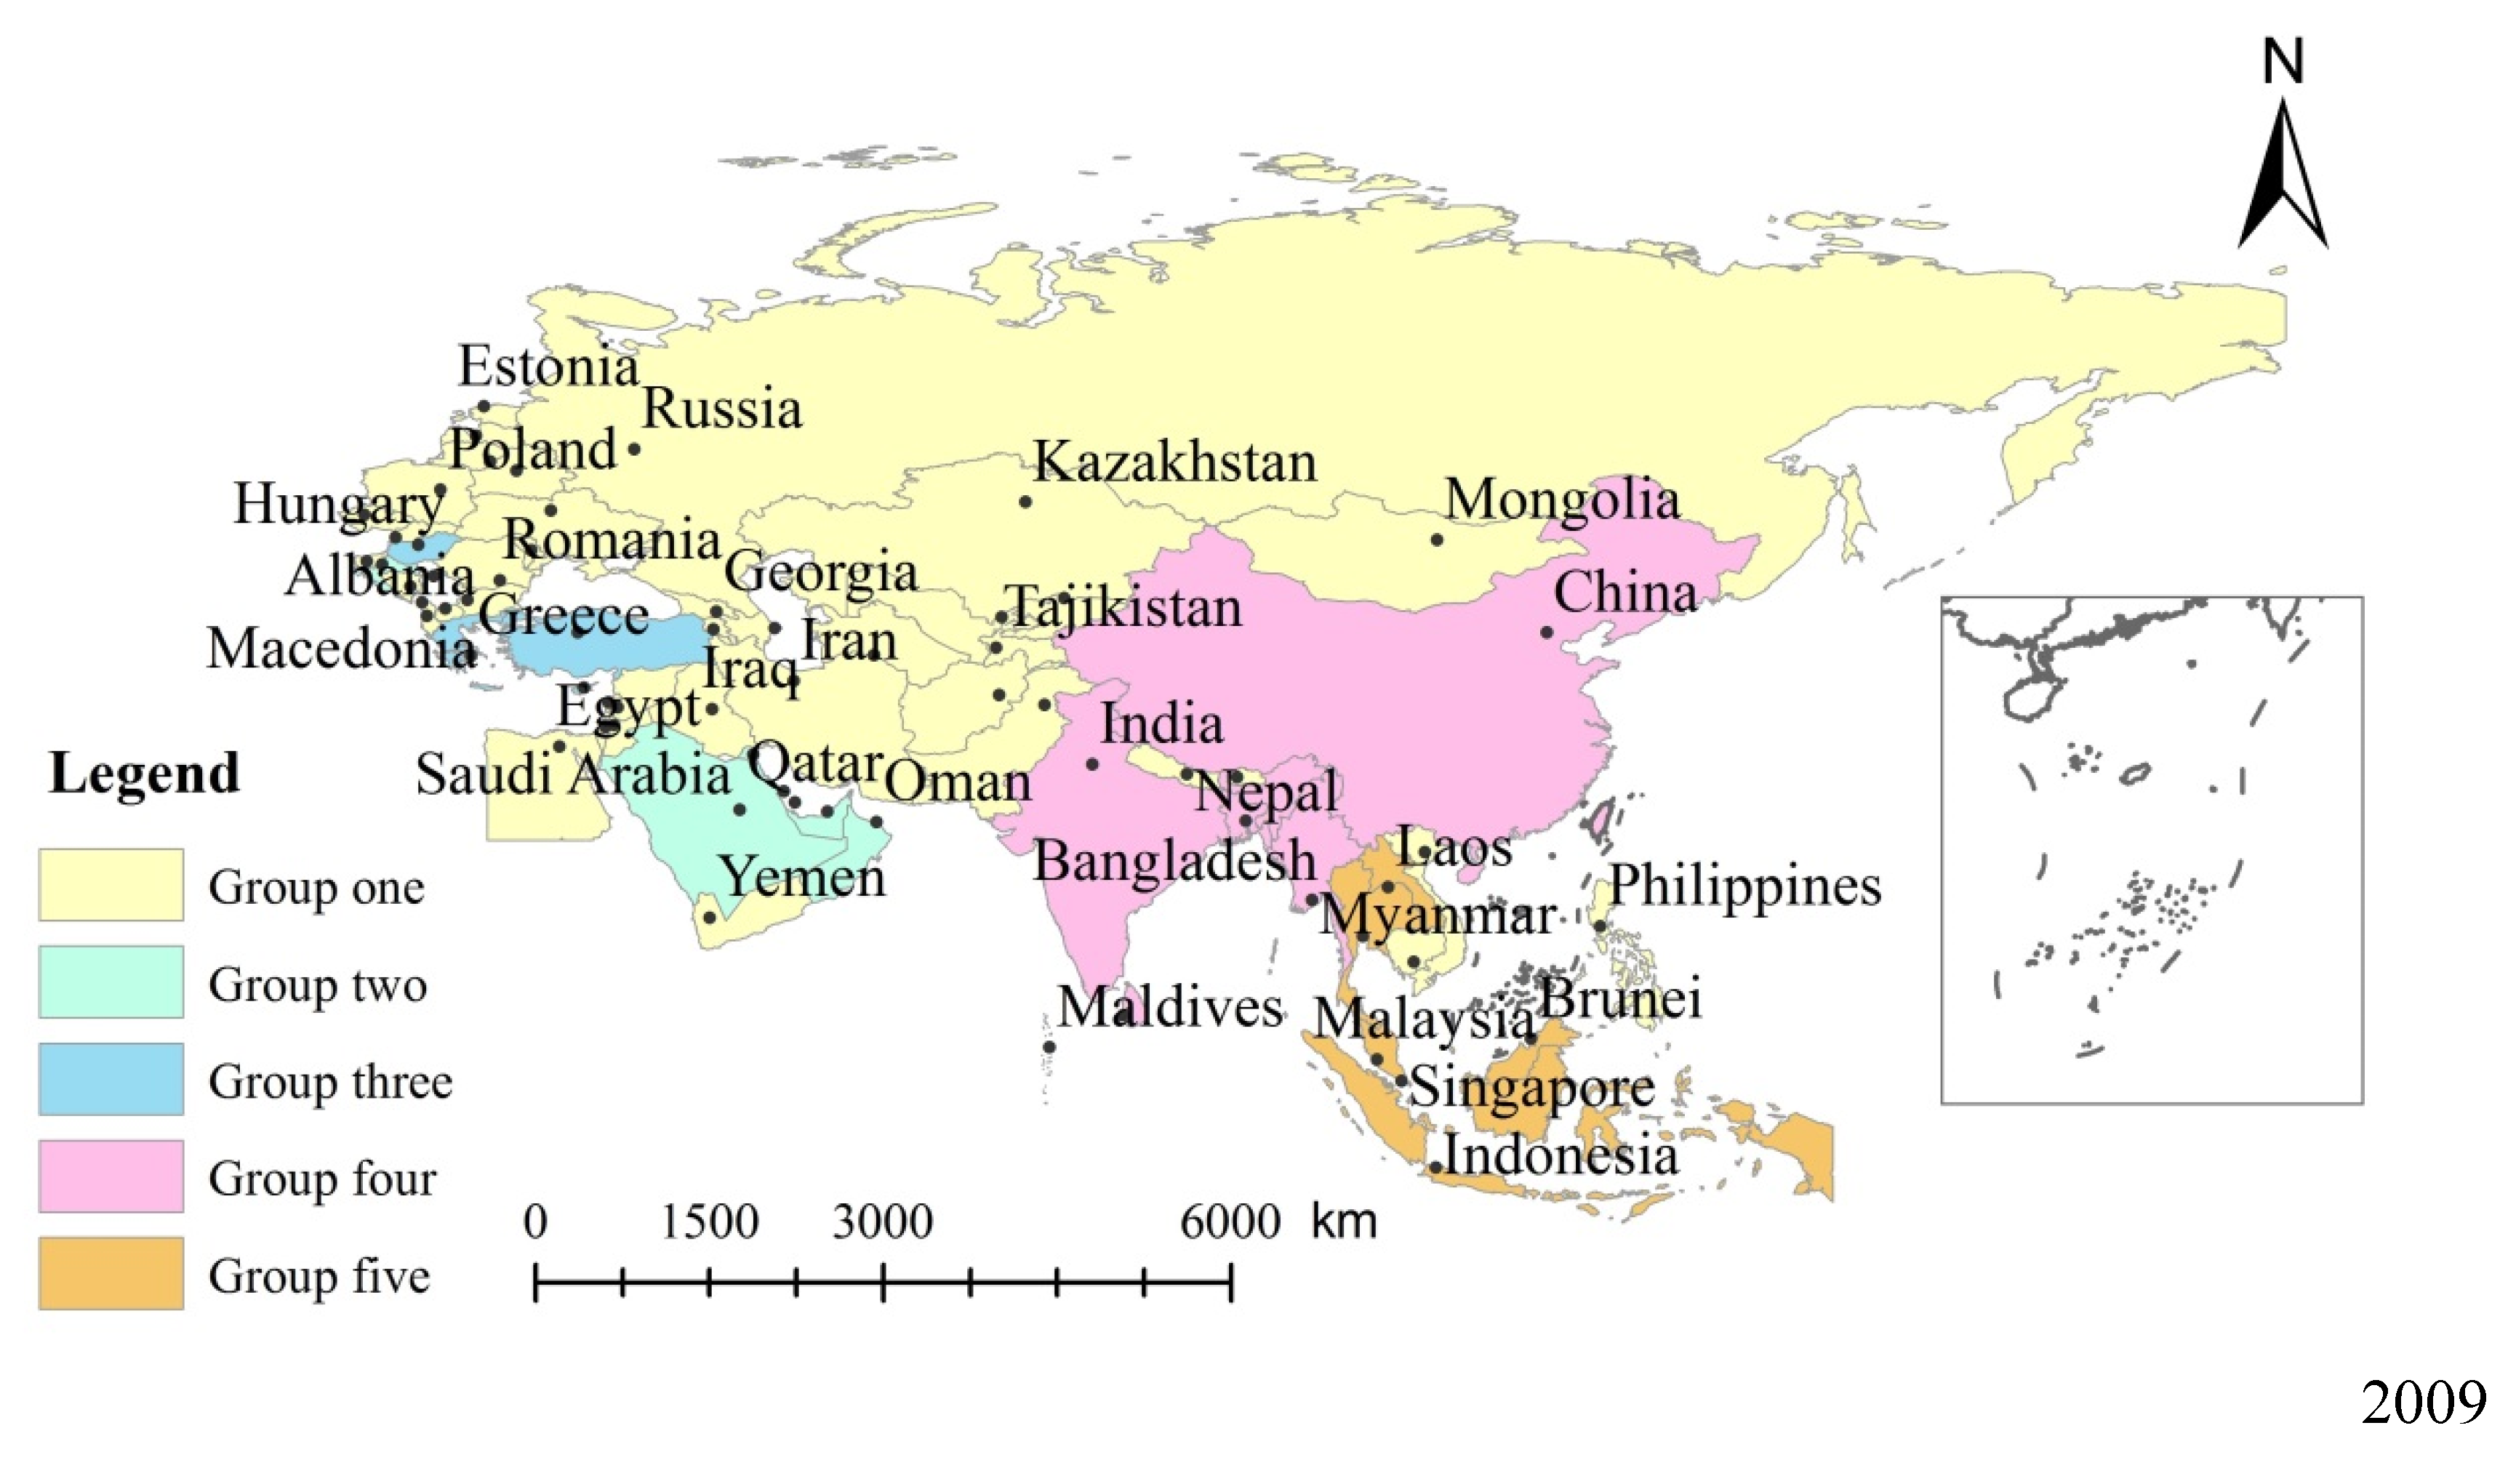
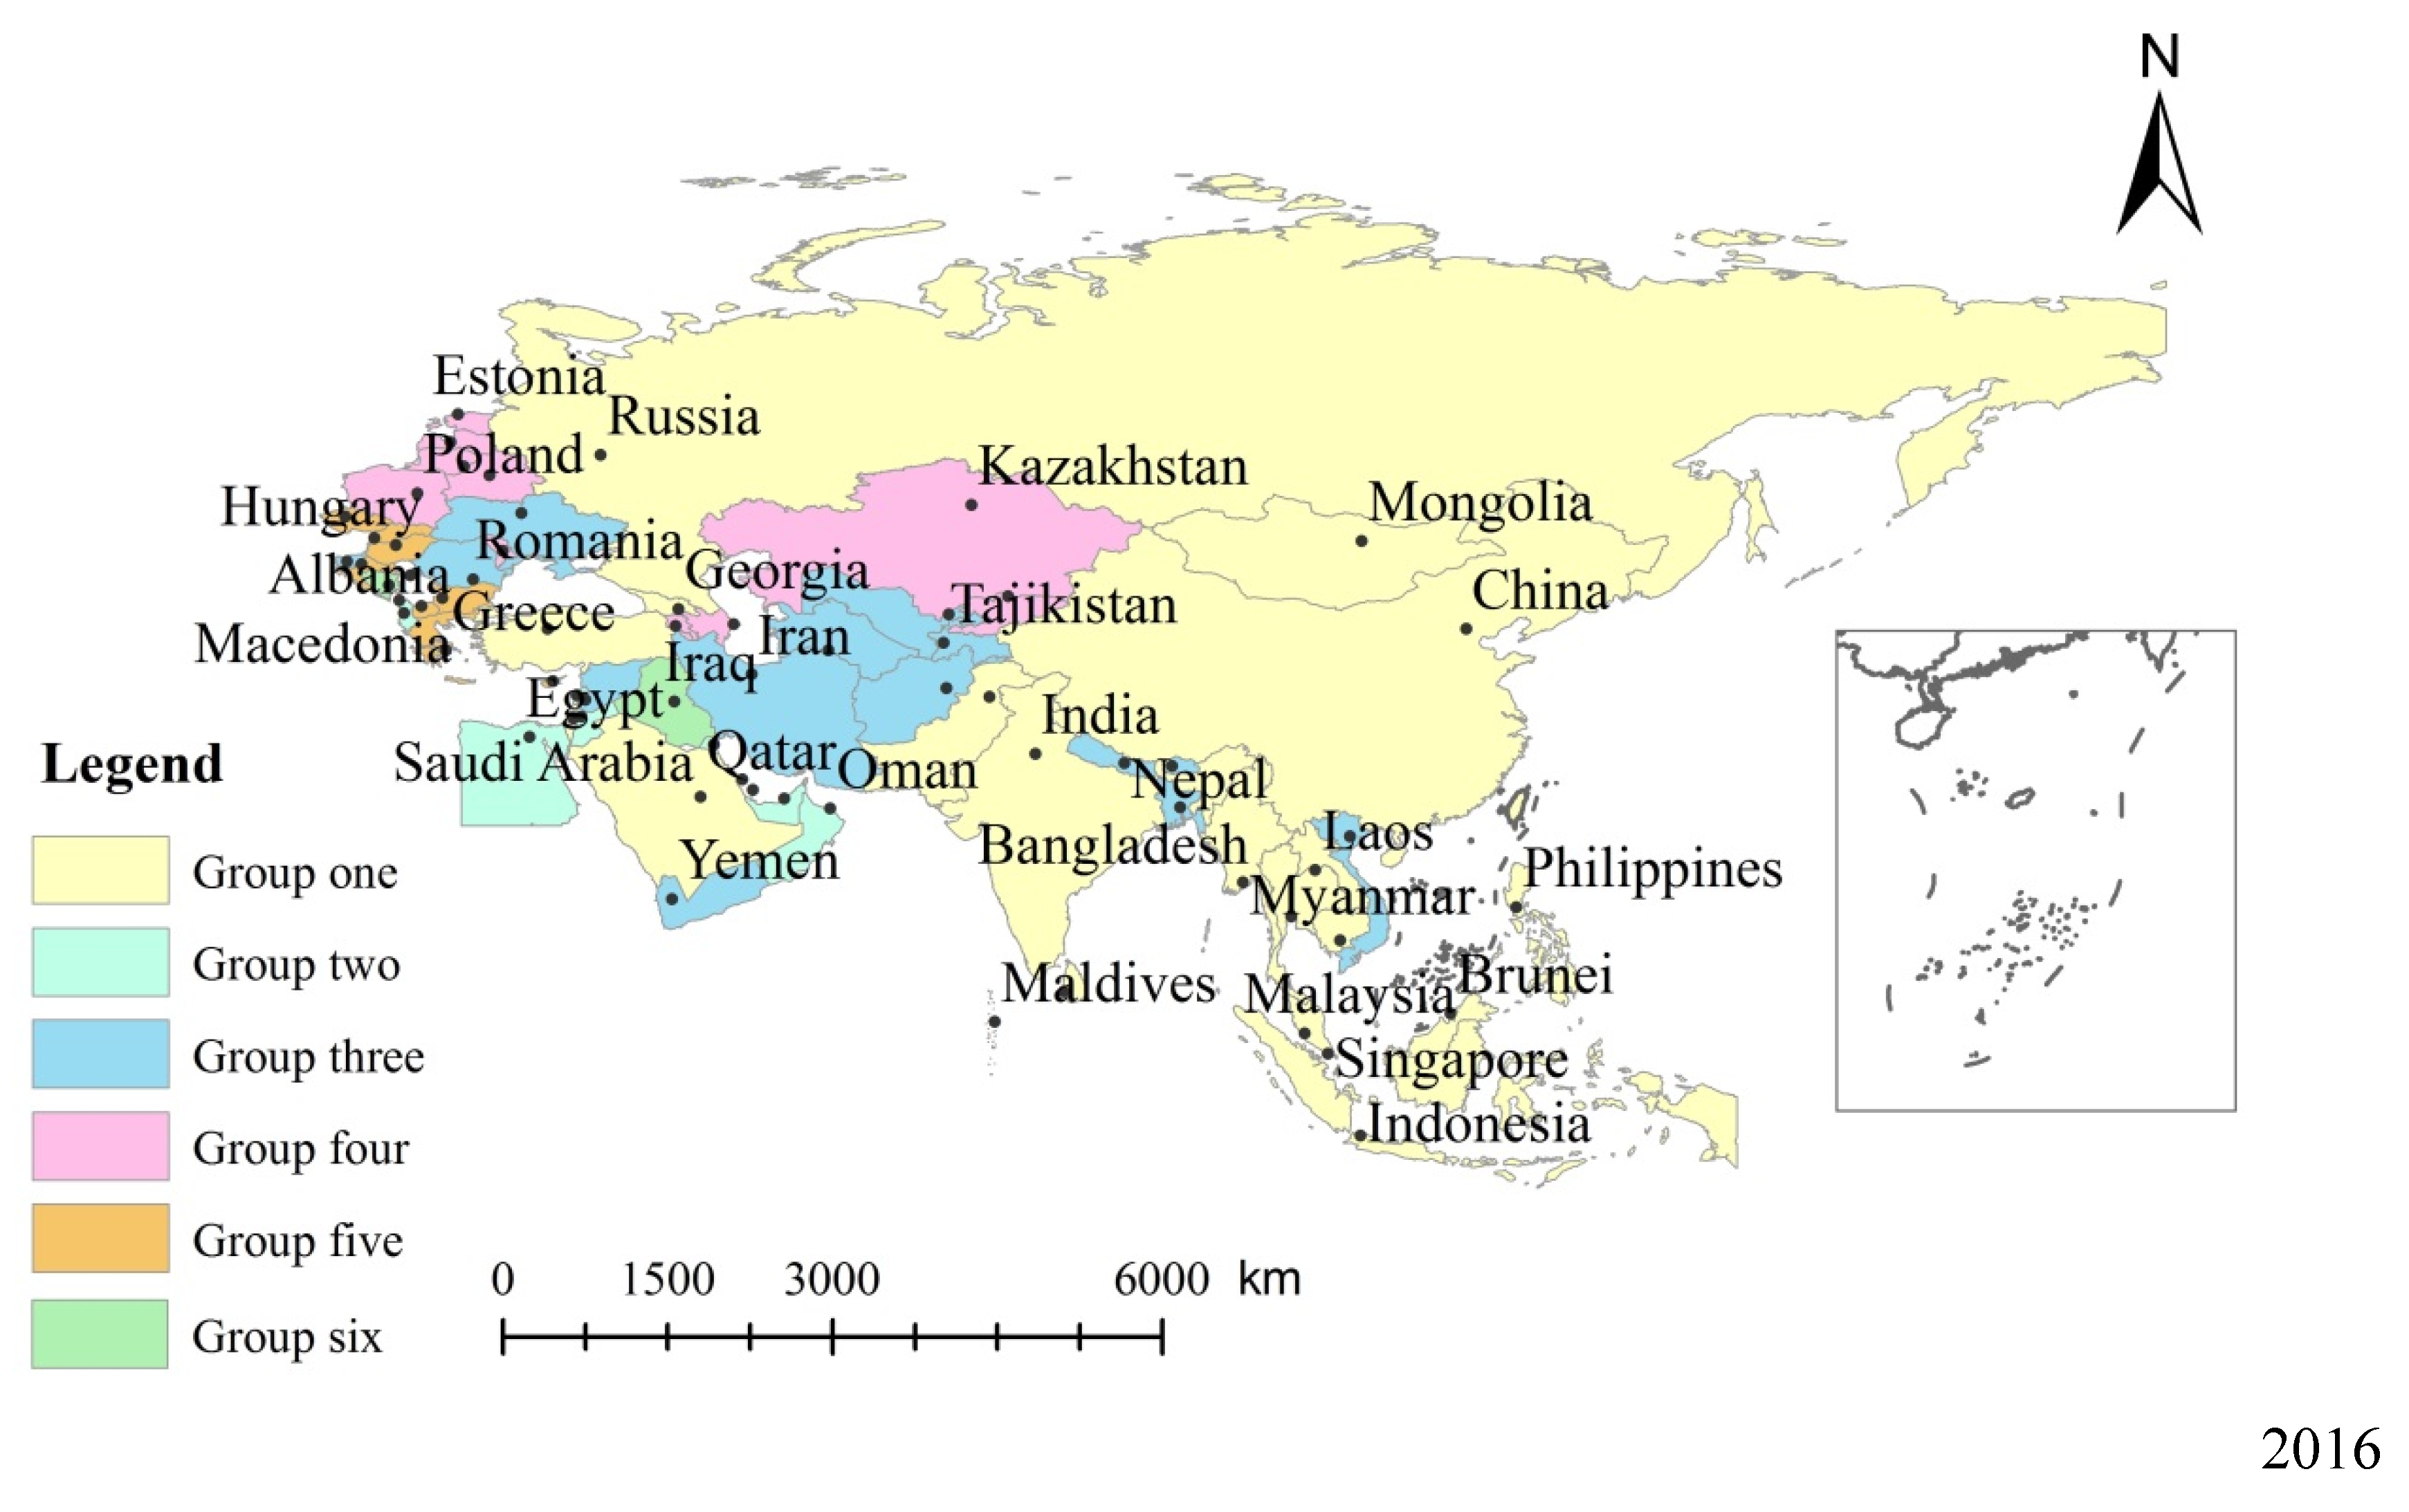
To determine the number of cohesive subgroups on the network or so-called “circle of friends” [52], the cohesive subgroup measure (Equation (11)) was used to investigate the temporal clustering patterns of the cultural trade network in 1990 and 2016 (Figure 8).
Major changes between 1990 and 2016 were reflected in the structure of subgroups (see Figure 8). Although the number of cohesive subgroups within “the Belt and Road” region has been shown to have not massively changed over the past 26 years, the internal members in each subgroup have been shown to significantly change.
In 1990, the size of each subgroup (5 groups in total) was found to be small, with most of them only having four or five members. Furthermore, the majority of countries do not have their own “circle of friends”, being in the state of “stragglers and disbanded soldiers” [53]. Cultural trade cohesive subgroups were found to be formed primarily by geographical proximity, culture, and colony ties, and complementary political systems. For example, China, India, Sri Lanka, and Bangladesh have been a core part of the conventional “Silk Roads” region. While Singapore, Thailand, Brunei, Indonesia, and Malaysia, as member countries of the ASEAN region, have been influenced greatly by Islam and Buddhist cultures. Likewise, the United Arab Emirates, Oman, and Saudi Arabia in the West Asia region, share similar cultures and are close to each other and thus are more likely to form a “circle of friends”. The five countries in Central Asia (Kazakhstan, Uzbekistan, Kyrgyzstan, Tajikistan, Turkmenistan) and the South Caucasus (Azerbaijan, Georgia, Armenia) as parts of the former Republic of the Soviet Union, have also formed a “circle of friends” due to the previous experience of sharing a political system.
In 2016, six “circles of friends” were found to have been formed after large-scale division and merging since 1990. Where contributing factors were found to include multiple political and economic forces, such as signed trade agreements [54] and similar economic strengths. China has further expanded its network from very few countries on the traditional Silk Road to 32 countries spanning much a larger area. Thereby, China has formed its own “circle of friends” for cultural trade, with countries including Russia, Singapore, Thailand, Malaysia, Mongolia, Sri Lanka, Maldives, and other partner countries. Many other countries were also found to have joined the “circle of friends” with China in 2016.
5. Discussion
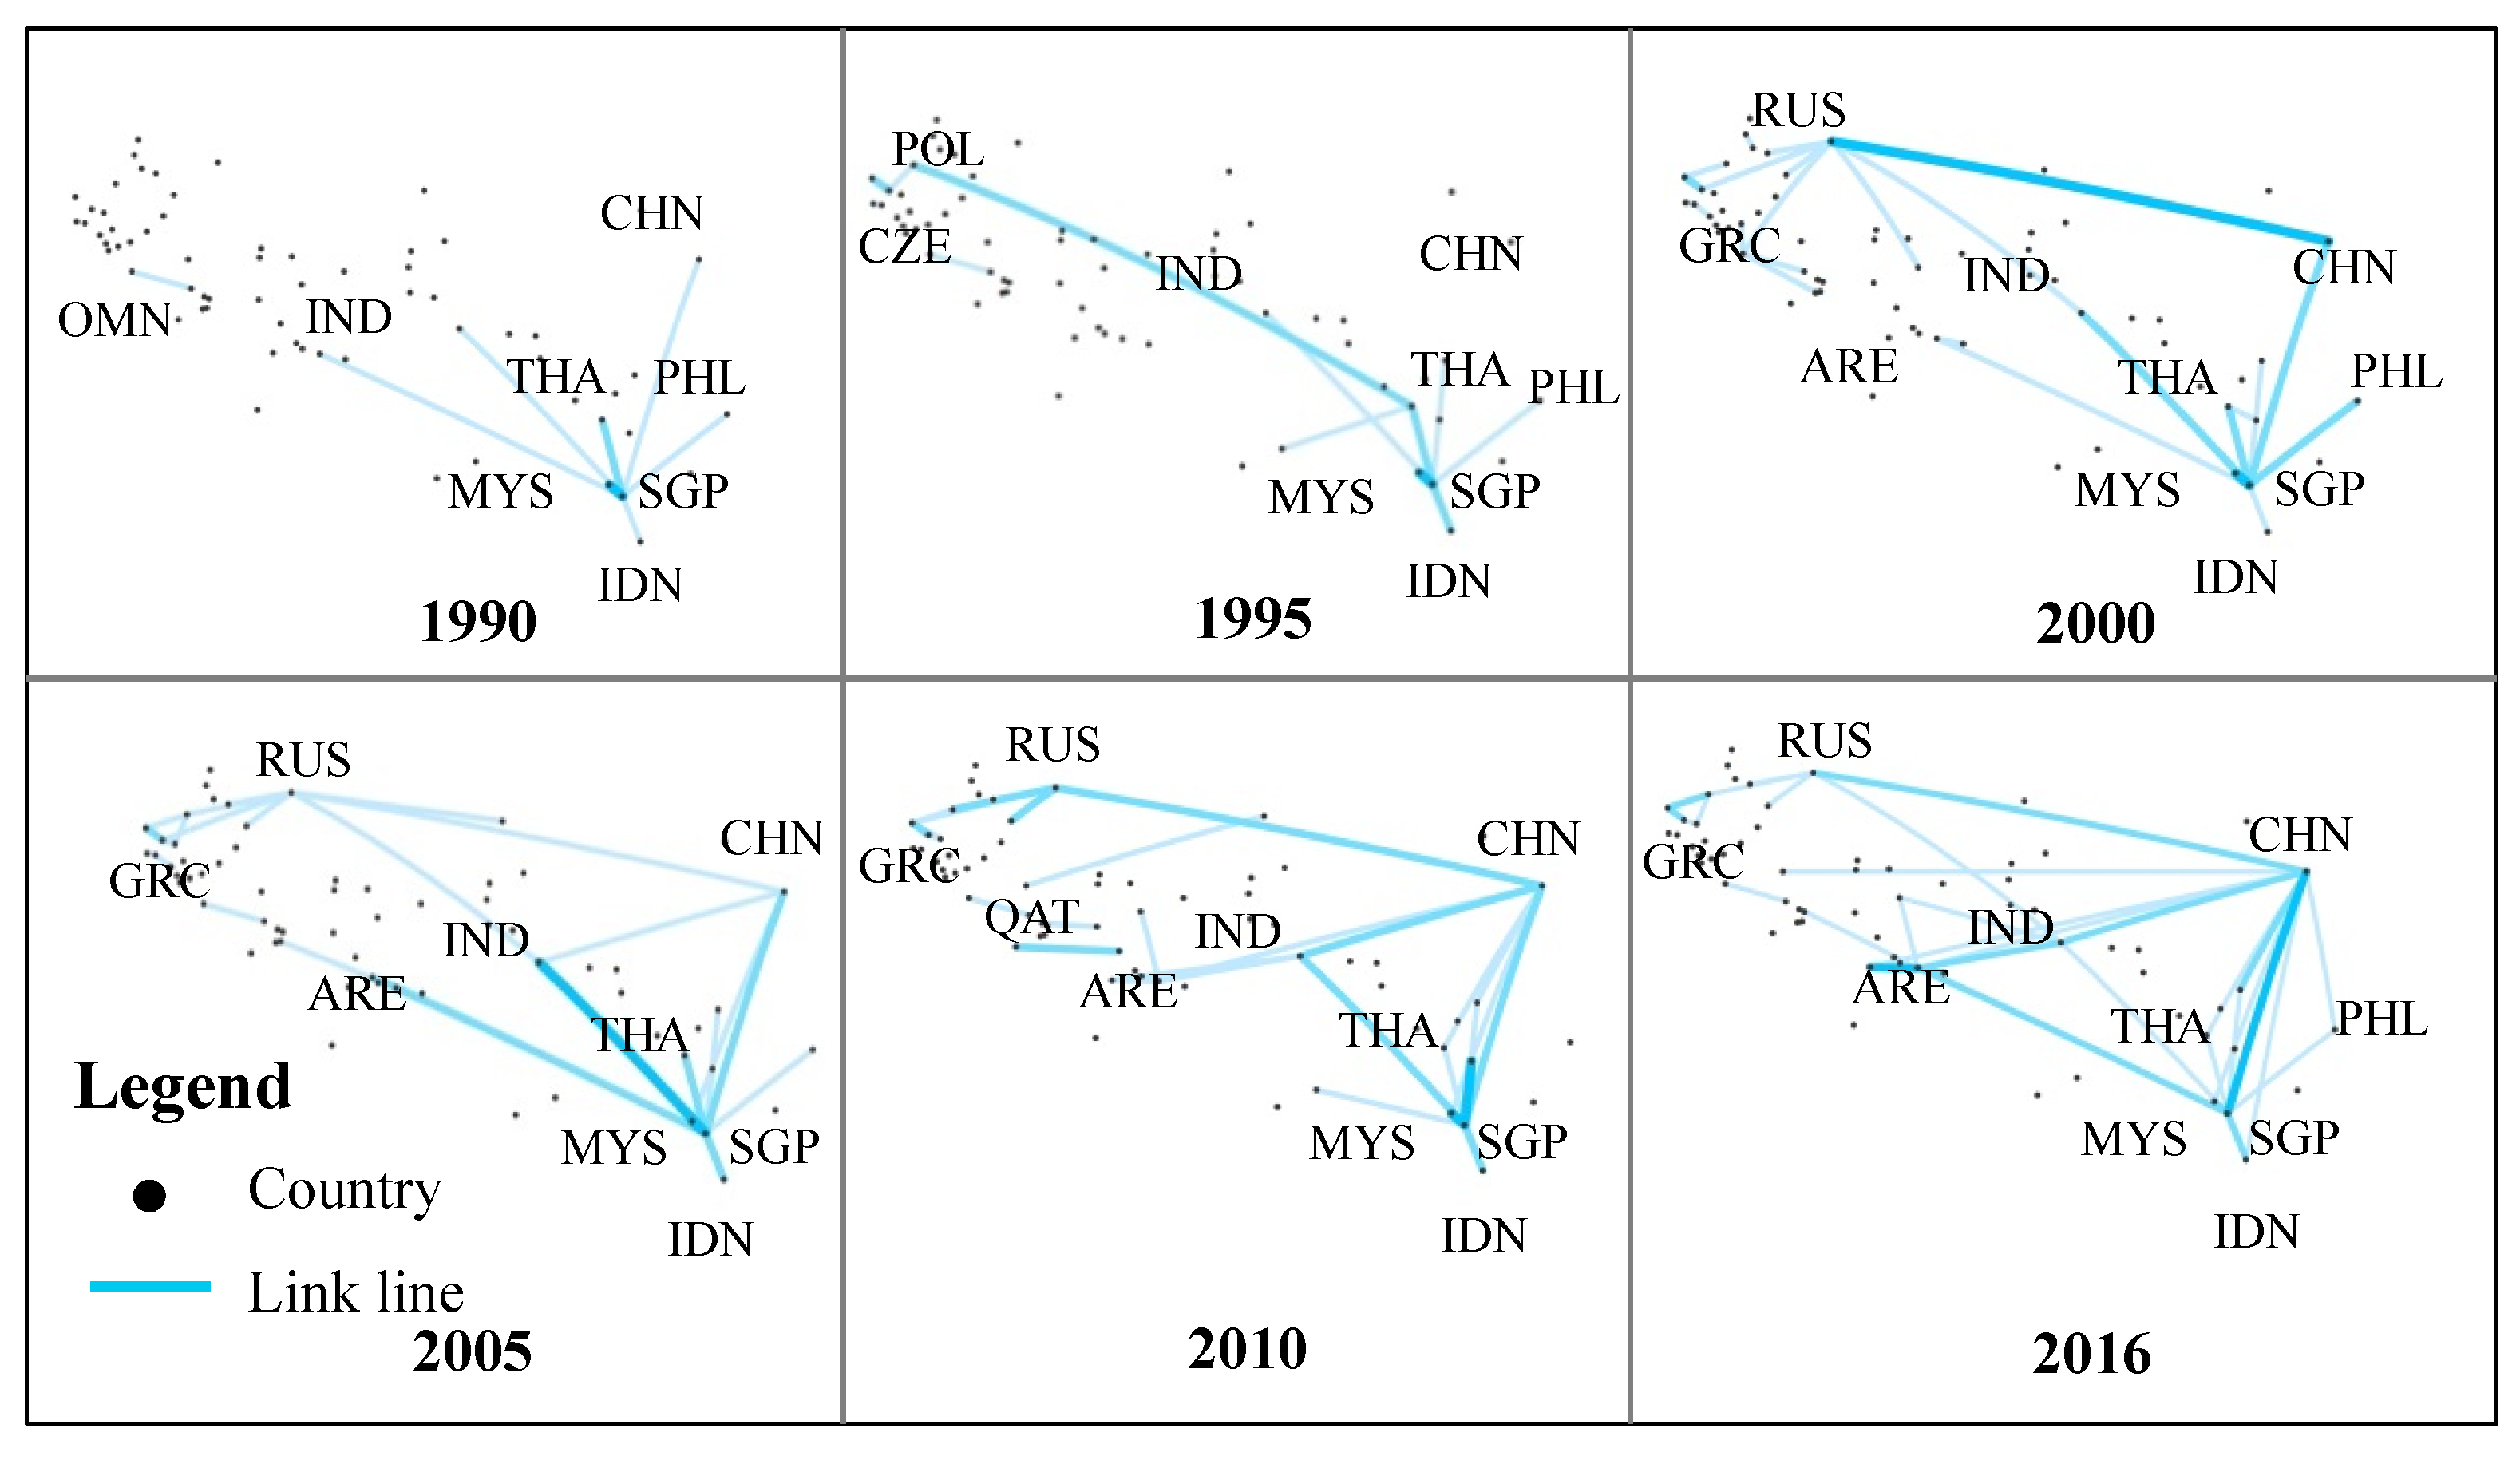
The SNA results enable the understanding of cultural trade network characteristics in a dynamic way. In the period 1990–2016, the increasing trade of diverse cultural products, including books, movies, TV shows, performing arts, animation, online games, and creative design, was shown to promote cultural and knowledge exchange between all countries in the region, as demanded by the different socio-cultural groups [55]. To conceptualize the evolution of such networks, changes of key nodes and cultural corridors were analyzed and presented for the six periods in Figure 9. Here, a cultural corridor is defined as a set of key nodes linked topologically.
In 1990, cultural trade in the region was concentrated mainly in Southeast Asia. The key nodes in this Southeast Asian cultural circle were Singapore and Thailand; however, cultural corridors with other regions were not found to be fully formed. In 1995, a new Eastern European cultural circle had been formed, with Poland and the Czech Republic representing the key nodes. This cultural circle, and the existing Southeast Asian cultural circle, was found to be connected and framed the first cultural corridor: “Thailand–Poland”. In 2000, a new East Asian cultural circle was formed, with China as the key node. Southeast Asian cultural circles were found to be composed of two key nodes; Singapore and Thailand, same as in timeframe 1990–1995. However, a different Eastern European cultural circle was found, where Greece and Russia represented the key nodes. Such cultural circles have framed a stable “golden triangle”, which comprise of three cultural corridors; “Singapore–China”, “Singapore–Greece”, and “China–Russia”. These cultural trade networks have since been found to be in continuous growth and development up until 2016. Here, with increasingly active cultural trade, eight cultural corridors have been formed around the key nodes of Singapore, China, Russia, and Greece. These cultural corridors are “Singapore–China”, “Singapore–Russia”, “Russia–China“, “Thailand–India“, “Greece–Russia”, “India–China“, “India–United Arab Emirates”, and “United Arab Emirates–Thailand” (for the details, see Table A5). Here, the corridors were found to be connected to a more stable “quadrilateral”. Overall, it has been shown that between 1990 and 2016 cultural corridors that connect Asia and Europe have been subject to growing expansion.
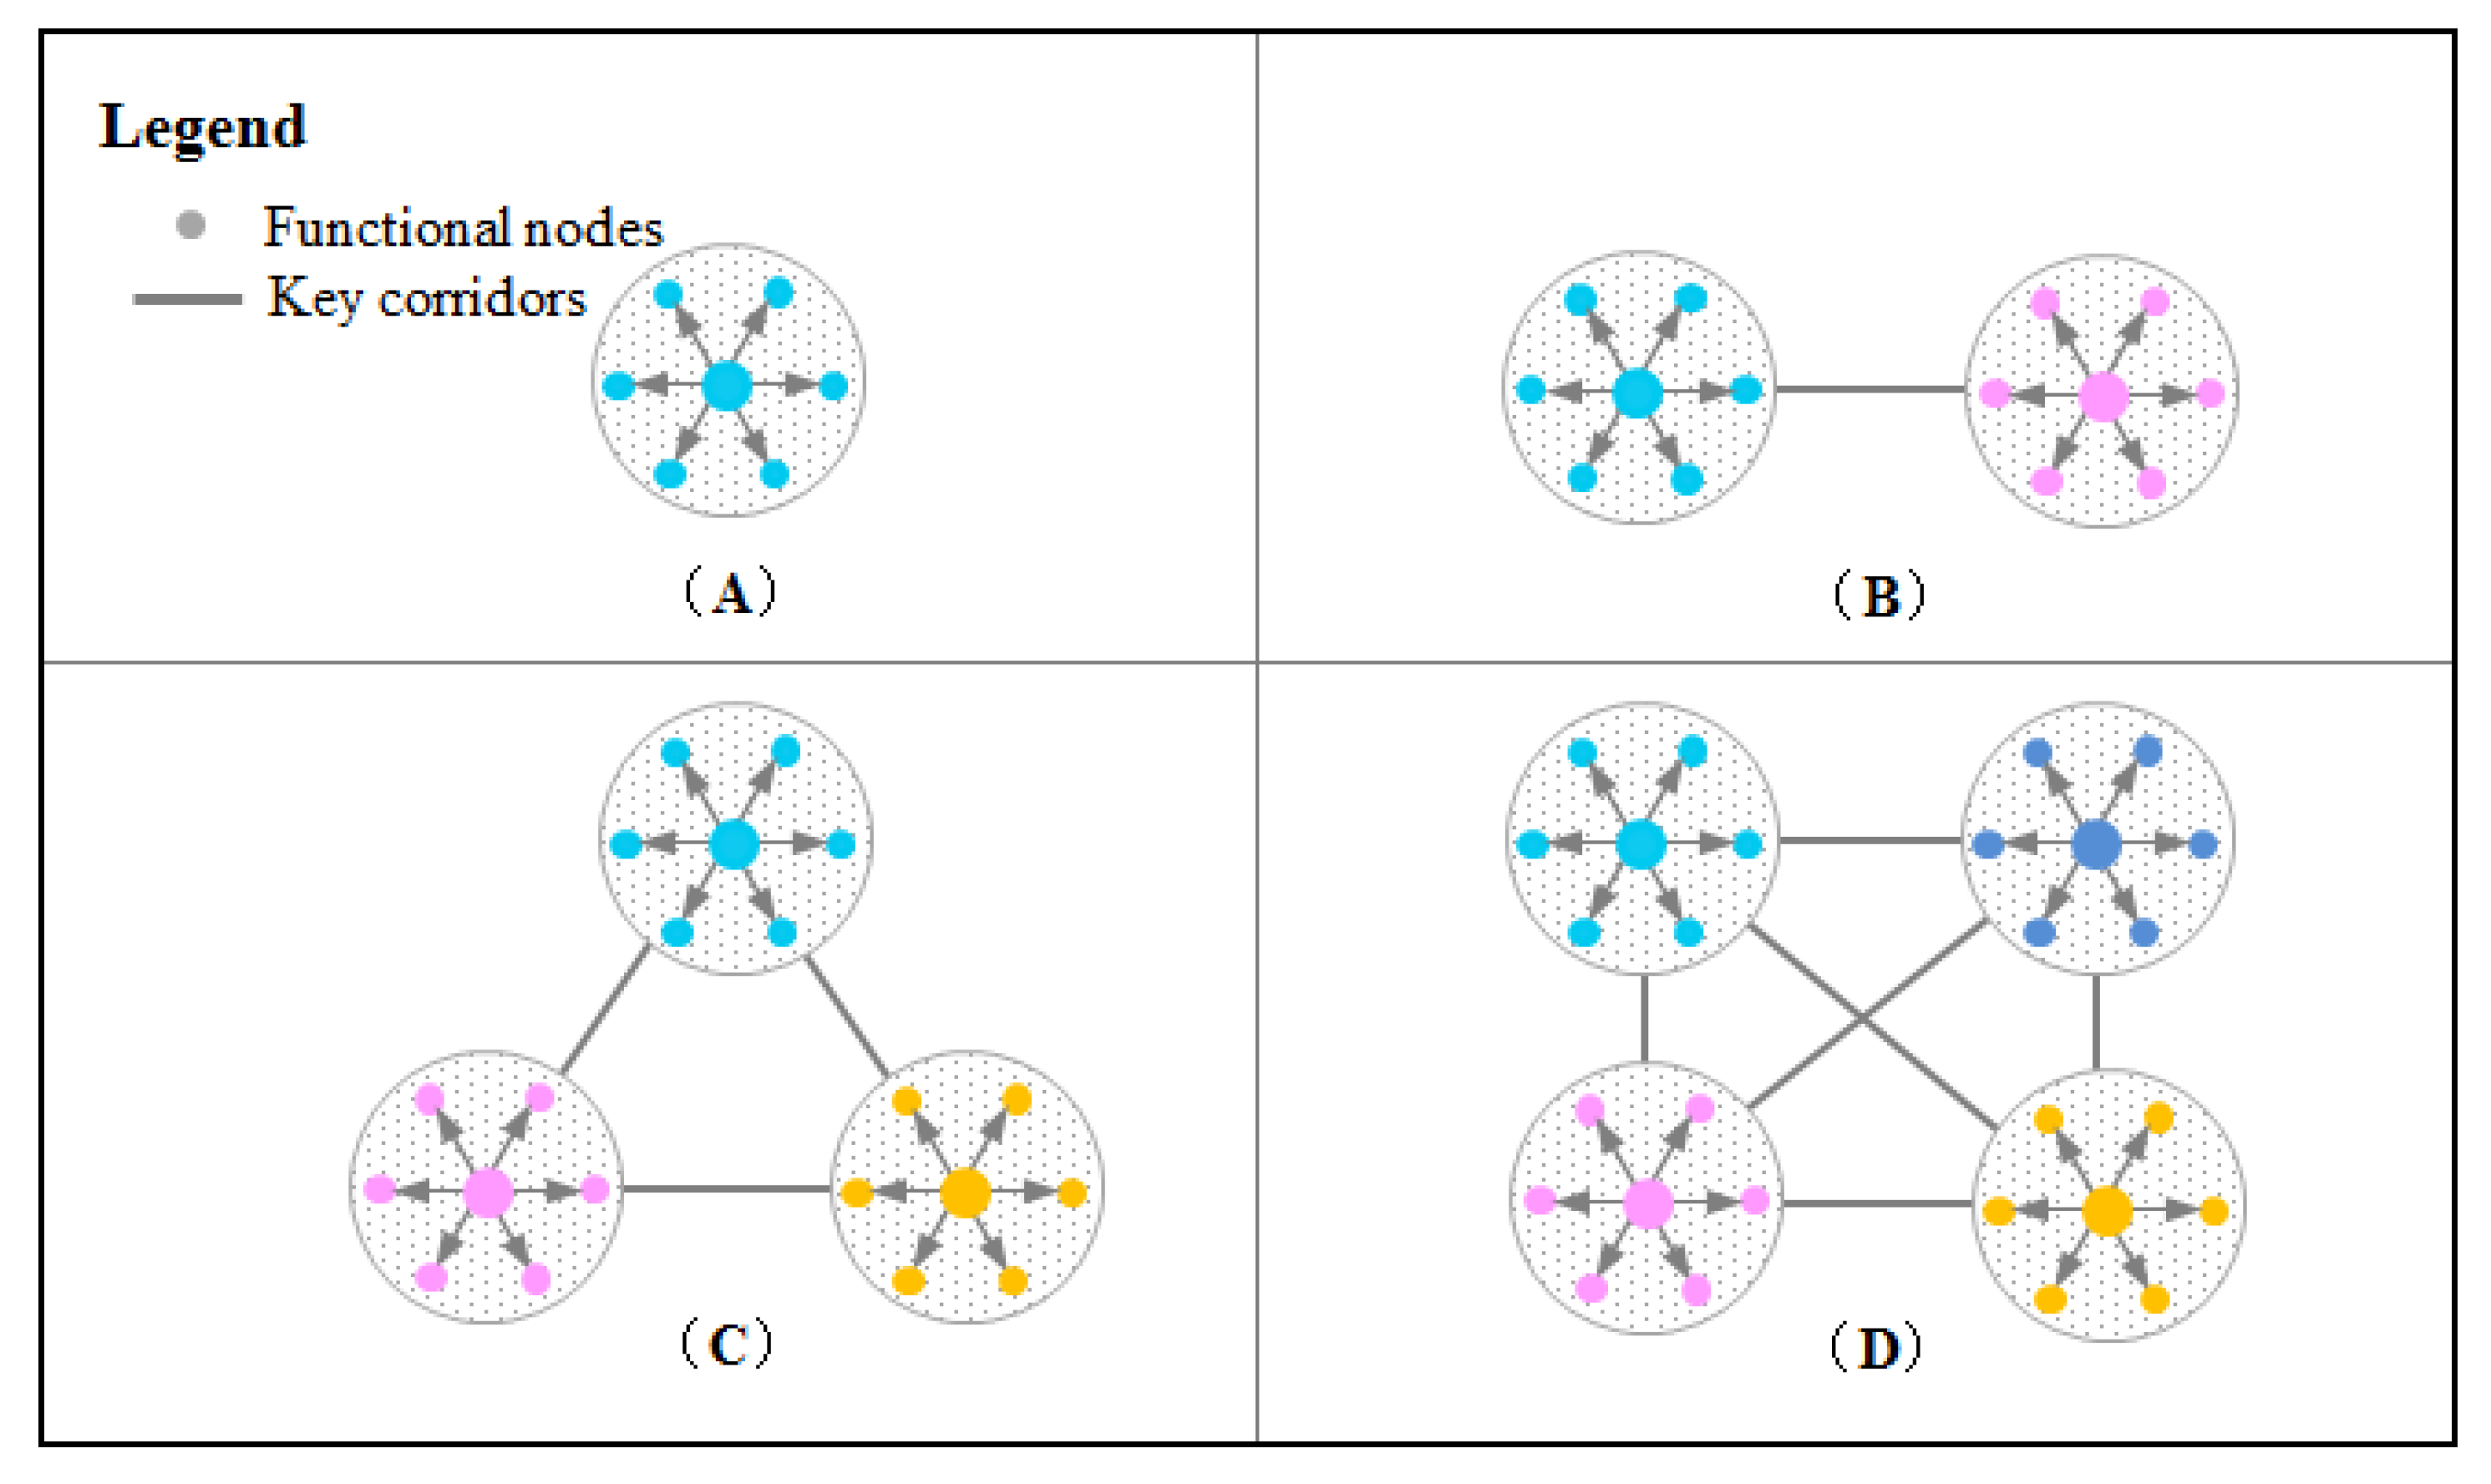
The evolution of cultural corridors between 1990 and 2016 has been conceptualized in Figure 10, with the four diagrams (A→B→C→D) corresponding to 1990, 1995, 2000, and 2016, respectively.
The process of such evolution has been to be dominated by the outward expansion of key nodes and cultural circles and the gradual formation of cultural corridors following the spatial pattern of a point-line-polygon. Those countries with high node strength were shown to become key nodes in cultural trade networks. These key nodes were then found to collate to form cultural corridors. With the increasing number of cultural corridors, the pattern of cultural trade networks has been found to change significantly, gradually forming multi-level cultural circles. Individual countries were found to play a varied role in such multi-level networks, which reflects increasing cultural diversity in this region.
As indicated by Figure 9, the pattern of cultural corridors is highly affected by geographical location or proximity and by cultural endowment. Indeed, closer key nodes were found to connect more easily into a cultural corridor than distant nodes. Likewise, similar cultural circles were found to form cultural corridors more easily.
Further, cultural diversity leads to the diversity of cultural products, such as film, music, book, TV series, artwork, painting, and so on, different cultural products have different audiences, and they have different effects on the sustainable development of culture. Particularly with the rapid development of new media, the path and speed of cultural communication have undergone tremendous changes. In the case of film, film is not only a cultural product, but also a medium for cultural communication. Film combines three powerful elements: image, sound, and context, and communicates with the audiences in other regions or countries [56]. Therefore, cultural sustainable development cannot be achieved by cultural protection through isolation, but it should involve strengthening trade in cultural products between countries, regions, and globally. Through cultural communication, more people can understand national cultures, and the sustainable development of cultural heritage can be achieved.
In addition, cultural sustainability is an emerging area of research. Until recently, the understanding of culture within the framework of sustainable development has remained vague. Soini and Birkeland found that the scientific discourse on cultural sustainability was organized around seven storylines: heritage, vitality, economic viability, diversity, locality, eco-cultural resilience, and eco-cultural civilization [31]. Other scholars believe that cultural sustainability also contains the aspect of social capital [57] or culturally sustainable entrepreneurship [30]. However, scholars have little research on the trade network of cultural products. We believe that cultural sustainability is not only encompassed within those aspects we have mentioned above, but also includes cultural trade sustainability. Thus, cultural sustainability can be defined as every country having its own cultural “circles of friends”, while different cultural “circles of friends” are linked by “cultural corridors”, and all people work together to build a “community of shared culture for mankind”. Therefore, to some extent, this study may provide a new perspective for the sustainable development of culture and enriches the concept of cultural sustainability.
6. Conclusions
This paper employed an empirical study on the structural characteristics of the trade network of cultural products within ‘the Belt and the Road’ region. To do this, a social network analysis (SNA) method was used along with a dynamic perspective. From the analytical results, the following conclusions were drawn.
First, cultural trade networks along “the Belt and Road” have become more and more balanced between 1990 and 2016. Thus, the survivability of “the Belt and Road” cultural trade network can be said to be more stable, especially when considering the contributions of China, India, Russia, and Thailand.
Second, the roles of each county within the network has changed significantly over the timeframe analyzed due to varied levels of economic development, evolving trade agreements, and unpredictable war and financial crises [58]. In the early period (e.g., 1990), countries such as Singapore, Thailand, Malaysia, and Greece, which had advantageous transport (road and sea) infrastructure, were found to have an attractive cultural heritage and a high-level economic growth [59] and thus played an important role in the development of the cultural trade network. However, with rapid economic development and increasing improvements to transportation, China, Russia, and India (three “BRIC” countries; BRIC: Brazil, Russia, India, and China) have become key nodes of cultural corridors since 2000. The conceptualized model of point-line-polygon (Figure 10) reflects the spatial and temporal processes of stable cultural trade networking between Southeast Asia, East Asia, South Asia, and Eastern Europe. Here, the healthy competition between the 66 countries has been shown to be conducive to the sustainable development of cultural trade [60].
The evolution of the cultural trade network has seen the development of cultural exchanges between all 66 countries, from the early state of “stragglers and disbanded soldiers” to the gradual creation of six primary “circles of friends”. Geographical proximity, religious beliefs, traditional customs, language, nationality, and race have all contributed to the formation of such “circle of friends”. Furthermore, the effects of radiation and spillover on neighboring regions have also been demonstrated. For example, as the second largest economy body and one of four ancient civilizations, China has been found to have developed large-scale cultural trading partnerships and has generated region-wide spatial and cultural influences [61].
However, current cultural trade has been found to be dominated still by large-sized countries (e.g., China, Russia, and India). Where small-sized countries (e.g., Bangladesh, Sri Lanka, Hungary, and Bulgaria), despite possessing unique cultures and a wealth of products, have been found to be excluded, to some degree, from the cultural corridors. This is due to their current levels of economic development, transport linkages, and international relationships [62,63]. To promote socio-cultural sustainability within the region, small “circles of friends” formed by similar cultures could be further expanded and enlarged to achieve cultural diversity along the cultural corridors. It has been suggested that small circles are beneficial to the inheritance and protection of local and traditional cultures. This empirical study has confirmed that social network analysis can be used to enable the detection of both networking patterns and evolution processes. This study is novel in the analysis of cultural trade from a network perspective, and in the development of such point-line-polygon models to represent the evolution of cultural trade networks. Furthermore, this study adds value by addressing the socio-cultural sustainability contribution and challenges from cultural trade within “the Belt and Road” region, thus, addressing cultural sustainability from an international level.
Challenges that could be addressed in future work include the following: Firstly, the expansion of the methodology to integrate the diversity of cultural products, competition, and complementarity into the analysis to better understand the impacts of trading on cultural diversity. By comparing cultural trade and general trade during the period 2005–2016, we find that the average growth rate of cultural trade and general trade were 13.6% and 17.2% (UN Comtrade Database), the proportion of cultural trade in general trade decreased from 18.1% to 8.1% (UN Comtrade Database), it means that although cultural trade is growing rapidly, cultural trade diverges from general trade. In the future, we may try to compare the evolution of cultural trade and general trade networks and disclose the reason for this divergence. Secondly, the effects of cultural distance and spatial (or transport) distance could be compared to reveal the spatial and cultural strategies required to develop such networks and corridors. Thirdly, this study mainly used social networks to explore the evolution of cultural trade networks in “the Belt and Road”, but the temporal shortest path, temporal betweenness, and betweenness preferences have not been considered. Some other scholars present the emergent field of temporal networks, and discuss methods for analyzing topological, temporal structure, and dynamic temporal network [64,65]. Although the temporal network method is mainly used to study the spread of infectious disease, opinions, and rumors in social networks; information packets in computer networks; various types of signaling in biology, and more [66], such studies suggest that there is great potential for this method to be applied to cultural trade networks. Therefore, in the future we may use the temporal network method to analyze the dynamics of cultural trade networks by considering temporal dependence, and it could help understand the political, social and economic processes shaping the network patterns.
Author Contributions
Q.C. wrote the whole paper and conducted the social network analysis. J.C. designed the research framework and revised the manuscript. Z.W. collected the data and jointly analyzed.
Funding
This research was funded by the Key Project of Philosophy and Social Sciences Research of the Ministry of Education of China grant number [15JZD038]. Development Program of the Ministry of Education for Changjiang Scholars and Innovative Teams: “China-ASEAN Regional Development Team” [IRT_17R27].
Acknowledgments
This study was sponsored by the overseas research project of excellent graduate students of Guangxi University. We are also grateful for the four reviewers for their constructive comments for the version of this article.
Conflicts of Interest
The authors declare no conflict of interest.
Appendix A

Table A1.
The countries along “the Belt and Road”.
| No. | ISO3 | Country | No. | ISO3 | Country |
|---|---|---|---|---|---|
| 1 | AFG | Afghanistan | 34 | LKA | Sri Lanka |
| 2 | ALB | Albania | 35 | LTU | Lithuania |
| 3 | ARE | United Arab Emirates | 36 | LVA | Latvia |
| 4 | ARM | Armenia | 37 | MDA | Moldova |
| 5 | AZE | Azerbaijan | 38 | MDV | Maldives |
| 6 | BGD | Bangladesh | 39 | MKD | Macedonia |
| 7 | BGR | Bulgaria | 40 | MMR | Myanmar |
| 8 | BHR | Bahrain | 41 | MNG | Mongolia |
| 9 | BIH | Bosnia and Herzegovina | 42 | MYS | Malaysia |
| 10 | BLR | Belarus | 43 | NPL | Nepal |
| 11 | BRN | Brunei | 44 | OMN | Oman |
| 12 | BTN | Bhutan | 45 | PAK | Pakistan |
| 13 | CHN | China | 46 | PHL | Philippines |
| 14 | CYP | Cyprus | 47 | POL | Poland |
| 15 | CZE | Czech Rep. | 48 | PSE | the State of Palestine |
| 16 | EGY | Egypt | 49 | QAT | Qatar |
| 17 | EST | Estonia | 50 | ROU | Romania |
| 18 | GEO | Georgia | 51 | RUS | Russia |
| 19 | GRC | Greece | 52 | SAU | Saudi Arabia |
| 20 | HRV | Croatia | 53 | SCG | Montenegro |
| 21 | HUN | Hungary | 54 | SGP | Singapore |
| 22 | IDN | Indonesia | 55 | SRB | Serbia |
| 23 | IND | India | 56 | SVK | Slovak |
| 24 | IRN | Iran | 57 | SVN | Slovenia |
| 25 | IRQ | Iraq | 58 | SYR | Syria |
| 26 | ISR | Israel | 59 | THA | Thailand |
| 27 | JOR | Jordan | 60 | TJK | Tajikistan |
| 28 | KAZ | Kazakhstan | 61 | TKM | Turkmenistan |
| 29 | KGZ | Kyrgyzstan | 62 | TUR | Turkey |
| 30 | KHM | Cambodia | 63 | UKR | Ukraine |
| 31 | KWT | Kuwait | 64 | UZB | Uzbekistan |
| 32 | LAO | Laos | 65 | VNM | Vietnam |
| 33 | LBN | Lebanon | 66 | YEM | Yemen Republic |
Table A2.
The top 10 countries with the highest centrality values 1990–2016.
| Year | 1 | 2 | 3 | 4 | 5 | 6 | 7 | 8 | 9 | 10 |
|---|---|---|---|---|---|---|---|---|---|---|
| 1990 | THA | IND | SGP | MYS | OMN | CYP | GRC | TUR | BGD | IDN |
| 1995 | CZE | SGP | THA | CHN | HUN | IND | TUR | MYS | CYP | EGY |
| 2000 | IND | SVK | CHN | SGP | CZE | TUR | ARE | THA | SVN | GRC |
| 2005 | IND | CHN | ARE | SGP | TUR | RUS | THA | MYS | POL | CZE |
| 2010 | CHN | IND | THA | MYS | TUR | ARE | CZE | POL | RUS | SGP |
| 2011 | CHN | IND | THA | TUR | POL | ARE | CZE | MYS | LKA | RUS |
| 2012 | CHN | IND | THA | SGP | ARE | CZE | TUR | RUS | LKA | PAK |
| 2013 | CHN | IND | ARE | POL | TUR | CZE | RUS | MYS | LKA | PAK |
| 2014 | CHN | IND | THA | ARE | CZE | SGP | LKA | TUR | POL | MYS |
| 2015 | CHN | IND | THA | SGP | POL | ARE | MYS | TUR | CZE | LKA |
| 2016 | CHN | IND | THA | ARE | POL | MYS | RUS | SGP | LKA | TUR |
Table A3.
Analysis of the centrality of the cultural trade network of “the Belt and Road” Countries in 1990.
Table A3.
Analysis of the centrality of the cultural trade network of “the Belt and Road” Countries in 1990.
| No. | Country | Degree | Closeness | Betweenness | No. | Country | Degree | Closeness | Betweenness |
|---|---|---|---|---|---|---|---|---|---|
| 1 | AFG | 3.07 | 3.62 | 0 | 34 | LKA | 27.69 | 3.66 | 0.51 |
| 2 | ALB | 1.54 | 3.60 | 0 | 35 | LTU | 0 | 0 | 0 |
| 3 | ARE | 16.9 | 3.65 | 0.03 | 36 | LVA | 0 | 0 | 0 |
| 4 | ARM | 0 | 0 | 37 | MDA | 0 | 0 | 0 | |
| 5 | AZE | 0 | 0 | 38 | MDV | 7.69 | 3.63 | 0 | |
| 6 | BGD | 29.2 | 3.66 | 0.39 | 39 | MKD | 0 | 0 | 0 |
| 7 | BGR | 10.7 | 3.64 | 0.01 | 40 | MMR | 6.15 | 3.63 | 0 |
| 8 | BHR | 15.4 | 3.64 | 0.02 | 41 | MNG | 0 | 0 | 0 |
| 9 | BIH | 0 | 0 | 0 | 42 | MYS | 44.62 | 3.68 | 1.93 |
| 10 | BLR | 0 | 0 | 0 | 43 | NPL | 4.62 | 3.63 | 0 |
| 11 | BRN | 9.23 | 3.63 | 0 | 44 | OMN | 41.54 | 3.68 | 1.27 |
| 12 | BTN | 1.53 | 3.62 | 0 | 45 | PAK | 15.39 | 3.64 | 0.03 |
| 13 | CHN | 16.92 | 3.65 | 0.03 | 46 | PHL | 12.31 | 3.64 | 0.01 |
| 14 | CYP | 41.54 | 3.68 | 1.32 | 47 | POL | 13.85 | 3.64 | 0.01 |
| 15 | CZE | 0 | 0 | 0 | 48 | PSE | 0 | 0 | 0 |
| 16 | EGY | 13.85 | 3.64 | 0 | 49 | QAT | 12.31 | 3.64 | 0.01 |
| 17 | EST | 0 | 0 | 0 | 50 | ROU | 0 | 0 | 0 |
| 18 | GEO | 0 | 0 | 0 | 51 | RUS | 0 | 0 | 0 |
| 19 | GRC | 40 | 3.68 | 2.85 | 52 | SAU | 16.92 | 3.65 | 0.03 |
| 20 | HRV | 0 | 0 | 53 | SCG | 0 | 0 | ||
| 21 | HUN | 16.92 | 3.65 | 0.03 | 54 | SGP | 52.31 | 3.69 | 3.78 |
| 22 | IDN | 29.23 | 3.66 | 0.52 | 55 | SRB | 0 | 0 | 0 |
| 23 | IND | 53.85 | 3.70 | 4.3 | 56 | SVK | 0 | 0 | 0 |
| 24 | IRN | 12.31 | 3.64 | 0 | 57 | SVN | 0 | 0 | 0 |
| 25 | IRQ | 13.85 | 3.64 | 0.02 | 58 | SYR | 12.31 | 3.64 | 0 |
| 26 | ISR | 9.23 | 3.64 | 0 | 59 | THA | 56.92 | 3.70 | 8.72 |
| 27 | JOR | 12.31 | 3.64 | 0 | 60 | TJK | 0 | 0 | 0 |
| 28 | KAZ | 0 | 0 | 0 | 61 | TKM | 0 | 0 | 0 |
| 29 | KGZ | 0 | 0 | 0 | 62 | TUR | 33.85 | 3.67 | 0.64 |
| 30 | KHM | 1.538 | 3.62 | 0 | 63 | UKR | 0 | 0 | 0 |
| 31 | KWT | 15.38 | 3.64 | 0.02 | 64 | UZB | 0 | 0 | 0 |
| 32 | LAO | 1.54 | 3.62 | 0 | 65 | VNM | 6.15 | 3.63 | 0 |
| 33 | LBN | 13.84 | 3.64 | 0 | 66 | YEM | 9.23 | 3.64 | 0 |
Table A4.
Analysis of the centrality of cultural trade network of “the Belt and Road” Countries in 2016.
Table A4.
Analysis of the centrality of cultural trade network of “the Belt and Road” Countries in 2016.
| No. | Country | Degree | Closeness | Betweenness | No. | Country | Degree | Closeness | Betweenness |
|---|---|---|---|---|---|---|---|---|---|
| 1 | AFG | 32.31 | 17.81 | 0.00 | 34 | LKA | 89.23 | 19.82 | 1.37 |
| 2 | ALB | 44.62 | 18.21 | 0.02 | 35 | LTU | 83.08 | 19.58 | 0.69 |
| 3 | ARE | 87.69 | 19.76 | 1.13 | 36 | LVA | 70.77 | 19.12 | 0.39 |
| 4 | ARM | 60.00 | 18.73 | 0.16 | 37 | MDA | 61.54 | 18.79 | 0.21 |
| 5 | AZE | 61.54 | 18.78 | 0.13 | 38 | MDV | 46.15 | 18.26 | 0.05 |
| 6 | BGD | 50.77 | 18.41 | 0.08 | 39 | MKD | 58.46 | 18.68 | 0.07 |
| 7 | BGR | 81.54 | 19.52 | 0.51 | 40 | MMR | 36.92 | 17.96 | 0.03 |
| 8 | BHR | 69.23 | 19.06 | 0.31 | 41 | MNG | 49.23 | 18.36 | 0.05 |
| 9 | BIH | 58.46 | 18.68 | 0.17 | 42 | MYS | 92.31 | 19.94 | 1.59 |
| 10 | BLR | 70.77 | 19.12 | 0.36 | 43 | NPL | 33.85 | 17.86 | 0.01 |
| 11 | BRN | 20.00 | 17.43 | 0.00 | 44 | OMN | 63.08 | 18.84 | 0.27 |
| 12 | BTN | 12.31 | 17.19 | 0.00 | 45 | PAK | 80.00 | 19.46 | 0.71 |
| 13 | CHN | 93.85 | 20.00 | 1.76 | 46 | PHL | 73.85 | 19.23 | 0.79 |
| 14 | CYP | 78.46 | 19.40 | 0.39 | 47 | POL | 93.85 | 20.00 | 1.76 |
| 15 | CZE | 89.23 | 19.82 | 1.09 | 48 | PSE | 46.15 | 18.26 | 0.02 |
| 16 | EGY | 76.92 | 19.35 | 0.39 | 49 | QAT | 70.77 | 19.12 | 0.30 |
| 17 | EST | 72.31 | 19.17 | 0.29 | 50 | ROU | 0.00 | 0.00 | 0.00 |
| 18 | GEO | 67.69 | 19.01 | 0.23 | 51 | RUS | 90.77 | 19.88 | 1.23 |
| 19 | GRC | 83.08 | 19.58 | 0.72 | 52 | SAU | 66.15 | 18.95 | 0.33 |
| 20 | HRV | 73.85 | 19.23 | 0.26 | 53 | SCG | 0.00 | 0.00 | 0.00 |
| 21 | HUN | 84.62 | 19.64 | 0.70 | 54 | SGP | 90.77 | 19.88 | 1.53 |
| 22 | IDN | 83.08 | 19.58 | 0.81 | 55 | SRB | 0.00 | 0.00 | 0.00 |
| 23 | IND | 93.85 | 20.00 | 1.76 | 56 | SVK | 78.46 | 19.40 | 0.45 |
| 24 | IRN | 60.0 | 18.73 | 0.11 | 57 | SVN | 66.15 | 18.95 | 0.17 |
| 25 | IRQ | 53.85 | 18.52 | 0.04 | 58 | SYR | 35.39 | 17.91 | 0.01 |
| 26 | ISR | 8.46 | 18.68 | 0.12 | 59 | THA | 92.31 | 19.94 | 1.59 |
| 27 | JOR | 70.77 | 19.12 | 0.35 | 60 | TJK | 24.62 | 17.57 | 0.01 |
| 28 | KAZ | 70.77 | 19.12 | 0.32 | 61 | TKM | 26.15 | 17.62 | 0.00 |
| 29 | KGZ | 56.92 | 18.63 | 0.16 | 62 | TUR | 87.69 | 19.76 | 0.96 |
| 30 | KHM | 41.54 | 18.11 | 0.08 | 63 | UKR | 63.08 | 18.84 | 0.17 |
| 31 | KWT | 72.31 | 19.17 | 0.29 | 64 | UZB | 0.00 | 0.00 | 0.00 |
| 32 | LAO | 23.08 | 17.52 | 0.00 | 65 | VNM | 70.77 | 19.12 | 0.37 |
| 33 | LBN | 78.46 | 19.40 | 0.52 | 66 | YEM | 29.23 | 17.71 | 0.01 |
Note: the names of 66 countries along “the Belt and Road” are represented with ISO3 code. Degree, Closenes and Betweenness, respectively represent the degree centrality, closeness centrality and betweenness centrality. Due to the limited space, the degree centrality of 66 countries along “the Belt and Road” in the period of 1991–2015 is not listed, and can be requested to be provided by the author.
Table A5.
Key nodes—cultural corridors along “the Belt and Road”.
| Years | Cultural Corridors | Key Nodes |
|---|---|---|
| 1900 | - - | Singapore |
| 1995 | “Thailand–Poland” | Singapore, Thailand, Poland, Czech |
| 2000 | “Singapore–China”, “Singapore–Russian”, “Russian–China” | Singapore, China, Russian, Greece |
| 2005 | “Singapore–China”, “Singapore–Russian”, “Russian–China”, “Thailand–India”, “Greece–Russian” | Singapore, China, Russian, Greece, Thailand, India |
| 2010 | “Singapore–China”, “Russian–China”, “Thailand–India”, “Greece–Russian”, “India–China”, “India–Arab” | Singapore, China, Russian, Greece, Thailand, India, United Arab Emirates |
| 2016 | “Singapore–China”, “Singapore–Russian”, “Russian–China”, “Thailand–India”, “Greece–Russian”, “India–China”, “India–Arab”, “Arab–Thailand” | Singapore, China, Russian, Greece, Thailand, India, United Arab Emirates |
References
- Akiwumi, F.A. Strangers and Sierra Leone mining: Cultural heritage and sustainable development challenges. J. Clean. Prod. 2014, 773–782. [Google Scholar] [CrossRef]
- Bilecen, B.; Gamper, M.; Lubbers, M.J. The missing link: Social network analysis in migration and transnationalism. Soc. Netw. 2018, 53, 1–3. [Google Scholar] [CrossRef]
- Winter, T. One belt, one road, one heritage: Cultural diplomacy and the Silk Road. Diplomat 2016, 29, 1–5. [Google Scholar]
- Asmelash, A.G.; Kumar, S. Assessing progress of tourism sustainability: Developing and validating sustainability indicators. Tour. Manag. 2019, 71, 67–83. [Google Scholar] [CrossRef]
- Song, Z.; Che, S.; Yang, Y. The trade network of the Belt and Road Initiative and its topological relationship to the global trade network. J. Geogr. Sci. 2018, 28, 1249–1262. [Google Scholar] [CrossRef]
- Ascensão, F.; Fahrig, L.; Clevenger, A.P. Environmental challenges for the Belt and Road Initiative. Nat. Sustain. 2018, 1, 206–209. [Google Scholar] [CrossRef]
- Baloch, M.A.; Zhang, J.; Iqbal, K. The effect of financial development on ecological footprint in BRI countries: Evidence from panel data estimation. Environ. Sci. Pollut. Res. 2019, 26, 6199–6208. [Google Scholar] [CrossRef] [PubMed]
- Zhong, W.; An, H.; Gao, X. The evolution of communities in the international oil trade network. Phys. A Stat. Mech. Its Appl. 2014, 413, 42–52. [Google Scholar] [CrossRef]
- Di, D.; An, H.; Huang, S. The transfer of embodied carbon in copper international trade: An industry chain perspective. Resour. Policy 2017, 2, 173–180. [Google Scholar]
- Szigeti, A.; Virág, V.; Viktória, K.; Attila, G. An examination of changing Copper and Bronze Age trade networks in the Körös River Valley. Southeast Hung. 2017, 4, 5–27. [Google Scholar]
- Ling, J.; Jia, X.; Chiu, A.S.F.; Xu, M. Global Electricity Trade Network: Structures and Implications. PLoS ONE 2016, 11, 1–15. [Google Scholar]
- Yue, W.; Liu, Y.J.; Ji, L.; Guo, Q.; Xu, M. Structure Analysis of Global Electricity Trade Network. Electr. Power Constr. 2016, 3, 129–136. [Google Scholar]
- Geng, J.-B.; Ji, Q.; Fan, Y. A dynamic analysis on global natural gas trade network. Appl. Energy 2014, 132, 23–33. [Google Scholar] [CrossRef]
- Aleksynska, M.; Peri, G. Isolating the Network Effect of Immigrants on Trade. IZA Discuss. Pap. 2013, 37, 434–455. [Google Scholar] [CrossRef] [Green Version]
- Yu, F.; Chen, M.; Deng, K.; Xia, X.; Yu, B.; Gao, H.; He, F.; Ma, L.; Cai, Z. Community detection in the textile-related trade network using a biased estimation of distribution algorithm. J. Ambient Intell. Humaniz. Comput. 2017, 4, 1–10. [Google Scholar] [CrossRef]
- Massimo, P.; Scotti, M. Identifying marginal supplying countries of wood products via trade network analysis. Int. J. Life Cycle Assess. 2017, 22, 1146–1158. [Google Scholar]
- Gephar, J.A.; Rovenskaya, E.; Dieckmann, U.; Pace, M.L.; Brännström, Å. Vulnerability to shocks in the global seafood trade network. Environ. Res. Lett. 2016, 1, 1–10. [Google Scholar]
- Fair Kathyrn, R.; Bauch, C.T.; Anand, M. World rare earths trade network: Patterns, relations and role characteristics. Resour. Policy 2016, 50, 119–130. [Google Scholar]
- Bui-klimke, T.R.; Guclu, H.; Kensler, T.W. Aflatoxin Regulations and Global Pistachio Trade: Insights from Social Network Analysis. Plos ONE 2014, 9, 1–11. [Google Scholar] [CrossRef] [PubMed]
- Lyon, F. Trust, networks and norms: The creation of social capital in agricultural economies in Ghana. World Dev. 2000, 28, 663–681. [Google Scholar] [CrossRef]
- Li, B.; Pan, J.B. Re-centralization: An Analyze of Global Media Product Trade Network in the Perspective of Cultural Imperialism:The Social Network Analysis Based on the Global Film Trade. Chin. J. J. Commun. 2014, 36, 77–91. [Google Scholar]
- Osorio, L.; Lobato, M.O.; Del castillo, X.A. Debates on sustainable development: towards a holistic view of reality. Environment Development Sustainability 2005, 5, 501–518. [Google Scholar] [CrossRef]
- Abdelzaher, D.; Fernandez, W.D.; Schneper, W.D. Legal rights, national culture and social networks: Exploring the uneven adoption of United Nations Global Compact. Int. Bus. Rev. 2019, 28, 12–24. [Google Scholar] [CrossRef]
- Bashi, E. Cultural heritage of Albania-a fabulous economic source for the sustainable economic development of tourism. Procedia Soc. Behav. Sci. 2015, 188, 89–94. [Google Scholar] [CrossRef]
- Hoffmann, J.P. Religiousness, Social Networks, Moral Schemas, and Marijuana Use: A Dynamic Dual-Process Model of Culture and Behavior. Soc. Forces 2014, 93, 181–208. [Google Scholar] [CrossRef]
- Tishchenko, O. Proverbs and Sayings Denoting the Objects of Material Culture and Trades in Slavonic Language. Rocz. Humanist. 2015, 63, 193–224. [Google Scholar] [CrossRef]
- Storch, R.D. Popular Culture and Custom in Nineteenth-Century England; eBook Published; Routledge: London, UK, 2016. [Google Scholar]
- Langer-Osuna, J.M.; Nasir, N.I.S. Rehumanizing the “Other” race, culture, and identity in education research. Rev. Res. Educ. 2016, 40, 723–743. [Google Scholar] [CrossRef]
- Stuart, J.; Ward, C. Exploring everyday experiences of cultural diversity: The construction, validation, and application of the normative multiculturalism scale. Eur. J. Soc. Psychol. 2019, 49, 313–332. [Google Scholar] [CrossRef]
- Swanson, K.K.; Devereaux, C. A theoretical framework for sustaining culture: Culturally sustainable entrepreneurship. Ann. Tour. Res. 2017, 62, 78–88. [Google Scholar] [CrossRef]
- Soini, K.; Birkeland, I. Exploring the scientific discourse on cultural sustainability. Geoforum 2014, 51, 213–223. [Google Scholar] [CrossRef]
- Throsby, D. Linking ecological and cultural sustainability. Int. J. Divers. Organ. Commun. Nations 2008, 8, 15–20. [Google Scholar] [CrossRef]
- Carrère, C.; Masood, M. Cultural proximity: A source of trade flow resilience? World Econ. 2018, 41, 1812–1832. [Google Scholar] [CrossRef]
- Holladay, J.S.; Mohsin, M.; Pradhan, S. Emissions leakage, environmental policy and trade frictions. J. Environ. Econ. Manag. 2018, 88, 95–113. [Google Scholar] [CrossRef]
- Parc, J. The effects of protection in cultural industries: The case of the Korean film policies. Int. J. Cult. Policy 2017, 23, 618–633. [Google Scholar] [CrossRef]
- Neira, B.A.M. Mainstreaming culture and cultural heritage into sustainable development: Challenges and opportunities. Rev. Humanid. 2018, 8, 21–33. [Google Scholar]
- Portoles, J.B.; Sesic, M.D. Cultural rights and their contribution to sustainable development: Implications for cultural policy. Int. J. Cult. Policy 2017, 23, 159–173. [Google Scholar] [CrossRef]
- Raphael, D.; Chaufan, C.; Bryant, T.; Bakhsh, M.; Bindra, J.; Puran, A.; Saliba, D. The cultural hegemony of chronic disease association discourse in Canada. Soc. Theory Health 2018, 16, 1–20. [Google Scholar]
- Chi, R.; Suthers, D. Assessing intercultural communication competence as a relational construct using social network analysis. Int. J. Intercult. Relat. 2015, 48, 108–119. [Google Scholar] [CrossRef]
- Wulf, C. Human Development in a Globalized World. Education towards Peace, Cultural Diversity and Sustainable Development. Rev. Esp. Pedagog. 2013, 71, 71–86. [Google Scholar]
- Grincheva, N. Sustainable development in cultural projects: Mistakes and challenges. Dev. Pract. 2016, 26, 236–250. [Google Scholar] [CrossRef]
- Coelho, M.; Borges, L.M. From culture circles to virtual social networks: Who are you chatting with? Rev. Edapeci-Educ. A Distancia E Prat. Educ. Commun. E Intercult. 2015, 15, 547–561. [Google Scholar]
- Lee, J. Culture, Network, and International Trade. J. Int. Logist. Trade 2015, 13, 21–31. [Google Scholar]
- Park, J. Cultural Barriers in International Trade and the Protection and Promotion of Culture. Korean Econ. Rev. 2015, 31, 267–300. [Google Scholar]
- Vozgrin, V.E. Baltic world—Society, national culture and trade from the Viking Age to the European Union; St. Petersburg university Publishing: St. Petersburg, Russia, 2014; Volume 1, pp. 188–190. [Google Scholar]
- Li, Y.; Wang, Q.; Xiao, Q. “One Belt One Road” Blue book: “One Belt and One Road” Construction Development Report; Social Sciences Documentation Press: Beijing, China, 2017. [Google Scholar]
- Adamic, L.A.; Adamic, A.E.; Adar, E. Friends and neighbors on the web. Soc. Netw. 2003, 25, 211–230. [Google Scholar] [CrossRef]
- Walther, O.J. Trade networks in West Africa: A social network approach. J. Mod. Afr. Stud. 2014, 52, 179–203. [Google Scholar] [CrossRef]
- Belloc, M.; Bowles, S. Persistence and Change in Culture and Institutions under Autarchy, Trade, and Factor Mobility. Am. Econ. J.-Microecon. 2017, 9, 245–276. [Google Scholar] [CrossRef]
- Lorcin, P.M.E. The Southern Shores of the Mediterranean and its Networks: Knowledge, Trade, Culture and People Introduction. J. N. Afr. Stud. 2015, 20, 1–4. [Google Scholar] [CrossRef]
- Ikeda, Y.; Iyetomi, H. Trade network reconstruction and simulation with changes in trade policy. Evol. Inst. Econ. Rev. 2018, 15, 495–513. [Google Scholar] [CrossRef]
- Lovrić, M.; da Re, R.; Vidale, E.; Pettenella, D.; Mavsar, R. Submission of an original research paper: Social network analysis as a tool for the analysis of international trade of wood and non-wood forest products. For. Policy Econ. 2018, 86, 45–66. [Google Scholar] [CrossRef]
- Zheng, J.; Zhang, Y.Q.; Huang, X. Evolution of structural features of the maritime silk road trade network from 2000 to 2014. Int. Trade Issues 2017, 3, 154–165. [Google Scholar]
- Zandvliet, K. Commercial Visions: Science, Trade, and Visual Culture in the Dutch Golden Age. J. Hist. Geogr. 2016, 53, 112–113. [Google Scholar] [CrossRef]
- Pongwiritton, R.; Pakvipas, P. Sustainable Cultural Tourism Development for Hill Tribe Community. Adv. Sci. Lett. 2017, 23, 300–303. [Google Scholar] [CrossRef]
- Cloete, A.L. Film as medium for meaning making: A practical theological reflection. HTS Theol. Stud. 2017, 73, 1–6. [Google Scholar] [CrossRef]
- Magis, K.; Shinn, C. Emergent principles of social sustainability. Underst. Soc. Dimens. Sustain. 2009, 22, 15–44. [Google Scholar]
- Marie-Cécile, D. Complex systems approach for international agricultural trade network. Nat. Glob. Resour. Use 2017, 6, 28–45. [Google Scholar]
- Tiziano, D.; Laio, F.; Luca, R.; Schiavo, S. Shock transmission in the International Food Trade Network. Data-Driven Anal. Seeds Work. Pap. 2017, 6, 1–30. [Google Scholar]
- Pappalardo, G.; Allegra, V.; Chinnici, G. The International Trade of Shelled Fruit: A Longitudinal Analysis Through Social Network Approach. In Proceedings of the Political Sciences, Law, Finance, Economics and Tourism Conference Proceeding, Albena, Bulgaria, 2–5 October 2016. [Google Scholar]
- Liu, A.; Lu, C.; Wang, Z. The roles of cultural and institutional distance in international trade: Evidence from China’s trade with the Belt and Road countries. China Econ. Rev. 2018, in press. [Google Scholar] [CrossRef]
- Miller, V. New Media, Networking and Phatic Culture. Convergence 2008, 14, 387–400. [Google Scholar] [CrossRef] [Green Version]
- Cheng, Y. Public Opinions on the Belt and Road Initiative Belt and Road Initiative: A Cross-Cultural Study. In The Belt & Road Initiative in the Global Arena; Springer: Berlin/Heidelberg, Germany, 2018. [Google Scholar]
- Holme, P.; Saramäki, J. Temporal networks. Phys. Rep. 2012, 519, 97–125. [Google Scholar] [CrossRef] [Green Version]
- Pfitzner, R.; Scholtes, I.; Garas, A.; Tessone, C.J.; Schweitzer, F. Betweenness preference: Quantifying correlations in the topological dynamics of temporal networks. Phys. Rev. Lett. 2013, 110, 198701. [Google Scholar] [CrossRef] [PubMed]
- Holme, P. Modern temporal network theory: A colloquium. Eur. Phys. J. B 2015, 88, 234. [Google Scholar] [CrossRef]
Figure 1.
Spatial distribution of countries along “the Belt and Road”.

Figure 2.
Node out-degree and in-degree along “the Belt and Road” in 1990 and 2016.

Figure 3.
Temporal patterns (1990–2016) of the node out-degree and in-degree strength for the 66 countries.
Figure 3.
Temporal patterns (1990–2016) of the node out-degree and in-degree strength for the 66 countries.

Figure 4.
The cultural trade node strength along “the Belt and Road” in 1990 (upper) and 2016 (lower).
Figure 4.
The cultural trade node strength along “the Belt and Road” in 1990 (upper) and 2016 (lower).


Figure 5.
The avalanche scale R of cultural trade.

Figure 6.
The top 10 countries with the highest degree of centrality values 1990, 2000, 2010, 2016. Note: The degree of centrality of 66 countries along “the Belt and Road” in 1990 and 2016 are shown in Table A2.
Figure 6.
The top 10 countries with the highest degree of centrality values 1990, 2000, 2010, 2016. Note: The degree of centrality of 66 countries along “the Belt and Road” in 1990 and 2016 are shown in Table A2.

Figure 7.
Evolution of the mutual dependence between China and the other Belt and Road countries.

Figure 8.
The cohesive subgroups on the cultural trade networks of 1990 and 2016.


Figure 9.
The evolution of the cultural trade network (1990–2016).

Figure 10.
Patterns of evolving cultural corridors within the region.

Table 1.
The definition of relation matrix (66 × 66 countries) for social network analysis.
| AFG | ALB | ARE | ARM | AZE | BGD | BGR | … | YEM | ||
|---|---|---|---|---|---|---|---|---|---|---|
| AFG | … |  | ||||||||
| ALB | … | |||||||||
| ARE | … | |||||||||
| ARM | … | |||||||||
| AZE | … | |||||||||
| BGD | … | |||||||||
| BGR | … | |||||||||
| … | … | … | … | … | … | … | … | … | ||
| YEM | … | |||||||||
 | ||||||||||
Table 2.
Social network analysis (SNA) metrics for trade flow network.
| Classification | Metrics |
|---|---|
| Overall Network Characteristics | Node Degree |
| Node Strength | |
| Flow Strength | |
| Avalanche Scale | |
| Individual Network Characteristics | Degree Centrality |
| Closeness Centrality | |
| Betweenness Centrality | |
| Hubness Measurement | |
| Cohesive Subgroups |
Table 3.
Evolution of index of China to the other major countries.
| Country | 1992 | 1996 | 2000 | 2005 | 2010 | 2012 | 2014 | 2015 | 2016 | Average | |
|---|---|---|---|---|---|---|---|---|---|---|---|
| 1 | SGP | 0.184 | 0.051 | 0.198 | 0.183 | 0.099 | 0.159 | 0.253 | 0.178 | 0.223 | 0.133 |
| 2 | RUS | 0.079 | 0.241 | 0.202 | 0.029 | 0.133 | 0.084 | 0.050 | 0.043 | 0.048 | 0.111 |
| 3 | IND | 0.039 | 0.003 | 0.017 | 0.179 | 0.102 | 0.065 | 0.039 | 0.057 | 0.068 | 0.070 |
| 4 | THA | 0.028 | 0.006 | 0.044 | 0.063 | 0.058 | 0.057 | 0.129 | 0.040 | 0.046 | 0.051 |
| 5 | IRN | 0.043 | 0.029 | 0.000 | 0.011 | 0.018 | 0.016 | 0.032 | 0.020 | 0.022 | 0.049 |
| 6 | IDN | 0.031 | 0.006 | 0.025 | 0.055 | 0.037 | 0.057 | 0.038 | 0.045 | 0.045 | 0.036 |
| 7 | VNM | 0.00 | 0.001 | 0.010 | 0.025 | 0.045 | 0.039 | 0.038 | 0.051 | 0.075 | 0.025 |
| 8 | PAK | 0.013 | 0.010 | 0.010 | 0.019 | 0.023 | 0.015 | 0.013 | 0.016 | 0.021 | 0.02 |
| 9 | PHL | 0.008 | 0.005 | 0.029 | 0.040 | 0.028 | 0.024 | 0.017 | 0.025 | 0.029 | 0.022 |
| 10 | ARE | 0.022 | 0.006 | 0.009 | 0.023 | 0.016 | 0.014 | 0.016 | 0.022 | 0.019 | 0.018 |
| SUM | 0.450 | 0.358 | 0.544 | 0.627 | 0.559 | 0.530 | 0.625 | 0.497 | 0.596 | - |
Notes: measures the degree of mutual dependence between countries and on the cultural trade network, and i represents china, j the countries along “the Belt and Road”.
© 2019 by the authors. Licensee MDPI, Basel, Switzerland. This article is an open access article distributed under the terms and conditions of the Creative Commons Attribution (CC BY) license (http://creativecommons.org/licenses/by/4.0/).
Share and Cite
MDPI and ACS Style
Chen, Q.; Cheng, J.; Wu, Z. Evolution of the Cultural Trade Network in “the Belt and Road” Region: Implication for Global Cultural Sustainability. Sustainability 2019, 11, 2744. https://0-doi-org.brum.beds.ac.uk/10.3390/su11102744
AMA Style
Chen Q, Cheng J, Wu Z. Evolution of the Cultural Trade Network in “the Belt and Road” Region: Implication for Global Cultural Sustainability. Sustainability. 2019; 11(10):2744. https://0-doi-org.brum.beds.ac.uk/10.3390/su11102744
Chicago/Turabian StyleChen, Qiao, Jianquan Cheng, and Zhiqin Wu. 2019. "Evolution of the Cultural Trade Network in “the Belt and Road” Region: Implication for Global Cultural Sustainability" Sustainability 11, no. 10: 2744. https://0-doi-org.brum.beds.ac.uk/10.3390/su11102744
Note that from the first issue of 2016, this journal uses article numbers instead of page numbers. See further details here.