Industrial Policy and Innovation Capability of Strategic Emerging Industries: Empirical Evidence from Chinese New Energy Vehicle Industry


Abstract
:1. Introduction
2. Literature Review
3. Conceptual Framework
4. Industrial Policies of China’s New Energy Vehicle Industry
4.1. The Development and Expansion Stages
4.2. Key Policies on New Energy Vehicle Industry
5. Empirical Analysis
5.1. Model Setup
- (1)
- Difference-in-Differences Model
- (2)
- Propensity Score Matching
- (3)
- Difference-in-Differences Propensity Score Matching Model
5.2. Data Sources and Variables Description
5.3. Results
- (1)
- Difference-in-Differences Results Analysis
- (2)
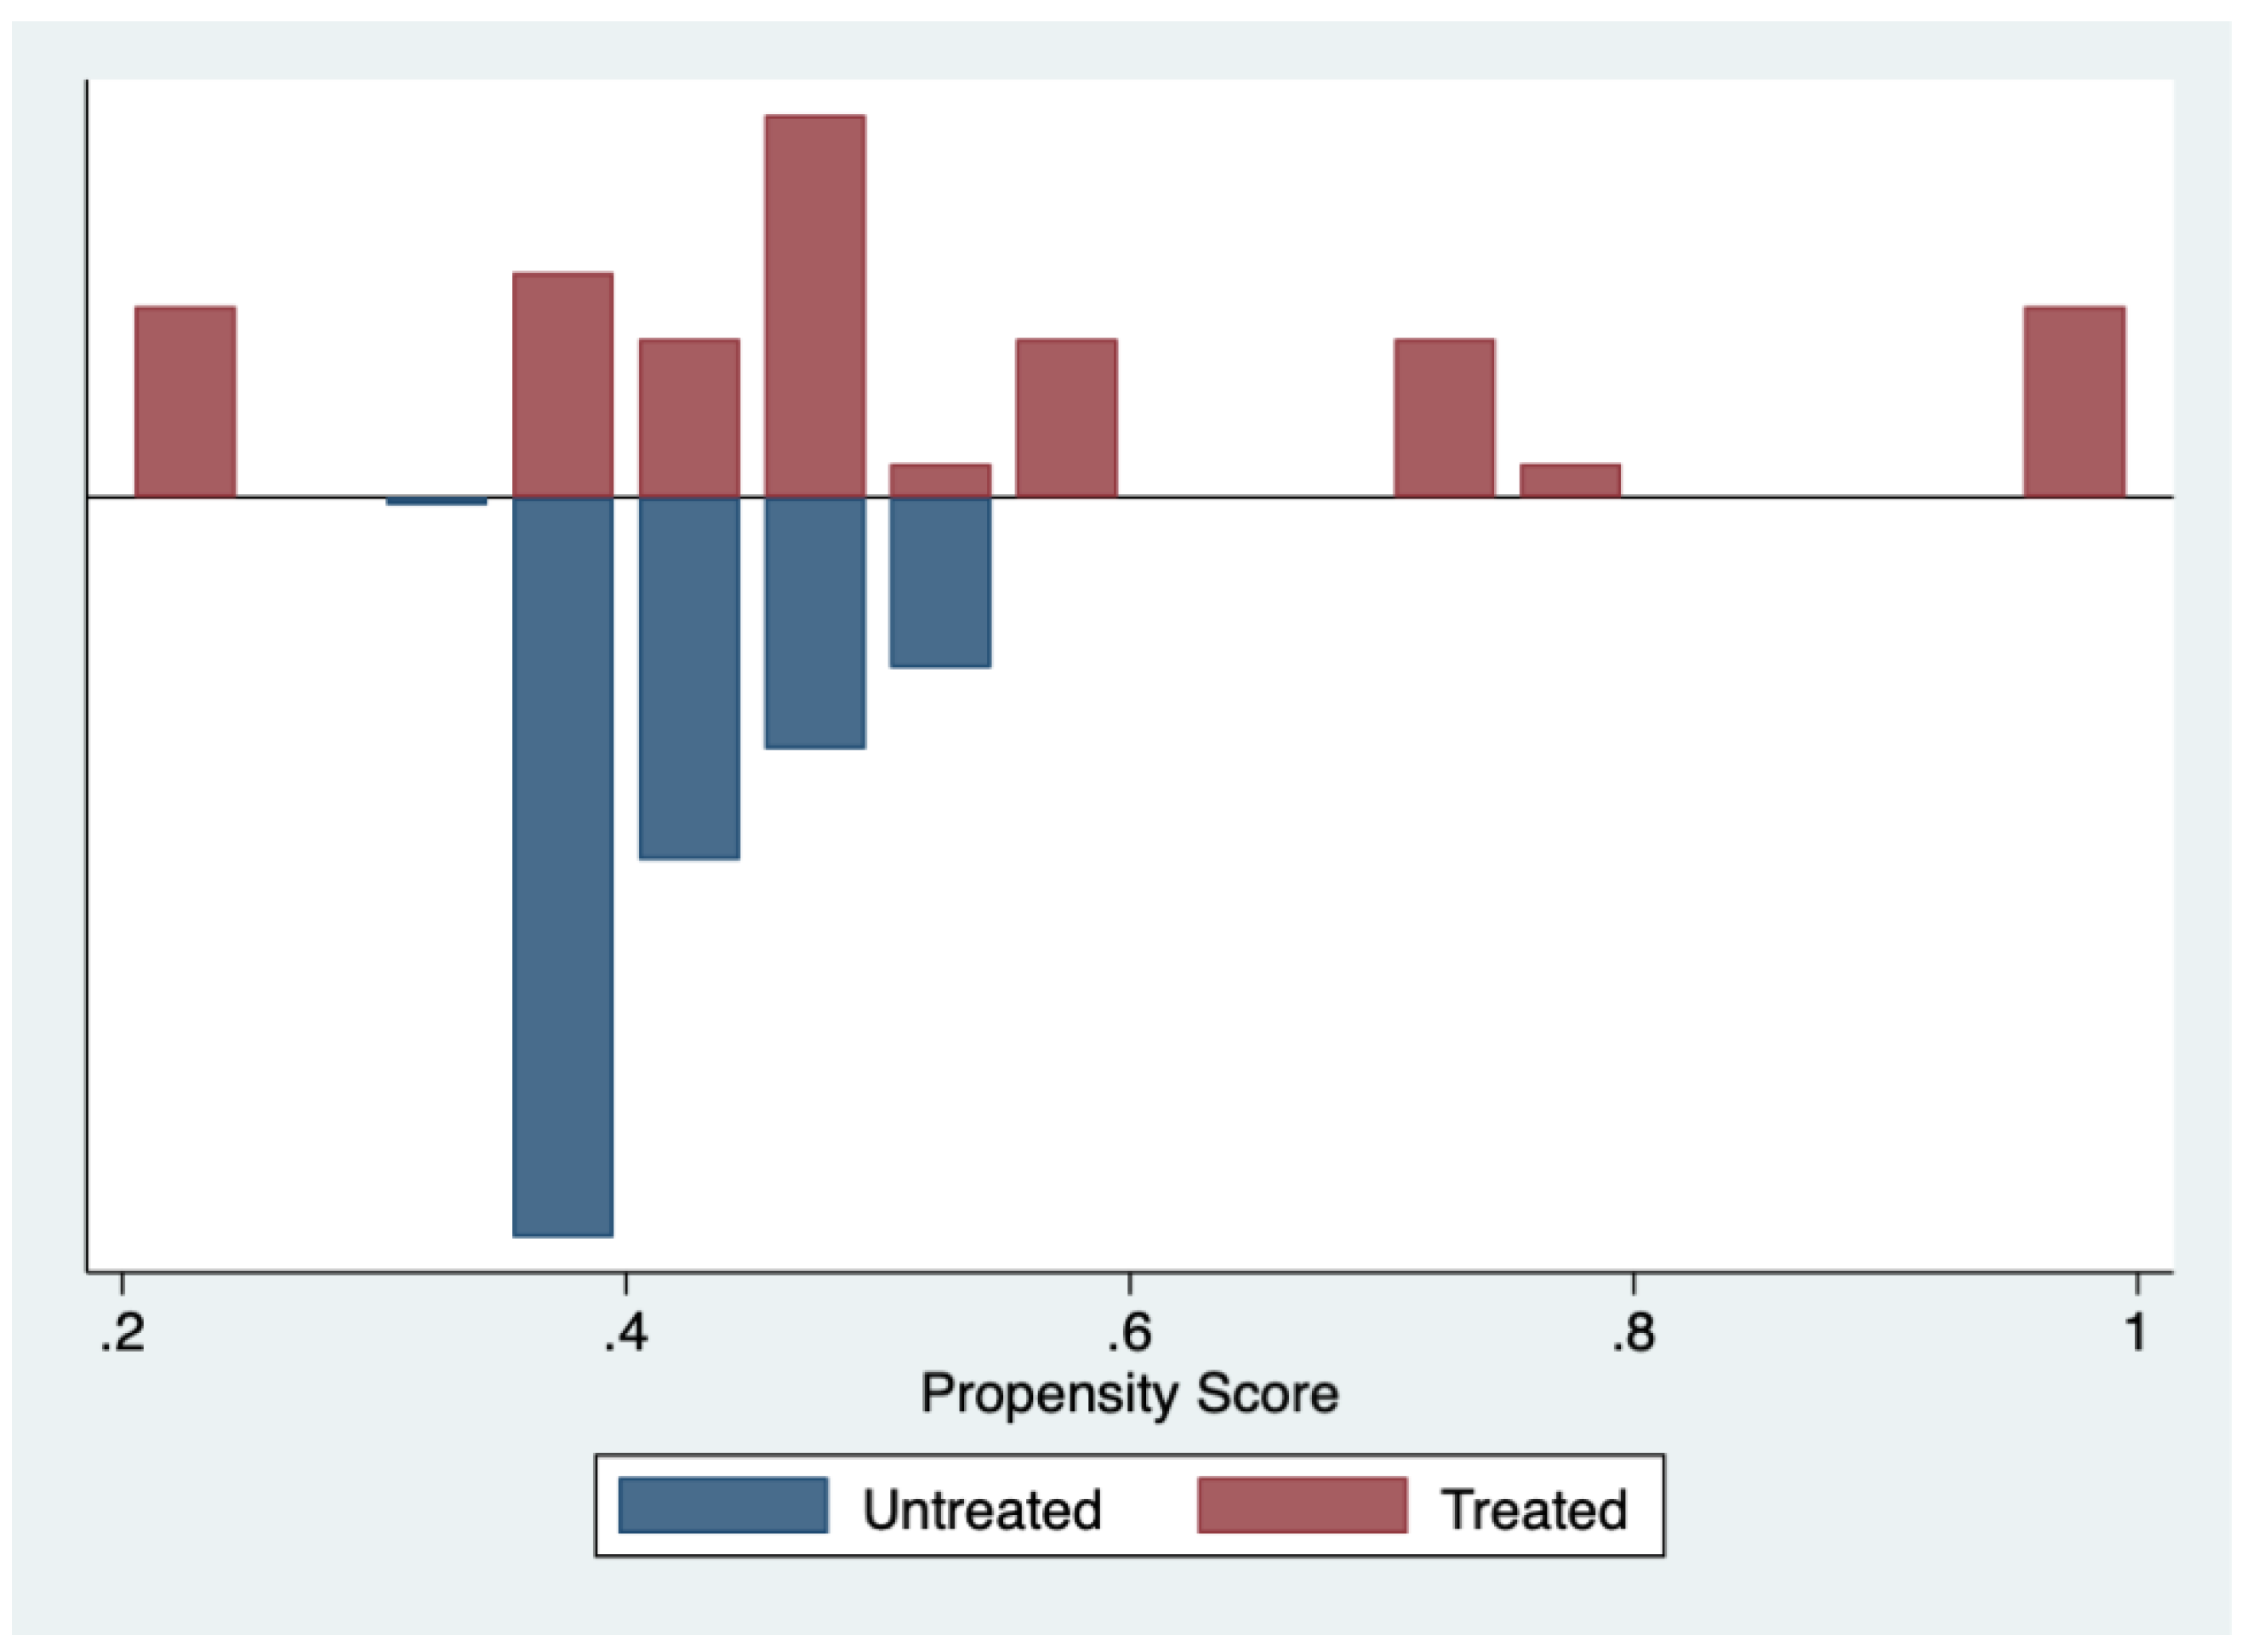
- Propensity Score Matching Results Analysis
- (3)
- Difference-in-Differences Propensity Score Matching Results Analysis
6. Conclusions
Author Contributions
Funding
Conflicts of Interest
References
- Rodrik, D. Industrial policy: Don’t ask why, ask how. Middle East Dev. J. 2009, 1, 1–29. [Google Scholar] [CrossRef]
- Fan, P.; Watanabe, C. Promoting industrial development through technology policy: Lessons from Japan and China. Technol. Soc. 2006, 28, 303–320. [Google Scholar] [CrossRef]
- Audretsch, D.B.; Thurik, A.R. Capitalism and democracy in the 21st century: From the managed to the entrepreneurial economy. J. Evol. Econ. 2000, 10, 17–34. [Google Scholar] [CrossRef]
- Pack, H.; Saggi, K. Is there a case for industrial policy? A critical survey. World Bank Res. Obs. 2006, 21, 267–297. [Google Scholar] [CrossRef]
- Lall, S. Comparing national competitive performance: An economic analysis of world economic forum’s competitiveness index. QEH Work. Pap. 2011, 7, 61–102. [Google Scholar]
- Beason, R.; Weistein, D.E. Growth, economies of sale and targeting in Japan. Rev. Econ. Stat. 1996, 78, 286–295. [Google Scholar] [CrossRef]
- Lee, J.W. Government interventions and productivity growth in Korean manufacturing industries. J. Bus. Ethics 1996, 27, 363–375. [Google Scholar]
- Powell, B. State development planning: Did it create an East Asian miracle? Rev. Austrian Econ. 2005, 18, 305–323. [Google Scholar] [CrossRef]
- Johnson, C. MITI and the Japanese Miracle: The Growth of Industrial Policy, 1925–1975; Stanford University Press: Redwood, CA, USA, 1982; pp. 83–91. [Google Scholar]
- Mathews, J.A.; Cho, D.S. Combinative capabilities and organizational learning in latecomer firms: The case of the Korean semiconductor industry. J. World Bus. 1999, 34, 139–156. [Google Scholar] [CrossRef]
- Edler, J.; Fagerberg, J. Innovation policy: What, why, and how. Oxf. Rev. Econ. Policy 2017, 33, 2–23. [Google Scholar] [CrossRef]
- Aghion, P.; Cai, J.; Dewatripont, M.; Du, L.; Harrison, A.; Legros, P. Industrial policy and competition. Am. Econ. J. Macroecon. 2015, 7, 1–32. [Google Scholar] [CrossRef]
- Lin, J.; Chang, H.J. Should Industrial Policy in developing countries conform to comparative advantage or defy it? A debate between Justin Lin and Ha-Joon Chang. Dev. Policy Rev. 2009, 27, 483–502. [Google Scholar] [CrossRef]
- Lin, J.Y. New Structural Economics: A Framework for Rethinking Development and Policy; The World Bank: Washington, DC, USA, 2012; pp. 113–119. [Google Scholar]
- Robinson, J.A. Industry Policy and Development: A Political Economy Perspective; The World Bank: Washington, DC, USA, 2009. [Google Scholar]
- Zhu, Y.; Wang, Z.; Qiu, S.; Zhu, L. Effects of environmental regulations on technological innovation efficiency in China’s industrial enterprises: A spatial analysis. Sustainability 2019, 11, 2186. [Google Scholar] [CrossRef]
- Jang, S.; Kim, J.; Von Zedtwitz, M. The importance of spatial agglomeration in product innovation: A microgeography perspective. J. Bus. Res. 2017, 78, 143–154. [Google Scholar] [CrossRef]
- Clausen, T.H. Do subsidies have positive impacts on R&D and innovation activities at the firm level? Struct. Chang. Econ. Dyn. 2009, 20, 239–253. [Google Scholar]
- Metcalf, G.E. Investment in energy infrastructure and the tax code. Tax Policy Econ. 2010, 24, 1–34. [Google Scholar] [CrossRef]
- Joskow, P.L. Comparing the costs of intermittent and dispatchable electricity generating technologies. Am. Econ. Rev. 2011, 101, 238–241. [Google Scholar] [CrossRef]
- Murray, B.C.; Cropper, M.L.; de la Chesnaye, F.C.; Reilly, J.M. How effective are US renewable energy subsidies in cutting greenhouse cases? Am. Econ. Rev. 2014, 104, 569–574. [Google Scholar] [CrossRef]
- Reiche, D.; Bechberger, M. Policy differences in the promotion of renewable energies in the EU member states. Energy Policy 2004, 32, 843–849. [Google Scholar] [CrossRef]
- Kerr, S. Winds of change: The planning response to renewable energy in Scotland. Town Plan. Rev. 2006, 77, 375–401. [Google Scholar] [CrossRef]
- Fischlein, M.; Smith, T.M. Revisiting renewable portfolio standard effectiveness: Policy design and outcome specification matter. Policy Sci. 2013, 46, 277–310. [Google Scholar] [CrossRef]
- Branstetter, L.; Sakakibara, M. Japanese research consortia: A microeconometric analysis of industrial policy. J. Ind. Econ. 1998, 46, 207–233. [Google Scholar] [CrossRef]
- Derashid, C.; Zhang, H. Effective tax rates and the “industrial policy” hypothesis: Evidence from Malaysia. J. Int. Account. Audit. Tax. 2003, 12, 45–62. [Google Scholar] [CrossRef]
- Figueiredo, P.N. Industrial policy changes and firm-level technological capability development: Evidence from Northern Brazil. World Dev. 2008, 36, 55–88. [Google Scholar] [CrossRef]
- Criscuolo, C.; Martin, R.; Overman, H.; Van Reenen, J. Some Causal Effects of an Industrial Policy. Am. Econ. Rev. 2019, 109, 48–85. [Google Scholar] [CrossRef]
- Falck, O.; Heblich, S.; Kipar, S. The Extension of Clusters: Differences-in-Differences Evidence from the Bavarian State-Wide Cluster Policy; Cesifo Group Munich: Munich, Germany, 2008. [Google Scholar]
- Copeland, A.; Kahn, J. The production impact of “Cash-for-Clunkers”: Implications for stabilization policy. Econ. Inq. 2013, 51, 288–303. [Google Scholar] [CrossRef]
- Arima, E.Y.; Barreto, P.; Araújo, E.; Soares-Filho, B. Public policies can reduce tropical deforestation: Lessons and challenges from Brazil. Land Use Policy 2014, 41, 465–473. [Google Scholar] [CrossRef]
- Montmartin, B.; Herrera, M. Internal and external effects of R&D subsidies and fiscal incentives: Empirical evidence using spatial dynamic panel models. Res. Policy 2015, 44, 1065–1079. [Google Scholar]
- Romer, P.M. Endogenous technological change. J. Polit. Econ. 1990, 98, 71–102. [Google Scholar] [CrossRef]
- Mansfield, E. How economists see R&D. Res. Manag. 1982, 25, 23–29. [Google Scholar]
- Zhou, L. Governing China’s local officials: An analysis of promotion tournament model. Econ. Res. J. 2007, 7, 36–50. (In Chinese) [Google Scholar]
- Heckman, J.J.; Ichimura, H.; Todd, P.E. Matching as an econometric evaluation estimator: Evidence from evaluating a job training programme. Rev. Econ. Stud. 1997, 64, 605–654. [Google Scholar] [CrossRef]
- Rubin, D.B. Estimating causal effects of treatments in randomized and nonrandomized studies. J. Educ. Psychol. 1974, 66, 688. [Google Scholar] [CrossRef]
- Rosenbaum, P.R.; Rubin, D.B. The central role of the propensity score in observational studies for causal effects. Biometrika 1983, 70, 41–55. [Google Scholar] [CrossRef] [Green Version]
- Mortensen, P.S.; Bloch, C.W. Oslo Manual-Guidelines for Collecting and Interpreting Innovation Data: Proposed Guidelines for Collecting and Interpreting Innovation Data; Organisation for Economic Cooporation and Development: Paris, France, 2005. [Google Scholar]


| Serial No. | Policy Name | Release Time | Issue Department |
|---|---|---|---|
| 1 | Notice on launching pilot projects For demonstration and popularization of energy-saving and new energy vehicles | 23 Jan 2009 | Ministry of Treasury and Ministry of Science and Technology |
| 2 | Notice on launching pilot projects for private purchases of new energy vehicles | 31 May 2010 | Ministry of Treasury, Ministry of Science and Technology, Ministry of Industry and Information, National Development and Reform Commission |
| 3 | Decision on accelerating the cultivation and development of strategic emerging industries | 10 Oct 2010 | The State Council |
| 4 | Development plan on energy-saving and new energy vehicle industry | 28 Jun 2012 | The State Council |
| 5 | Notice on the continuing popularization and application of new energy vehicles | 10 Sep 2013 | Ministry of Science and Technology, Ministry of Industry and Information, National Development and Reform Commission |
| 6 | Notice on exemption of purchase tax on new energy vehicle | 1 Aug 2014 | Ministry of Treasury, Administration of Taxation, Ministry of Industry and Information |
| 7 | Notice on the award about construction of new energy vehicle charging facilities | 8 Nov 2014 | Ministry of Science and Technology, Ministry of Industry and Information, National Development and Reform Commission |
| 8 | Made in China 2025 | 8 May 2015 | The State Council |
| 9 | Notice on strengthening the planning and construction of charging facilities for electric vehicles in cities | 15 Jan 2016 | Ministry of Housing and Urban-Rural Construction |
| Variable | Obs | Mean | Standard Deviation | Min | Max | ||||
|---|---|---|---|---|---|---|---|---|---|
| Treated | Control | Treated | Control | Treated | Control | Treated | Control | ||
| Lnpatent | 391 | 2.7287 | 4.78544 | 1.42149 | 1.480021 | 0 | 0 | 5.69 | 7.834 |
| Growth | 391 | 99 | 16.39 | 131.960 | 13.71849 | -45 | 2.45 | 343 | 45.46 |
| GDP | 391 | 19100.77 | 19100.77 | 13952.9 | 13952.92 | 2338.98 | 2338.98 | 72812.6 | 72812.6 |
| Population | 391 | 5233.221 | 5233.221 | 2506.77 | 2506.774 | 1075 | 1075 | 10724 | 10724 |
| (1) | (2) | (3) | (4) | (5) | |
|---|---|---|---|---|---|
| OLS | ML | Nonpara | DID | PSM | |
| NevYear | - | - | - | 0.644793 *** | - |
| - | - | - | (4.51) | - | |
| Nev | −2.066665 *** | −1.304 *** | 1.392 *** | −2.424591 *** | - |
| (−19.81) | (−5.83) | (4.15) | (−18.76) | - | |
| Growth | 0.000876 *** | 0.00124 * | −0.0028 *** | 0.000106 | 0.0091568 *** |
| (1.909) | (1.83) | (4.43) | (0.16) | (4.97) | |
| GDP | 0.000109 *** | −0.000092 *** | 0.000060 *** | 0.000095 *** | −1.78 × 10⁻⁶ |
| (18.45) | (16.30) | (3.43) | (17.10) | (−0.25) | |
| Population | −0.000248 *** | −0.000218 *** | −0.724 *** | −0.000229 *** | 5.27 × 10⁻⁶ |
| (−11.23) | (−7.93) | (−0.031) | (−10.49) | (0.15) | |
| Constant | 4.146 *** | 3.375 *** | - | 3.289 *** | −0.363442 ** |
| (35.24) | (14.38) | - | (35.29) | (−2.28) | |
| N | 391 | 391 | 391 | 391 | 391 |
| Change in innovation capability | |||||||
|---|---|---|---|---|---|---|---|
| Lnpatent | Treated | Control | DIFF | DIFF-IN-DIFF | |||
| Base Line (1) | Follow Up (2) | Base Line (3) | Follow Up (4) | (5) = (1) − (3) | (6) = (4) − (2) | (7) = (6) − (5) | |
| Mean | 1.691 | 2.401 | 3.821 | 4.440 | −2.130 *** | −2.038 * | 0.092 |
| N | 92 | 115 | 69 | 115 | 161 | 230 | 391 |
| K-nearest neighbor matching (k = 5) | Radius matching (ε = 0.05) | Kernel matching (epan kernel; bw = 0.06) | Spline matching | |
|---|---|---|---|---|
| Growth | 0.0091568 *** (4.97) | 0.0091568 *** (4.97) | 0.0091568 *** (4.97) | 0.0091568 *** (4.97) |
| GDP | −1.78 × 10⁻⁶ (−0.25) | −1.78 × 10⁻⁶ (−0.25) | −1.78 × 10⁻⁶ (−0.25) | −1.78 × 10⁻⁶ (−0.25) |
| Population | 5.27 × 10⁻⁶ (0.15) | 5.27 × 10⁻⁶ (0.15) | 5.27 × 10⁻⁶ (0.15) | 5.27 × 10⁻⁶ (0.15) |
| Constant | −0.3634429 ** (−2.28) | −0.3634429 ** (−2.28) | −0.3634429 ** (−2.28) | −0.3634429 ** (−2.28) |
| N | 391 | 391 | 391 | 391 |
| LR chi2 | 53.62 | 53.62 | 53.62 | 53.62 |
| Pseudo R2 | 0.0992 | 0.0992 | 0.0992 | 0.0992 |
| Mean | t-test | ||||
|---|---|---|---|---|---|
| Variable | Treated | Control | Bias | t | Pr(T>|t|) |
| growth | 68.5 | 29.139 | 52.2 | 4.99 | 0.000 *** |
| GDP | 19083 | 19685 | −4.6 | −0.40 | 0.689 |
| population | 5252.2 | 6468.2 | −48.4 | −4.80 | 0.000 *** |
| Change in innovation capability | |||||||
|---|---|---|---|---|---|---|---|
| Lnpatent | Treated | Control | DIFF | DIFF-IN-DIFF | |||
| Base Line (1) | Follow Up (2) | Base Line (3) | Follow Up (4) | (5) = (3) − (1) | (6) = (4) − (2) | (7) = (6) − (5) | |
| Mean | 1.681 | 3.429 | 3.885 | 5.411 | −2.204 *** | -1.982 *** | 0.223 |
| N | 89 | 138 | 89 | 132 | 178 | 270 | 448 |
© 2019 by the authors. Licensee MDPI, Basel, Switzerland. This article is an open access article distributed under the terms and conditions of the Creative Commons Attribution (CC BY) license (http://creativecommons.org/licenses/by/4.0/).
Share and Cite
Zhao, Q.; Li, Z.; Zhao, Z.; Ma, J. Industrial Policy and Innovation Capability of Strategic Emerging Industries: Empirical Evidence from Chinese New Energy Vehicle Industry. Sustainability 2019, 11, 2785. https://0-doi-org.brum.beds.ac.uk/10.3390/su11102785
Zhao Q, Li Z, Zhao Z, Ma J. Industrial Policy and Innovation Capability of Strategic Emerging Industries: Empirical Evidence from Chinese New Energy Vehicle Industry. Sustainability. 2019; 11(10):2785. https://0-doi-org.brum.beds.ac.uk/10.3390/su11102785
Chicago/Turabian StyleZhao, Qiuyun, Zeyu Li, Zuoxiang Zhao, and Jinqiu Ma. 2019. "Industrial Policy and Innovation Capability of Strategic Emerging Industries: Empirical Evidence from Chinese New Energy Vehicle Industry" Sustainability 11, no. 10: 2785. https://0-doi-org.brum.beds.ac.uk/10.3390/su11102785