Article

Exploring Drivers of Livelihood Diversification and Its Effect on Adoption of Sustainable Land Management Practices in the Upper Blue Nile Basin, Ethiopia

1
The United Graduate School of Agricultural Sciences, Tottori University, 4-101 Koyama-Minami, Tottori 680-8553, Japan
2
Institute of Disaster Risk Management and Food Security Studies, Bahir Dar University, P.O. Box 79, Bahir Dar 6000, Ethiopia
3
Arid Land Research Center, Tottori University, 1390 Hamasaka, Tottori 680-0001, Japan
4
College of Agriculture and Environmental Sciences, Bahir Dar University, P.O. Box 79, Bahir Dar 6000, Ethiopia
5
International Platform for Dryland Research and Education, Tottori University, 1390 Hamasaka, Tottori 680-0001, Japan
6
Faculty of Agriculture, Tottori University, 4-101 Koyama-Minami, Tottori 680-8550, Japan
7
College of Agriculture, Woldia University, P.O. Box 400, Woldia 7220, Ethiopia
8
College of Business and Economics, Bahir Dar University, P.O. Box 79, Bahir Dar 6000, Ethiopia
*
Author to whom correspondence should be addressed.
Sustainability 2019, 11(10), 2991; https://0-doi-org.brum.beds.ac.uk/10.3390/su11102991
Submission received: 25 April 2019 / Revised: 13 May 2019 / Accepted: 16 May 2019 / Published: 27 May 2019
(This article belongs to the Special Issue Soil Erosion and Sustainable Land Management (SLM))

Abstract

:
Land degradation poses a major threat to agricultural production and food security in Ethiopia, and sustainable land management (SLM) is key in dealing with its adverse impacts. This paper examines the covariates that shape rural livelihood diversification and examines their effects on the intensity of adoption of SLM practices. Household-level data were collected in 2017 from 270 households in three drought-prone watersheds located in northwestern Ethiopia. We used the Herfindahl–Simpson diversity index to explore the extent of livelihood diversification. A stochastic dominance ordering was also employed to identify remunerative livelihood activities. A multivariate probit model was employed to estimate the probability of choosing simultaneous livelihood strategies, and an ordered probit model was estimated to examine the effect of livelihood diversification on the adoption intensity of SLM practices. In addition to mixed cropping and livestock production, the production of emerging cash crops (e.g., Acacia decurrens for charcoal, and khat) dominated the overall income generation of the majority of farmers. Stress/shock experience, extent of agricultural intensification, and agro-ecology significantly affected the probability of choosing certain livelihood strategies. Livelihood diversification at the household level was significantly associated with the dependency ratio, market distance, credit access, extension services, membership in community organizations, level of income, and livestock ownership. A greater extent of livelihood diversification had a significant negative effect on adopting a greater number of SLM practices, whereas it had a positive effect on lower SLM adoption intensity. Overall, we found evidence that having greater livelihood diversification could prompt households not to adopt more SLM practices. Livelihood initiatives that focus on increasing shock resilience, access to financial support mechanisms, improving livestock production, and providing quality extension services, while also considering agro-ecological differences, are needed. In addition, development planners should take into account the livelihood portfolios of rural households when trying to implement SLM policies and programs.

1. Introduction

Globally, agriculture accounts for 67% of employment, 39.4% of national gross domestic product, and 43% of export goods [1]. This sector can continue to be a major source of the world’s food and fiber if ecosystem balance is maintained. The world’s population continues to grow and is forecast to reach 9.7 billion by 2050 [2]; the demand for food and livelihood security is therefore a pressing concern of development planners and researchers. This is especially true in Sub-Saharan African countries, where more than three-fourths of the population is essentially dependent on rain-fed agriculture and land degradation is the principal cause of the reduction in production and productivity [3].
In rural areas of developing countries, households combine diverse portfolios of activities in their pursuit of alleviating poverty and improving living standards [4,5]. As defined by Ellis [6], livelihood diversification refers to the process by which households pool a wide range of activities and social support systems to deal with shocks and improve their welfare. It is recognized as a way to confront the various idiosyncratic risks and shocks that people face [4]. For most smallholder farmers in developing countries, diversification away from agriculture accounts for 30–40% of their overall incomes [4,6]. A more specific study carried out in Ghana pointed out that livelihood diversification by smallholder farmers prioritize less viable livelihoods attributable to their current food demand, availability of livelihood alternatives and level of entry barriers [7]. Diversifying livelihood activities may affect the environment and the natural resource base [8,9,10]. The use of natural resource-based livelihood sources to increase income and reduce poverty has a two-way cause–effect association with environmental depletion [10,11,12,13,14]. Rural households’ engagement in livelihood activities that increase income, and thus reduce poverty, could have varied effects on the environment [15]. A positive effect could be through the decision to allocate labor away from livelihood activities that exploit natural resources to other, less exploitative, livelihood options. Rural households’ engagement in these latter activities may induce less environmental degradation [5,15]. On the other hand, although such livelihood diversification could increase the income of the rural poor, it is possible that some related activities could have a degrading effect on the environment, and poor households could end up living in worse conditions [16,17].
Previous studies related to livelihood diversification focused mainly on identifying its extent and determinants, and examining dominant income sources among sets of livelihood activities [4,18,19,20,21,22,23,24]. Some of these studies have identified two main types of livelihood diversification: distressed diversification, in which poor households are motivated to address the shocks they are facing [4,6,21,25], and progressive diversification, which is mostly regarded as an ex-ante strategy implemented by relatively well-off households [7,21]. According to these studies, livelihood diversification could be motivated by asset ownership, market accessibility, credit accessibility, education, and income, among other factors [4,6,21,22].
In Ethiopia, rural households combine a broad array of livelihood activities, most of which are depend mainly on the exploitation of natural resources and subsistence farming systems [4,26,27]. In studies conducted in different parts of the country, high population growth, land scarcity among youth, and lack of agricultural inputs and the associated low productivity have all been reported to drive diversification away from agriculture [28,29,30,31,32]. On the other hand, evidence has shown that land degradation in Ethiopia has been profoundly associated with an insufficient regulatory environment, weak institutions, population increase and high population density, the land tenure system (land right to the state), and lack of participation from the local community. Moreover, the proximate causes are believed to be unsustainable agricultural practices, uneven topography, and high fuel-wood consumption [33,34,35,36,37]. Therefore, in the context of land degradation and food security problems, the essential role of livelihood diversification in Ethiopia has focused on addressing shocks and enhancing household coping strategies [38,39,40,41].
Despite the inseparable and practical links between livelihood diversification and sustainability of the farming system in Ethiopia [42,43], few studies have sought to understand the linkage between these interdependent goals. As in other developing countries, rural households in Ethiopia have been undergoing considerable socioeconomic and environmental transitions in recent years, and this has brought both opportunities and challenges in terms of livelihoods [27,41,44,45,46]. As a result, rural households are trying to diversify their household economies to either survive or generate additional income to secure their livelihoods, regardless of the impacts on the natural resource base [8,28,29,31,32,47]. Despite decades of land rehabilitation efforts by governmental and non-governmental organizations that have addressed land degradation and the associated loss of production and productivity, as well as improving rural livelihoods, the efficiency and adoption rates of promoted land management practices have shown mixed results [48,49,50,51,52].
Many studies related to sustainable land management (SLM) practices and livelihood diversification have focused either on processes at the farm level [49,52,53] or the extent of adoption as influenced by socioeconomic and behavioral factors [51,53,54]. With a growing number of alternative non- and off-farm livelihood activities in rural economies, like those available in Ethiopia, little is known about the relationship between livelihood diversification efforts and the extent of adoption of SLM practices. Moreover, some efforts at livelihood diversification seem to have had a deagrarianization effect in some parts of Ethiopia [55,56]. We, therefore, think that looking at the relationship between livelihood diversification and uptake of SLM practices is imperative, because engaging in diverse livelihood activities could be associated more with earning additional income than with sustainable agriculture.
Hence, the main purpose of this study was to elucidate both the motivations that drive rural households to diversify livelihood activities and their probable links with the implementation of SLM practices in the Upper Blue Nile basin of Ethiopia. The specific objectives were to: (1) explore the extent and determinants of household livelihood diversification and (2) investigate the relationship between livelihood diversification and adoption intensity of SLM practices. On the basis of household survey data collected in November and December 2017 from three rural watersheds located in different agro-ecological zones, we analyzed the extent of livelihood diversification by using the Herfindahl–Simpson index and applied a multivariate probit model to estimate the probability of choosing certain livelihood activities. Moreover, an ordered probit model was estimated to determine the effects of livelihood diversification on intensity of adoption of SLM practices.
The rest of the paper proceeds as follows. Section 2 presents details of the methods used and describes the data and summary statistics of the explanatory variables. Our main results and discussion about livelihood diversification and its effect on SLM adoption are presented in Section 3. Concluding remarks and policy implications are discussed in Section 4.

2. Materials and Methods
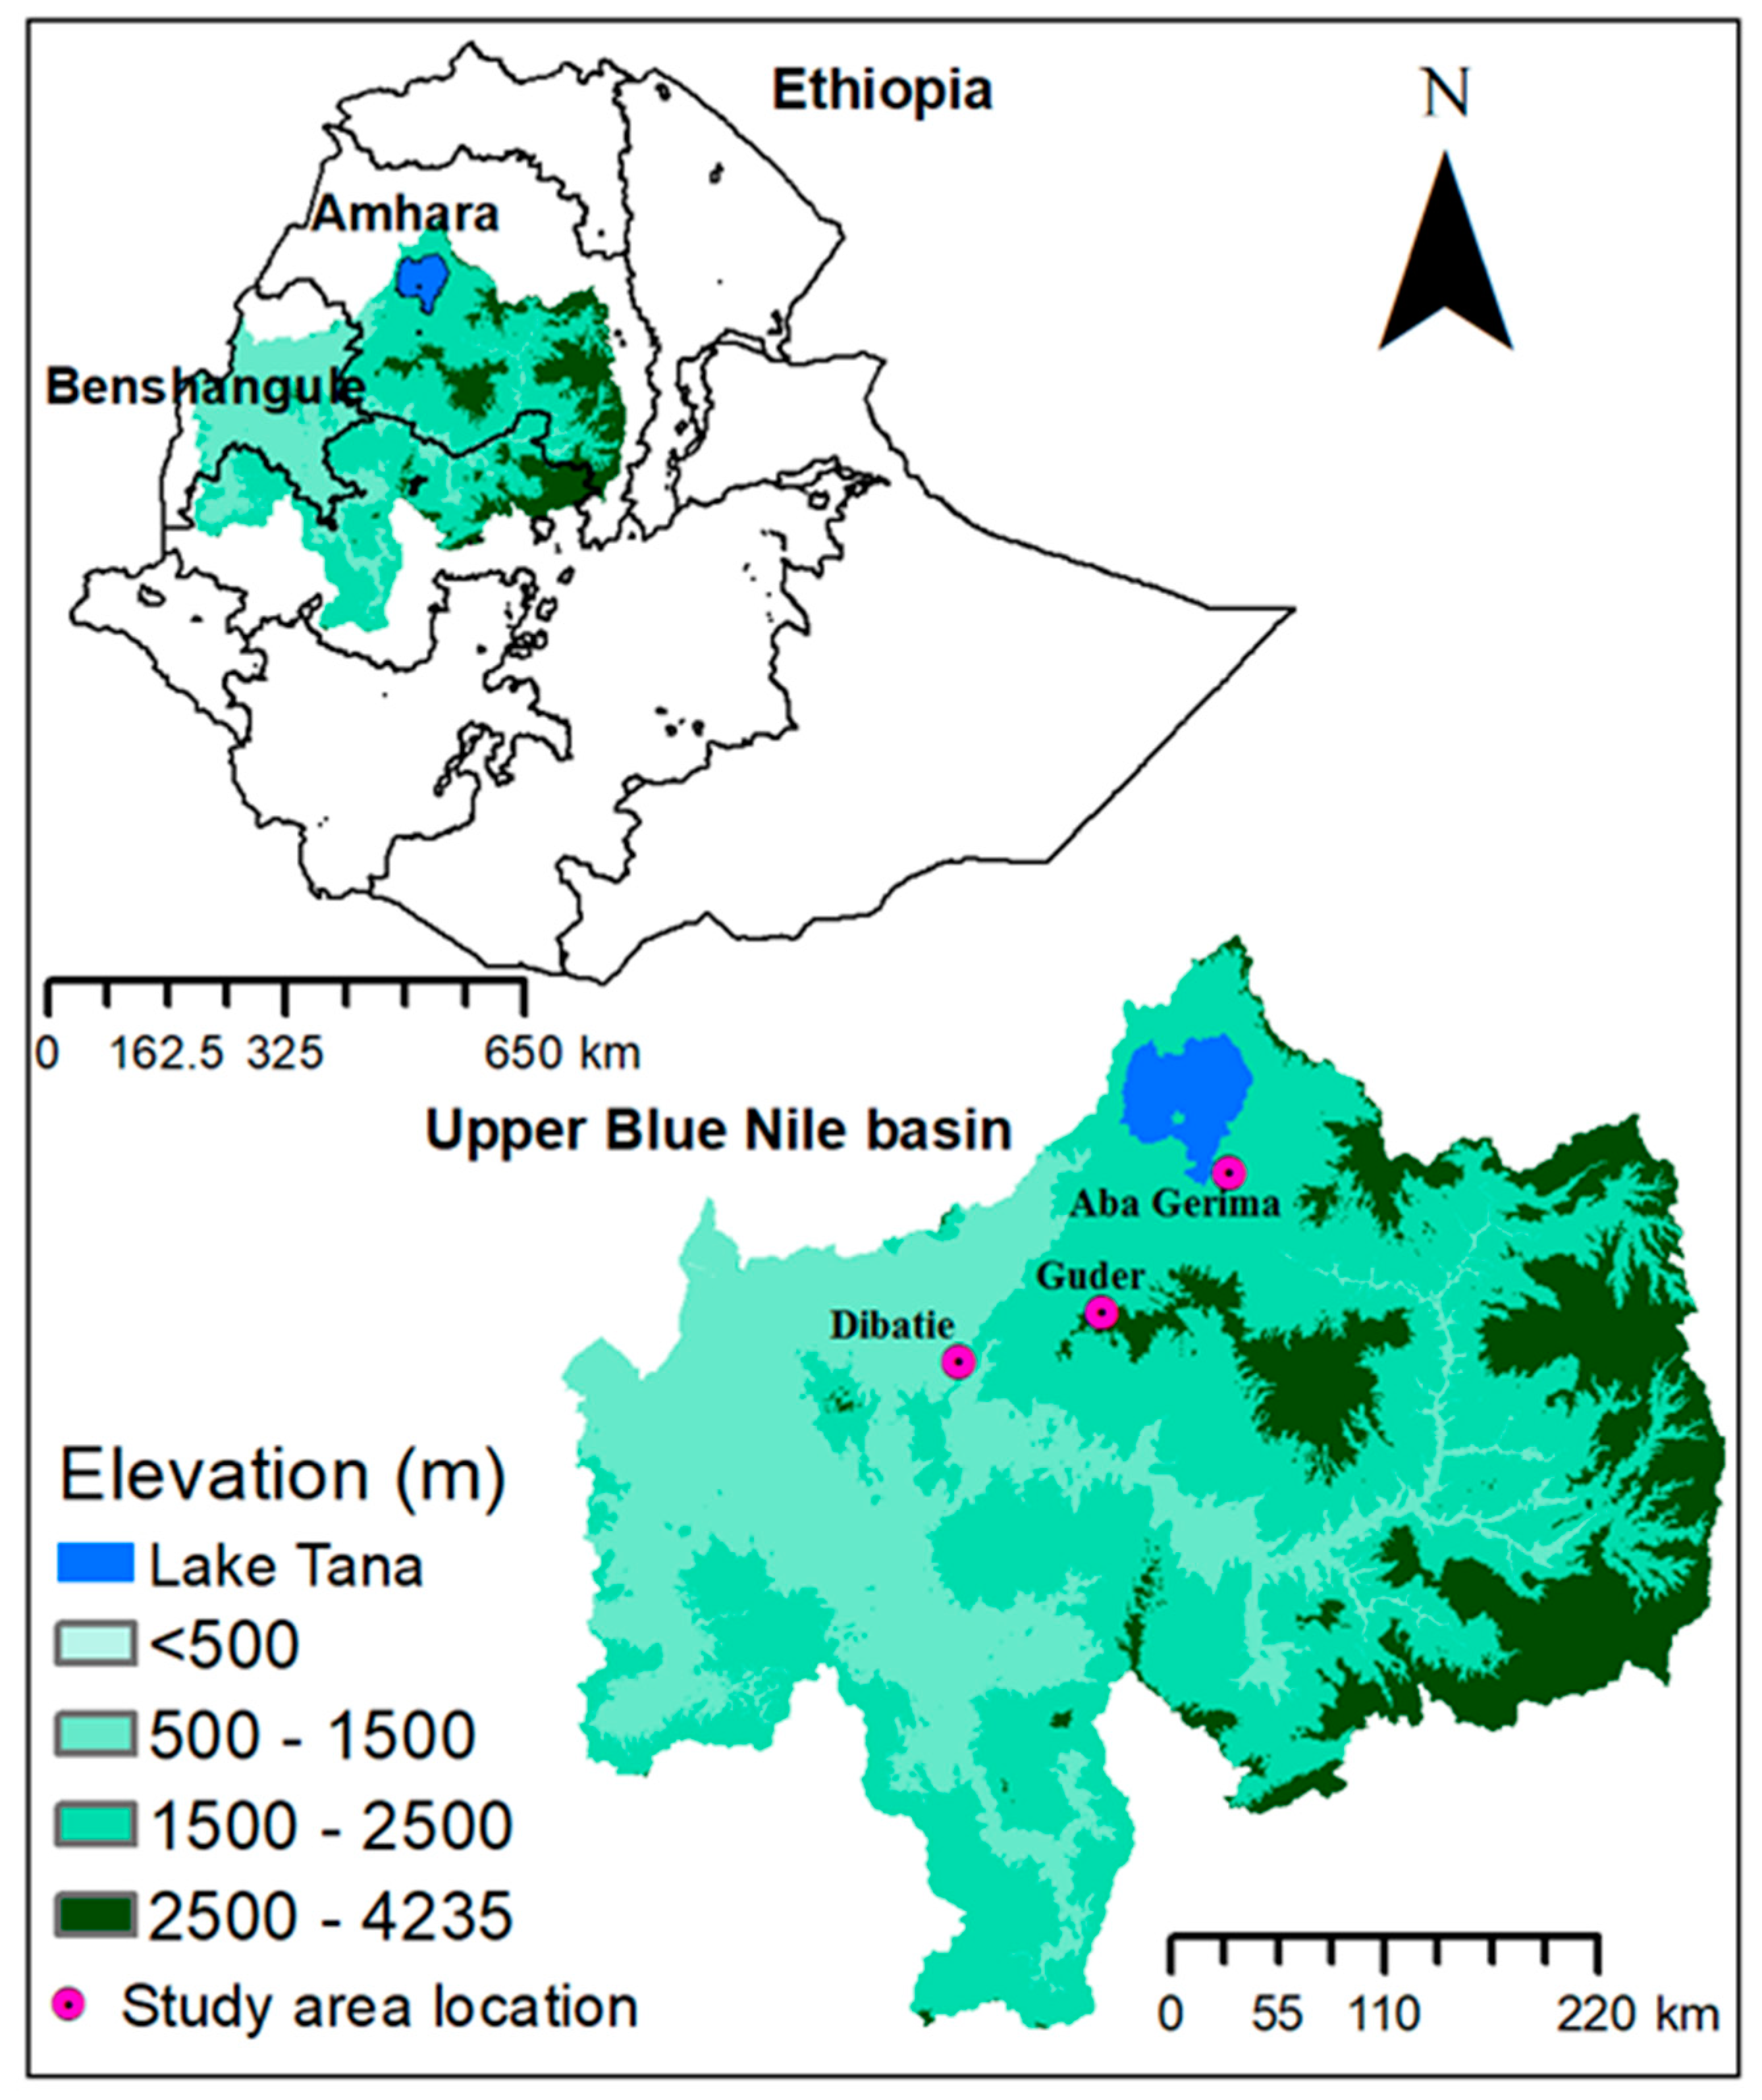
2.1. Study Area

This study was carried out in three watersheds of the Amhara and Benishangul-Gumuz national regional states of Ethiopia, in the Upper Blue Nile basin (Figure 1). People in the three study communities in the watersheds, Aba Gerima (in the Bahir Dar Zuria district), Guder (in the Fagita Lekoma district), and Dibatie (in the Dibatie district), primarily make their livelihoods from a mixed crop–livestock production system. The study area ranged from 1479 to 2900 m above sea level and from the highland to lowland climatic zones representing three different agro-ecological regions (Dega, Woyena Dega, and Kolla) of the Upper Blue Nile basin [53]. The major crops grown are barley (Hordeum vulgare L.), teff (Eragrostis tef Zucc.), wheat (Triticum aestivum L.), and potato (Solanum tuberosum L.) [53]. Cattle, sheep, goats, donkeys, and horses are the dominant livestock raised.
Aba Gerima watershed is categorized as humid sub-tropical with an annual rainfall of 895–2037 mm; Guder is moist tropical with an annual rainfall of 1951–3424 mm, and Dibatie is tropical hot humid with an annual rainfall of 850–1200 mm [53,57,58]. The Swiss Development Cooperation Water and Land Resource Centre in Aba Gerima and the Sustainable Land Management Programme in Guder are notable SLM-related projects in the study areas [53]. In these watersheds, the majority of farmers have subsistence-based livelihoods with additional sources of non- and off-farm income. In the past decade, most farmers in Guder and Aba Gerima have shifted from growing food crops to growing green wattle (Acacia decurrens) and khat (Catha edulis), respectively [53].

2.2. Data Collection

Primary data were obtained from the sampled respondents by using a structured questionnaire to generate quantitative data on household characteristics, socioeconomic parameters, market access, community institutions, and educational levels of farmers through in-person interviews conducted in November and December 2017. The household was the unit of analysis. Sampling procedures are discussed in the next section.

2.3. Sampling Procedure, Data, and Data Analysis

To select sample households for the study, we used a two-stage sampling procedure. First, on the basis of their specific experiences with SLM practices and varied biophysical and socio-economic characteristics, three watersheds representing different agro-ecological settings were selected: Guder (highland), Aba Gerima (midland), and Dibatie (lowland). Second, household respondents from each watershed were selected randomly by using a probability proportional to size sampling procedure. To gain a better understanding of SLM practices and socioeconomic conditions in these areas, we held a participatory rural appraisal in which we were able to understand the collective dynamics of socio-economic conditions, livelihood shifts and available opportunities in the watersheds. Before the main survey, 15 questionnaires were administered (five in each watershed) in October 2017 to examine the appropriateness of the predesigned set of questions in the selected watersheds. Finally, the household survey was administered to 270 households. The household survey collected detailed information on key socioeconomic and other parameters such as household demographic characteristics, education, asset holdings, livelihoods, income, shock/stress experience, implemented SLM practices, and membership of formal or informal organizations (Table 1). Data management and analyses were performed by using Stata ver. 14.1 (Stata Corp LP, College Station, TX, USA).

2.4. Empirical Model

Respondents were asked to indicate the household’s major livelihood activities according to six categories; crop production, livestock production, charcoaling, khat cultivation and daily labor. A related question on the amount of income derived from each livelihood activity over the past 1 year gave us additional means to understand livelihood structures at the household level. In accordance with past studies [6,20,62], we classified livelihood activities as on-farm livelihood activities comprising crop and livestock production, off-farm activities (which included earning wages for work on other farms), non-farm activities where income was earned from non-agricultural sources, and self-employment. We also included petty (minor) trading, beverage making, charcoal making, housing rental, and formal and informal transfers. We then calculated the income share of each livelihood activity carried out by the household in a given year, as follows:
S i = q i i = 1 n q i i = 1 , 2 , , n
where n represents the number of livelihood activities, qi is household income from activity i, and Si is the share of livelihood activity i in a given household in 1 year.
To identify the most remunerative livelihood strategies, we evaluated the variabilities in returns from various livelihood strategies by using stochastic dominance analysis [63]. In addition, the cumulative per capita annual income densities for major livelihood strategies were plotted to approximate the income distribution of households engaged in each livelihood strategy. As noted by Buckley [63], a typical livelihood strategy first-order stochastically dominates another livelihood strategy when it has a lower cumulative density, thereby proving that households are drawing higher incomes from that strategy. Hence, taking each livelihood activity’s income distribution, we were able to test for stochastic dominance. One Way Analysis of Variance (ANOVA) was used to test the differences in livelihood income shares. Moreover, the chi-squared test was used for understanding the difference in households livelihood opportunity choices.
To understand the extent of livelihood diversification, we adopted the Herfindahl–Simpson diversity index, which is commonly applied in ecological and marketing research [64,65]. Although there are many different diversity index methods, this measure of index enable us to use the degree of diversification as a measure of the size of each livelihood activity in relation to its containing groups (in our case, a household’s total income), while assessing the activity’s diversification and dominance at the same time [6,19,66]. In accordance with the methods of Djido and Shiferaw [9,67], the indices were calculated by using the following formula:
H H I i = 1 i = 1 n S i 2
where HHIi is the Herfindahl–Simpson diversity index, S2i is the squared income share from each livelihood activity, i is the activity and n is the number of livelihood activities. As stated by Smith and Wilson [68], to address limitations related to evenness and dominance characteristics, we used the total number of livelihood activities to normalize the Herfindahl–Simpson diversity index:
N H H I i = 1 H H I i ( 1 n ) 1 ( 1 n )
where HHIi refers to the normalized Herfindahl–Simpson diversification index, which ranges from zero (specialization in one activity) to one (full or complete diversification). As stated by Djido and Shiferaw [67] and Brezina et al. [69], higher normalized index values indicate a greater amount of diversification.
For the three simultaneous livelihood choices (i.e., on-farm, off-farm, and non-farm livelihood activities) we estimated a multivariate probit model. The model adopted in this particular study has been used extensively in studies of technology adoption, information and knowledge transfer, labor-related decisions for on- and off-farm employment, and participation in agro-environmental programs [70,71].
We first modeled a random utility for the decision to pursue any livelihood activity. In the utility function, we assumed that households decide to implement a certain livelihood strategy on the basis of maximizing utility, i.e., U*jUo > 0. Hence, in the utility function, the net benefit of a livelihood activity (B*ij) could be fit as follows;
B i j * = x i β j + μ i     ( j = o n f a r m ,   o f f f a r m & n o n f a r m   a c t i v i t i e s ,   i = 1 , 2 ,   n )
where B*ij is the household’s net benefit, which is indicated as a function of a vector of exogenous household variables xi; β refers to parameter estimates; n is the number of households; and ui is the error term. Therefore, a typical household would choose a given livelihood strategy in the pursuit of gaining higher household income. Hence, a general multivariate probit model could be specified as follows:
B i j = x i j β j + μ i j , B i j = { 1   i f   y i j * > 0 0   O t h e r w i s e                 ( j = o n f a r m , o f f f a r m & n o n f a r m )
where Bij (j = 1, …, m) is a vector of livelihood activities (in our case m = 3) performed by the ith household, xij is vector of observed variables that affect the decision to choose any type of livelihood activity, βj is vector of unknown parameters, and µi is the error term.
As indicated by Greene [72], the multivariate probit model follows a series of independent probit models for each alternative livelihood activity j. Note that rural households are likely to undertake multiple livelihood activities simultaneously; thus, it is likely that the decisions among choices are correlated. As a result, the unobserved error terms for the estimated probit models would not be independent. If we were to ignore this characteristic of the outcome variables, the result would be a biased estimate of the probabilities and parameters. In the multivariate probit approach to estimating the unknown parameters in Equation (5), the error terms (across j = 1, …, m alternatives) of the latent equation are assumed to have multivariate normal distributions, and this results in a model with a mean vector equal to zero and a covariance matrix R with diagonal elements equal to one.
With the assumption of multivariate normality, the unknown parameters in Equation (5) can be estimated by using maximum likelihood procedures. The probabilities were computed by using the Geweke–Hajivassiliou–Keane simulation procedure [73].
To model the association between livelihood diversification and implemented SLM practices, reported practices were taken as outcome variables. The respondents were asked about a total of 18 of SLM practices, including soil fertility management, soil and water conservation, and gully rehabilitation. We summarized the results and took the 10 most frequently practiced SLMs as outcome variables for the model estimation. We estimated an ordered probit regression model [49,52,74], which was suitable for count data like ours.
In analyses of the adoption of some technologies, it is essential to note that they will be implemented to different extents by different farmers. In this study, the outcome variable adoption of SLM practices could take values ranging from 0 to 10. The households are heterogeneous because of differences in socio-economic, community, education, and other factors, so the likelihood of any household adopting the first SLM practice might vary from that of other households. In accordance with the method of Wollni et al. [74], the model is specified as:
y * = β X + μ ,
where y* is the latent variable (number of SLM practice) and takes the values 1 through 10, β′ is a vector of unknown parameters to be estimated, X is a vector of explanatory variables, and µ is the error term, which is assumed to be normally distributed with zero mean and a variance of one. The number of observed technologies (y) used is related to the underlying latent variable y* through the threshold µn (n = 1, …,10) and the probability that any given number of technologies (y) is used is calculated as follows:
p r o b ( y = n ) = φ ( μ n β X ) ( μ n 1 β X ) . n = 1 , ,   10
The ordered probit estimation will give the threshold µ and vector parameter β. The threshold µ shows the range of the normal distribution associated with the specific values of the response variables. The remaining parameters (β) represent the effect of changes in explanatory variables on the underlying scale.
When estimating the effect of livelihood diversification and adoption of SLM technologies, a potential endogeneity problem may arise. In our case, it may occur when an explanatory variable of choosing a certain livelihood strategy is jointly determined by the decision to adopt in the SLM adoption specification [75]. To address this problem, we tested for it in accordance with the method of Rivers and Vuong [76] by using a two-stage linear regression, and we confirmed that there was no endogeneity problem between livelihood diversification and adoption of a specific SLM technology.

3. Results and Discussion

3.1. Summary of Socioeconomic Variables

Table 2 summarizes the socio-economic characteristics of the survey respondents (see Table 1 for a description of the variables). For the entire sample, the average age of the household head was 49 years, the dependency ratio was 71%, the average household size was 5.4, and more than 80% of the study households were headed by males. Family size was significantly larger at Dibatie than Aba Gerima and Guder (p < 0.001). Most households in the watersheds are characterized as smallholdings, with an average of 1.03 ha of land (which sustains an average household size of about 5.4 people) and an average livestock holding of 3.97 TLUs. The average land holding was somewhat smaller than the national average farm (1.22 ha) [74]. Farmers in Aba Gerima held significantly more land than famers in Guder and Dibatie, while Dibatie farmers owned more livestock compared to Aba Gerima and Guder (p < 0.05) More than half (52%) of the sampled households reported having experienced anthropogenic (e.g., price inflation, poor access to social services) and naturally driven (e.g., drought, pest infestation, soil erosion, animal disease) stresses. Experience of these types of stressors differed significantly between watersheds with households in Aba Gerima reporting significantly more stress than Guder and Dibatie (p < 0.001).

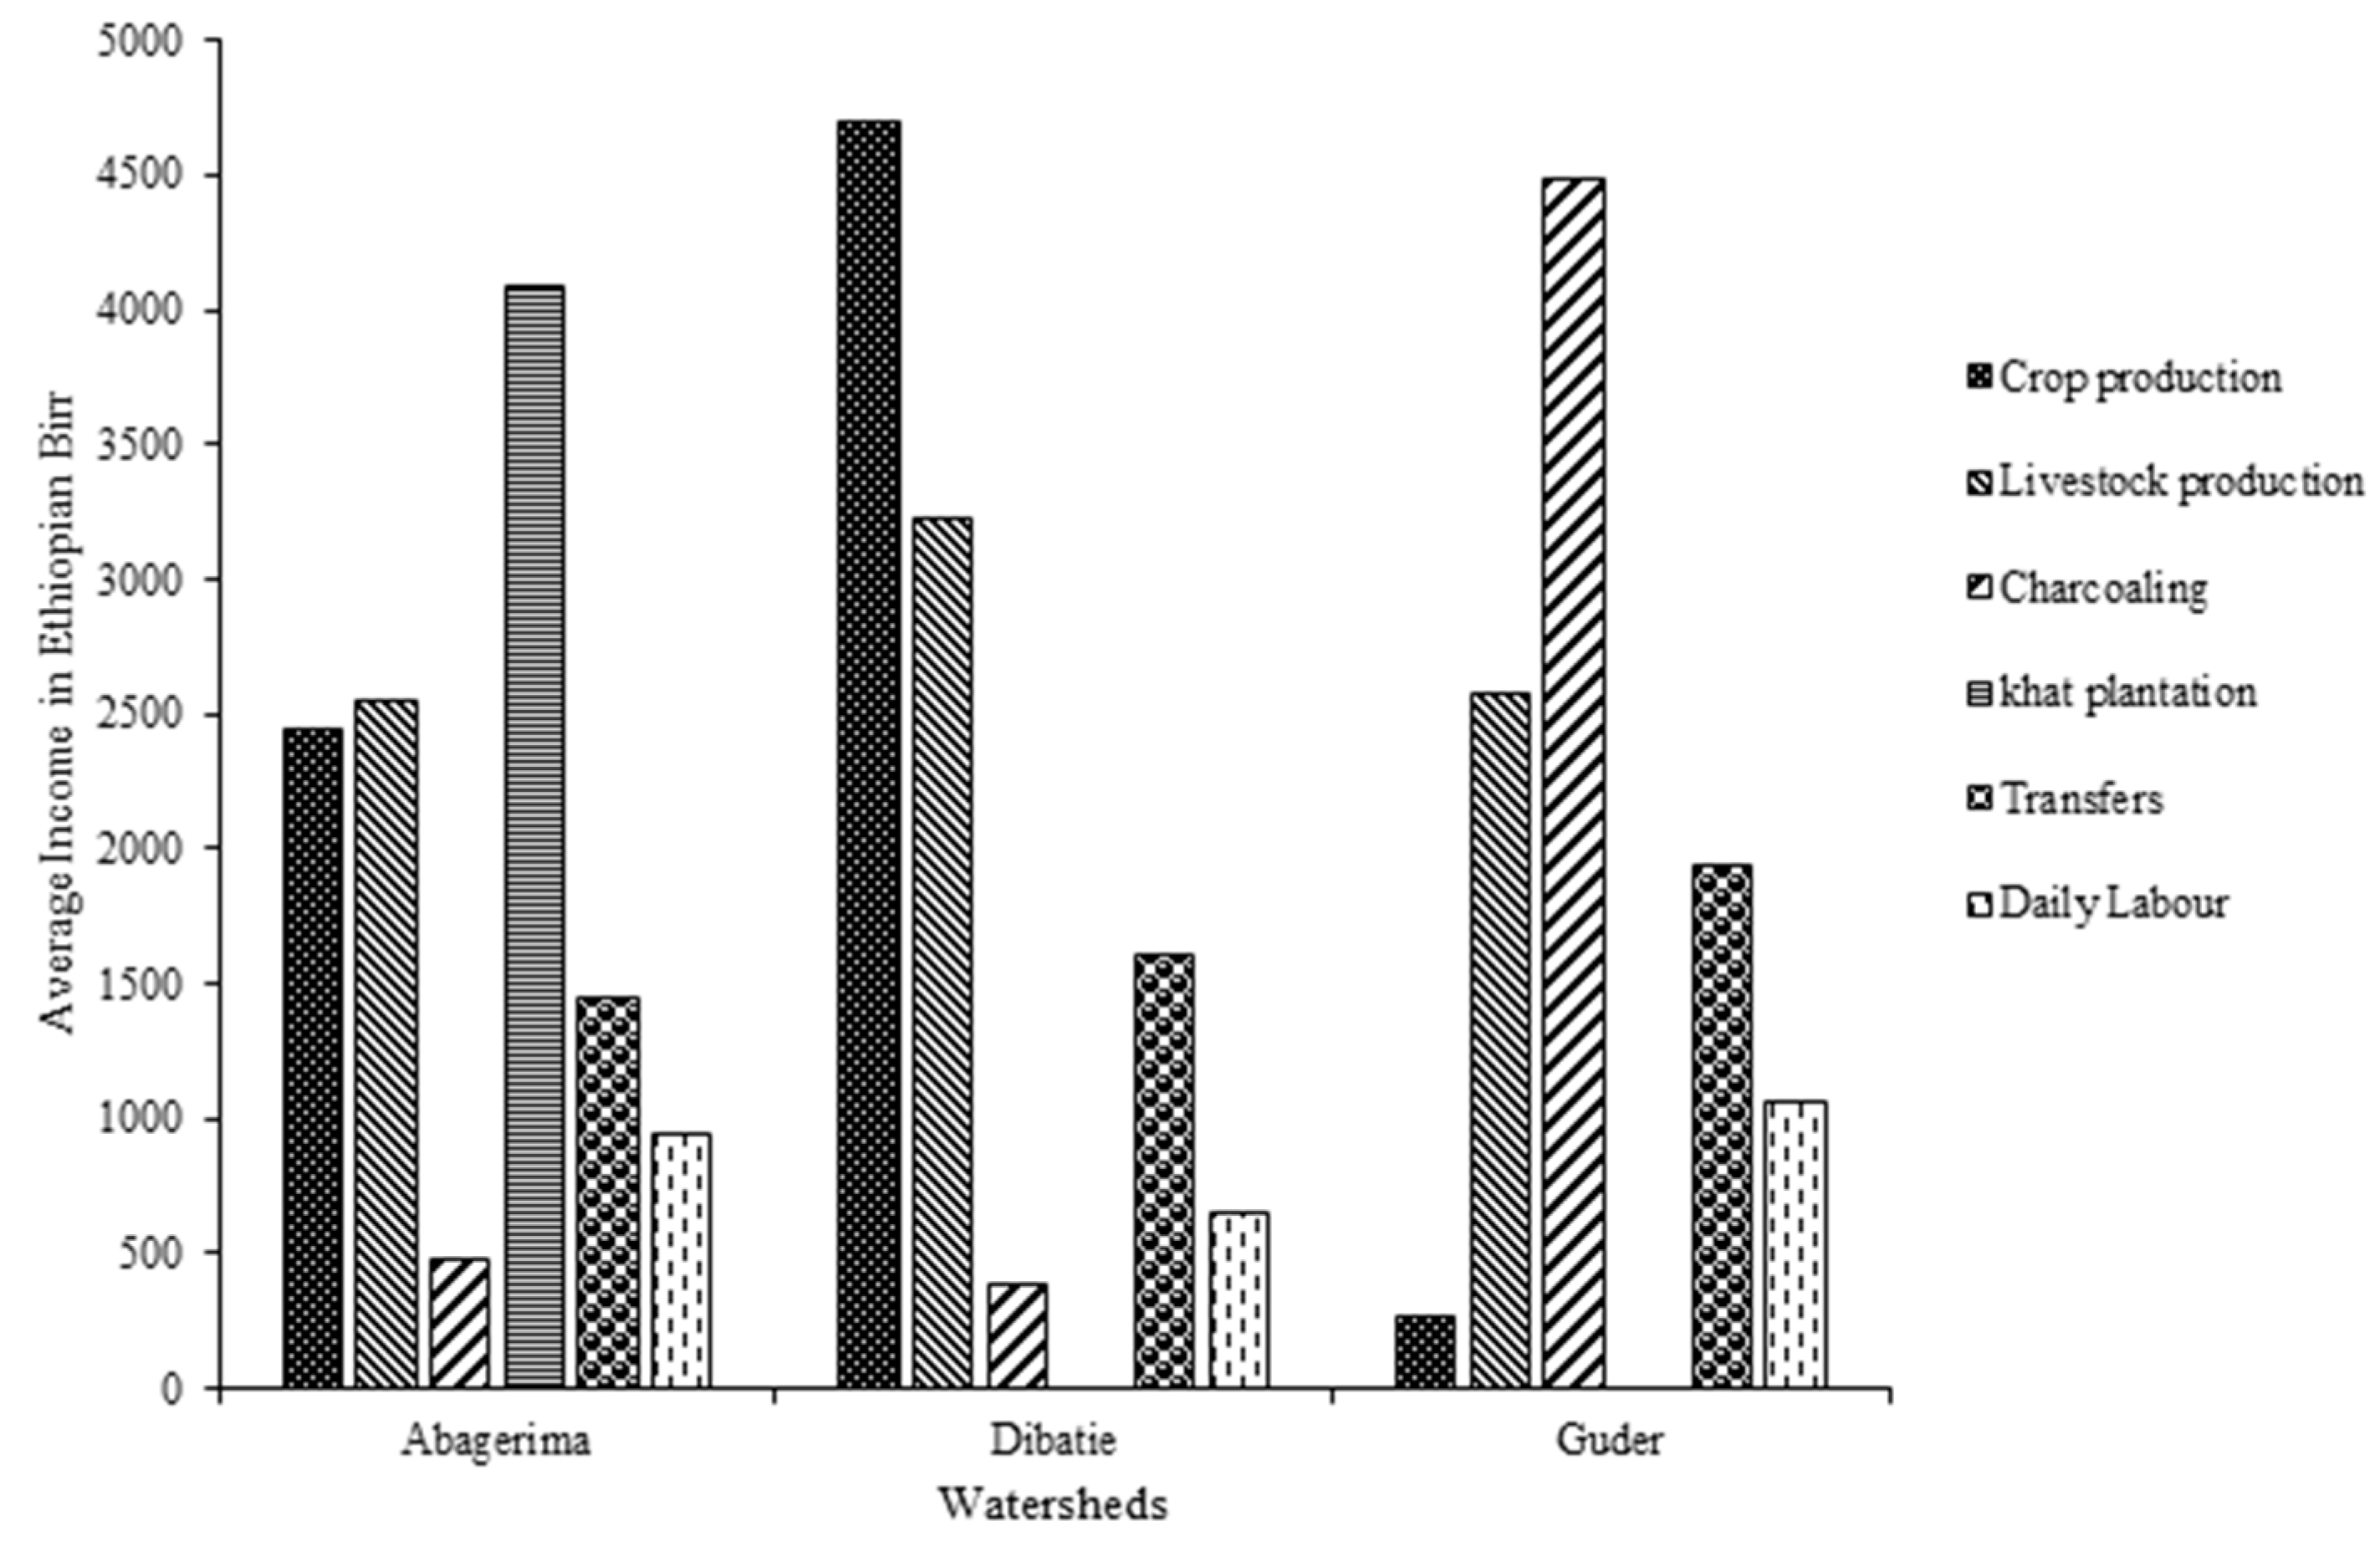
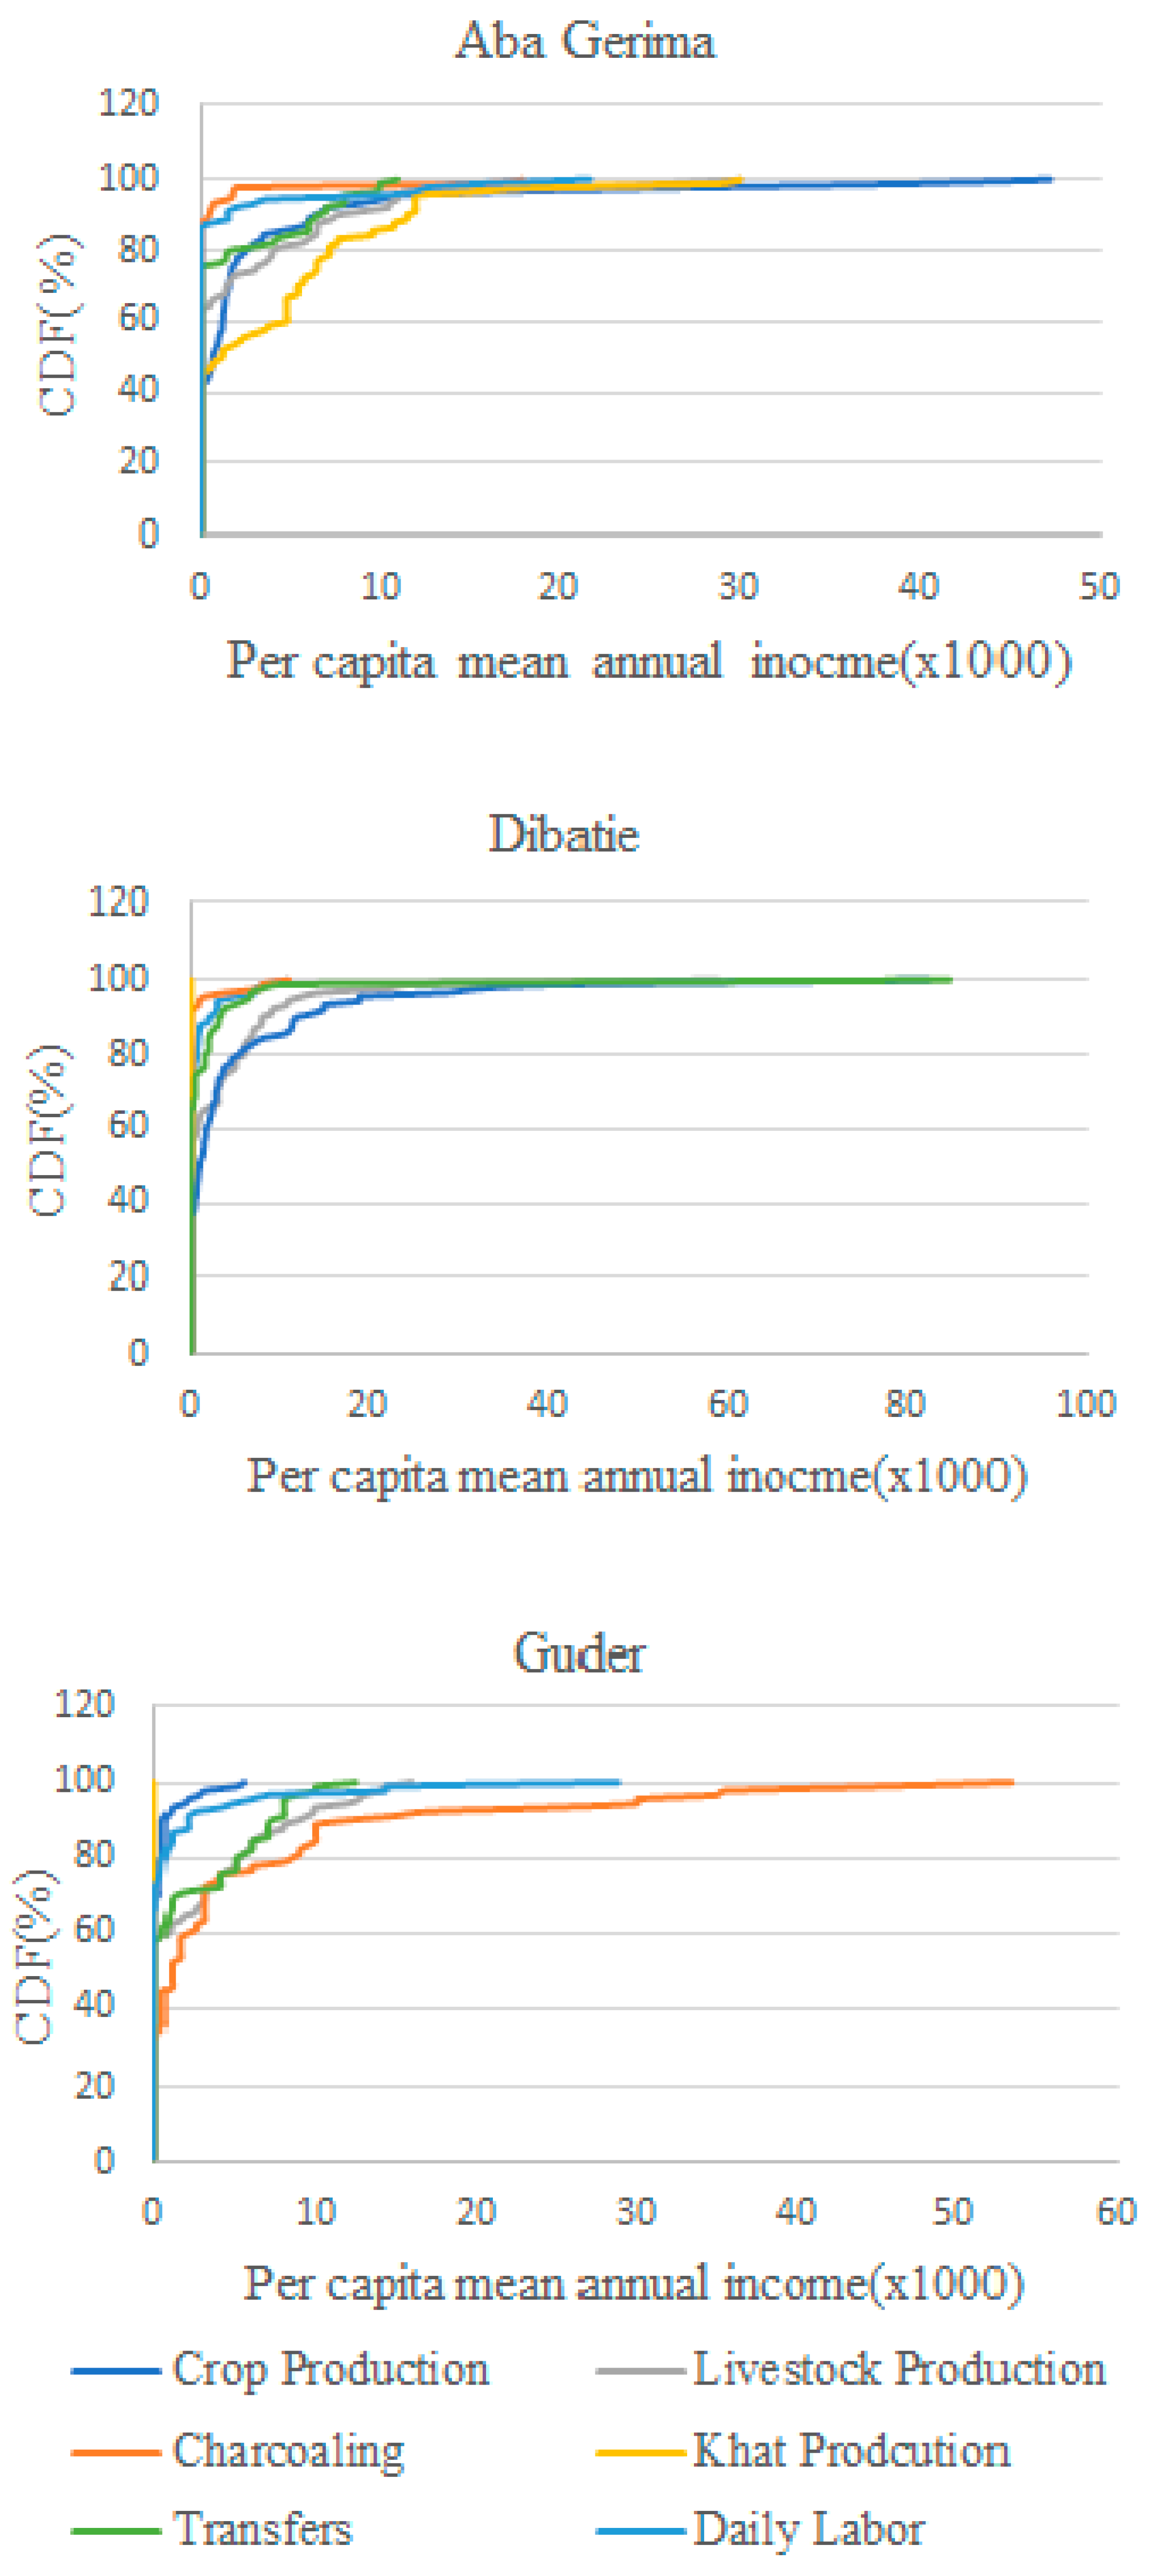
3.2. Livelihoods in the Study Areas

The majority (81%) of surveyed households were engaged in crop and livestock production (Figure 2). The result is closely in line with a report showing that an average of 79% of Ethiopian rural smallholding farmers earn income from agriculture [77]. In addition to engaging in their mixed crop–livestock farming system, a considerable number of households engage in off-farm and non-farm livelihood activities. Moreover, there was a statistically significant difference of mean income across watersheds as determined by one-way ANOVA (p < 0.001) for charcoal production (F(2, 270) = 13.03, p = 0.000), khat plantation income (F(2, 270) = 39.96, p = 0.000) and crop production (F(2, 270) = 7.50, p = 0.0007)
High-value cash crops such as khat in Aba Gerima and Acacia decurrens for charcoaling in Guder are the dominant household livelihood activities in those watersheds. Because of increasing demand, khat cultivation has become a notable remunerative income source for households in the Aba Gerima watershed. Similar studies have shown that, despite its controversial social significance, khat makes a substantial contribution to the country’s national income [78,79]. Acacia decurrens was the dominant cash crop in the Guder watershed, where the charcoal is usually destined for markets [80]. In Dibatie, crop and livestock farming made a higher contribution to overall income.
Households were asked to mention the opportunities that were available to them to improve their livelihoods. Five opportunities were noted, but three of these are agriculture related, suggesting that there is little diversification beyond farming in rural Ethiopia. Except establishing retailing business, there was significant difference (p < 0.001) on the household’s choices of existing livelihood opportunities across watersheds. The majority of the households reported that, if initial investment capital or credit were made available, they would prefer to invest the money in livestock fattening (92% of households in Guder, 72% in Aba Gerima, and 37% in Dibatie) (Figure 3). A possible explanation for this could be, alike other parts of the rural Ethiopia, farmers’ limited entrepreneurial competence would not be able to allow them to pursue other lucrative opportunities than livestock rearing, or it may be related to its multipurpose role to livelihoods of farmers through provision of food and income from products, employment, insurance against drought, fuel for cooking, manure for crops, and draught power for farming. On the other hand, it could also be related to their perception that livestock rearing outweighs others because of its capacity to optimally use available resources (e.g., crop residue, grass) that could not otherwise be utilized by them.

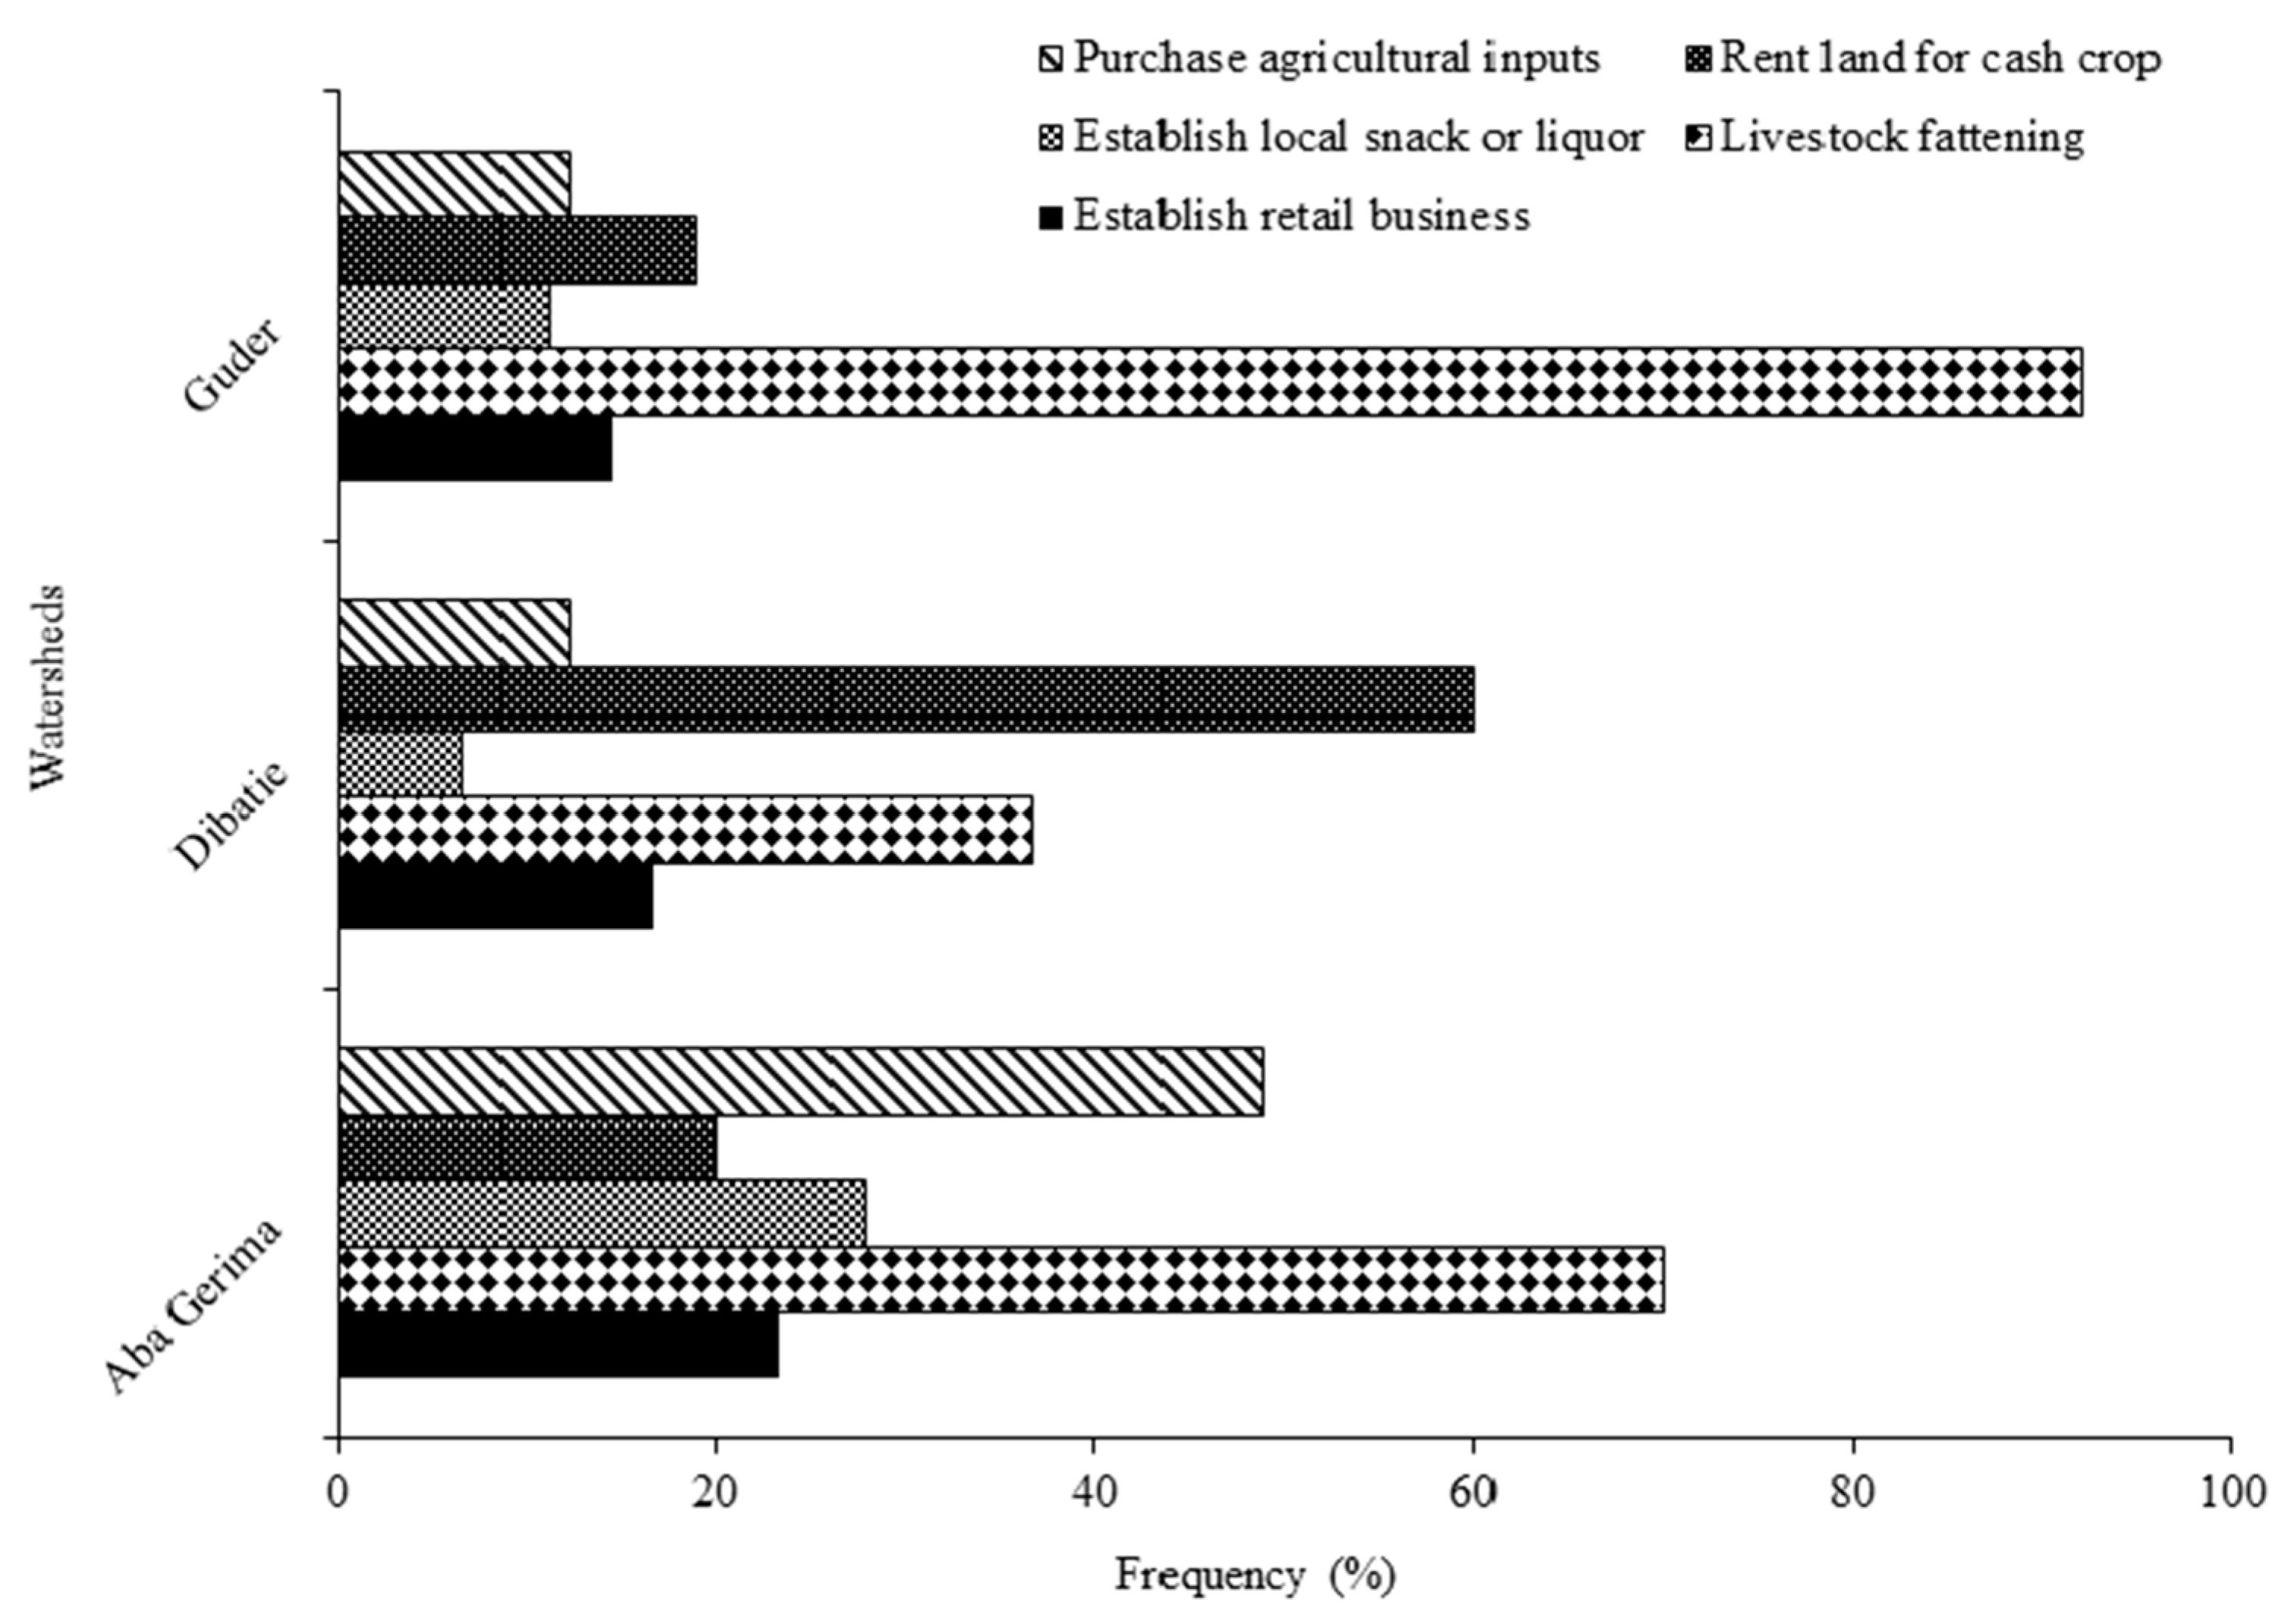
3.3. Remunerative Livelihood Activities in the Study Areas

On the basis of the stochastic dominance criterion, khat production was the first-order stochastically dominant activity in Aba Gerima (Figure 4). In Dibatie, crop production was dominant and livestock production was the second most dominant. In Guder, growing Acacia decurrens for charcoaling was the dominant remunerative livelihood strategy. According to Achamyeleh [81], in comparison with other on-farm sources, acacia plantations made a very high contribution to the overall income of households in Guder. Similarly, Nigussie et al. [80] indicated that 84.6% of households reported income as their major motivation to plant Acacia decurrens. In addition, our findings showed that charcoaling and khat production were the most inferior (i.e., least lucrative) of the six livelihood strategies in Aba Gerima and Dibatie, respectively.

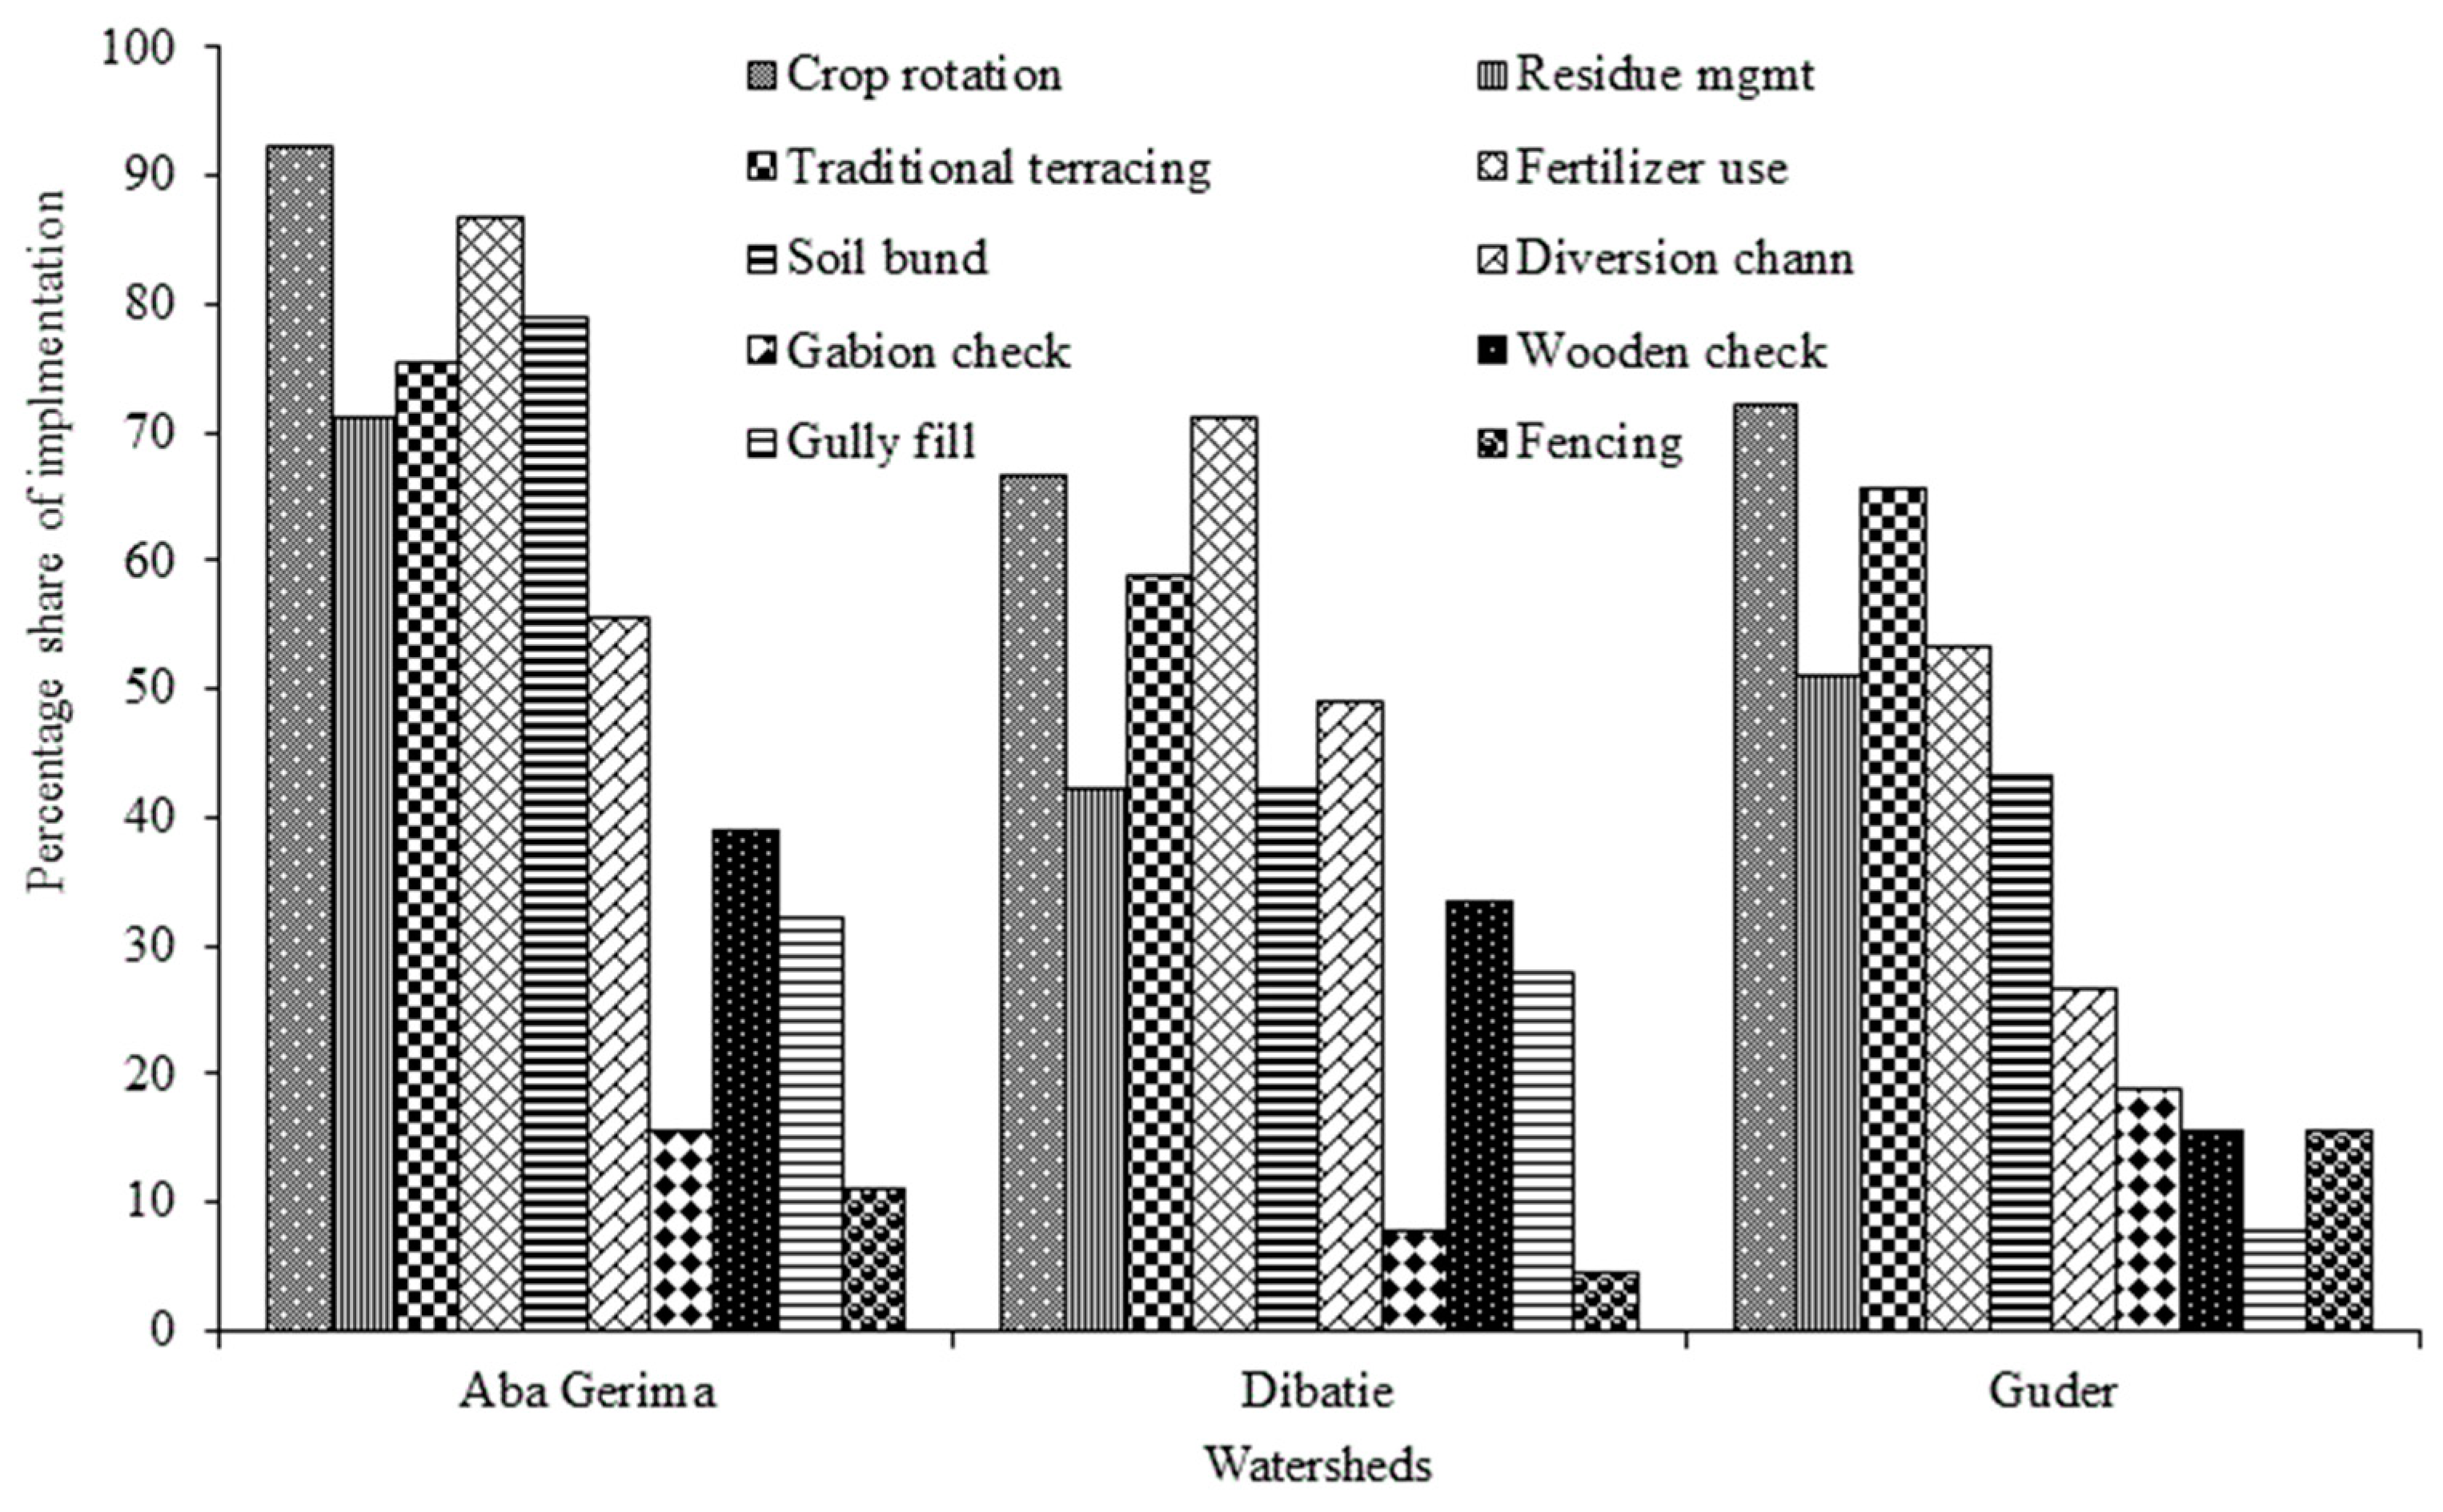
3.4. SLM Practices in the Watersheds

Among the surveyed SLM practices, the most commonly reported SLM technologies included crop rotation, chemical fertilizer use, gabion check dams, wooden check dam, gully filling, fencing, residue management, traditional terracing, soil bunds, diversion channels, and waterways. Crop rotation, fertilizer application, use of soil bunds, traditional terracing, and residue management were reported to be the most extensively applied SLM practices. Aba Gerima watershed had the highest percentage of households implementing SLM activities (Figure 5). Similar results were reported by Nigussie et al. [53], who reported that agroforestry, drainages, and application of manure and fertilizers were commonly implemented in Aba Gerima. In this study, fencing, gabion check dams, and gully filling were the least used SLM practices. Note, however, that the abovementioned technologies are community-wide practices, and households were asked for their participation in these operations.

3.5. Drivers of Livelihood Diversification

We used a multivariate probit model to analyze the likelihoods of households engaged in a certain livelihood activity associated with a set of factors related to household, socioeconomic, location, and asset features. On-farm activity was negatively correlated with both off- and non-farm activities, indicating that households that diversified into with in on-farm activity may not have had a chance to engage in the other activities. Conversely, off-farm activity was positively correlated with non-farm activity, implying that households that had engaged in wage employment activities may also have engaged in non-farm activities (ρ32 in Table 3). The likelihood ratio test of the independence of the error terms of the various livelihood activity equations was strongly rejected (χ2 (3) = 46.9552, p < 0.001) (Table 4). We therefore adopted the alternative hypothesis of mutual interdependence among livelihood strategies.
Gender of the household head significantly influenced the probability of adopting certain livelihood strategies (Table 4), and males were more likely to participate in on-farm livelihood activities (p < 0.05). Our result is in line with that of Ragasa et al. [82], who also reported that male-headed households have more productive labor and asset ownership than their female counterparts when it comes to on-farm activities. Female-headed households can be characterized by a lack of access to asset ownership and adequate labor to pursue on-farm activities. The probability of participation in non-farm livelihood activities decreased with increasing household size (p < 0.05), perhaps because larger households had more dependents. Likewise, Babatunde et al. [18] reported that the larger the household, the less likely it was to support activities other than agriculture. As expected, the dependency ratio significantly influenced all livelihood diversification choices. A negative effect was observed with on-farm livelihood activities (p < 0.01); this may indicate that households with more dependents were less likely to choose on-farm activities because of a shortage of active working labor. Eswaran and Kotwal [83] reported that households with more active working labor yielded higher levels of productivity for smallholder farmers. Conversely, households with more dependents tended to choose off-farm (p < 0.01) and non-farm (p < 0.05) livelihood activities. A possible explanation for this could be that a larger household could shift available labor to alternative off- and non-farm livelihood activities.
Market distance significantly affected the choices of off-farm (p < 0.05) and non-farm (p < 0.05) livelihood activities, but in opposite directions (Table 4). The regression result had a negative value for the choice of off-farm activity, which may suggest that, as the labor market distance increased, households were less likely to choose this option. Our finding that market distance affected off-farm income is well substantiated by Ellis and Bahiigwa [84], but differs from the results of Kung and Lee [85]. In contrast, market distance had a positive influence on the choice of non-farm activities. In our discussion with the residents of Aba Gerima and Guder, we learned that when some products, such as khat and charcoal, were directly sold at distant marketplaces they might have achieved higher prices than could have been obtained from local buyers. In addition, demand for these products might have been higher in distant markets than in closer ones. Using panel data, Jiao et al. [86] revealed that access to infrastructure would help households to diversify to more remunerative strategies.
Contrary to our initial expectation, access to credit showed a significant effect only for on-farm activities (p < 0.05) (Table 4). These results could be related to targeting and efficiency issues related to the credit service. It is also possible that the sampled households may have used this credit for on-farm inputs, such as fertilizers, improved seeds, or consumption smoothing. A more profound study done in Ghana revealed a similar result, which indicated that households who received credit found to be effective in terms of improving agricultural productivity and it also helped them to diversify their livelihoods [24]. This idea is in line with the work of Mulwa et al. [87], who found that access to credit allowed households to adopt soil and water conservation activities that help them to invest more in agricultural inputs. Credit users also may not use the financing for the intended purpose of diversifying their income sources [47]. A similar result was found in rural Niger, where access to financial institutions in the community seemed to negatively affect the probability of participating in businesses activities [59]. In contrast, Mentamo and Geda [88] reported that credit access increased the extent of livelihood diversification in Kadida Gamela district, Ethiopia.
Access to extension services had a significant positive effect on the choice of off-farm livelihood activities (p < 0.05) (Table 4). A similar result was also reported by Chikobola and Sibusenga [89]. Extension services customarily help households increase production and productivity within the farming system itself [20,22,47]. However, the present findings could be attributed to the fact that these services may include small-scale employment opportunities (e.g., off-farm activities). For example, in northern Ethiopia, agricultural extension programs that made use of public employment schemes such as “food for work” helped farmers to shift to off-farm livelihood sources [27].
As anticipated, membership in rural cooperatives had a significant positive effect on diversification to non-farm livelihood activities (p < 0.01). This finding underscores the importance attached to the entry barrier households face in terms of initial capital, because these cooperatives might help them to access credit [26]. Previous studies have also reported that membership in formal and informal community organizations can help smallholder farmers to address financial constraints, gain social cohesion and skills, and increase their market networking in selling and buying products [20,25,44,84,90,91].
Household income had a significant positive effect on the choice of on-farm activities (p < 0.1), but it had a significant negative influence on non-farm livelihood activities (p < 0.01) (Table 4). This finding may suggest that, despite the increased income, these households still do not have a strong incentive to diversify their livelihood sources. As discussed earlier, access to credit also seemed to make households focus on on-farm livelihood activities. A similar finding was reported by Ellis and Bahiigwa [84], who found that a greater income may aid in the timely purchase of farm inputs, such as fertilizers, improved seeds, or the ability to hire wage labor, leading to enhanced cultivation practices and higher productivity.
The aggregate stress/shock index had a significant positive affect on a household’s decision to participate in off-farm livelihood activities (p < 0.05). For example, exposure to seasonal rainfall may force households to look for short-term solutions, such as engaging in daily labor. In a study carried out in Zambia, Gautam and Andersen [92] argued that households tended to choose livelihoods related to short-term gains when they experience shocks like the lack of seasonal rainfall. Moreover, our result supports the theory of distress-driven livelihood diversification, as opposed to progressive-driven diversification, in the region [19,21,84,93,94]. Woldehanna [27], Kasie et al. [94], Dercon [93], and Block and Webb [39] reported a similar result in Ethiopia, where the amount and variability of rainfall had a significant effect on the decision by households to engage in any type of off-farm work. Likewise, studies conducted in Uganda [95] and in Indonesia [96] confirmed that rural household labor adjustment decisions serve as a coping mechanism in response to agricultural shocks.
Livestock holding had a significant positive effect on the choice of non-farm livelihood activities (p < 0.05). Similarly, Ellis [19] and Kassie et al. [20] found that increasing livestock holding is an essential financial safeguard to starting a new livelihood and helps farmers to diversify both within and outside agriculture. In addition, higher agricultural intensification had a significant positive effect on the choice of on-farm livelihood activities (p < 0.05). This could mean that, as more households adopt agricultural technologies and inputs, more will stay on the farm. This result is in line with that of Sanders and McKay [97] and Verkaart et al. [98], who reported that households with greater agricultural intensification and productivity were less likely to be driven to diversify to other sources of income. In terms of study locations, significant differences were observed in the probability of adopting non-farm and off-farm livelihoods among the different agro-ecological areas (Table 4). Despite the fact that most households in the watersheds practice crop–livestock mixed farming, a substantial difference was observed in activities such as khat and charcoal production (Figure 3). Similarly, Tesfaye et al. [99], Ellis [19] and Peng et al. [100] indicated that geographical locations, and policies related to ecologies determines the choices of livelihood strategies.

3.6. Effects of Extent of Livelihood Diversification on SLM Practices

The livelihood diversification index had a mean of 0.10 and a standard deviation of 0.18, indicating that households tended to be relatively concentrated in their main sources of income. The maximum estimation was 0.64 and the minimum was 0. A relatively high diversification was found in Dibatie (0.13), whereas in Guder it was lower (0.07). The values of livelihood diversification were roughly similar in studies carried out in different parts of Ethiopia [20,39,47,99,101,102]. Conversely, a higher extent of livelihood diversification was revealed in studies conducted in Tigray and Gamebella [103,104].
We also estimated an ordered probit model to investigate the marginal effect of each covariate on the probability of adopting SLM practices by the respective households. The joint test of all slope coefficients proved that our null hypothesis was rejected (Table 5). Overall, the results showed that livelihood diversification had a positive effect on a small number of SLM practices, but there was a negative relationship when the number SLMs increased (Table 5).
As shown in Table 5, an increase in a household’s livelihood diversification status increases the probability of selecting zero, one, two, or three SLM practices by 3% (p < 0.1), 5.3% (p < 0.05), 7.3% (p < 0.05), and 9.3% (p < 0.05), respectively. Conversely, an increase in the livelihood diversification status decreases the probability of adopting five, six, seven, or eight SLM practices by 7.3% (p < 0.05), 5.6% (p < 0.05), 9% (p < 0.05), and 2.6% (p < 0.1), respectively. Generally, livelihood diversification shows mixed results in that it favors a lower level of SLM adoption intensity and disfavors higher level of adoption of SLM. These results clearly show the complementary nature of having diversified livelihood strategies and carrying out SLM activities in these watersheds for a relatively low number of SLM adoptions. A slightly similar result was revealed in Gozamin district, Ethiopia [20] where livelihood diversification was positively associated with farmland management strategies. Compared with the case when the household head has any level of education, the probability of adopting five, six, seven, and eight SLM practices was higher by 0.6 (p < 0.05), 0.5 (p < 0.05), 0.7 (p < 0.05), and 0.2 (p < 0.1) percentage points, respectively, among household heads of higher education levels (Table 5). Similar studies in the study watersheds and elsewhere in Ethiopia have revealed that more educated heads of households have a higher probability of adopting SLM practices [37,53].
Access to credit was found to have a positive effect on adopting a higher number of SLM practices. Compared with the case when respondents had no access to credit, the probability of adopting five, six, seven, or eight SLM practices was higher by 4.1 (p < 0.05), 3.2 (p < 0.05), 5.1 (p < 0.05), and 1.5 (p < 0.05) percentage points, respectively, for respondents who had access to credit. This could possibly be associated with owning more livestock, as it is a liquid asset and provide financial safe guarding [105]. Likewise, in India, Aryal et al. [106] revealed that more ownership of livestock showed a higher intensity of adoption of climate-smart agricultural practices. These findings are in line with those of Nigussie et al. [53], who reported that credit access could encourage the adoption of manure application.
With regard to the shock index, the more severe its impact, the lower adoption intensity for greater intensity level of SLM adoption. For example, the probability of adopting five, six, seven, and eight practices was higher by 11.6 (p < 0.05), 8.9 (p < 0.05), 14.2 (p < 0.05), and 4.1 (p < 0.05) percentage points, respectively, for those who experienced a lower shock. Likewise, in their comparative study of Thailand and Vietnam, Nguyen et al. [107] revealed that farmers’ experience with weather shocks affected their decision priorities relative to what type of land management practices they should engage in. Nigussie et al. [53] revealed that a higher erosion risk promoted the adoption of SLM practices in a similar area in the Upper Blue Nile basin. This clearly indicates that, when there are few or no shocks, rural households will have more time and labor to invest in SLM practices instead of looking for coping mechanisms to deal with a crisis. Overall, these results showed the varied magnitude and effect of the explanatory variables on the different SLM adoption intensities.

4. Conclusions and Implications

In the Northwestern part of Ethiopia, despite efforts to improve livelihoods of smallholder farmers through promoting their uptake of SLM practices, there is still marked inadequacies of the level of adoption of these strategies and their effect on the sustainability of livelihoods. Rural households always try to diversify their sources of income within and outside of agriculture, and this could be associated with the decision and extent of adopting of certain SLM measures on their farms. There has been a wealth of research evidence available in terms of looking at livelihood diversification and adoption of SLM practices, treating them as separate research topics. However, earlier research works have paid little attention to the links of these two research domains. As a result, this particular study was conducted to be able to extend existing knowledge on this issue.
We used data obtained from a cross-sectional household survey to examine the extent and drivers of livelihoods diversification in the Upper Blue Nile basin of Ethiopia, as well as the effects of diversification on the adoption intensity of SLM practices. In the study sites, for majority of the smallholder farmers, non-farm and off-farm livelihood activities were accounted as supplementary sources to the on-farm livelihoods. The study revealed that crop production, livestock production, charcoaling, khat plantation, transfers, and less capital-intensive activities such as casual daily labor are the most prominent livelihood activities. With more dependents, households tend to choose off-farm and non-farm livelihood strategies. In addition, households’ access to credit was found to favor the probability of selecting on-farm livelihoods. Owning more livestock and being a member of community-based organizations increase the probability of participating in non-farm livelihood strategies. Therefore, for more diversified livelihood strategies, it is important to focus on policies and programs that enhances household’s livestock production and degree of participation in community-based organizations; and for those who opted to stay in agriculture, facilitating financial supports could contribute to sustaining their agricultural livelihood. Better-off households preferred to stay in on-farm, while poor farmers opted for non-farm livelihoods. The results clearly showed the complementary nature of having diversified livelihood strategies and carrying out SLM activities in the study watersheds for a relatively low number of SLM adoptions. While there is heterogeneity of factors which influence the adoption intensity of any of the 10 SLM practices, findings of this study underscore the importance of higher level of education, better access to credit, shock/stress experience, and more livestock wealth on higher adoption intensity of SLM practices. Likewise, agro-ecological heterogeneity also found to have an influence for higher adoption rate in Aba Gerima (mid land) and Dibatie (low land) watersheds.
Overall, the following important conclusions can be drawn. First, despite the availability of few different livelihood activities in the study areas, diversification as such does not contribute to higher overall income. More important is a household’s ability to engage into lucrative sectors with better returns into its livelihood portfolio (e.g., khat production in Aba Gerima and Acacia decurrens charcoal production in Guder). Second, decisions to diversify to another livelihood activity are dependent on the gender of the household head, distance to markets, access to credit and extension services, membership in community-based organizations, dependency ratio, level of income, agro-ecological setting, household size, exposure to shocks, livestock holding, and agricultural intensification. Third, a higher extent of livelihood diversification favors a lower level of adoption of SLM practices, whereas the reverse is true for a higher level of SLM adoption. A prospective look at livelihoods in the context of these factors would likely help households to be able to exploit new economic opportunities more effectively in the future. Experiencing stress/shocks tended to push households toward earning short-term economic gains; this can be seen as a coping strategy, but it is not a sustainable way of promoting livelihoods in these watersheds.
Results have implications for development planners in the Upper Blue Nile basin and elsewhere in the country where rain fed agriculture is predominantly make up the livelihoods of the majority of its population there by diversifying livelihood sources is essentially needed to sustain and promote livelihoods. More emphasis should be given to remunerative livelihoods like Acacia decurrens and khat plantations while not disregarding their environmental and social feasibility. Sustainable livelihood initiatives that focus on increasing access to financial support mechanisms, improved livestock production, quality extension services, and shock/stress resilience mechanisms, while also accounting for agro-ecological differences, are much needed. In this regard, livelihood transformations to cash crops like Acacia decurrens in Guder and khat plantation in Aba Gerima should profoundly be studied as to how they are ecologically, socially and economically feasible. Strengthening policies that encourage positive interplay between diversifying livelihood strategies and SLM practices could help in the attempt to achieve a sustainable agriculture system. This cross-sectional study contributes to the literature of the nexus between rural livelihoods and management of natural resources using three selected watersheds of Upper Blue Nile basin. Hence, further lines of research on a broader location, dynamic links between livelihood diversification and adoption intensity of SLM practices, and economic benefits of SLM practices will be helpful.

Author Contributions

Conceptualization, M.T.A.; Data curation, M.T.A.; Formal analysis, M.T.A.; Funding acquisition, A.T., E.A. and N.H.; Investigation, M.T.A.; Methodology, M.T.A. and Z.N.; Project administration, A.T., E.A., N.H. and Z.N.; Resources, A.T. and N.H.; Supervision, A.T., E.A., N.H., Z.N., Z.A., A.E., D.M. and D.B.; Validation, A.T.; Writing—original draft, M.T.A.; Writing—review & editing, A.T., E.A., N.H., Z.N. and Z.A.

Funding

This research was funded by the Science and Technology Research Partnership for Sustainable Development (SATREPS)—Development of a Next-Generation Sustainable Land Management (SLM) Framework to Combat Desertification project, Grant Number JPMJSA1601, Japan Science and Technology Agency (JST)/Japan International Cooperation Agency (JICA).

Acknowledgments

The authors are grateful to all respondents for their willingness to provide data, and to Anteneh Wubet and Nigus Tadesse for their field assistance.

Conflicts of Interest

The authors declare no potential conflict of interest.

References

  1. FAO. The State of Food Insecurity in the World 2015. Meeting the 2015 International Hunger Targets: Taking Stock of Uneven Progress; FAO: Rome, Italy, 2015; pp. 1–62. [Google Scholar]
  2. UN. The 2015 Revision of the UN’s World Population Projections; Wiley Black well: New York, NY, USA, 2015; pp. 557–561. [Google Scholar]
  3. Rosegrant, M.W.; Cai, X.; Cline, S.A.; Nakagawa, N. The Role of Rainfed Agriculture in the Future of Global Food Production; IFPRI: Washington, DC, USA, 2002. [Google Scholar]
  4. Alobo Loison, S. Rural livelihood diversification in Sub-Saharan Africa: A literature review. J. Dev. Stud. 2015, 51, 1125–1138. [Google Scholar] [CrossRef]
  5. Ellis, F. Rural Livelihoods and Diversity in Developing Countries; Oxford University Press: Oxford, UK, 2000. [Google Scholar]
  6. Ellis, F. Household strategies and rural livelihood diversification. J. Dev. Stud. 1998, 35, 1–38. [Google Scholar] [CrossRef]
  7. Baffoe, G.; Matsuda, H. Why do rural communities do what they do in the context of livelihood activities? Exploring the livelihood priority and viability nexus. Community Dev. 2017, 48, 715–734. [Google Scholar] [CrossRef]
  8. Assan, J.K.; Beyene, F.R. Livelihood impacts of environmental conservation programmes in the Amhara region of Ethiopia. J. Sustain. Dev. 2013, 6, 87–105. [Google Scholar] [CrossRef]
  9. Kassie, G.W. The Nexus between livelihood diversification and farmland management strategies in rural Ethiopia. Cogent Econ. Financ. 2017, 5, 1–16. [Google Scholar] [CrossRef]
  10. Cordingley, J.E.; Snyder, K.A.; Rosendahl, J.; Kizito, F.; Bossio, D. Thinking outside the plot: Addressing low adoption of sustainable land management in sub-Saharan Africa. Curr. Opin. Environ. Sustain. 2015, 15, 35–40. [Google Scholar] [CrossRef]
  11. Daregot, B.; Ayalneh, B.; Belay, K.; Degnet, A. Poverty and Natural Resources Degradation: Analysis of their Interactions in Lake Tana Basin, Ethiopia. J. Int. Dev. 2015, 27, 516–527. [Google Scholar] [CrossRef]
  12. Kassie, M.; Jaleta, M.; Shiferaw, B.; Mmbando, F.; Mekuria, M. Adoption of interrelated sustainable agricultural practices in smallholder systems: Evidence from rural Tanzania. Technol. Forecast. Soc. Chang. 2013, 80, 525–540. [Google Scholar] [CrossRef]
  13. Kelly, P.; Huo, X. Land Retirement and Nonfarm Labor Market Participation: An Analysis of China’s Sloping Land Conversion Program. World Dev. 2013, 48, 156–169. [Google Scholar] [CrossRef]
  14. Lee, D.R. Agricultural sustainability and technology adoption: Issues and policies for developing countries. Am. J. Agric. Econ. 2005, 87, 1325–1334. [Google Scholar] [CrossRef]
  15. Liu, Z.; Lan, J. The sloping land conversion program in China: Effect on the livelihood diversification of rural households. World Dev. 2015, 70, 147–161. [Google Scholar] [CrossRef]
  16. Harcourt, C.; Sayer, J.A. Conservation Atlas of Tropical Forests: The Americas; World Conservation Union and World Conservation Monitoring Centre: Cambridge, UK, 1996. [Google Scholar]
  17. Salafsky, N.; Wollenberg, E. Linking livelihoods and conservation: A conceptual framework and scale for assessing the integration of human needs and biodiversity. World Dev. 2000, 28, 1421–1438. [Google Scholar] [CrossRef]
  18. Babatunde, R.; Olagunju, F.; Fakayode, S.; Adejobi, A. Determinants of participation in off-farm employment among small-holder farming households in Kwara State, Nigeria. Prod. Agric. Technol. 2010, 6, 1–14. [Google Scholar]
  19. Ellis, F. The determinants of rural livelihood diversification in developing countries. J. Agric. Econ. 2000, 51, 289–302. [Google Scholar] [CrossRef]
  20. Kassie, G.W.; Kim, S.; Fellizar, F.P., Jr. Determinant factors of livelihood diversification: Evidence from Ethiopia. Cogent Soc. Sci. 2017, 3, 1–16. [Google Scholar] [CrossRef]
  21. Martin, S.M.; Lorenzen, K. Livelihood diversification in rural Laos. World Dev. 2016, 83, 231–243. [Google Scholar] [CrossRef]
  22. Rahut, D.B.; Ali, A.; Kassie, M.; Marenya, P.P.; Basnet, C. Rural livelihood diversification strategies in Nepal. Poverty Public Policy 2014, 6, 259–281. [Google Scholar] [CrossRef]
  23. Baffoe, G.; Matsuda, H. Understanding the Determinants of Rural Credit Accessibility: The Case of Ehiaminchini, Fanteakwa District. Ghana J. Sustain. Dev. 2015, 8, 183–195. [Google Scholar] [CrossRef]
  24. Baffoe, G.; Matsuda, H.; Nagao, M.; Akiyama, T. The dynamics of rural credit and its impacts on agricultural productivity: An empirical study in rural Ghana. OIDA Int. J. Sustain. Dev. 2014, 7, 19–34. [Google Scholar]
  25. Riithi, A.N.; Irungu, P.; Munei, K. Determinants of Choice of Alternative Livelihood Diversification Strategies in Solio Resettlement Scheme, KENYA; University of Nairobi: Nairobi, Kenya, 2015. [Google Scholar]
  26. Dercon, S.; Krishnan, P. Income portfolios in rural Ethiopia and Tanzania: Choices and constraints. J. Dev. Stud. 1996, 32, 850–875. [Google Scholar] [CrossRef] [Green Version]
  27. Woldehanna, T. Rural farm/nonfarm income linkages in northern Ethiopia. In Promoting Farm/Nonfarm Linkages for Rural Development: Case Studies from Africa and Latin America; FAO: Rome, Italy, 2002; pp. 121–144. [Google Scholar]
  28. Asfaw, A.; Simane, B.; Hassen, A.; Bantider, A. Determinants of non-farm livelihood diversification: Evidence from rainfed-dependent smallholder farmers in northcentral Ethiopia (Woleka sub-basin). Dev. Stud. Res. 2017, 4, 22–36. [Google Scholar] [CrossRef]
  29. Bezu, S.; Holden, S. Are rural youth in Ethiopia abandoning agriculture? World Dev. 2014, 64, 259–272. [Google Scholar] [CrossRef]
  30. Carswell, G. Livelihood diversification: Increasing in importance or increasingly recognized? Evidence from southern Ethiopia. J. Int. Dev. 2002, 14, 789–804. [Google Scholar] [CrossRef]
  31. Davis, B.; Di Giuseppe, S.; Zezza, A. Are African households (not) leaving agriculture? Patterns of households’ income sources in rural Sub-Saharan Africa. Food Policy 2017, 67, 153–174. [Google Scholar] [CrossRef]
  32. Kassie, G.W. Agroforestry and farm income diversification: Synergy or trade-off? The case of Ethiopia. Environ. Syst. Res. 2018, 6, 1–14. [Google Scholar] [CrossRef]
  33. Belay, M.; Bewket, W. Farmers’ livelihood assets and adoption of sustainable land management practices in north-western highlands of Ethiopia. Int. J. Environ. Stud. 2013, 70, 284–301. [Google Scholar] [CrossRef]
  34. Deininger, K.; Jin, S. Tenure security and land-related investment: Evidence from Ethiopia. Eur. Econ. Rev. 2006, 50, 1245–1277. [Google Scholar] [CrossRef]
  35. Holden, S.; Shiferaw, B. Land degradation, drought and food security in a less-favoured area in the Ethiopian highlands: A bio-economic model with market imperfections. Agric. Econ. 2004, 30, 31–49. [Google Scholar] [CrossRef]
  36. Jagger, P.; Pender, J. Impacts of Programs and Organizations on the Adoption of Sustainable Land Management Technologies in Uganda; Environmentand Production Technology Division Discussion Paper No. 101; IFPRI: Washington, DC, USA, 2003; pp. 277–307. [Google Scholar]
  37. Pender, J.; Gebremedhin, B. Determinants of agricultural and land management practices and impacts on crop production and household income in the highlands of Tigray, Ethiopia. J. Afr. Econ. 2007, 17, 395–450. [Google Scholar] [CrossRef]
  38. Berhanu, W.; Colman, D.; Fayissa, B. Diversification and livelihood sustainability in a semi-arid environment: A case study from southern Ethiopia. J. Dev. Stud. 2007, 43, 871–889. [Google Scholar] [CrossRef] [Green Version]
  39. Block, S.; Webb, P. The dynamics of livelihood diversification in post-famine Ethiopia. Food Policy 2001, 26, 333–350. [Google Scholar] [CrossRef]
  40. Canali, M.; Slaviero, F. Food Insecurity and Risk Management of Smallholder Farming Systems in Ethiopia. In Proceedings of the Ninth European IFSA Symposium, Vienna, Austria, 4–7 July 2010; pp. 4–7. [Google Scholar]
  41. Vaitla, B.; Tesfay, G.; Rounseville, M.; Maxwell, D. Resilience and Livelihoods Change in Tigray, Ethiopia; Feinstein International Center, Tufts University: Somerville, MA, USA, 2012. [Google Scholar]
  42. García-Fajardo, B.; Orozco-Hernández, M.E.; McDonagh, J.; Álvarez-Arteaga, G.; Mireles-Lezama, P. Land management strategies and their implications for Mazahua farmers’ livelihoods in the Highlands of Central Mexico. Misc. Geogr. 2016, 20, 5–12. [Google Scholar] [CrossRef]
  43. World Bank. Sustainable Land Management Sourcebook; World Bank: Washington, DC, USA, 2008. [Google Scholar]
  44. Escobal, J. The determinants of nonfarm income diversification in rural Peru. World Dev. 2001, 29, 497–508. [Google Scholar] [CrossRef]
  45. Kowalski, J.; Lipcan, A.; McIntosh, K.; Smida, R.; Sørensen, S.J.; Seff, I.; Jolliffe, D. Nonfarm enterprises in rural Ethiopia: Improving livelihoods by generating income and smoothing consumption? Ethiop. J. Econ. 2016, 25, 171–204. [Google Scholar]
  46. Yona, Y.; Mathewos, T. Assessing challenges of non-farm livelihood diversification in Boricha Woreda, Sidama zone. J. Dev. Agric. Econ. 2017, 9, 87–96. [Google Scholar]
  47. Carswell, G. Livelihood Diversification in Southern Ethiopia; IDS Working Paper 117; Institute of Development Studies: Brighton, UK, 2000. [Google Scholar]
  48. Adgo, E.; Teshome, A.; Mati, B. Impacts of long-term soil and water conservation on agricultural productivity: The case of Anjenie watershed, Ethiopia. Agric. Water Manag. 2013, 117, 55–61. [Google Scholar] [CrossRef]
  49. D’souza, G.; Cyphers, D.; Phipps, T. Factors affecting the adoption of sustainable agricultural practices. Agric. Resour. Econ. Rev. 1993, 22, 159–165. [Google Scholar] [CrossRef]
  50. Haregeweyn, N.; Tsunekawa, A.; Nyssen, J.; Poesen, J.; Tsubo, M.; Tsegaye Meshesha, D.; Schütt, B.; Adgo, E.; Tegegne, F. Soil erosion and conservation in Ethiopia: A review. Prog. Phys. Geogr. 2015, 39, 750–774. [Google Scholar] [CrossRef]
  51. Schmidt, E.; Zemadim, B. Expanding sustainable land management in Ethiopia: Scenarios for improved agricultural water management in the Blue Nile. Agric. Water Manag. 2015, 158, 166–178. [Google Scholar] [CrossRef]
  52. Teklewold, H.; Kassie, M.; Shiferaw, B. Adoption of multiple sustainable agricultural practices in rural Ethiopia. J. Agric. Econ. 2013, 64, 597–623. [Google Scholar] [CrossRef]
  53. Nigussie, Z.; Tsunekawa, A.; Haregeweyn, N.; Adgo, E.; Nohmi, M.; Tsubo, M.; Aklog, D.; Meshesha, D.T.; Abele, S. Factors influencing small-scale farmers’ adoption of sustainable land management technologies in north-western Ethiopia. Land Use Policy 2017, 67, 57–64. [Google Scholar] [CrossRef]
  54. Adimassu, Z.; Kessler, A.; Hengsdijk, H. Exploring determinants of farmers’ investments in land management in the Central Rift Valley of Ethiopia. Appl. Geogr. 2012, 35, 191–198. [Google Scholar] [CrossRef]
  55. Bezu, S.; Barrett, C.B.; Holden, S.T. Does the nonfarm economy offer pathways for upward mobility? Evidence from a panel data study in Ethiopia. World Dev. 2012, 40, 1634–1646. [Google Scholar] [CrossRef]
  56. World Bank. Determinants of the Adoption of Sustainable Land Management Practices and Their Impacts in the Ethiopian Highlands Public; World Bank: Washington, DC, USA, 2007; Volume 1, pp. 1–23. [Google Scholar]
  57. Ebabu, K.; Tsunekawa, A.; Haregeweyn, N.; Adgo, E.; Meshesha, D.T.; Aklog, D.; Masunaga, T.; Tsubo, M.; Sultan, D.; Fenta, A.A. Analyzing the variability of sediment yield: A case study from paired watersheds in the Upper Blue Nile basin, Ethiopia. Geomorphology 2018, 303, 446–455. [Google Scholar] [CrossRef]
  58. Sultan, D.; Tsunekawa, A.; Haregeweyn, N.; Adgo, E.; Tsubo, M.; Meshesha, D.T.; Masunaga, T.; Aklog, D.; Fenta, A.A.; Ebabu, K. Efficiency of soil and water conservation practices in different agro-ecological environments in the Upper Blue Nile Basin of Ethiopia. J. Arid Land 2018, 10, 249–263. [Google Scholar] [CrossRef] [Green Version]
  59. Dedehouanou, S.F.A.; Araar, A.; Ousseini, A.; Harouna, A.L.; Jabir, M. Spillovers from off-farm self-employment opportunities in rural Niger. World Dev. 2018, 105, 428–442. [Google Scholar] [CrossRef] [Green Version]
  60. Shiferaw, K.; Gebremedhin, B.; Legesse, D. Factors Determining Household Allocation of Credit to Livestock Production in Ethiopia; LIVES Working Paper 21; International Livestock Research Institute (ILRI): Nairobi, Kenya, 2016; pp. 1–33. [Google Scholar]
  61. Mutyasira, V.; Hoag, D.; Pendell, D.; Manning, D. Is sustainable intensification possible? Evidence from Ethiopia. Sustainability 2018, 10, 4174. [Google Scholar] [CrossRef]
  62. Berjan, S.; El Bilali, H.; Sorajic, B.; Driouech, N.; Despotovic, A.; Simic, J. Off-farm and non-farm activities development in rural south-eastern Bosnia. Int. J. Environ. Rural Dev. 2013, 4, 130–135. [Google Scholar]
  63. Buckley, J.J. Stochastic dominance: An approach to decision making under risk. Risk Anal. 1986, 6, 35–41. [Google Scholar] [CrossRef]
  64. Johny, J.; Wichmann, B.; Swallow, B.M. Characterizing social networks and their effects on income diversification in rural Kerala, India. World Dev. 2017, 94, 375–392. [Google Scholar] [CrossRef]
  65. Nagendra, H. Opposite trends in response for the Shannon and Simpson indices of landscape diversity. Appl. Geogr. 2002, 22, 175–186. [Google Scholar] [CrossRef]
  66. Khatun, D.; Roy, B.C. Rural livelihood diversification in West Bengal: Nature and extent. Agric. Econ. Res. Rev. 2016, 29, 183–190. [Google Scholar] [CrossRef]
  67. Djido, A.I.; Shiferaw, B.A. Patterns of labor productivity and income diversification–Empirical evidence from Uganda and Nigeria. World Dev. 2018, 105, 416–427. [Google Scholar] [CrossRef]
  68. Smith, B.; Wilson, J.B. A consumer’s guide to evenness indices. Oikos 1996, 76, 70–82. [Google Scholar] [CrossRef]
  69. Brezina, I.; Pekár, J.; Čičková, Z.; Reiff, M. Herfindahl–Hirschman index level of concentration values modification and analysis of their change. Cent. Eur. J. Oper. Res. 2016, 24, 49–72. [Google Scholar] [CrossRef]
  70. Kau, P.; Hill, L. Application of Multivariate Probit to a Threshold Model of Grain Dryer Purchasing Decisions. Am. J. Agric. Econ. 1973, 55, 19–27. [Google Scholar]
  71. Velandia, M.; Rejesus, R.M.; Knight, T.O.; Sherrick, B.J. Factors affecting farmers’ utilization of agricultural risk management tools: The case of crop insurance, forward contracting, and spreading sales. J. Agric. Appl. Econ. 2009, 41, 107–123. [Google Scholar] [CrossRef]
  72. Greene, W.H. Econometric Analysis, 5th ed.; Prentice-Hall: Englewood Cliffs, NJ, USA, 2003. [Google Scholar]
  73. Cappellari, L.; Jenkins, S.P. Multivariate probit regression using simulated maximum likelihood. Stata J. 2003, 3, 278–294. [Google Scholar] [CrossRef]
  74. Wollni, M.; Lee, D.R.; Thies, J.E. Conservation agriculture, organic marketing, and collective action in the Honduran hillsides. Agric. Econ. 2010, 41, 373–384. [Google Scholar] [CrossRef]
  75. Abdulai, A.; Huffman, W. The adoption and impact of soil and water conservation technology: An endogenous switching regression application. Land Econ. 2014, 90, 26–43. [Google Scholar] [CrossRef]
  76. Rivers, D.; Vuong, Q.H. Limited information estimators and exogeneity tests for simultaneous probit models. J. Econ. 1988, 39, 347–366. [Google Scholar] [CrossRef] [Green Version]
  77. FAO. Small Family Farms Country Factsheet; FAO: Rome, Italy, 2012; pp. 1–2. [Google Scholar]
  78. Alemu, K.S. Contribution of khat kellas and the impacts of its closure to Ethiopian economy (the case of Hararghe khat kella). Glob. J. Manag. Bus. Res. 2015, XV, 21–29. [Google Scholar]
  79. Dachew, B.A.; Bifftu, B.B.; Tiruneh, B.T. Khat use and its determinants among university students in northwest Ethiopia: A multivariable analysis. Int. J. Med. Sci. Public Health 2015, 4, 319–323. [Google Scholar] [CrossRef]
  80. Nigussie, Z.; Tsunekawa, A.; Haregeweyn, N.; Adgo, E.; Nohmi, M.; Tsubo, M.; Aklog, D.; Meshesha, D.T.; Abele, S. Factors affecting small-scale farmers’ land allocation and tree density decisions in an acacia decurrens-based taungya system in Fagita Lekoma District, North-Western Ethiopia. Small-scale For. 2017, 16, 219–233. [Google Scholar] [CrossRef]
  81. Achamyeleh, K. Integration of Acacia Decurrens (J.C. Wendl.) Willd. into the Farming System, It’s Effects on Soil Fertility and Comparative Economic Advantages in North Western Ethiopia; Bahir Dar University: Bahir Dar, Ethiopia, 2015. [Google Scholar]
  82. Ragasa, C.; Berhane, G.; Tadesse, F.; Taffesse, A.S. Gender differences in access to extension services and agricultural productivity. J. Agric. Educ. Ext. 2013, 19, 437–468. [Google Scholar] [CrossRef]
  83. Eswaran, M.; Kotwal, A. Access to capital and agrarian production organisation. Econ. J. 1986, 96, 482–498. [Google Scholar] [CrossRef]
  84. Ellis, F.; Bahiigwa, G. Livelihoods and rural poverty reduction in Uganda. World Dev. 2003, 31, 997–1013. [Google Scholar] [CrossRef]
  85. Kung, J.K.; Lee, Y.-F. So what if there is income inequality? The distributive consequence of nonfarm employment in rural China. Econ. Dev. Cult. Chang. 2001, 50, 19–46. [Google Scholar] [CrossRef]
  86. Jiao, X.; Pouliot, M.; Walelign, S.Z. Livelihood strategies and dynamics in rural Cambodia. World Dev. 2017, 97, 266–278. [Google Scholar] [CrossRef]
  87. Mulwa, C.; Marenya, P.; Kassie, M. Response to climate risks among smallholder farmers in Malawi: A multivariate probit assessment of the role of information, household demographics, and farm characteristics. Clim. Risk Manag. 2017, 16, 208–221. [Google Scholar] [CrossRef]
  88. Mentamo, M.; Geda, N.R. Livelihood diversification under severe food insecurity scenario among smallholder farmers in Kadida Gamela District, Southern Ethiopia. Kontakt 2016, 18, e258–e264. [Google Scholar] [CrossRef]
  89. Chikobola, M.M.; Sibusenga, M. Employment and Income Sources: Key Determinants of Off-Farm Activity Participation Among Rural Households in Northern Zambia. J. Agric. Econ. 2016, 1, 91–98. [Google Scholar]
  90. Alobo Loison, S.; Bignebat, C. Patterns and determinants of household income diversification in rural Senegal and Kenya. J. Poverty Alleviation Int. Dev. 2017, 8, 93–126. [Google Scholar]
  91. Sallawu, H.; Tanko, L.; Nmadu, J.; Ndanitsa, A. Determinants of income diversification among farm households in niger State, Nigeria. Russ. J. Agric. Socio-Econ. Sci. 2016, 50, 55–65. [Google Scholar] [CrossRef]
  92. Gautam, Y.; Andersen, P. Rural livelihood diversification and household well-being: Insights from Humla, Nepal. J. Rural Stud. 2016, 44, 239–249. [Google Scholar] [CrossRef] [Green Version]
  93. Dercon, S. Income risk, coping strategies, and safety nets. World Bank Res. Obs. 2002, 17, 141–166. [Google Scholar] [CrossRef]
  94. Kasie, T.A.; Adgo, E.; Botella, A.G.; García, I.G. Measuring resilience properties of household livelihoods and food security outcomes in the risky environments of Ethiopia. Iberoam. J. Dev. Stud. 2018, 7, 52–80. [Google Scholar] [CrossRef]
  95. Kijima, Y.; Matsumoto, T.; Yamano, T. Nonfarm employment, agricultural shocks, and poverty dynamics: Evidence from rural Uganda. Agric. Econ. 2006, 35, 459–467. [Google Scholar] [CrossRef]
  96. Newhouse, D. The persistence of income shocks: Evidence from rural Indonesia. Rev. Dev. Econ. 2005, 9, 415–433. [Google Scholar] [CrossRef]
  97. Sanders, C.; McKay, K. Where have all the young men gone? Social fragmentation during rapid neoliberal development in Nepal’s Himalayas. Hum. Organ. 2014, 73, 25–37. [Google Scholar] [CrossRef]
  98. Verkaart, S.; Orr, A.; Harris, D.; Claessens, L. Intensify or Diversify? Agriculture as a Pathway from Poverty in Eastern Kenya; Series Paper Number 40; ICRISAT: Nairobi, Kenya, 2017. [Google Scholar]
  99. Tesfaye, Y.; Roos, A.; Campbell, B.M.; Bohlin, F. Livelihood strategies and the role of forest income in participatory-managed forests of Dodola area in the bale highlands, southern Ethiopia. For. Policy Econ. 2011, 13, 258–265. [Google Scholar] [CrossRef]
  100. Peng, W.; Zheng, H.; Robinson, B.; Li, C.; Wang, F. Household livelihood strategy choices, impact factors, and environmental consequences in Miyun reservoir watershed, China. Sustainability 2017, 9, 175. [Google Scholar] [CrossRef]
  101. Amare, D. Determinants of livelihood diversification strategies in Borena pastoralist communities of Oromia regional state, Ethiopia. Agric. Food Secur. 2018, 7, 41. [Google Scholar]
  102. Robaa, B.; Tolossa, D. Rural livelihood diversification and its effects on household food security: A case study at Damota Gale Woreda, Wolayta, Southern Ethiopia. East. Afr. Soc. Sci. Res. Rev. 2016, 32, 93–118. [Google Scholar] [CrossRef]
  103. Addisu, Y. Livelihood strategies and diversification in western tip pastoral areas of Ethiopia. Pastor. Res. Policy Pract. 2017, 1–9. [Google Scholar] [CrossRef]
  104. Gebrehiwot, G. Determinants of livelihood diversification strategies in Eastern Tigray Region of Ethiopia. Agric. Food Secur. 2018, 7, 1–9. [Google Scholar]
  105. DFID of UK. Sustainable Livelihoods Guidance Sheets; DFID: London, UK, 1999; p. 445.
  106. Aryal, J.P.; Jat, M.; Sapkota, T.B.; Khatri-Chhetri, A.; Kassie, M.; Rahut, D.B.; Maharjan, S. Adoption of multiple climate-smart agricultural practices in the Gangetic plains of Bihar, India. Int. J. Clim. Chang. Strateg. Manag. 2018, 10, 407–427. [Google Scholar] [CrossRef]
  107. Nguyen, T.T.; Nguyen, L.D.; Lippe, R.S.; Grote, U. Determinants of farmers’ land use decision-making: Comparative evidence from Thailand and Vietnam. World Dev. 2017, 89, 199–213. [Google Scholar] [CrossRef]
Figure 1. Location map of the study area.
Sustainability 11 02991 g001
Figure 2. Average annual income from major livelihood activities in the study watersheds.
Sustainability 11 02991 g002
Figure 3. Household livelihood opportunity preferences in the study watersheds.
Sustainability 11 02991 g003
Figure 4. Cumulative density curve (CDV) for major livelihood activities in the study watersheds.
Sustainability 11 02991 g004
Figure 5. Major sustainable land management (SLM) practices in the study watersheds.
Sustainability 11 02991 g005
Table 1. Description of the independent variables used in the analysis.
Explanatory Variable Definition/DescriptionScaleHypothesized Relationship with Livelihood Strategies Hypothesized Relationship with Adoption of SLM PracticesReferences
Gender Gender of household headBinomial, 1 if male+[19,53]
AgeAge of household headMetric, in years++/−[19,52]
Grade Education level of household head Metric, in years of schooling ++[19,52]
Household sizeNumber of individuals in householdMetric, in person++/−[5,19,52]
Dependency ratioRatio of household members aged 0–14 and 65+ years to those aged 15–64 yearsMetric, in person++[9,19]
Distance to marketDistance from home to nearest district marketMetric, in km+/−[19,52]
Land sizeLand size operated by household Metric, in ha+/−+[19,27,53]
Tenure Land ownership or tenure typeBinomial, 1 if owned by farmer+/−+[12,19,29,53]
Land for food securityPerception of and’s contribution to household’s food security Binomial, 1 if yes+[29,59]
Access to credit Household received credit Binomial, 1 if yes++/−[19,23,24,52,60]
Access to extension serviceHousehold received agricultural and non-agricultural extension service Binomial, 1 if yes+/−+/−[12,19]
Membership in CBOsHousehold is member of local level community-based organizationsBinomial, 1 if member++[12,19,52]
Household income Total income obtained by household Metric, in ETB+/−+/−[19,52]
Asset value Total monetary value of assets owned by householdMetric, in ETB++[12,19]
Aggregate stress/shockExtent of severity of shocks experienced by household during the last 6 years Metric, in number+/−[12,19,56]
Livestock sizeLivestock size owned by householdMetric, in tropical livestock unit+/−+/−[19,27]
IntensificationIntensification achieved by household during the yearBinomial, 1 if high+/−+/−[19,24,61]
Agro-ecologyStudy location (agro-ecological zones representing high-, mid-, and lowlands) Binomial, 1 if Aba Gerima; 1 if Guder; 1 if Dibatie+/−+/−[19,52]
Table 2. Descriptive statistics of socio-economic characteristics, by watershed (n = 270).
Explanatory Variables Whole SampleAba GerimaGuderDibatie Test
Gender0.811(0.41)79 (11)60 (30)79 (11)b ***
Age49 (12.9)47 (11.5)51 (12.3)50 (14.3)a *
Grade1.3 (2.9)0.53 (1.56)1.6 (3.20)1.76 (3.47)a **
Household size5.38 (2.34)4.65 (2.61)5.55 (2.08)5.92 (2.11)a ***
Dependency ratio71.19 (12.79)72.67 (11.87)70.42 (13.33)70.46 (13.11)
Distance to market9.5 (6.7)14.33 (5)6.84 (4.40)7.37 (7.35))a ***
Land size1.03 (0.76)1.25 (0.70)0.91(0.58)0.93 (0.92)a ***
Tenure 0.77 (0.42)76 (14)78 (12)55 (35)b ***
Land for food security0.59 (0.49)69 (21)67 (23)68 (22)b ***
Access to credit 0.56 (0.50)55 (35)53 (37)42 (28)
Access to extension service0.70 (0.46)76 (14)48 (42)64 (26)b ***
Membership in CBOs0.51 (0.50)54 (36)63 (27)20 (70)b ***
Household Income10,758 (13,021)9109 (8502)12,425 (18,649)10,742 (9321)a **
Asset value 1919 (4191)2771 (4224)1598 (3638)1389.58 (4572)a ***
Aggregate stress/shock0.52 (0.20)0.60 (0.14)0.45 (0.23)0.51 (0.18)a ***
Livestock size3.97 (0.49)3.84 (2.20)3.52 (2.38)4.52 (2.67)a **
Intensification0.42 (0.50)0.69 (0.47)0.21 (0.41)0.37 (0.41)b ***
Note: * Significant at 10%, ** significant at 5%, *** significant at 1%; standard deviations in parentheses; a non-parametric two-sample test: Wilcoxon’s rank-sum test, b Chi-squared test.
Table 3. Pair-wise correlation coefficients across livelihood strategies.
Livelihood StrategyCoefficientStandard Errorp-Value
ρ21−0.5880.0970.000
ρ31−0.7040.0850.000
ρ320.2330.1480.034
Note: ρ21 = ρ(off-farm, on-farm), ρ31 = ρ(non-farm, on-farm), ρ32 = ρ(non-farm, off-farm).
Table 4. Multivariate probit regression results.
Outcome Variables
Variables On-farmOff-farmNon-farm
Gender 0.557 ** (0.281)0.191 (0.284)−0.252 (0.245)
Age 0.006 (0.008)0.008 (0.008)−0.005 (0.007)
Grade−0.045 (0.033)0.056 (0.035)0.030 (0.031)
Household size0.033 (0.050)0.021 (0.050)−0.083 * (0.044)
Dependency ratio−0.040 *** (0.009)0.027 *** (0.008)0.020 ** (0.008)
Distance to market−0.136 (0.122)−0.275 ** (0.114)0.205 ** (0.102)
Land size−0.124 (0.140)−0.232 (0.149)−0.102 (0.136)
Tenure 0.118 (0.259)−0.049 (0.236)0.090 (0.214)
Land for food security −0.0271 (0.241)0.200 (0.220)−0.225 (0.200)
Access to credit 0.480 ** (0.195)−0.133 (0.188)−0.036 (0.178)
Access to extension services −0.262 (0.214)0.442 ** (0.216)−0.056 (0.204)
Membership in CBOs0.251 (0.214)−0.188 (0.204)0.700 *** (0.206)
Household income0.185 * (0.103)−0.106 (0.097)−0.221 ** (0.090)
Asset value0.002 (0.105)−0.080 (0.103)−0.002 (0.100)
Aggregate stress/shock−0.164 (0.552)0.956 ** (0.502)−0.655 (0.468)
Livestock size−0.029 (0.045)0.005 (0.046)0.096 ** (0.045)
Intensification0.536 ** (0.253)−0.231 (0.207)−0.156 (0.202)
Aba Gerima −0.393 (0.361)0.614 ** (0.301)0.591 ** (0.294)
Dibatie −0.010 (0.340)−0.216 (0.302)1.253 *** (0.291)
Constant1.762 (1.350)−2.187 * (1.303)−0.352 (1.192)
Wald χ2 (df) 134.44 (400)
Prob. > χ2<0.001
n270
Note: Standard errors are given in parentheses. Likelihood ratio test of overall error terms correlation: ρ21 (off-farm, on-farm) = ρ31 (non-farm, on-farm) = ρ32 (non-farm, off-farm) = 0: χ2 (3) = 47.8868, Prob > χ2 < 0.001. Significance levels are indicated as follows: * 10%, ** 5%, *** 1%.
Table 5. Estimates of the ordered probit model and marginal effects.
SLM IntensityMarginal Effects for Each OutcomeCoeff
Pr(Y = 0/X)Pr(Y = 1/X)Pr(Y = 2/X)Pr(Y = 3/X)Pr(Y = 4/X)Pr(Y = 5/X)Pr(Y = 6/X)Pr(Y = 7/X)Pr(Y = 8/X)Pr(Y = 9/X)Pr(Y = 10/X)
Livelihood diversity0.030 *0.053 **0.073 **0.093 **0.024−0.073 **−0.056 **−0.090 **−0.026 *−0.007−0.010−0.701 **
(0.020)(0.028)(0.037)(0.045)(0.018)(0.036)(0.029)(0.044)(0.016)(0.006)(0.008)(0.332)
Gender−0.017 *−0.032 *−0.044 *−0.056 **−0.0140.044 *0.034 **0.054 **0.015 *0.0040.0060.424 **
(0.010)(0.017)(0.024)(0.030)(0.0116)(0.024)(0.018)(0.028)(0.009)(0.004)(0.005)(0.211)
Age−0.000−0.000−0.000−0.000−0.0000.0000.0000.0000.0000.0000.0000.003
(0.000)(0.000)(0.000)(0.001)(0.000)(0.001)(0.000)(0.001)(0.000)(0.000)(0.000)(0.005)
Grade−0.002 **−0.004 **−0.006 **−0.008 **−0.0020.006 **0.005 **0.007 **0.002 *0.0010.0010.057 **
(0.001)(0.002)(0.003)(0.003)(0.001)(0.003)(0.002)(0.003)(0.001)(0.000)(0.001)(0.025)
Household size−0.003 *−0.005 **−0.007 **−0.009 **−0.0020.007 **0.005 **0.009 **0.0020.0010.0010.067 **
(0.002)(0.003)(0.003)(0.004)(0.002)(0.003)(0.003)(0.004)(0.002)(0.001)(0.001)(0.031
Dependency ratio0.0000.0000.0010.0010.000−0.001−0.000−0.001−0.000−0.000−0.000−0.005
(0.000)(0.000)(0.001)(0.001)(0.000)(0.001)(0.000)(0.001)(0.000)(0.000)(0.000)(0.005)
Distance to market 0.0040.0080.0110.0130.003−0.011−0.008−0.013−0.004−0.001−0.001−0.101
(0.003)(0.006)(0.008)(0.011)(0.003)(0.008)(0.006)(0.010)(0.003)(0.001)(0.001)(0.077)
Land size−0.002−0.003−0.005−0.006−0.0020.0050.0040.0060.0020.0000.0010.047
(0.004)(0.007)(0.010)(0.013)(0.003)(0.010)(0.008)(0.012)(0.003)(0.001)(0.002)(0.095
Tenure 0.0100.0180.0260.0330.008−0.026−0.020−0.031−0.009−0.002−0.004−0.246
(0.008)(0.013)(0.018)(0.023)(0.008)(0.018)(0.014)(0.022)(0.007)(0.002)(0.003)(0.167)
Land for food security −0.001−0.001−0.002−0.002−0.0010.0020.0010.0020.0010.0000.0000.018
(0.007)(0.012)(0.017)(0.022)(0.006)(0.017)(0.013)(0.021)(0.006)(0.002)(0.002)(0.164)
Access to credit−0.016 **−0.030 **−0.041 **−0.053 ***−0.0140.041 **0.032 **0.051 **0.015 **0.0040.0060.398 ***
(0.009)(0.012)(0.016)(0.020)(0.010)(0.016)(0.013)(0.020)(0.008)(0.003)(0.004)(0.14)
Access to extension services−0.006−0.011−0.016−0.020−0.0050.0160.0120.0190.0050.0010.0020.151
(0.007)(0.011)(0.016)(0.020)(0.006)(0.016)(0.012)(0.019)(0.006)(0.002)(0.003)(0.149)
Membership in CBOs−0.004−0.008−0.011−0.014−0.0040.0110.0090.0140.0040.0010.0020.108
(0.006)(0.011)(0.015)(0.019)(0.005)(0.015)(0.011)(0.018)(0.005)(0.002)(0.002)(0.14)
Household income0.0040.0070.0090.0120.003−0.009−0.007−0.011−0.003−0.001−0.001−0.088
(0.003)(0.005)(0.008)(0.010)(0.003)(0.008)(0.006)(0.009)(0.003)(0.001)(0.001)(0.072)
Asset value0.0020.0040.0060.0080.002−0.006−0.005−0.008−0.002−0.001−0.001−0.06
(0.003)(0.005)(0.007)(0.009)(0.003)(0.007)(0.005)(0.008)(0.002)(0.001)(0.001)(0.065)
Aggregate stress/shock−0.046 **−0.083 **−0.116 **−0.147 **−0.0380.116 **0.089 **0.142 **0.041 **0.0110.0161.113 ***
(0.018)(0.037)(0.050)(0.063)(0.028)(0.050)(0.040)(0.056)(0.021)(0.008)(0.011)(0.422)
Livestock size−0.002−0.004 *−0.006 *−0.008 *−0.0020.006 *0.005 **0.007 **0.0020.0010.0010.057 *
(0.001)(0.002)(0.003)(0.004)(0.002)(0.003)(0.003)(0.004)(0.001)(0.000)(0.001)(0.03)
Aba Gerima−0.023 **−0.043 **−0.059 **−0.075 **−0.0190.059 **0.046 **0.073 **0.021 *0.0060.0080.568 **
(0.011)(0.021)(0.029)(0.035)(0.014)(0.028)(0.022)(0.033)(0.011)(0.005)(0.006)(0.247)
Dibatie−0.025 **−0.046 **−0.064 **−0.081 **−0.0210.064 **0.049 **0.0780 **0.022 **0.0060.0090.611 ***
(0.011)(0.020)(0.026)(0.031)(0.014)(0.027)(0.021)(0.030)(0.010)(0.005)(0.006)(0.217)
n = 270; Wald χ2(20) = 113.92; Prob > χ2 < 0.001; Pseudo R2 = 0.0888; Robust standard errors are given in parentheses. *** p < 0.01, ** p < 0.05, * p < 0.1. Marginal effects (dy/dx) are calculated at the mean for continuous variables and for a discrete change from 0 to 1 for dummy variables.

