Rural–Urban Gradients and Human Population Dynamics
by
Javier Montalvo
1,2, 
Enrique Ruiz-Labrador
2,
Pablo Montoya-Bernabéu
2 and
Belén Acosta-Gallo
2,3,* 1
Faculty of Biology, University of Vigo, 36310 Vigo, Spain
2
The Matrix Foundation, University of Vigo Campus, 36310 Vigo, Spain
3
Faculty of Biological Sciences, Complutense University of Madrid, 28040 Madrid, Spain
*
Author to whom correspondence should be addressed.
Sustainability 2019, 11(11), 3107; https://0-doi-org.brum.beds.ac.uk/10.3390/su11113107
Submission received: 18 April 2019
/
Revised: 21 May 2019
/
Accepted: 28 May 2019
/
Published: 1 June 2019
(This article belongs to the Section Sustainability in Geographic Science)
Abstract
:Rural–urban gradients offer an appropriate ecological framework for understanding relevant social issues to sustainability and policy planning. We tested the hypothesis that human population growth rate at a local scale is indirectly driven by spatial and rurality gradients, which can be applied to cultural landscapes in Mediterranean Europe. The whole of local administrative/spatial units of Spain—8125 municipalities—, previously classified into five categories along a rural–urban gradient, was used as a case study. Several geospatial patterns and associations among local average per capita population growth rate, population mean age, road accessibility, and other environmental and landscape variables linked to rurality gradients were identified by means of geographic information system (GIS) and multivariate statistics. Regression analysis was used to assess the relationship between population size changes through time and other demographic and territorial variables. Population growth rate was associated with road accessibility and rurality gradient, supporting the established hypothesis. Short-term population growth or decline was directly driven by population mean age. A visual hypothesized model of local population growth rate based on empirical evidence is presented. The results are useful for decision-makers, from local land management interventions to developing strategies and policies to address the demographic challenge.
1. Introduction
The increase in world human population size is a concern for global sustainability [1]. As Meadows et al. clearly explained [2], the Earth is finite, and hence human population growth cannot continue forever because of limits in the energy and material flows needed to keep these dynamics and the associated rates of natural resource consumption and emission of wastes without exceeding the Earth ecological carrying capacity, i.e., its capacity of self-maintenance and self-regulation [3,4].
The rate of growth of the world population was always quite less than 1% up to 1800, increased in the 20th century with a maximum of 2.1% in 1962, and since then is slowing down, with a projected growth rate of 0.1% for 2100 [5]. While world population size is expected to increase and peaks near 10,000 million people at the end of the twenty-first century, in recent decades there has been a concern for an opposite trend, the population decline in some regions of the world [6]. During the last 50 years, the population growth rate in the European Union (EU) showed a downward trend, reaching negative average values at national level in the period 2004–2013 in 10 out of 28 EU countries [7].
The United Nations Economic Commission for Europe (UNECE), considered population dynamics as a relevant issue [8]. Future review and follow-up of the International Conference on Population and Development (ICPD) Programme of Action ahead of the 25th anniversary in 2019 will be aligned with the 2030 Agenda on Sustainable Development. UNECE highlights three population change trends, among others: (i) life expectancy increase; (ii) population ageing: people aged 65 years and older projected to be the 18% of total UNECE population by 2030; and (iii) population decline in 20 of the 56 UNECE member States by 2030. UNECE recognizes that some population and development problems have not been researched enough yet. Hence, better integration of population dynamics into development planning at national and subnational levels is relevant to comprehensively react to demographic change and its implications.
There is a concern about demographic changes at the EU level. In 2015, the Federal Government of Germany further developed the comprehensive demographic strategy of 2012 [9]. One of its goals was to promote equivalent living conditions and a high quality of life in rural and urban areas affected differently by demographic changes. In 2017, the National Government of Spain created the Government Commissioner for the Demographic Challenge, concerned about the depopulation of large parts of the territory and the national population decline projections in more than half a million inhabitants in 2031 and more than five million of inhabitants in 2066 [10]. The Government of Spain is now preparing a National Strategy on the Demographic Challenge. In March 2019 there was an approval of the general guidelines for this strategy.
Another relevant spatial demographic change is that population growth trends are different in urban and rural areas [11]. The average annual growth rate of the rural population is declining in all world regions and is expected to change to about –2% by the year 2025 in Europe. Ageing is particularly prevalent in rural areas of Europe, and rural depopulation is mostly located in Southern Europe [12]. Rural population is expected to decrease by 18.5% from 2015 to 2030 in Southern Europe, representing then only 24.6% of the total population [13]. Rural depopulation in EU countries is clearly identified as a negative phenomenon both, in their national sustainable development strategies and national rural development programmes, which document an array of measures against this demographic change, which is cause and consequence of population ageing, as well as migration in some eastern countries [14].
Population studies and their applicability to address sustainability issues cannot be insensitive to spatial context [15]. Rural cultural landscapes express the historical relationship between the environmental components of the territory and the interactions with the human community that shaped land-cover and preserved the variety and value of ecosystem services [16,17]. Urban land-use expansion is driven by population growth [18,19]. Urbanization and farmland abandonment are processes closely related to local population dynamics and promote landscape changes that threatens biodiversity and cultural landscapes in Europe [20].
Some modern perspectives define rural areas as hybrid or networked spaces characterized by multiple flows and dependencies linking urban areas and countryside [21]. Rural–urban gradients provide an appropriate framework both for understanding patterns of land-use changes and socio-ecological interactions [22]. The International Council on Monuments and Sites (ICOMOS), an organization that promotes conservation and protection of cultural heritage places around the world, encourages knowledge generation about rural areas and landscapes, and comparisons at all levels given the current transformation derived from demographic and global changes [23].
Spatial scale is critical for understanding human–environment interactions [24]. The total human population of a relatively large country is merely an aggregate of local populations. Population changes through time are not uniform within any country. Changes in the national total population mask local population changes, particularly if the spatial distribution of the population is very uneven across the country, as is common by population concentration in urban areas. In fact, most of the territory of some Southern European countries shows population decline, i.e., negative growth rate at the local level [25], regardless of the trend of change in population size nationwide.
Though seeking to explain spatial heterogeneity in population growth rate seems to require extraordinary efforts, this research deserves priority attention to address current demographic challenges. Four broad types of driving factors influence population change: demographic characteristics, socioeconomic conditions, accessibility and environmental/landscape attributes [26,27,28]. These drivers can produce different effects through time and across space, hence understanding population change is complex and requires transdisciplinary knowledge [29]. Often, changes in population size along time in local spatial units of a country are described, at best, simply by means of maps and without delving into the underlying factors of heterogeneity that shows. While description is valuable, an appropriate appraisal of the spatial relevance of population dynamics and potential drivers for land planning at different spatial scales should be implemented.
It is difficult to make comparisons on trends of change in population size and ascertain driving factors [30]. Since 1961 to 2011, local population size changes in Southern Europe was linked to migration and ageing [31], and to land-use and socioeconomic changes related to urbanization processes and rural abandonment [25]. Understanding population changes are quite often conditioned by a restrictive study scope, be it a territory or region of relatively small extension, or a specific category of territory (for example, urban, metropolitan or rural areas). The study of local population changes in large territories is a challenge per se due to the enormous spatial variability of potential driving factors. Some important drivers in a local or regional geographic area might be less determinant or completely irrelevant elsewhere. Besides, population changes in rural areas are very heterogeneous and sometimes fluctuating, partly due to their relatively small population size [32].
Considering all the arguments presented, there is a clear gap in current knowledge about local population changes across a broad geographic context. Filling this research gap is convenient to formally address nationwide demographic trends of local populations [33]. Informed policymaking on demographic issues requires new approaches that understand the network of interactions among local population dynamics and land-uses, environment variables and other potential drivers [27,28,34]. This paper attempts to fill this gap by describing geospatial patterns in human population growth rate and examining population dynamics and its potential driving factors together. This study provides a simple preliminary framework for a wall-to-wall understanding of the different local population changes using Spain as a representative and appropriate country for this research goal.
The aim of the paper is to test, through a case study, the hypothesis that human population growth rate at a local scale is indirectly driven by spatial and rurality gradients. This hypothesis can be applied to Southern Europe countries with cultural landscapes. The assumption of this hypothesis is both, presence of a wide environmental variability within a large extension territory, and complex interdependence among human population variables (density, age structure, and dynamics) and extrinsic variables (environmental characteristics, land-cover/uses, others spatial variables) at a local scale.
We analysed spatial variability in human population growth rate of local administrative units of Spain (8125 municipalities) and potential drivers of change. The main results presented are the following. First, the average annual population growth rate of each municipality along a recent period (2007–2016) was calculated and mapped. Second, the main trends associated with population growth rate changes at a local scale were identified by means of a multivariate analysis. Third, road accessibility of each municipality was estimated and mapped, and variation in average values along a rural–urban gradient of municipalities was described. And fourth, the relationship between population growth rate, population mean age and spatial variables were examined by regression analysis. While the influence of population mean age was statistically significant, spatial patterns of rurality and road accessibility were also relevant potential drivers of population change. Finally, a simple visual hypothesized model of drivers of population growth rate at local scale is presented.
2. Materials and Methods
2.1. Study Area
The study area is the whole territory of Spain, the fourth largest country of Europe, with a total land area of 505,253.2 km2. Of the country’s land, 97.5% is located in the Iberian Peninsula, and the rest constitutes Balearic Islands in the Mediterranean Sea and Canary Islands in the Atlantic Ocean, both inhabited. The territory of Spain is subdivided into 8125 local administrative units (municipalities) in total. A municipality is the single and most relevant spatial unit for political decision-makers at a local scale. The Spanish population is around 46.6 million inhabitants, though Spain is the least populated country of Southern Europe [35]. Spain population density is lower than 100 inhabitants/km2, but the spatial distribution of the population is very unequal (Table 1), due to rural–urban spatial gradients throughout Spain’s territory [36,37]. There is a very accentuated rural territory (extreme and intense rural) that corresponds to 33.4% of municipalities (almost 40% of country’s total area), which is the place of residence of approximately 6% the Spanish population. On the other hand, semi-urban and urban municipalities represent around 10% of the total (7% of the country’s area) and concentrate the majority of the Spanish population (66.4%). Finally, 54.7% of municipalities are classified in the rural and semi-rural category (more than 50% of country’s total area), which is inhabited by approximately one-third of the Spanish population. Municipalities with a marked urban character have a set of facilities to provide basic health, education, and other public services to the population that contrasts with the predominant deficit in most of the rural territory.
This vast territory presents a great heterogeneity of relief, climate, landscapes and land-uses [36,37,38,39,40]. Spain is the second most mountainous country in Europe after Switzerland, 50% of its area is dominated by high and medium-elevation mountain relief, and an additional 40% of the land area presents elevations between 400 and 800 m a.s.l. It is also one of the European countries with the longest coastline (almost 6000 km). There are many topographical and geomorphological variants at a local scale. Spain presents a remarkable climatic heterogeneity due to its latitudinal location, relief and atmospheric dynamics [38], and can be roughly divided into oceanic, subtropical, warm Mediterranean, continental Mediterranean and mountain climate regions.
The Atlas of agricultural landscapes of Spain identifies 20 broad classes of rural landscape [40]. At the local level, these landscape rural classes are very heterogeneous and consist of land-use mosaics throughout the country [16,39]. Rural landscape in Spain is closely linked to the secular human agrosilvopastoral activity and different forms of human population settlements for exploitation and territory organization. Any dichotomous classification of the rurality of a territory of Spain, into rural and urban categories, show both smaller population size and lower population density in rural municipalities than in urban municipalities, as well as spatial concentration of population in urban areas of the centre of the Peninsula and the Mediterranean coast, as well as the Balearic and Canary Islands [35,36,41,42].
2.2. Demographic Variables
Four demographic variables were considered in the 8125 municipalities, derived from the databases of the National Institute of Statistics of Spain [43]: population size, population density, population mean age and population growth rate.
Population size is simply the total number of inhabitants of each municipality; data from 2016 were used. Population density is calculated as the ratio of population size in that year and the municipality area (inhabitants/km2). The age structure of a population was estimated by a measure of the central tendency of its age distribution, the population mean age [44,45]. This variable was simply calculated as the arithmetic mean of the age of the individuals that make up each population.
The average annual rate of population growth was estimated for the period 2007–2016. It shows the per capita contribution to the population change over a unit time period. This rate, also known as the intrinsic rate of increase, expresses the change in population size as a fraction of the initial population size. It was expressed as a percentage. Population change results from both vegetative growth and migratory balance in a population and can be positive or negative, meaning population increase or population decline, respectively [44].
Population growth rate was computed as:
where PGR is the average annual population growth rate, ln represents the natural logarithm, P is population size in 2016, Po is population size in 2007, and t is the number of years in the study period.
2.3. Territorial Variables
Municipal boundaries, available in shapefile format from the official cartography source, for the year 2016 were considered [46]. Eight territorial or exogenous quantitative variables were considered, that is, potential drivers of population dynamics of each municipality in the study area. These territorial variables can be classified into three groups: environmental variables (four variables), landscape variables (three variables) and one variable of spatial accessibility.
In addition, it was also considered a categorical territorial variable, rurality, which classifies each municipality into five predefined categories (extreme rural, rural, rural and semi-rural, semi-urban and urban, Table 1). This variable defines a rurality gradient without taking into account population data [37].
Environmental variables were related to relief and local climate characteristics. These variables were derived from spatial data in raster format. Average elevation was computed as the arithmetic mean of elevation values in all pixels of each municipality area. Elevation data were derived from a digital terrain model (DTM) of Spain with a spatial resolution of 1 km2 [47]. Average slope was estimated in the same way considering the slope values of each pixel of the DTM. Distance to the coast was estimated as the Euclidean distance from the centroid of the municipality area to the nearest coastline point. The annual mean temperature was computed as the arithmetic mean of values of this variable in all pixels of each municipality area. Temperature data were generated by machine learning techniques and spatial modelling with a resolution of 1 km2, using databases provided by AEMET, the State Meteorological Agency of Spain, for the 1988–2017 period [48].
The variables related to local landscape refer to the relative occupation of land-uses of each municipality. Data were obtained from the more detailed spatial class aggregation derived from the Information System on Land-Use of Spain for the year 2011 [39]. The percentage of agricultural land-use includes all herbaceous and woody crops, as well as meadows and pastures for extensive livestock use. The percentage of forest land-use includes all different types of deciduous and coniferous forests, as well as dehesas, tree plantations and other types of natural woody vegetation. The percentage of artificial land-use includes all urban and tourist residential areas, industrial areas and other forms of anthropogenic land occupation, like transport infrastructures and other built-up areas.
Different measurements of spatial connectivity or accessibility are used in scientific literature, jointly with land-cover, as explanatory variables of urban expansion [18] or spatial econometric models [49]. The selection of accessibility as a potential driver of population change is based on empirical findings related to its relevance for land-use allocation [34] and employment and population change [27,28]. Spatial accessibility measures the ease of reaching some specific destinations (attractor areas) by people as a function of specific geospatial conditions under some assumptions. Therefore, the road accessibility of any rural area to any urban area depends on the geolocation of those areas, the available road network [46] and travel cost to the urban area, and destination quality. First, attractor areas were defined as urban and semi-urban municipalities with a population size greater than 10,000 people. These areas provide goods; health, education, recreation, and other public and private services; job opportunities, and may also include major administrative centres. Second, travel cost from each municipality to the nearest five attractor areas was estimated by minimum travel time (in minutes) through the available road transport network of Spain in 2016. Third, a population weighting factor was included to estimate the quality or relevance of attractor areas, as a proxy of its supply of opportunities.
Road accessibility expresses the degree of potential directional connectivity of each municipality in the study area, using methods described elsewhere [50,51]. It was computed by the following index:
where is the travel cost from municipality i to municipality j, Pj is the population size of the attractor municipality and ∑Pj is the sum of the populations of the attractor municipalities considered in the analysis. Larger values indicate worse road accessibility to the supply of the attractor network of Spain. Inverse distance weighted (IDW) interpolation was used to estimate spatial variation in road accessibility. For each municipality, the average value of accessibility was computed.
The geographic information system (GIS) software ArcGIS 10.5 [52] was used for computing of territorial variables, in particular its tools for selection and statistical and geometric calculation. Results were stored in tabular format to perform the statistical analyses. Some variables were mapped using the GIS software described, defining appropriate and representative classes of the existing variability across the country.
2.4. Statistical Methods
First, considering the four demographic variables and the eight territorial variables, a matrix of 8125 municipalities × 12 variables was built. To assess the joint territorial and demographic variability among municipalities, a multivariate analysis—principal component analysis (PCA)—was carried out for dimensionality reduction. The analysis was executed with previous variable scaling to homogenize variances, and fixing in five the number of main components generated. This allowed the synthesis of information and to identify the main trends of variation among municipalities and the associated demographic and territorial variables, in particular, the potential drivers of population growth rate. The variable rurality was used as an external variable to explore the association with the rurality gradient of municipalities. Second, the arithmetic mean of road accessibility and the standard error of this mean of each rurality category of municipalities was calculated and represented by bar graphs.
Considering the observed values of the population growth rate, five categories of population change were defined: very intense decline (less than −3%), moderate to intense decline (−3% to −0.5%), relatively stable dynamics (−0.5% to 0.5%), moderate to intense growth (0.5% to 3%), and very intense growth (greater than 3%). Similarly, road accessibility values were used to define five categories: very low (over 60), low (45 to 60), medium (30 to 45), high (15 to 30) and very high (less than 15). For each rurality category of municipalities, the frequency distribution of population growth rate was represented by histograms.
Statistical tests were applied to study the association and correlation between road accessibility and rurality variables. A Chi-square contingency test was used to explore the interdependence between both categorical variables. On the other hand, the relationship between both variables was analysed using the Spearman correlation coefficient. For this, we used the quantitative version of accessibility and an ordinal version of rurality. This last version measures the degree of rurality, assigning the value 1 to the extreme rural category and the value 5 to the urban category.
Finally, the present paper hypothesis was tested. The relationship between population growth rate and the independent variables was studied using linear regression models. Three demographic variables and nine territorial variables (rurality included) were considered as potential drivers. The base 10 log transformation was applied to all independent quantitative variables before modelling. The categorical rurality variable was transformed into four dichotomous variables by dummy coding [53]. The R2 or R2adj parameter was used as a quality indicator of predictive models, according to the number of independent variables. Simple and multiple regression models were built to explore the relationship of population growth rate with territorial or demographic variables, separately for each type of variable. For variable selection, the forward-stepwise method was applied in multiple regression models. Finally, predictive models were built for three variables that were selected in the previous models. Due to the detected relationship between population growth rate and population mean age, the influence of some territorial variables on the population mean age was also estimated using simple regression models.
All calculations, statistical tests and graphs were carried out using the statistical package R [54].
3. Results
3.1. Spatial Patterns in Population Growth and Age
The average annual growth rate of the 8125 populations of municipalities of Spain in the 2007–2016 period was calculated and mapped (Figure 1). Population growth rate exhibited a great spatial heterogeneity among municipalities. The range of growth rate values was very wide, extending from negative high values evidencing an intense depopulation (−10.3%) to positive very high values showing an accelerated population growth (22.3%).
Only 30 cases (0.4% of municipalities) showed stable population size. Most of populations (4487 municipalities, 55.2% of the total), distributed in 53.3% of the total area of Spain, showed a growth rate lower than −0.50%; 577 populations showed less negative growth rates. Therefore, there was a moderate to very intense population shrinking in extensive regions in rural areas in the country’s inland, especially in the northern and southern plateaus, the geographical area of residence of 4.8 million people (around 10% of the total Spanish population).
On the contrary, there was about a fifth of the populations (1656 municipalities, 20.4% of the total), which only occupy 13.8% of the total area of Spain, had growth rate values higher than 0.5% and, therefore, a predominantly moderate to intense population growth, although it was very intense in some geographical areas. Areas with positive population growth were located mainly in the most urbanized regions of central Spain and the coast and insular regions. Other municipalities with this population growth type appeared dotted within the territorial matrix of shrinking population. The territory of municipalities with positive moderate to very intense population growth rates was the residence place of 14.2 million people (30.4% of the total Spanish population).
Population dynamics of municipalities differed markedly with relief type. Population growth rate in mountainous areas was, on average, negative [mean ± standard error of the mean] (−1.11% ± 0.03%), more than two times less than in the rest of the territory (−0.47% ± 0.02%). On the other hand, inland municipalities showed an average negative population growth rate (−0.77% ± 0.02%) whereas it was positive in coastal areas (0.28% ± 0.05%).
The population mean age of each municipality was estimated and mapped (Figure S1). There was a great spatial heterogeneity, the range of variation in population mean age was almost 50 years, from 31.2 to 79.3 years. There was a spatial concentration of aged populations in northwest Spain, where population mean age between 50 and 80 years prevailed. This area of aged population comprised 3579 municipalities, 44% of the total (34.6% of the total Spain area). It is the residence place of 1.4 million people (3% of the total Spanish population). Within this territory appeared 642 municipalities dotted with very high to extreme population aging (population mean age greater than 60 years).
There was a clear spatial pattern of gradual variation of the population mean age, from the northwest to the south-southeast (Figure S1). Populations were younger (mean age less than 40 years) mainly in the Mediterranean coast municipalities and insular territories, and metropolitan areas. The areas with the youngest population mean age were always adjacent to others with intermediate population age, between 40 and 50 years.
Relief type and distance to coast were also associated to population mean age geographic patterns. The mean age of populations of municipalities in mountain areas was 51.1 ± 0.1 years, while it was 48.1 ± 0.1 years in non-mountain areas. On the other hand, in general, inland populations were more aged (49.6 ± 0.1 years) than coastal ones (43.1 ± 0.2 years).
3.2. Trends in Local Population Growth Rate and Potential Drivers of Change
Figure 2 provides a two-dimensional plot of the variability of municipalities in the ordination space produced by PCA analysis. Each dot represents a municipality with a code colour that corresponds to the five predefined rurality categories (Table 1). There was reasonable goodness of fit because the first and second principal components accounted for 55.7% of the total variance in the correlation matrix among the 12 variables considered (64.6% after exclusion of population size and population density). The two-dimensional plot, hence, identified two clear multivariate variation trends in municipalities associated with underlying variables (see loading factors in Table 2).
The first ordination axis (PC1) explained 33.7% of the total variance. There was a continuum or gradient of municipalities along this axis that was strongly associated with population growth rate change. Five variables were related to this gradient and can be considered direct or indirect potential drivers of change in population growth rate. The first axis ordered the municipalities from the negative end, where urban municipalities with greater positive values of growth rate were located (Barcelona and Madrid, among others), to the positive end, where more rural municipalities with more negative growth rate values appeared. Along the PC1 axis there was a trend to decrease in road accessibility, percentage of artificial land-use and annual mean temperature, and a trend to increase in population mean age and elevation among these local administrative units.
Municipalities with a flat land or a low average terrain slope and the predominance of agriculture over forest land-use were at the negative end of the second axis (PC2), which explained 22% of the total variance (Figure 2). Towards the positive axis end, there was a clear trend of increase in the average terrain slope, decrease in the percentage of agricultural land-use and increase in the percentage of forest area among the local administrative units.
The third ordination axis explained 12% of the total variance. This axis fundamentally segregated the urban municipalities, between those with greater population density and population size, in this order, and those municipalities with lower values of both these variables (Table 2).
Distance to coast was the least significant variable in the gradients identified, due to its lower loading factor, although it tended to increase along the rurality gradient towards the more rural end. Neither population size nor population density were variables associated with population growth rate, and none of them contributed to the rurality gradient.
To sum up, the two-dimensional plot identified the main spatial trend of variation of Spain municipalities as a rurality gradient, from the positive end axis (extreme rural areas) to the negative end (urban areas), which coincided with a trend of increase in population growth rate. The second trend segregated the municipalities of Spain along the rurality gradient according to the proportion of agricultural or forest land-uses among local areas. This spatial change was less accentuated in urban and semi-urban municipalities.
Spatial trends in population growth rate changes across local areas of Spain were associated to one demographic and several territorial variables. Population growth rate increased as population mean age decreased, but also with a decrease in elevation and increase in road accessibility, temperature and percentage of artificial area. Growth rate decreased and reached negative values in local areas when the change in all those previous mentioned variables was in the opposite direction.
The average growth rate of local populations within each rurality category showed a gradual trend of increase along the rurality gradient (Figure 3a). While in the more extreme rural category a very marked depopulation dynamics was shown, in the urban extreme the opposite was observed, i.e., growing populations but at a lower speed. The average growth rate in extreme rural populations was −1.83% ± 0.09%. This rate became progressively less negative in intense rural and rural and semi-rural populations, and reached average positive values in both semi-urban (0.86% ± 0.06%) and urban (0.78% ± 0.10%) populations.
Within all rurality categories, all classes of local population growth rates were observed: very intense decline, moderate to intense decline, relatively stable dynamics, moderate to intense growth, and very intense growth. Frequency distributions of local population growth rate values within each rurality categories are given in Figure 3b as histograms with the defined growth rate classes. All distributions were single-humped, but differed in the skewness and the predominant sign of growth rate values. In extreme rural populations, distribution was positively skewed, with moderate to very intense population decline in almost 80% of municipalities. In rural populations, a positive skewness of distribution was also observed, with moderate to very intense population decline in around 75% of municipalities. In rural and semi-rural populations, the skewness of distribution was smaller, with moderate to very intense population decline in around half of the municipalities, and moderate to very intense growth in 20% of municipalities. By contrast, the distributions of semi-urban and urban populations were skewed left, with moderate to very intense growth in almost 60% of municipalities.
3.3. Road Accessibility Spatial Patterns and Relationship to Rurality Gradient
We identified 708 attractor municipalities, such as Madrid, Barcelona and Seville. Figure 4 shows a spatial model of accessibility by road of the municipalities of Spain grouped into five classes (from very high to very low accessibility). A 33.4% of the territory showed low or very low accessibility, corresponding to the mountain ranges (Pyrenees, Iberian System, among others) and other inland areas with greater geographic isolation or remoteness. Within these areas, a deficit in road transport infrastructure appeared, they had a high rate of detour and hence very few accessible attractor municipalities, i.e., there were constraints in access to basic goods and services for the people.
On the contrary, large areas of municipalities with very high accessibility were identified (1272 municipalities representing 16% of the total and 9.3% of the national territory). This territory corresponded to metropolitan areas of central Spain and the coast, especially the Mediterranean, as well as most of the area of islands. In general, peripheral areas to the areas with very high accessibility were even more extensive and with high accessibility. The whole territory of high and very high accessibility represented 39% of the country total area.
Finally, a transition territory, with medium accessibility, was identified. Its spatial distribution was between the areas of low and high accessibility. It comprised approximately one-third of the municipalities (27.5% of the country area).
The population of the 2479 municipalities with low or very low accessibility (around 30% of the total area of Spain) was around 1.6 million inhabitants, 3.5% of the Spanish population. In 2227 municipalities of medium accessibility (around 25% of the country area), 3 million people reside, i.e., almost 7% of the Spanish population. In contrast, the 3415 municipalities of the territory with high and very high accessibility (42% of the country area) is the place of residence for close to 90% of the Spanish population (41.6 million people).
In addition to analysing the spatial variation of accessibility to the main economic centres, it is interesting to examine the relationship of this territorial variable with the distribution of the municipalities according to their rurality. Most of the extreme rural (76.8%) and rural intense (73.4%) municipalities showed a low to very low accessibility. In rural and semi-rural types, only 9.7% exhibited low or very low accessibility, while 77.5% showed medium or high accessibility. On the other hand, most of semi-urban (87.8%) and urban (94.4%) municipalities had high to very high accessibility. Significant statistical interdependence was observed between accessibility and rurality categories of the municipalities (Chi-square = 6507, p < 0.001).
There was a significant correlation between accessibility and degree of rurality expressed by ordinal values (ρ = −0.71, p < 0.001). An evaluation by means of regression between accessibility and the five categories of rurality indicated that the latter explains 54.9% of the variance in accessibility (F = 2240, p < 0.001). The functional relationship was a negative and growing contribution trend along the rurality gradient (log Access = 1.75 − 0.04 × Int_rur − 0.32 × Rur_semi-rur − 0.62 × Semi-urb − 0.86 × Urb).
On the other hand, average accessibility showed a trend of gradual increase along the rurality gradient (Figure 5). Thus, in extreme rural municipalities, the lowest accessibility was observed; in rural and semi-rural municipalities it was approximately twice as large as accessibility in extreme rural municipalities. Accessibility in urban municipalities was three times greater than rural and semi-rural municipalities.
3.4. Potential Drivers of Local Population Growth Rate
The relationship between population growth rate and demographic and territorial variables, as well as the rurality of the municipalities, was formally evaluated through different regression models (Table 3). These models explored the direct or indirect potential influence of the territorial or demographic variables, individually or jointly, on population growth rate to assess or elucidate their contribution and relative importance.
First, population growth rate was significantly related to road accessibility (Figure 6a, Table 3). The relationship between these variables was non-linear indicating that population growth rate decreases with decreasing accessibility (higher values of this variable correspond to lower accessibility). A few high accessibility values were associated with a very small decrease in growth rate. Although the statistical model showed the trend of variation and provided an unbiased prediction of observed population growth rate values, the existing dispersion indicates that its precision was not high, since this territorial variable explains about 25% of the population growth rate variation.
Second, population growth rate was also significantly related to rurality (Table 3), and there was a trend along the rurality gradient. The positive sign and magnitude of regression coefficients indicate a positive and growing contribution of population growth rate from the most rural to the most urban levels. The regression model with this single territorial variable explained about 15% of its variability. When all territorial variables were considered, only accessibility and rurality contributed significantly, explaining about 29% of population growth rate variability. Remarkably, none of the other territorial variables considered contributed to predicted changes in population growth rate.
Third, population growth rate was significantly, inversely and non-linearly related to population mean age, explaining 52% of its variability (Figure 6b, Table 3). Population growth rate was driven to decrease by population mean age, though this decrease was attenuated as population mean age increased.
It is noteworthy that population growth rate was not related to the other two demographic variables considered, population size and population density.
Finally, predictive models, with demographic and territorial variables, were considered, but only for three of the variables selected in the previous models (Table 3). Given that two predictive territorial variables, road accessibility and rurality, were correlated and probably exhibited great redundancy, both were modelled separately. Population growth rate was significantly, inversely and non-linearly related to population mean age and accessibility. On the other hand, the predictive model of population growth rate based on population mean age and rurality revealed the same trends identified for the independent variables separately. Both statistical models did not improve significantly the prediction precision of population growth rate.
Given the interdependence between accessibility and rurality, the relationship of both territorial variables with population mean age was explored. Population mean age presented a significant and non-linear positive relationship with road accessibility (Figure 7; log Age = 1.47 + 0.15 × log Access; R2adj. = 0.42; F = 5396; p < 0.001) and negative relationship with the percentage of artificial area (log Age = 1.72 − 0.07 × log Artif; R2adj. = 0.37, F = 4849, p < 0.001). This indicates a trend of population age increase with decreasing accessibility and the proportion of urbanized areas, in a progressively smaller proportion as both territorial variables increased. On the other hand, population mean age showed a positive correlation with degree of rurality (ρ = 0.46, p < 0.001). An assessment by a regression analysis between population mean age and rurality as a categorical variable indicated its negative and increasing contribution along the rurality gradient (log Age = 1.74 − 0.03 × Int_rur − 0.06 × Ru_Semi-rur − 0.12 × Semiurb − 0.13 × Urb; R2adj. = 0.24; F = 625; p < 0.001).
4. Discussion
4.1. Drivers of Local Population Growth Rate
The results provide reliable evidence of spatial patterns and relationships among recent population dynamics, population age, degree of rurality and road accessibility. The hypothesis of the paper, the growth rate of the human population at the local scale is indirectly driven by spatial and rurality gradients, was reasonably supported by the set of results. The wide variability in the growth rate of local populations in Spain over the period 2007–2016 (Figure 1) seemed to be indirectly driven by differences among municipalities in some territorial variables (Figure 4 and Figure 5). The results suggest that road accessibility and rurality were two key territorial drivers.
Road accessibility and rurality were interdependent and correlated. This finding coincides with the observed association between accessibility and land-uses at the local level [18,34,55]. Accessibility in urban areas is higher than in rural areas according to studies elsewhere [12,56,57,58,59]. The most urban local areas of Spain presented greater road accessibility than the more rural local areas. The extreme and intense rural areas are often inland, remote, located at a higher elevation and less accessible by road than urban areas, a fact consistent with other studies carried out in Spain at comparable spatial scales [60]. On the other hand, the importance of accessibility for sustainability is consistent with its acknowledged application in land planning and relevance for territorial cohesion [61] and social inclusion [62]. In particular, these results are in agreement with the observed relationship between patterns of socio-ecological variation associated with a spatial gradient of rurality and transport infrastructure network in the Madrid Region [22]. They also agreed with spatial patterns of accessibility and change in population size in the southern Spanish plateau [60].
At the country level, employment and population changes are driven by road accessibility [27]. At the regional level, road accessibility can affect population growth rate indirectly through economic growth and changes in employment opportunities [28,59,63], although the effect is complex. It can be positive or negative and vary with the degree of rurality of the territory [64]. In rural, suburban and urban areas of the United States, accessibility does not affect population growth rate, although it seems to reinforce some effects of spatial lag in population size change [33,65]. Some studies even consider an effect of population dynamics on road accessibility and expected a decline or improvement in accessibility in local areas of Spain and other Southern European countries with population decline or increase, respectively [12]. Population decline is conspicuous in some mountainous areas of Europe, where road accessibility is inherently low [66,67].
It must be emphasized that the road accessibility measure considered in this research is a functional attribute that effectively expresses the potential functional connectivity in all municipalities of Spain, taking into account the geolocation of main good and service supply municipalities. It quantitatively expresses the potential flow of people from a local area, with or without this supply, to other areas with a notable supply. It is not a mere structural descriptive spatial variable based on road network length or density measurements [68,69]. Therefore, its relationship with the local population growth rate is interpreted as a very relevant finding, since there is no known previous similar quantitative study in Southern Europe.
A negative population growth rate in many rural areas of the United States, Canada and Southern Europe is common and contrasts with the general or predominant trend of positive population growth rates in urban areas, in particular, because of the spill-over effect [11,12,25,67,70,71]. In Spain, accessibility change is considered relevant in the rural–urban continuum of municipalities [72]. As far as we know, there is no explicit targeted research to explore quantitatively the relationship between rurality degree of a territory and local population dynamics.
The distance between rural areas and urban and intermediate areas has a negative effect on the rural population growth rate [73]. Rurality of a territory expresses differences in environmental characteristics and the human uses of the landscape (Figure 2) and its road accessibility (Figure 5), which determine different socioeconomic conditions that probably influence the demographic attributes of local populations.
The results suggest that road accessibility and rurality are relevant territorial variables that contributed to explain, independently and jointly, local variation in population growth rate. Although the variance in population growth rate explained by these territorial variables was not too high (Table 3), the results clearly suggest that an increase in road accessibility promotes an increase in population growth rate. They also suggest the opposite fact, which must be highlighted, low road accessibility promotes a reduction in population growth rate. This empirical relationship, based on the recent dynamics of 8125 local populations, is a relevant finding because it makes it explicit that territorial variables could influence speed and direction of change in local population size. Both rurality—associated with local intrinsic environmental characteristics, landscape, and human land-uses—and road accessibility—which is a territorial attribute partly extrinsic to the municipality—seemed to be contributing factors of local variability in the growth rate of populations.
However, neither population size nor population density seems to be demographic drivers of population growth rate at a local level in Spain. This expresses the absence of regulation (denso-dependence) of human population size at local level in developed countries. This effect on the growth rate, nevertheless, is considered relevant for local population dynamics in prehistoric and historical times (until the 19th century), due to limitations in carrying capacity associated with food availability [74].
Environmental suitability (associated to higher mean temperature) and high supply of employment in industry or services, that could be related to a greater artificial surface, are variables with positive influence for maintenance of human settlements and their population size. However, the results indicate that, although these territorial variables may be associated with the rurality gradient, they were not relevant to explain spatial variability in population growth rate, and hence, cannot be considered as drivers. Nevertheless, population growth appears to be driven by an increased valuation of nice weather as a consumption amenity in the United States [75].
Variation in average population size and population density along the rurality gradient (Figure 2) suggests a limitation of size and density of populations by territorial variables and historical factors, but not a relationship with population growth rate [66,76]. This appreciation is relevant because the inherent lower population size and population density in the rural territory are often associated with population decline without an appropriate quantitative study. The results show that spatial variation in the population growth rate among municipalities was independent of their population size or density, while some territorial variables, such as road accessibility and rurality, were extrinsic potential drivers. Attenborough emphasizes that human population dynamics must be understood in an ecological context, and should not be based solely on demographic variables [77]. This influence is reciprocal, since the increase in population size generates landscape changes, increasing the proportion of artificial area and decreasing the proportion of agricultural land-use [78]. Both environmental factors, natural and sociocultural, are important also to comprehend population spatial distribution and population dynamics.
The importance of population mean age as a demographic driver was very high since by itself it explained around 52% of the variability in population growth rate. However, the importance of territory could emerge in two ways. Not all local demographic changes result from population age structure. Both demographic factors—like migration–, and territorial factors—like road accessibility–, could contribute together with population mean age, to population growth rate patterns. On the other hand, population mean age was not independent of territory or rurality. Given that population mean age decreased from the most rural to the most urban areas, degree of rurality—or even road accessibility—might condition the variability in population mean age. Therefore, if some territorial variables influence the age structure of local populations, they would influence indirectly on population dynamics. This interpretation is consistent with the association between population ageing and rurality at the sub-regional level [79].
4.2. Age Structure and Underlying Demographic Rates in Spain
The rate of growth in the short and medium term of any local human population depends on its age structure. In addition, the age structure of a population is determined by its growth rate, a variable that integrates the effect of fertility, mortality and migration, the components of demographic change that, in turn, influences the population age structure [80]. The spatial variability in the growth rate of local populations in Spain can be interpreted as the overall effect of these three components of change in population size.
Geographic patterns of local variation in population mean age in Spain (Figure S1) showed a similar spatial heterogeneity to that observed at different scales [36,76,81]. Population mean age in municipalities of Spain increased with elevation and decreased with annual mean temperature (Figure 2, Table 2). Population ageing was greater in mountainous and colder areas, which correspond to extreme and intense rural populations, than in warmer areas (Figure 2). Population mean age is an appropriate indicator of the age structure of local populations, a valuable variable used in studies of population dynamics [44], and a good predictor of population growth [82]. Results showed that population growth rate at a local level was inversely related to population mean age (Figure 6b), suggesting that spatial differences in population mean age can contribute to differences in population growth rates at a local level.
Some of the variables that may contribute to greater local population ageing may be demographic, such as lower fertility rate, lower death rate among elderly people and a greater emigration of young and adult workers. Among other territorial variables, an enabling environment or an adequate access to high quality social and health services, could influence the previous demographic factors.
A high total fertility rate drives population growth, and a low fertility rate drives population decline. The total fertility rate is low in Spain, as in other European countries, especially in the south [83]. The geographical heterogeneity of this rate [36], could contribute to differences in population growth rates at the local level.
A low crude death rate drives population growth, and a high crude death rate drives population decline. In the period 2007–2016, there is very high heterogeneity in the average crude death rate across the municipalities of Spain, with a variation range between 0‰ and 83‰ [84]. This geographical heterogeneity could contribute to the observed differences in local population growth rates.
Depopulation of the rural territory is interpreted as a result of a negative natural growth rate and emigration in some regions of Spain [41]. The operation of these same direct demographic causes can be applied to other areas, including urban areas, which have suffered a population decline due to industrial decline or other socioeconomic factors in some cases, as in other European countries [85]. Similarly, a positive natural growth rate and immigration are direct drivers of the change in population size in other municipalities, even reversing trends of population decline [86]. Foreign immigration is heterogeneous geographically, between 2000 and 2008 it is concentrated in some urban areas, especially in the coast, and rural areas associated with agricultural development. The whole of the immigrant population is younger than the native population, contributing to reduce population mean age of the receiving population. Local economic development attracts immigration and lowers population mean age [87]. This suggests that immigration can indirectly contribute to population growth by increasing local fertility rate. Immigration of young people can have a compensatory effect of low fertility, counteracting the impact of negative population moment on the population growth rate in declining areas, especially rural, or reinforcing the effect of positive population moment on this rate in local areas that experience population growth [88].
To sum up, the results suggest that, in municipalities with younger populations, the population grows in the study period because, on average, birth rate exceeds death rate. Besides, a positive net migratory balance could also contribute to a positive population growth rate at a local level. In contrast, in municipalities with older populations, resulting from long periods with a low fertility rate, population decreases because, on average, death rate exceeds birth rate. In these localities, a negative net migratory balance could also contribute to a negative population growth rate.
The results emphasize that population size changes and ageing in local populations are interdependent variables. This fact is doubly interesting. Its shows that the degree of population ageing, expressed as the mean age of the population, drives population dynamics (Figure 6b). On the other hand, it establishes a synthetic functional link between two dimensions of demographic change, ageing and depopulation. Regardless of the geographical place where it occurs, population decline in a territory seems to be directly related to its degree of ageing. The opposite is also true, population growth is associated with a lower population mean age.
4.3. Visual Model of Drivers of Population Growth Rate
Figure 8 represents a simple visual model of potential drivers of population growth rate at a local scale, which is based on the empirical correlation results presented. Neither correlation nor regression analysis can prove causation. Statistics can only provide strong evidence in favour of or against potential drivers. The picture merely expresses in a formal, explicit and hierarchical way the preliminary hypothesis on magnitude and sign of the interactions or relationships between territorial indirect potential drivers of change in population growth rate, and a direct demographic driver, the population mean age. At the top, there are two territorial variables, rurality and road accessibility. Both would have an inverse and reciprocal relationship since, although rurality is associated with attributes of the territory—such as its topography and land-uses, which are independent of road access–, road accessibility could also determine urbanization and local modification of land-uses. However, the relationship between both variables reflects that the more rural and remote areas have much lower accessibility than the more urban areas and vice versa.
In the second level appears population mean age. This variable could be indirectly influenced by the two territorial variables, positively by rurality and negatively by road accessibility. These territorial variables could influence, although also indirectly, population growth rate, but negatively and positively, respectively. The negative relationship between population mean age and population growth rate suggests that population age structure would be a good predictor of the speed of its future growth or decline.
Therefore, the territorial variables would play two indirect ecological influences on population growth rate, one that could operate through socioeconomic factors, and other through population mean age. In other words, population mean age would be a direct driver of growth rate, but it could be also influenced by territorial variables. The mechanisms of influence of population mean age are demographic and well known. These mechanisms operate through an increase in the fertility rate and a reduction in the death rate the lower the population mean age.
However, the potential influence of territorial variables is probably of an ecological and sociodemographic nature. The less attractive territories due to the severity of the physical environment or limitations in agricultural production are associated with deficits in road accessibility and basic services, and limited job supply, among other characteristics very present in extreme rural areas. These factors would promote population decline. On the other hand, the territories with the opposite characteristics, typical of most of urban areas, are associated with moderate or intense population growth. More rural and less accessible, and more urban and accessible, would be the opposite poles of a gradient in local population dynamics, operating population mean age as an intrinsic demographic variable that could be influenced by territorial variables. Territorial variables, in this sense, are extrinsic variables that would control the local population growth rate.
The visual model presented is incomplete for three reasons. First, a single demographic driver was considered, which emerges among the population variables considered. Although this simplicity was intentional, the omission of population size and population density is consistent with empirical results, which do not support any influence of both variables on the population growth rate at local level. However, the picture could be completed considering local variability of emigration and immigration flows, and other demographic components of population dynamics, such as fertility and death rates. An evaluation of the relative contribution of these variables could help to better understand the spatial variability in population growth rate.
Second, the visual model emphasizes the potential interdependence and importance of two territorial variables that, although they are not identical, express certain redundancy or spatial covariation. Rurality gradient exceeds the usual dichotomous territorial classification, explaining how the degree of rurality influences population dynamics at a local level. The consideration of more detailed territorial variables of each municipality, related to landscape spatial structure or to socioeconomic structure, could also contribute to a better explanation of the spatial variability in population growth rate. On the other side, road accessibility is an extrinsic variable to population and even partly extrinsic to the municipality. Accessibility to the supply of goods, services or jobs seems to be a relevant potential driver of local population dynamics, but consideration of spatial distribution and demand of specific services, for example, could change the number, importance and spatial distribution of attractors, modifying the differences in road accessibility and improving the predictive adjustment of demographic variables.
Third, results suggest the interest in conducting more detailed regional studies. These studies should consider territorial and demographic variables with a higher spatial resolution, including some of the relevance at a subnational level. This research could also contribute to improving the integrated knowledge of driving factors of population growth rate at a local level in Spain.
Finally, the evaluation of spatial variability and modelling of population growth rate in other periods, in Spain and in other Southern European countries, and the application of more advanced data analysis methods, such as spatial regression techniques and machine learning, would allow both testing the hypothesized model as well as deeper and integrated knowledge of drivers of population growth or decline at local scale.
5. Conclusions
Human population growth rate at a local scale seems to be driven by population mean age, and could also be indirectly driven by spatial and rurality gradients. These findings were presented by a visual model based on regression analyses of more than 8000 populations in Spain. This visual model represents a hypothesis that can be applied to Southern Europe countries with cultural landscapes. Population growth rate increased with spatial accessibility and decreased with rurality. Population growth rate decreased with population mean age. Therefore, the degree of ageing of a local population seems to be related to population growth or depopulation of a territory.
The applicability of this general and simple hypothesized model to any large enough country may be assessed provided disaggregated data of appropriate variables at the spatial scale of analysis are available. It could be generalized and expanded in different ways, such as testing hypotheses incorporating prior knowledge on extrinsic potential drivers, or by changing the spatial scale to identify population dynamics and drivers for land planning at regional or national levels.
Promoting smart decisions in land-use and infrastructure planning and protecting rural cultural heritage and ecosystem services, is as important as preserving human populations linked to territories and their quality of life. The research agenda is complex but policy-makers demand useful models for sustainable development. Science is needed to understand demographic challenges at national, sub-national and local scales.
Any demographic strategy or high-level plan cannot ignore the size of local populations and their drivers of change. Setting goals and appropriate actions to achieve these goals at different spatial scales, and allocating resources to implement actions, requires innovation in virtually all policies to ensure a sustainable future.
Supplementary Materials
The following are available online at https://0-www-mdpi-com.brum.beds.ac.uk/2071-1050/11/11/3107/s1, Figure S1: Map of mean age of populations of Spain municipalities (2016).
Author Contributions
Conceptualization, J.M. and E.R.-L.; methodology, J.M. and P.M.-B.; formal analysis, P.M.-B. and E.R.-L.; writing—original draft preparation, J.M. and B.A.-G.; writing—review and editing, B.A.-G. and J.M.; visualization, P.M.-B. and E.R.-L.; funding acquisition, J.M. and E.R.-L.
Funding
This research was funded by Ministry for the Ecological Transition (DEMOS Project) and the Ministry of Health, Consumption and Social Welfare (MAYORSIG Programme) of Spain, and own resources of The Matrix Foundation, Research and Sustainable Development.
Acknowledgments
Sara Ortega provided technical support to preliminary conceptualization, methodology design and data analysis. Authors are grateful to the two anonymous referees for their valuable comments and constructive suggestions on the manuscript.
Conflicts of Interest
The authors declare no conflict of interest. The funders had no role in the design of the study; in the collection, analyses, or interpretation of data; in the writing of the manuscript, or in the decision to publish the results.
References
- Bradshaw, C.J.A.; Brook, B.W. Human population reduction is not a quick fix for environmental problems. Proc. Natl. Acad. Sci. USA 2014, 111, 16610–16615. [Google Scholar] [CrossRef] [PubMed] [Green Version]
- Meadows, D.H.; Randers, J.; Meadows, D.L. The Limits to Growth: The 30 Year Global Update; Earthscan: London, UK, 2004. [Google Scholar]
- Daily, G.C.; Ehrlich, P.R. Population, Sustainability, and Earth’s Carrying Capacity. BioScience 1992, 42, 761–771. [Google Scholar] [CrossRef]
- Dyball, R.; Newell, B. Understanding Human Ecology. A System Approach to Sustainability; Routledge: Abingdon, UK, 2015; ISBN 1849713820. [Google Scholar]
- Roser, M.; Ortiz-Ospina, E. World Population Growth. 2017. Available online: https://ourworldindata.org/world-population-growth (accessed on 10 April 2019).
- Bongaarts, J. Human population growth and the demographic transition. Philos. Trans. R. Soc. B 2009, 364, 2985–2990. [Google Scholar] [CrossRef] [PubMed] [Green Version]
- Eurostat. People in the EU: Who Are We and How Do We Live? European Union: Brussels, Belgium, 2015; ISBN 978-92-79-50328-3.
- United Nations. Fulfilling the Potential of Present and Future Generations. 2018. Available online: https://ec.europa.eu/eurostat/documents/3217494/7089681/KS-04-15-567-EN-N.pdf (accessed on 10 April 2019).
- Federal Ministry of the Interior. Jedes Alter zählt. Für mehr Wohlstand und Lebensqualität aller Generationen, Weiterentwicklung der Demografiestrategie der Bundesregierung. Berlin. 2015. Available online: https://www.demografie-portal.de/DE/Informieren/Dialogprozess/Weiterentwicklung_Demografiestrategie.pdf?__blob=publicationFile&v=15 (accessed on 9 April 2019).
- Ministry of Territorial Policy and Public Function. Comisionado del Gobierno para el Reto Demográfico. 2019. Available online: http://www.mptfp.gob.es/portal/areas/reto_demografico.html (accessed on 10 April 2019).
- Paddison, R. (Ed.) Handbook of Urban Studies; SAGE Publications: London, UK, 2001; ISBN 0-8039-7695-X. [Google Scholar]
- ESPON. Transnational Observation. Fighting Rural Depopulation in Southern Europe. 2018. Available online: https://www.espon.eu/sites/default/files/attachments/af-espon_spain_02052018-en.pdf (accessed on 10 April 2019).
- United Nations. World Urbanization Prospects: The 2018 Revision. U.N. Department of Economic and Social Affairs, Population Division. 2018. Available online: https://population.un.org/wup/ (accessed on 10 April 2019).
- Karcagi Kováts, A.; Katona Kovács, J. Factors of population decline in rural areas and answers given in EU member states’ strategies. Stud. Agric. Econ. 2012, 114, 49–56. [Google Scholar] [CrossRef]
- Matthews, S.A.; Parker, D.M. Progress in Spatial Demography. Demogr. Res. 2013, 28, 271–312. [Google Scholar] [CrossRef]
- Schmitz, M.F.; De Aranzabal, I.; Aguilera, P.; Rescia, A.; Pineda, F.D. Relationship between landscape typology and socioeconomic structure: Scenarios of change in Spanish cultural landscapes. Ecol. Model. 2003, 168, 343–356. [Google Scholar] [CrossRef]
- Di Fazio, S.; Modica, G. Historic Rural Landscapes: Sustainable Planning Strategies and Action Criteria. The Italian Experience in the Global and European Context. Sustainability 2018, 10, 3834. [Google Scholar] [CrossRef]
- Ma, Y.; Xu, R. Remote sensing monitoring and driving force analysis of urban expansion in Guangzhou City, China. Habitat Int. 2010, 34, 228–235. [Google Scholar] [CrossRef]
- Seto, K.C.; Fragkia, M.; Gu, B.; Reilly, M.K. A Meta-Analysis of Global Urban Land Expansion. PLoS ONE 2011, 6, e23777. [Google Scholar] [CrossRef]
- Antrop, M. Landscape change and the urbanization process in Europe. Landsc. Urban Plan. 2004, 67, 9–26. [Google Scholar] [CrossRef]
- Woods, M. Rural geography: Blurring boundaries and making connections. Prog. Hum. Geogr. 2009, 33, 849–858. [Google Scholar] [CrossRef]
- Arnaiz-Schmitz, C.; Schmitz, M.F.; Herrero-Jáuregui, C.; Gutiérrez-Angonese, J.; Pineda, F.D.; Montes, C. Identifying socio-ecological networks in rural–urban gradients: Diagnosis of a changing cultural landscape. Sci. Total Environ. 2018, 612, 625–635. [Google Scholar] [CrossRef] [PubMed]
- ICOMOS 2018. ICOMOS-IFLA Principles Concerning Rural Landscapes as Heritage. Available online: https://www.icomos.org/images/DOCUMENTS/Charters/GA2017_6-3-1_RuralLandscapesPrinciples_EN_adopted-15122017.pdf (accessed on 10 April 2019).
- Cash, D.W.; Adger, W.; Berkes, F.; Garden, P.; Lebel, L.; Olsson, P.; Pritchard, L.; Young, O. Scale and cross-scale dynamics: Governance and information in a multilevel world. Ecol. Soc. 2006, 11, 2. [Google Scholar] [CrossRef]
- Zambon, I.; Rontos, K.; Serra, P.; Colantoni, A.; Salvati, L. Population Dynamics in Southern Europe: A Local-Scale Analysis, 1961–2011. Sustainability 2019, 11, 109. [Google Scholar] [CrossRef]
- Chi, G.; Ventura, S. Population Change and Its Driving Factors in Rural, Suburban, and Urban Areas of Wisconsin, USA, 1970–2000. Int. J. Popul. Res. 2011, 2011, 1–14. [Google Scholar] [CrossRef]
- Duranton, G.; Turner, M. Urban Growth and Transportation. Rev. Econ. Stud. 2012, 79, 1407–1440. [Google Scholar] [CrossRef]
- Yan, T.; Pan, H.; Hewings, G.; Jin, Y. Understanding urban sub-centers with heterogeneity in agglomeration economies—Where do emerging commercial establishments locate? Cities 2019, 86, 25–36. [Google Scholar] [CrossRef]
- Harrison, G.A. Preface. In Human Population Dynamics: Cross-Disciplinary Perspectives; Macbeth, H., Collison, P., Eds.; Cambridge University Press: Cambridge, UK, 2002; pp. XIII–XIV. [Google Scholar]
- Henderson, K.; Loreau, M. An ecological theory of changing human population dynamics. People Nat. 2019, 1, 31–43. [Google Scholar] [CrossRef] [Green Version]
- Recaño, J. The Demographic Sustainability of Empty Spain. Perspect. Demogràfiques 2017, 7, 1–4. [Google Scholar]
- Clarke, J.L. The growing concentration of world population from 1950 to 2050. In Human Population Dynamics: Cross-Disciplinary Perspectives; Macbeth, H., Collison, P., Eds.; Cambridge University Press: Cambridge, UK, 2002; pp. 41–64. ISBN 0-521-80-865-0. [Google Scholar]
- Voss, P.R. Demography as a spatial social science. Popul. Res. Policy Rev. 2007, 26, 457–476. [Google Scholar] [CrossRef]
- Pan, H.; Deal, B.; Chen, Y.; Hewings, G. A Reassessment of urban structure and land-use patterns: Distance to CBD or network-based?—Evidence from Chicago. Reg. Sci. Urban Econ. 2018, 70, 215–228. [Google Scholar] [CrossRef]
- Goerlich, F.J.; Ruiz, F.; Chorén, P.; Pérez, C.A. Cambios en la Estructura y Localización de la Población. Una Visión de Largo Plazo (1842–2011), 1st ed.; BBVA Foundation: Madrid, Spain, 2015; p. 356. ISBN 978-84-92937-61-5. [Google Scholar]
- National Geographic Institute (IGN). Atlas Nacional de España. España en Mapas. Una Síntesis Geográfica. 2019. Available online: http://www.ign.es/web/ign/portal/espana-en-mapas (accessed on 9 April 2019).
- Montalvo, J.; Ruiz-Labrador, E.; Montoya-Bernabéu, P. Rurality of spatial units: A non-dichotomous classification and case-study in Spain. (manuscript in preparation).
- Font, I. Climatología de España y Portugal; Ediciones Universidad de Salamanca: Salamanca, Spain, 2007; p. 425. ISBN 978-84-7800-944-2. [Google Scholar]
- National Geographic Institute (IGN). Information System on Land Use of Spain (SIOSE Project). Available online: http://www.siose.es/ (accessed on 5 April 2019).
- Molinero, F.; Baraja, E.; Silva, R. La tipificación de los paisajes agrarios de España: Categorías y clases, una clasificación escalar. In Atlas de los Paisajes Agrarios de España; Molinero, F., Tort, J., Ojeda, J.F., Ruiz, E., Martínez, E., Silva, R., Mata, R., Eds.; Spanish Ministry for Agriculture, Fisheries and Food: Madrid, Spain, 2013; pp. 8–24. ISBN 978-84-491-1342-0. [Google Scholar]
- Pinilla, V.; Ayuda, M.I.; Sáez, L.A. Rural Depopulation and the Migration Turnaround in Mediterranean Western Europe: A Case Study of Aragon. J. Rural Community Dev. 2008, 3, 1–22. [Google Scholar]
- Vinuesa, J. El crecimiento de la población y los desequilibrios en la distribución espacial. In Dinámica de la Población en España. Cambios Demográficos en el Último Cuarto del Siglo XX; Puyol, R., Ed.; Síntesis: Madrid, Spain, 1999; pp. 265–310. ISBN 8477383987. [Google Scholar]
- National Statistical Institute of Spain (INE). Cifras Oficiales de Población de los Municipios Españoles: Revisión del Padrón Municipal. Available online: https://www.ine.es/dyngs/INEbase/es/operacion.htm?c=Estadistica_C&cid=1254736177011&menu=resultados&idp=1254734710990 (accessed on 10 April 2019).
- Siegel, J.S.; Swanson, D.A. (Eds.) The Methods and Materials of Demography; Elsevier Academic Press: San Diego, CA, USA, 2004; ISBN 0-12-641955-8. [Google Scholar]
- Eurostat. Demographic Statistics: A Review of Definitions and Methods of Collection in 44 European Countries; European Union: Luxembourg, Belgium, 2015; ISBN 978-92-79-45405-9.
- National Geographic Institute. Información Geográfica de Referencia. Available online: http://centrodedescargas.cnig.es/CentroDescargas/index.jsp (accessed on 10 April 2019).
- National Geographic Institute. Modelos Digitales de Elevaciones. Available online: http://centrodedescargas.cnig.es/CentroDescargas/catalogo.do?Serie=LIDA2 (accessed on 10 April 2019).
- Cintas, J.M.; Ruiz-Labrador, E.; Montoya-Bernabeu, P.; Montalvo, J. Recent temperature change in Spain: High spatial resolution modelling by machine learning. (unpublished; manuscript in preparation).
- Chen, Z.; Haynes, K.E. Impact of high speed rail on housing values: An observation from the Beijing–Shanghai line. J. Transp. Geogr. 2015, 43, 91–100. [Google Scholar] [CrossRef]
- Gutiérrez, J.A.; Berrocal, R.; Ruiz-Labrador, E.E.; Jaraíz, F.J.; Su-Jeong, J. An Accessibility analysis to the city bus stops in Mérida (Spain). Bol. Asoc. Geógr. Españoles 2014, 64, 249–272. [Google Scholar]
- McGrail, M.R.; Humphreys, J.S. Measuring spatial accessibility to primary care in rural areas: Improving the effectiveness of the two-step floating catchment area method. Appl. Geogr. 2009, 29, 533–541. [Google Scholar] [CrossRef]
- Environmental Systems Research Institute (ESRI). Software ArcGIS. Available online: https://www.esri.com/es-es/home (accessed on 9 April 2019).
- Hardy, M. Regression with Dummy Variables; Little Green Book Series; Sage: Los Angeles, CA, USA, 1993; Available online: http://0-srmo-sagepub-com.brum.beds.ac.uk/view/regression-with-dummy-variables/n1.xml (accessed on 9 April 2019).
- R Development Core Team. Statistics R Software. Available online: https://cran.r-project.org/ (accessed on 9 April 2019).
- Wang, Z.; Han, Q.; de Vries, B. Land Use/Land Cover and Accessibility: Implications of the Correlations for Land Use and Transport Planning. Appl. Spat. Anal. Policy 2018, 1–18. [Google Scholar] [CrossRef]
- The Swedish Agency for Growth Policy Analysis. Accessibility to Urban Areas of Different Sizes. 2010. Available online: http://www.tillvaxtanalys.se/download/18.1d7fbce414d2f83fc768326a/1431418934543/WP_PM_2010_10_EN.pdf (accessed on 10 April 2019).
- Mohíno, I. Changing Accessibility and Mobility Patterns in Reconfigured Rural Metro-Adjacent Regions. The Case of Castilla-La Mancha in the Context of the Madrid Polycentric Urban Region. Ph.D. Thesis, University of Castilla–La Mancha, Castilla-La Mancha, Spain, 2015. [Google Scholar]
- Roberts, P.; Shyam, K.C.; Rastogi, C. Rural Access Index: A Key Development Indicator. The International Bank for Reconstruction and Development/The World Bank. 2006. Available online: https://openknowledge.worldbank.org/handle/10986/17414 (accessed on 10 April 2019).
- Ubilla-Bravo, G. Accessibility and geographical connectivity in rural areas. The case of Maria Pinto district, Chile. Geogr. Pap. 2017, 63. [Google Scholar] [CrossRef]
- Martínez, H. Defining rural: A functional and accessibility approach applied in Castilla-La Mancha (Spain). REDES 2018, 23, 248–266. [Google Scholar] [CrossRef]
- Karou, S.; Hul, A. Accessibility Measures and Instruments. Accessibility Instruments for Planning Practice; Hull, A., Silva, C., Bertolini, L., Eds.; COST Office, 2012; pp. 1–19. Available online: http://www.accessibilityplanning.eu/wp-content/uploads/2013/01/Accessibility-Measures-and-Instruments-R.pdf (accessed on 10 April 2019).
- Farrington, J.; Farrington, C. Rural accessibility, social inclusion and social justice: Towards conceptualisation. J. Transp. Geogr. 2005, 13, 1–12. [Google Scholar] [CrossRef]
- Chi, G.; Deller, S. Rethinking Highway Effects on Population Change. Public Work. Manag. Policy 2006, 11, 18–32. [Google Scholar] [CrossRef]
- Jin, J.K.; Jun, H.H. Straw effects of new highway construction on local population and employment growth. Habitat Int. 2016, 53, 123–132. [Google Scholar] [CrossRef]
- Chi, G. The Impacts of Highway Expansion on Population Change: An Integrated Spatial Approach. Rural Sociol. 2010, 1, 58–89. [Google Scholar] [CrossRef]
- Collantes, F.; Pinilla, V. Extreme Depopulation in the Spanish Rural Mountain Areas: A Case Study of Aragon in the Nineteenth and Twentieth Centuries. Rural Hist. 2004, 15, 149–166. [Google Scholar] [CrossRef]
- Mladenov, C. Demographic Potential and Problems of the Settlements Network in the Mountains of Bulgaria. In Sustainable Development in Mountain Regions: Southeastern Europe; Zhelezov, G., Ed.; Springer: Cham, Switzerland, 2016; pp. 227–239. ISBN 978-94-007-0131-1. [Google Scholar]
- Corbelle-Rico, E.; Crecente-Maseda, R.; Santé-Riveira, I. Multi-scale assessment and spatial modelling of agricultural land abandonment in a European peripheral region: Galicia (Spain), 1956–2004. Land Use Policy 2012, 29, 493–501. [Google Scholar] [CrossRef]
- Hou, Y.; Müller, F.; Li, B.; Kroll, F. Urban-Rural Gradients of Ecosystem Services and the Linkages with Socioeconomics. Landsc. Online 2015, 39, 1–31. [Google Scholar] [CrossRef]
- Salvati, L.; Serra, P. Estimating Rapidity of Change in Complex Urban Systems: A Multidimensional, Local-Scale. Approach Geogr. Anal. 2016, 48, 132–156. [Google Scholar] [CrossRef]
- Pew Research Center. What Unites and Divides Urban, Suburban and Rural Communities. 2018. Available online: https://www.pewsocialtrends.org/2018/05/22/what-unites-and-divides-urban-suburban-and-rural-communities/ (accessed on 10 April 2019).
- Requés, P. La transición territorial. Cambios en las estructuras demo-espaciales en España (1900–2011) un análisis municipal. In La población en España, 40 años de Cambio (1975–2015); Sempere, J.D., Cutillas, E., Eds.; Universitat d’Alacant: Alicante, Spain, 2017; pp. 67–132. ISBN 978-84-16724-39-0. [Google Scholar]
- Veneri, P.; Ruiz, V. Urban-to-Rural Population Growth Linkages: Evidence from OECD TL3 Regions. In OECD Regional Development Working Papers; OECD Publishing: Paris, France, 2013; Volume 3. [Google Scholar]
- Lee, R.D. Population dynamics of humans and other animals. Demographic 1987, 24, 443–465. [Google Scholar] [CrossRef]
- Rappaport, J. Moving to nice weather. Reg. Sci. Urban Econ. 2007, 37, 375–398. [Google Scholar] [CrossRef]
- Serra, P.; Vera, A.; Tulla, A.F.; Salvati, L. Beyond urban-rural dichotomy: Exploring socioeconomic and land-use processes of change in Spain (1991–2011). Appl. Geogr. 2014, 55, 71–81. [Google Scholar] [CrossRef]
- Attenborough, R. Ecology, homeostasis and survival in human population dynamics. In Human Population Dynamics: Cross-Disciplinary Perspectives; Macbeth, H., Collison, P., Eds.; Cambridge University Press: Cambridge, UK, 2004; pp. 186–208. [Google Scholar]
- Polyakov, M.; Zhang, D. Population Growth and Land Use Dynamics along Urban–Rural Gradient. J. Agric. Appl. Econ. 2008, 40, 649–666. [Google Scholar] [CrossRef]
- Kroll, F.; Kabisch, N. The Relation of Diverging Urban Growth Processes and Demographic Change along an Urban–Rural Gradient. Popul. Space Place 2012, 18, 260–276. [Google Scholar] [CrossRef]
- Hinde, A. Demographic perspective on human population dynamics. In Human Population Dynamics: Cross-Disciplinary Perspectives; Macbeth, H., Collison, P., Eds.; Cambridge University Press: Cambridge, UK, 2002; pp. 41–64. ISBN 0-521-80865-0. [Google Scholar]
- Montalvo, J.; Montoya, P.; Segú, J.; Ruíz, E. Envejecimiento Poblacional a Escala Municipal de España: Tendencias Geográficas y Factores Asociados. 2018. Available online: https://fundacionmatrix.es/envejecimiento-poblacional-a-escala-municipal-de-espana-tendencias-geograficas-y-factores-asociados/ (accessed on 10 April 2019).
- Andreev, K.; Kantorová, V.; Bongaarts, J. Demographic Components of Future Population Growth; United Nations: New York, NY, USA, 2013; Available online: https://www.un.org/en/development/desa/population/publications/pdf/technical/TP2013-3.pdf (accessed on 10 April 2019).
- ESHRE. Europe the continent with the lowest fertility. Hum. Reprod. Update 2010, 16, 590–602. [Google Scholar] [CrossRef] [PubMed] [Green Version]
- Montalvo, J.; Cintas, J.M.; Montoya, P.; Segú, J.; Ruíz, E. Mortalidad General y Específica de Mayores de España: Tendencias Geográficas y Factores Asociados. 2018. Available online: https://fundacionmatrix.es/mortalidad-general-y-especifica-de-mayores-de-espana-tendencias-geograficas-y-factores-asociados/ (accessed on 10 April 2019).
- European Union. The State of European Cities 2016. Cities Leading the Way to a Better Future. 2016. Available online: https://ec.europa.eu/regional_policy/sources/policy/themes/cities-report/state_eu_cities2016_en.pdf (accessed on 10 April 2019).
- Collantes, F.; Pinilla, V.; Sáez, L.A.; Silvestre, J. Reducing Depopulation in Rural Spain: The Impact of ImmigrationPopul. Space Place 2014, 20, 606–621. [Google Scholar] [CrossRef]
- Chen, C.Y. The Effect of Migration on the Mean Age of Population: An Application of Preston’s Mean Age of Population Improvement Model. J. Fam. Hist. 2015, 40, 92–110. [Google Scholar] [CrossRef]
- Lutz, W. Fertility rates and future population trends: Will Europe’s birth rate recover or continue to decline? Int. J. Androl. 2006, 29, 25–33. [Google Scholar] [CrossRef] [PubMed]
Figure 1.
Map of the average annual growth rate of populations of Spain municipalities (2007–2016). Data source: Statistics National Institute and National Geographic Institute of Spain [43,46].

Figure 2.
Principal component analysis (PCA) scatterplot of 8125 municipalities of Spain represented by dots along the two axes (PC1 and PC2) calculated from values for 12 demographic and territorial variables from these municipalities. Each one is identified by a predefined rurality category (Table 1). Axis 1 described a rurality gradient associated with changes in population growth rate and population age; axis 2 described variation in land-use dominance and terrain slope (see Table 2).

Figure 3.
Annual population growth rate in municipalities of Spain along a rurality gradient. (a) Average values; (b) frequency distributions of classes of population growth rate.
Figure 3.
Annual population growth rate in municipalities of Spain along a rurality gradient. (a) Average values; (b) frequency distributions of classes of population growth rate.

Figure 4.
Spatial model of road accessibility index in the municipalities of Spain. Road accessibility estimation was based on road network travel time to access to nearest five attractor municipalities. Data source: Statistics National Institute and National Geographic Institute of Spain [46].
Figure 4.
Spatial model of road accessibility index in the municipalities of Spain. Road accessibility estimation was based on road network travel time to access to nearest five attractor municipalities. Data source: Statistics National Institute and National Geographic Institute of Spain [46].

Figure 5.
Average road accessibility of municipalities of Spain along a rurality gradient. Vertical bars represent standard error of means. See Figure 4.
Figure 5.
Average road accessibility of municipalities of Spain along a rurality gradient. Vertical bars represent standard error of means. See Figure 4.

Figure 6.
Scatter plots of patterns of change in average annual population growth rate (period 2007–2016) with (a) road accessibility index and (b) population mean age, in 8125 municipalities of Spain (log-scale for both independent variables). Dot colours represent different rurality categories (Table 1). Road accessibility classes are indicated in (a). Regression lines fitted to data are shown (see equations in Table 3). An outlier with a growth rate of 22.5% was omitted in the plots.

Figure 7.
Scatter plot of the population mean age versus road accessibility index in 8125 municipalities of Spain (log-scale for both variables). Dot colours represent different rurality categories (Table 1). Road accessibility classes are indicated. Regression line fitted to data is shown.
Figure 7.
Scatter plot of the population mean age versus road accessibility index in 8125 municipalities of Spain (log-scale for both variables). Dot colours represent different rurality categories (Table 1). Road accessibility classes are indicated. Regression line fitted to data is shown.

Figure 8.
Visualization of potential drivers of population growth rate at local level. Arrows represent potential interactions (indirect in blue and direct in green), their magnitude proportional being to arrow thickness and the influence on growth rate indicated by the associated correlation sign (positive or negative).


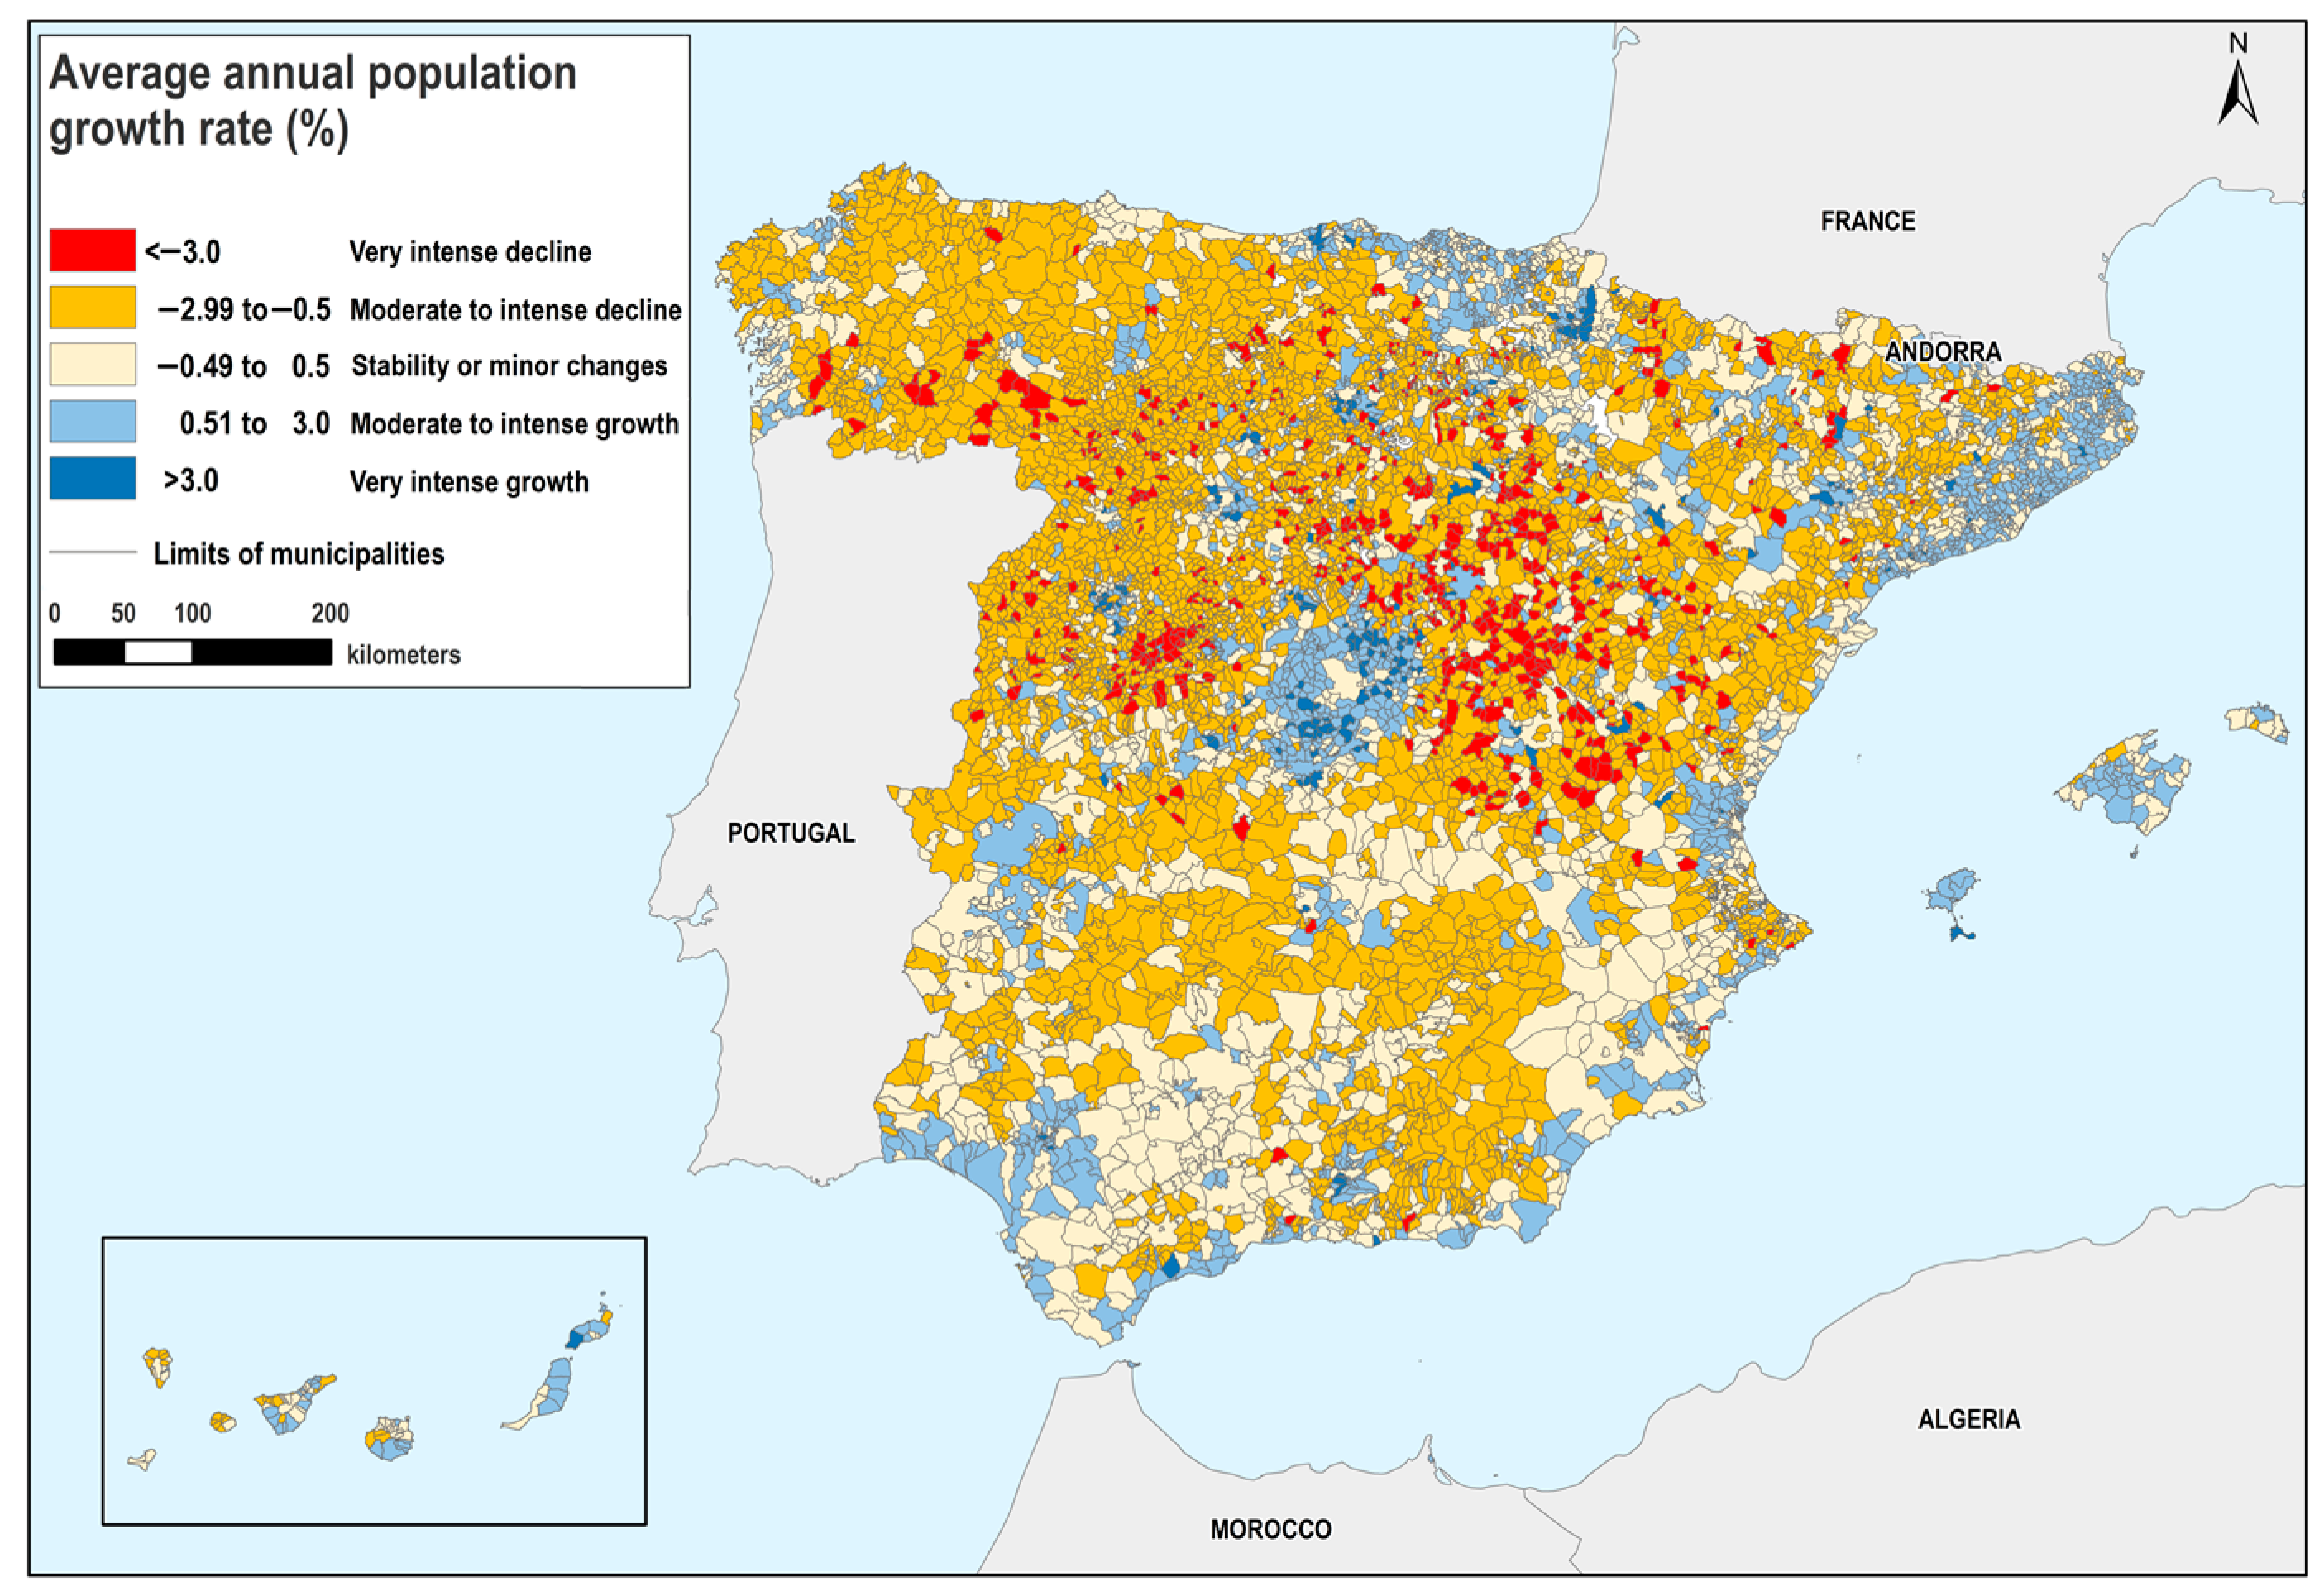
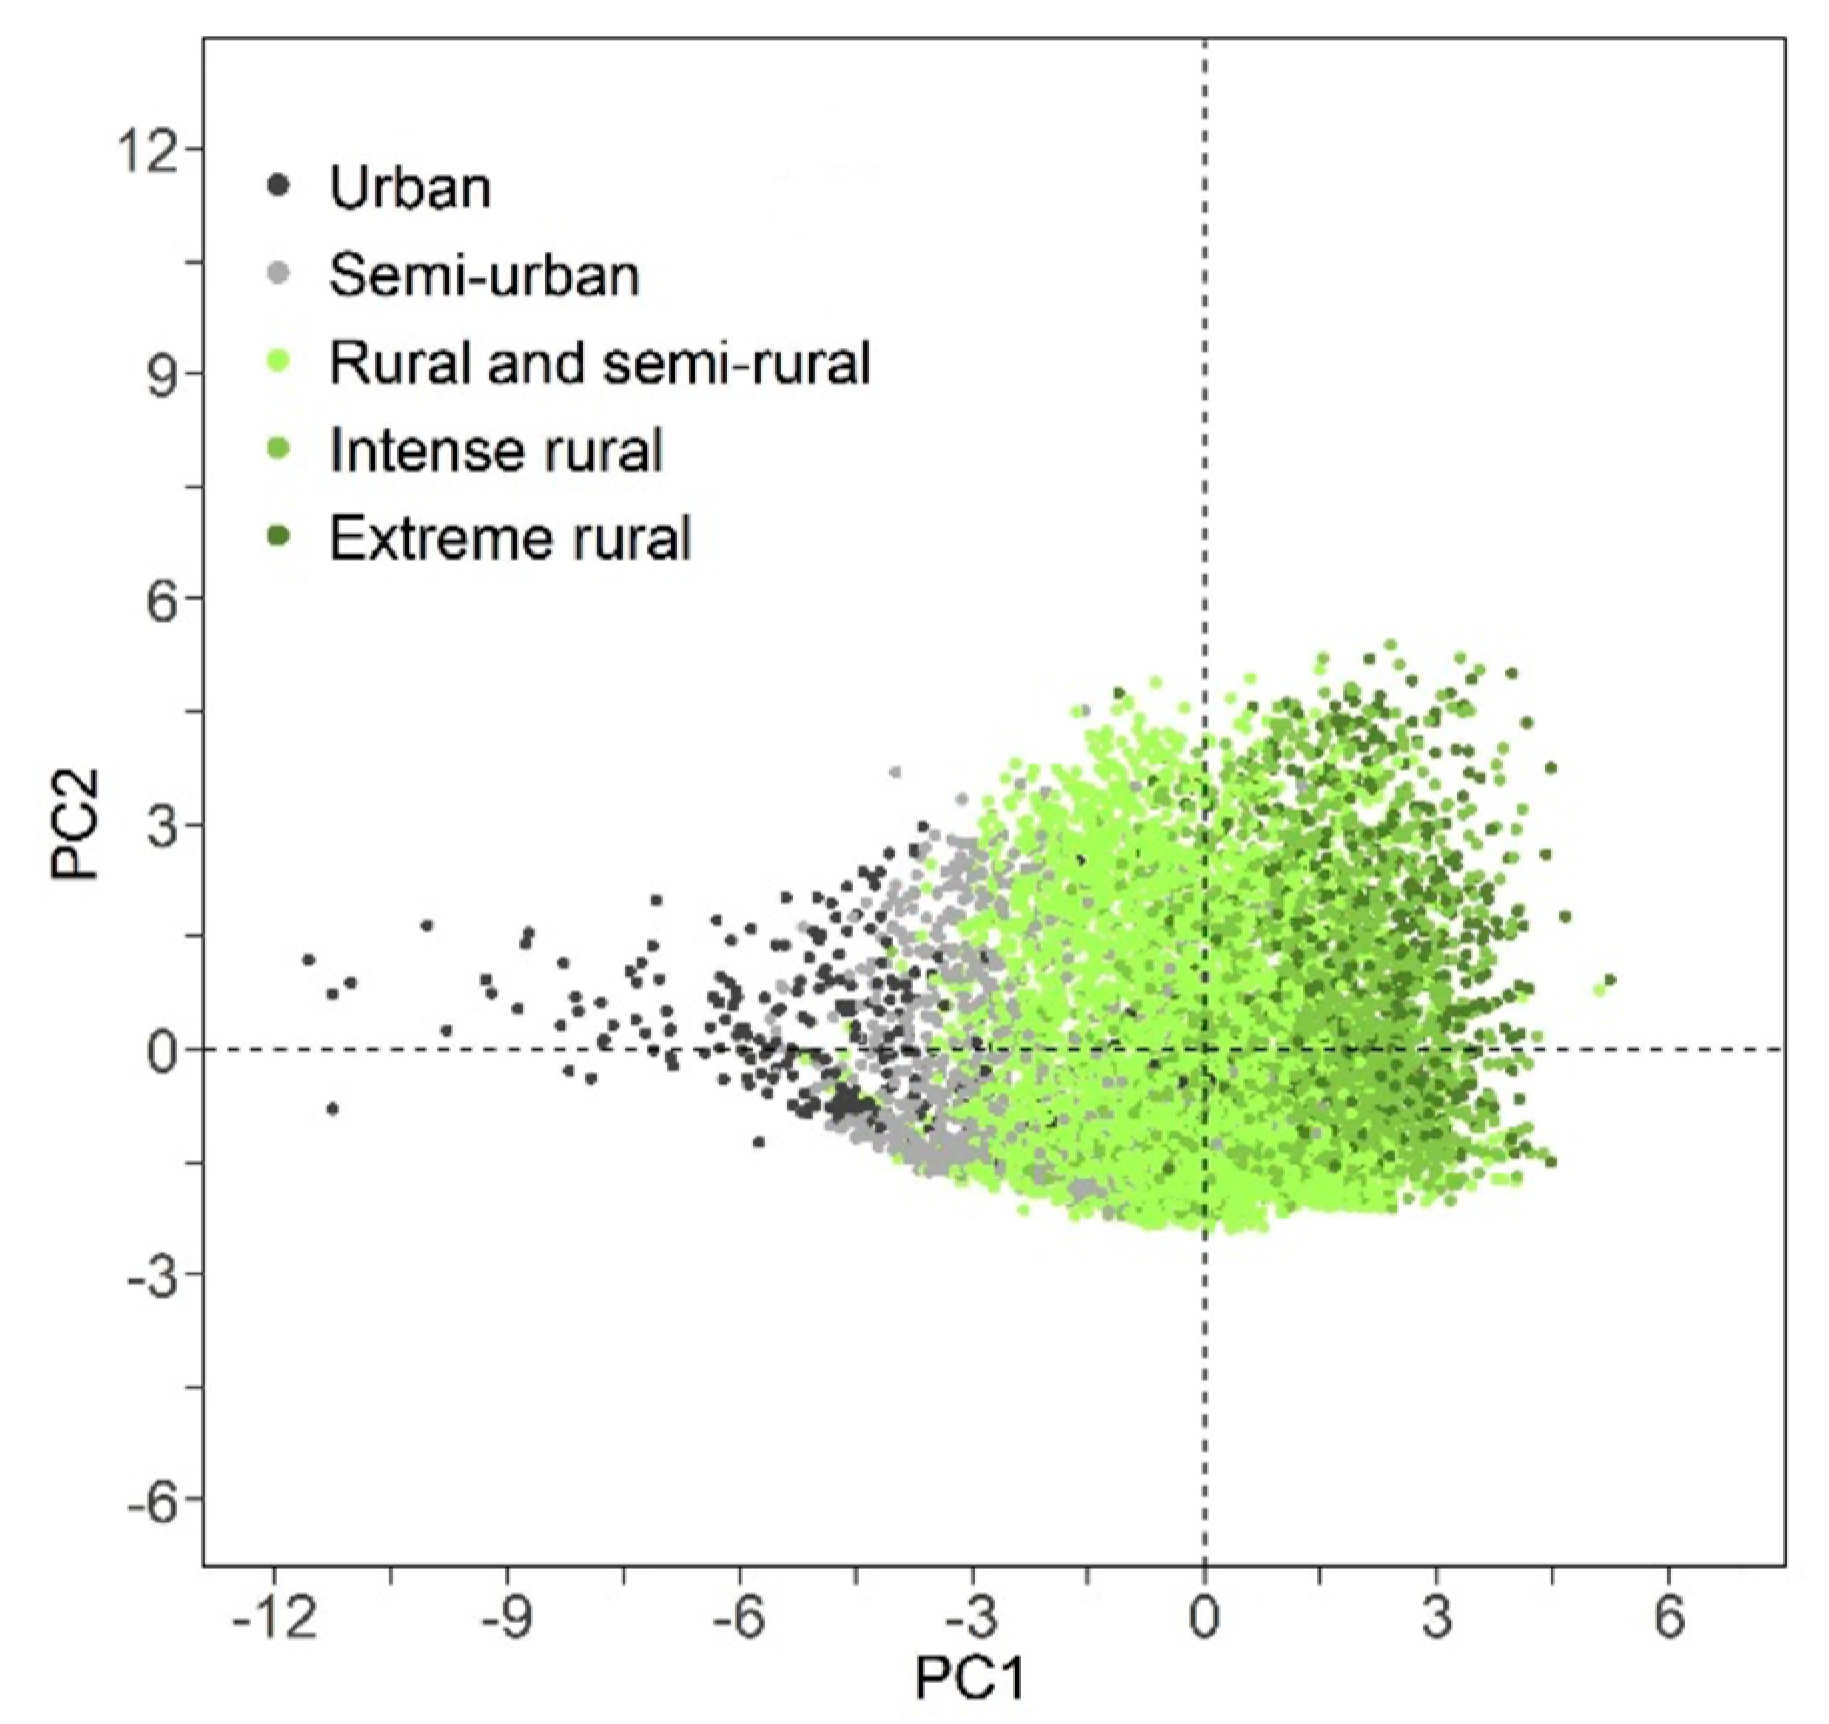
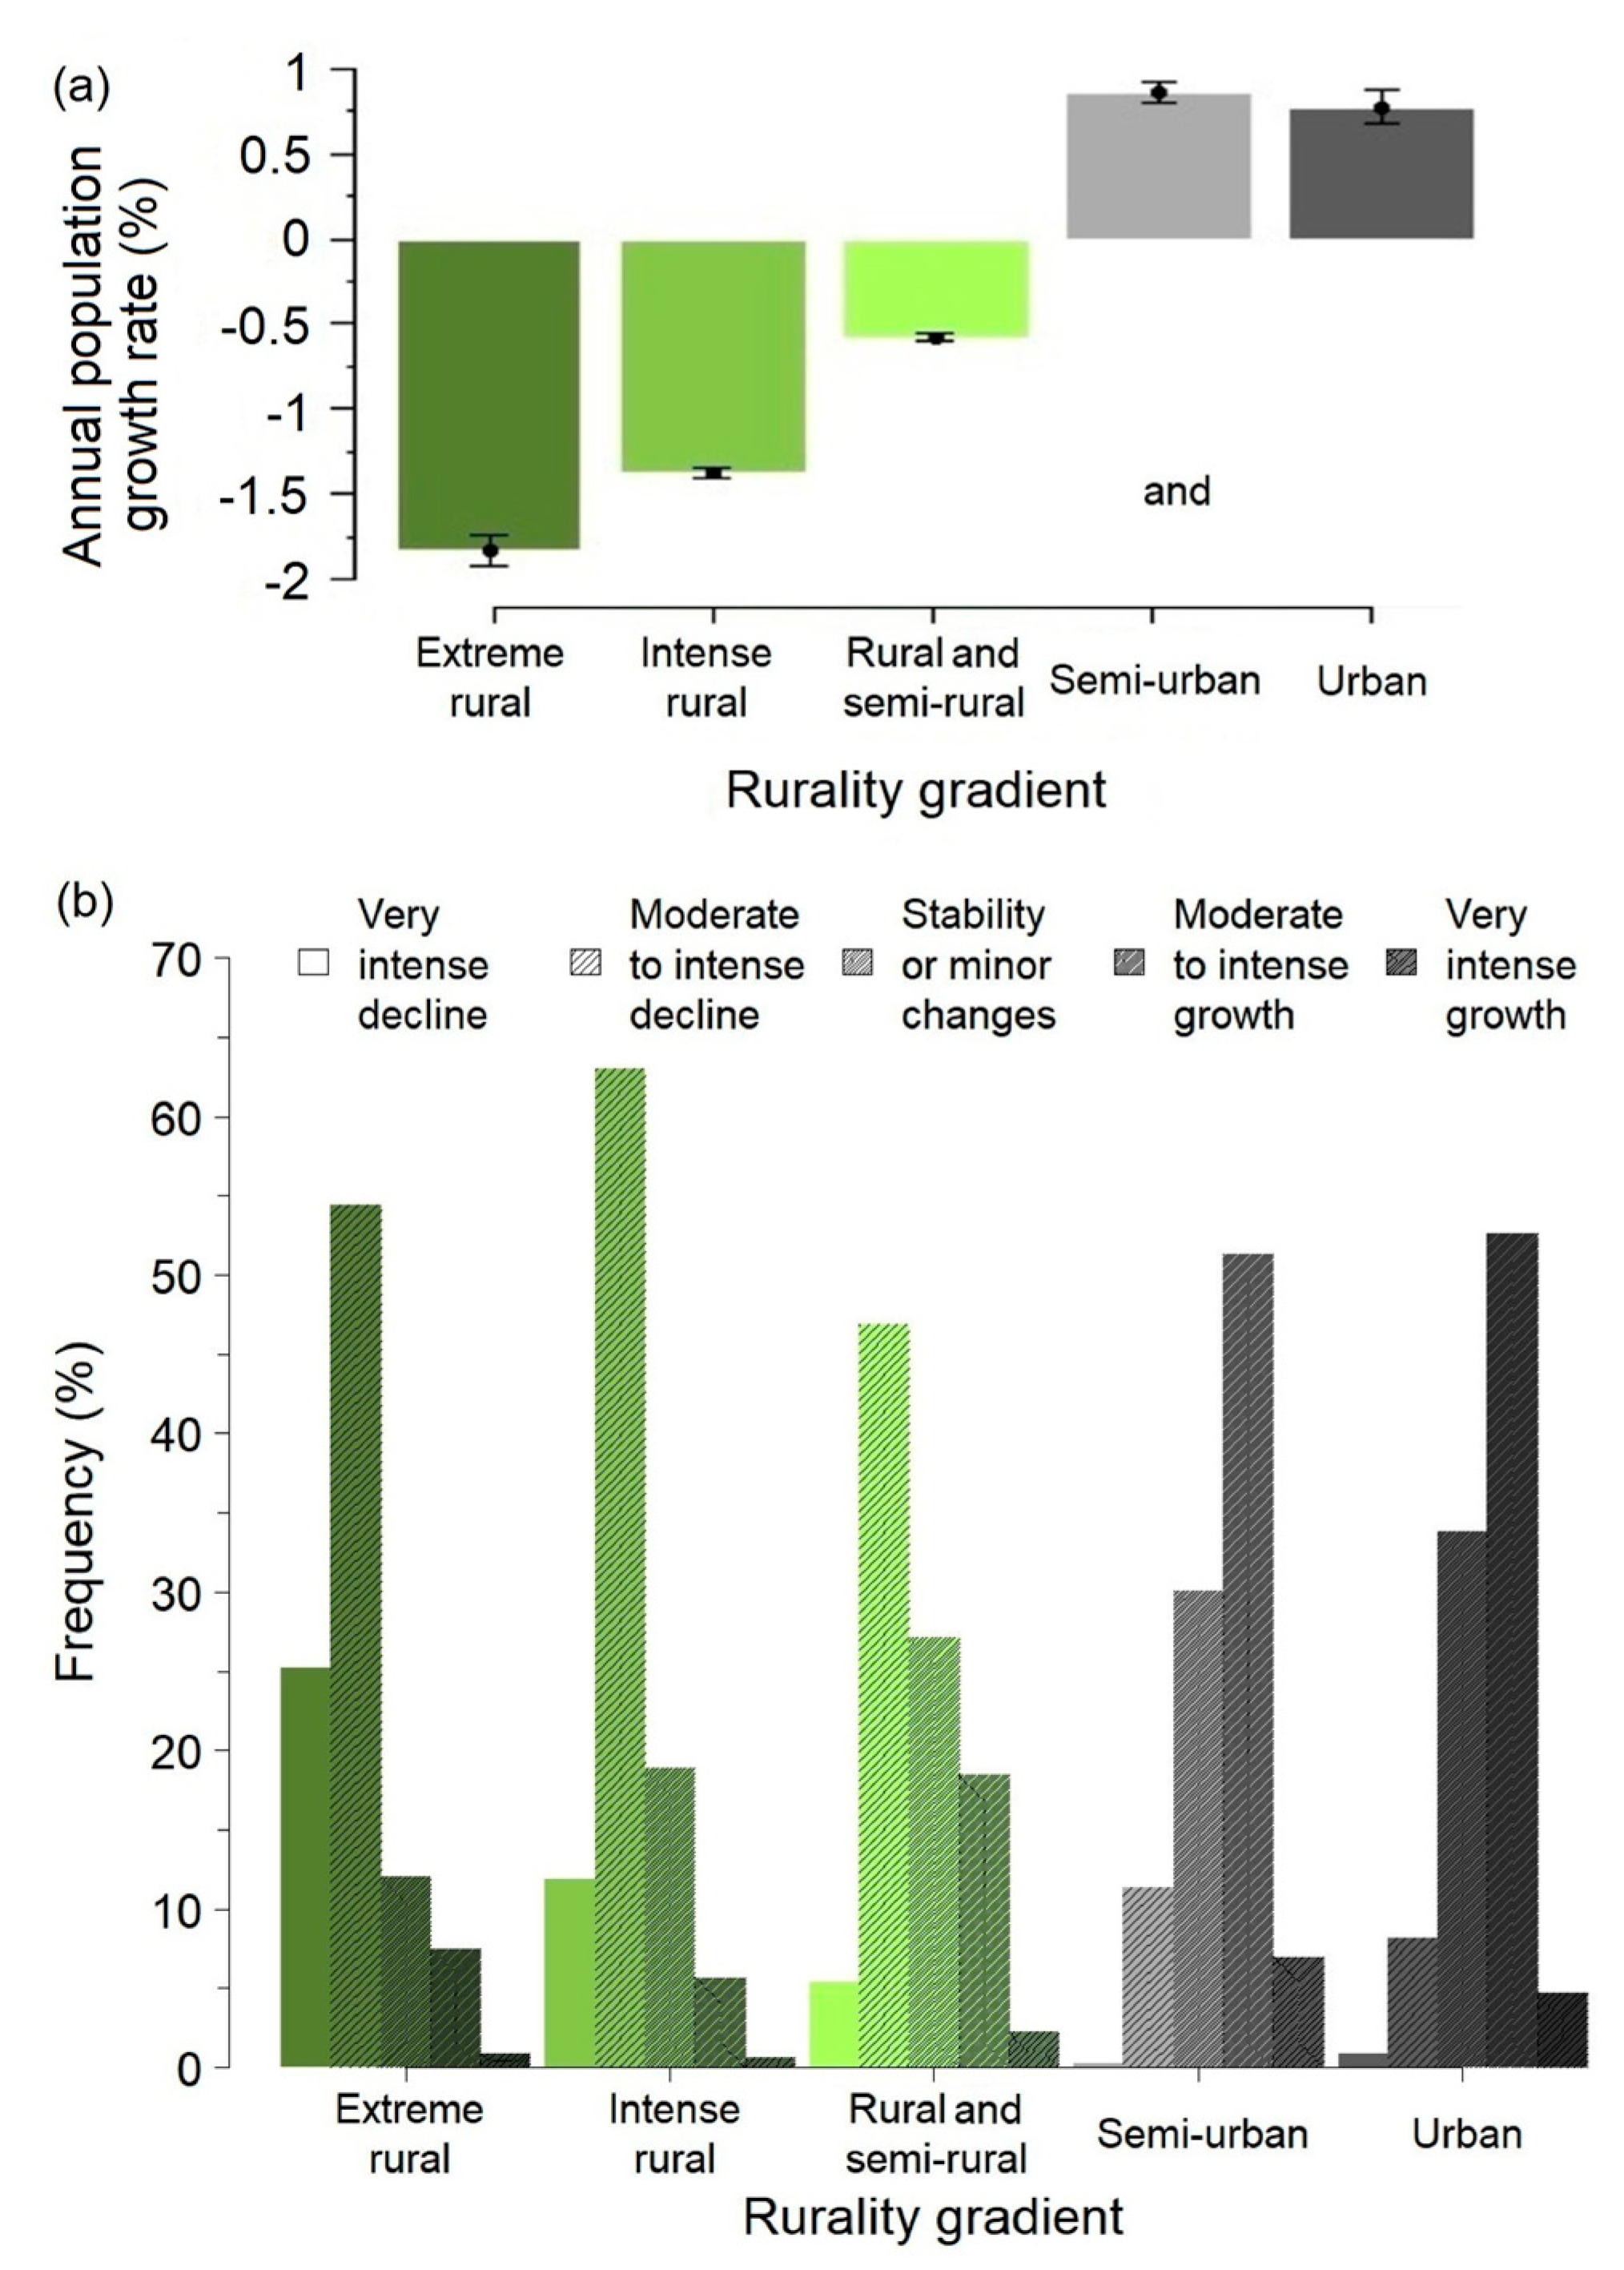
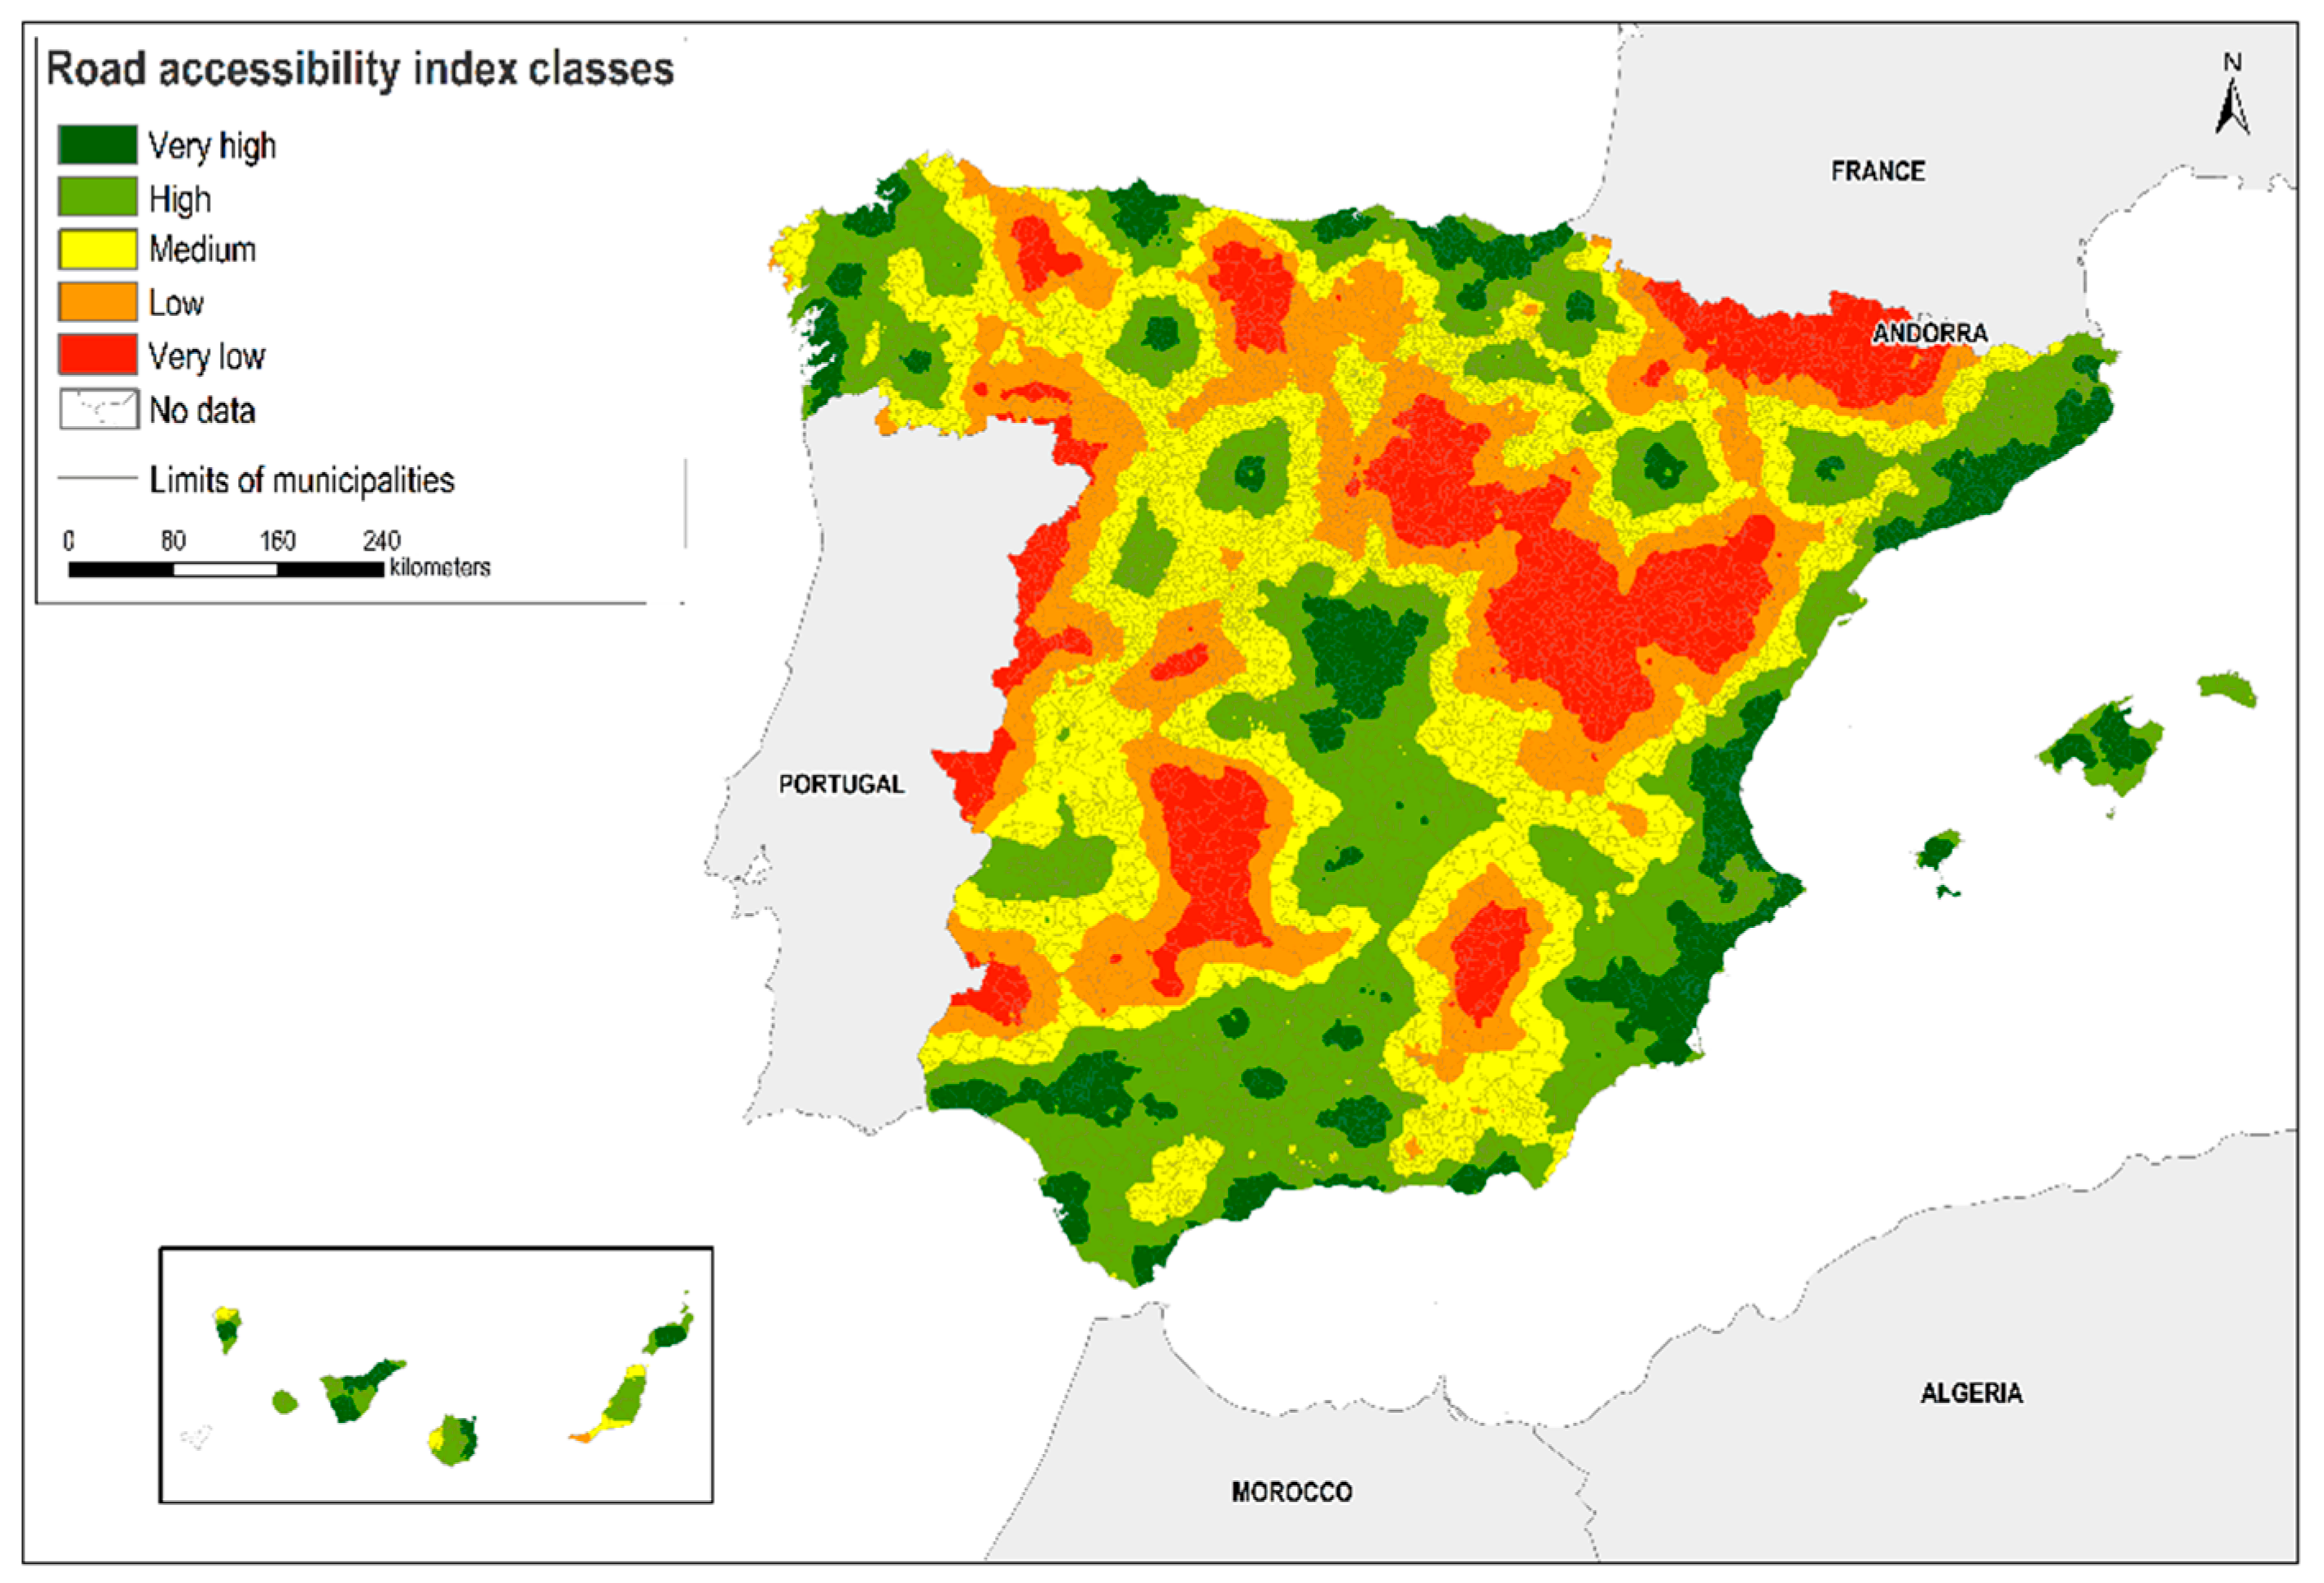
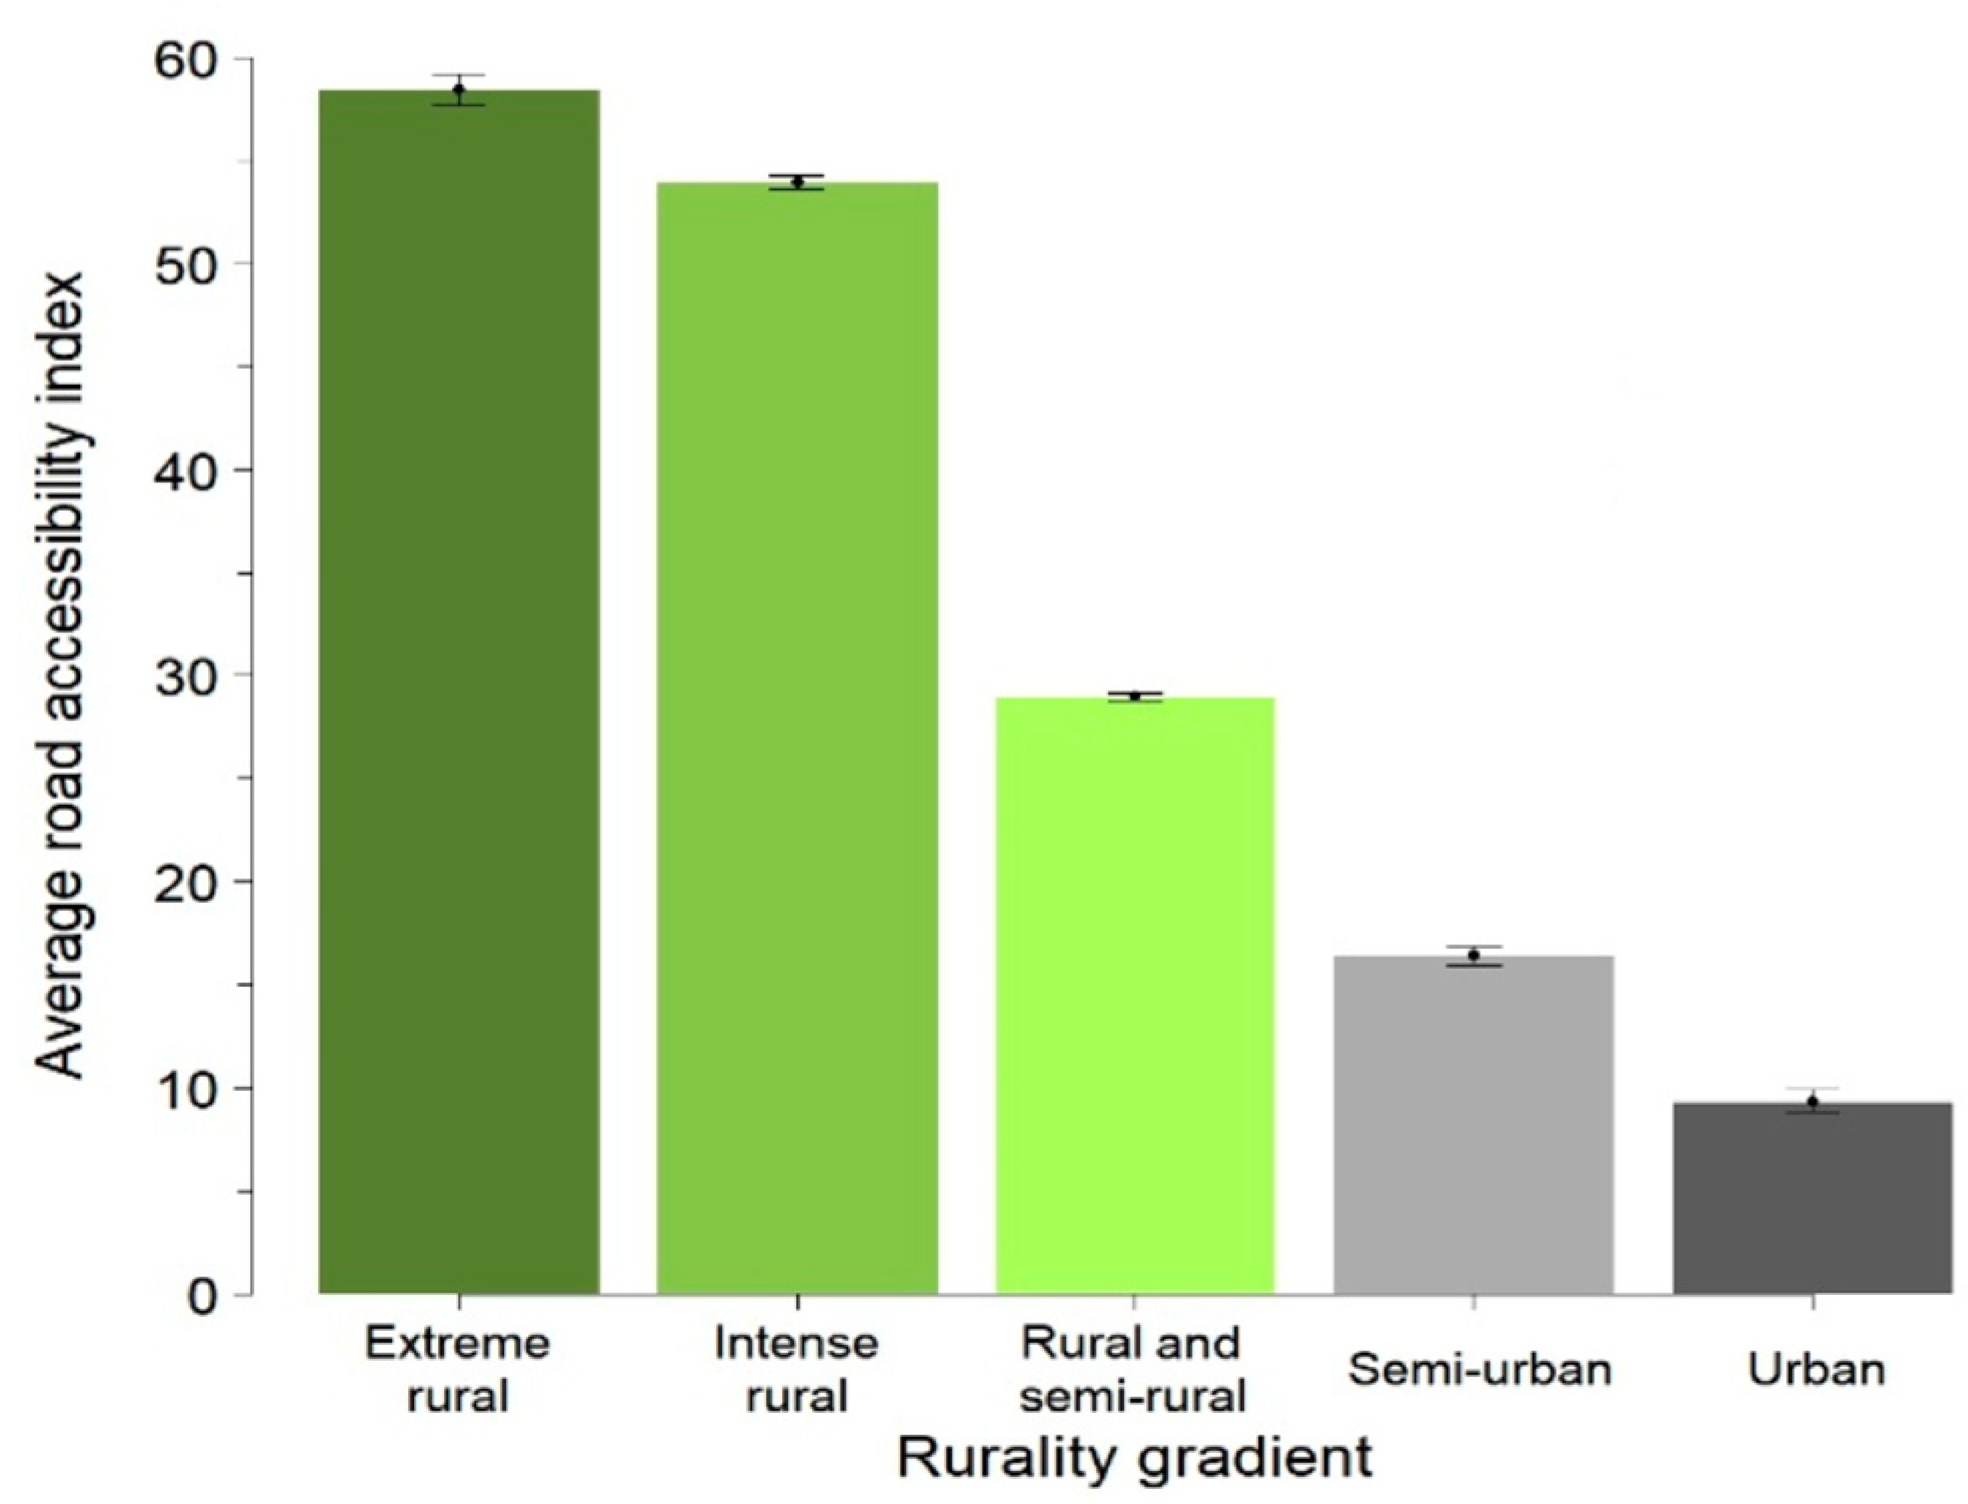
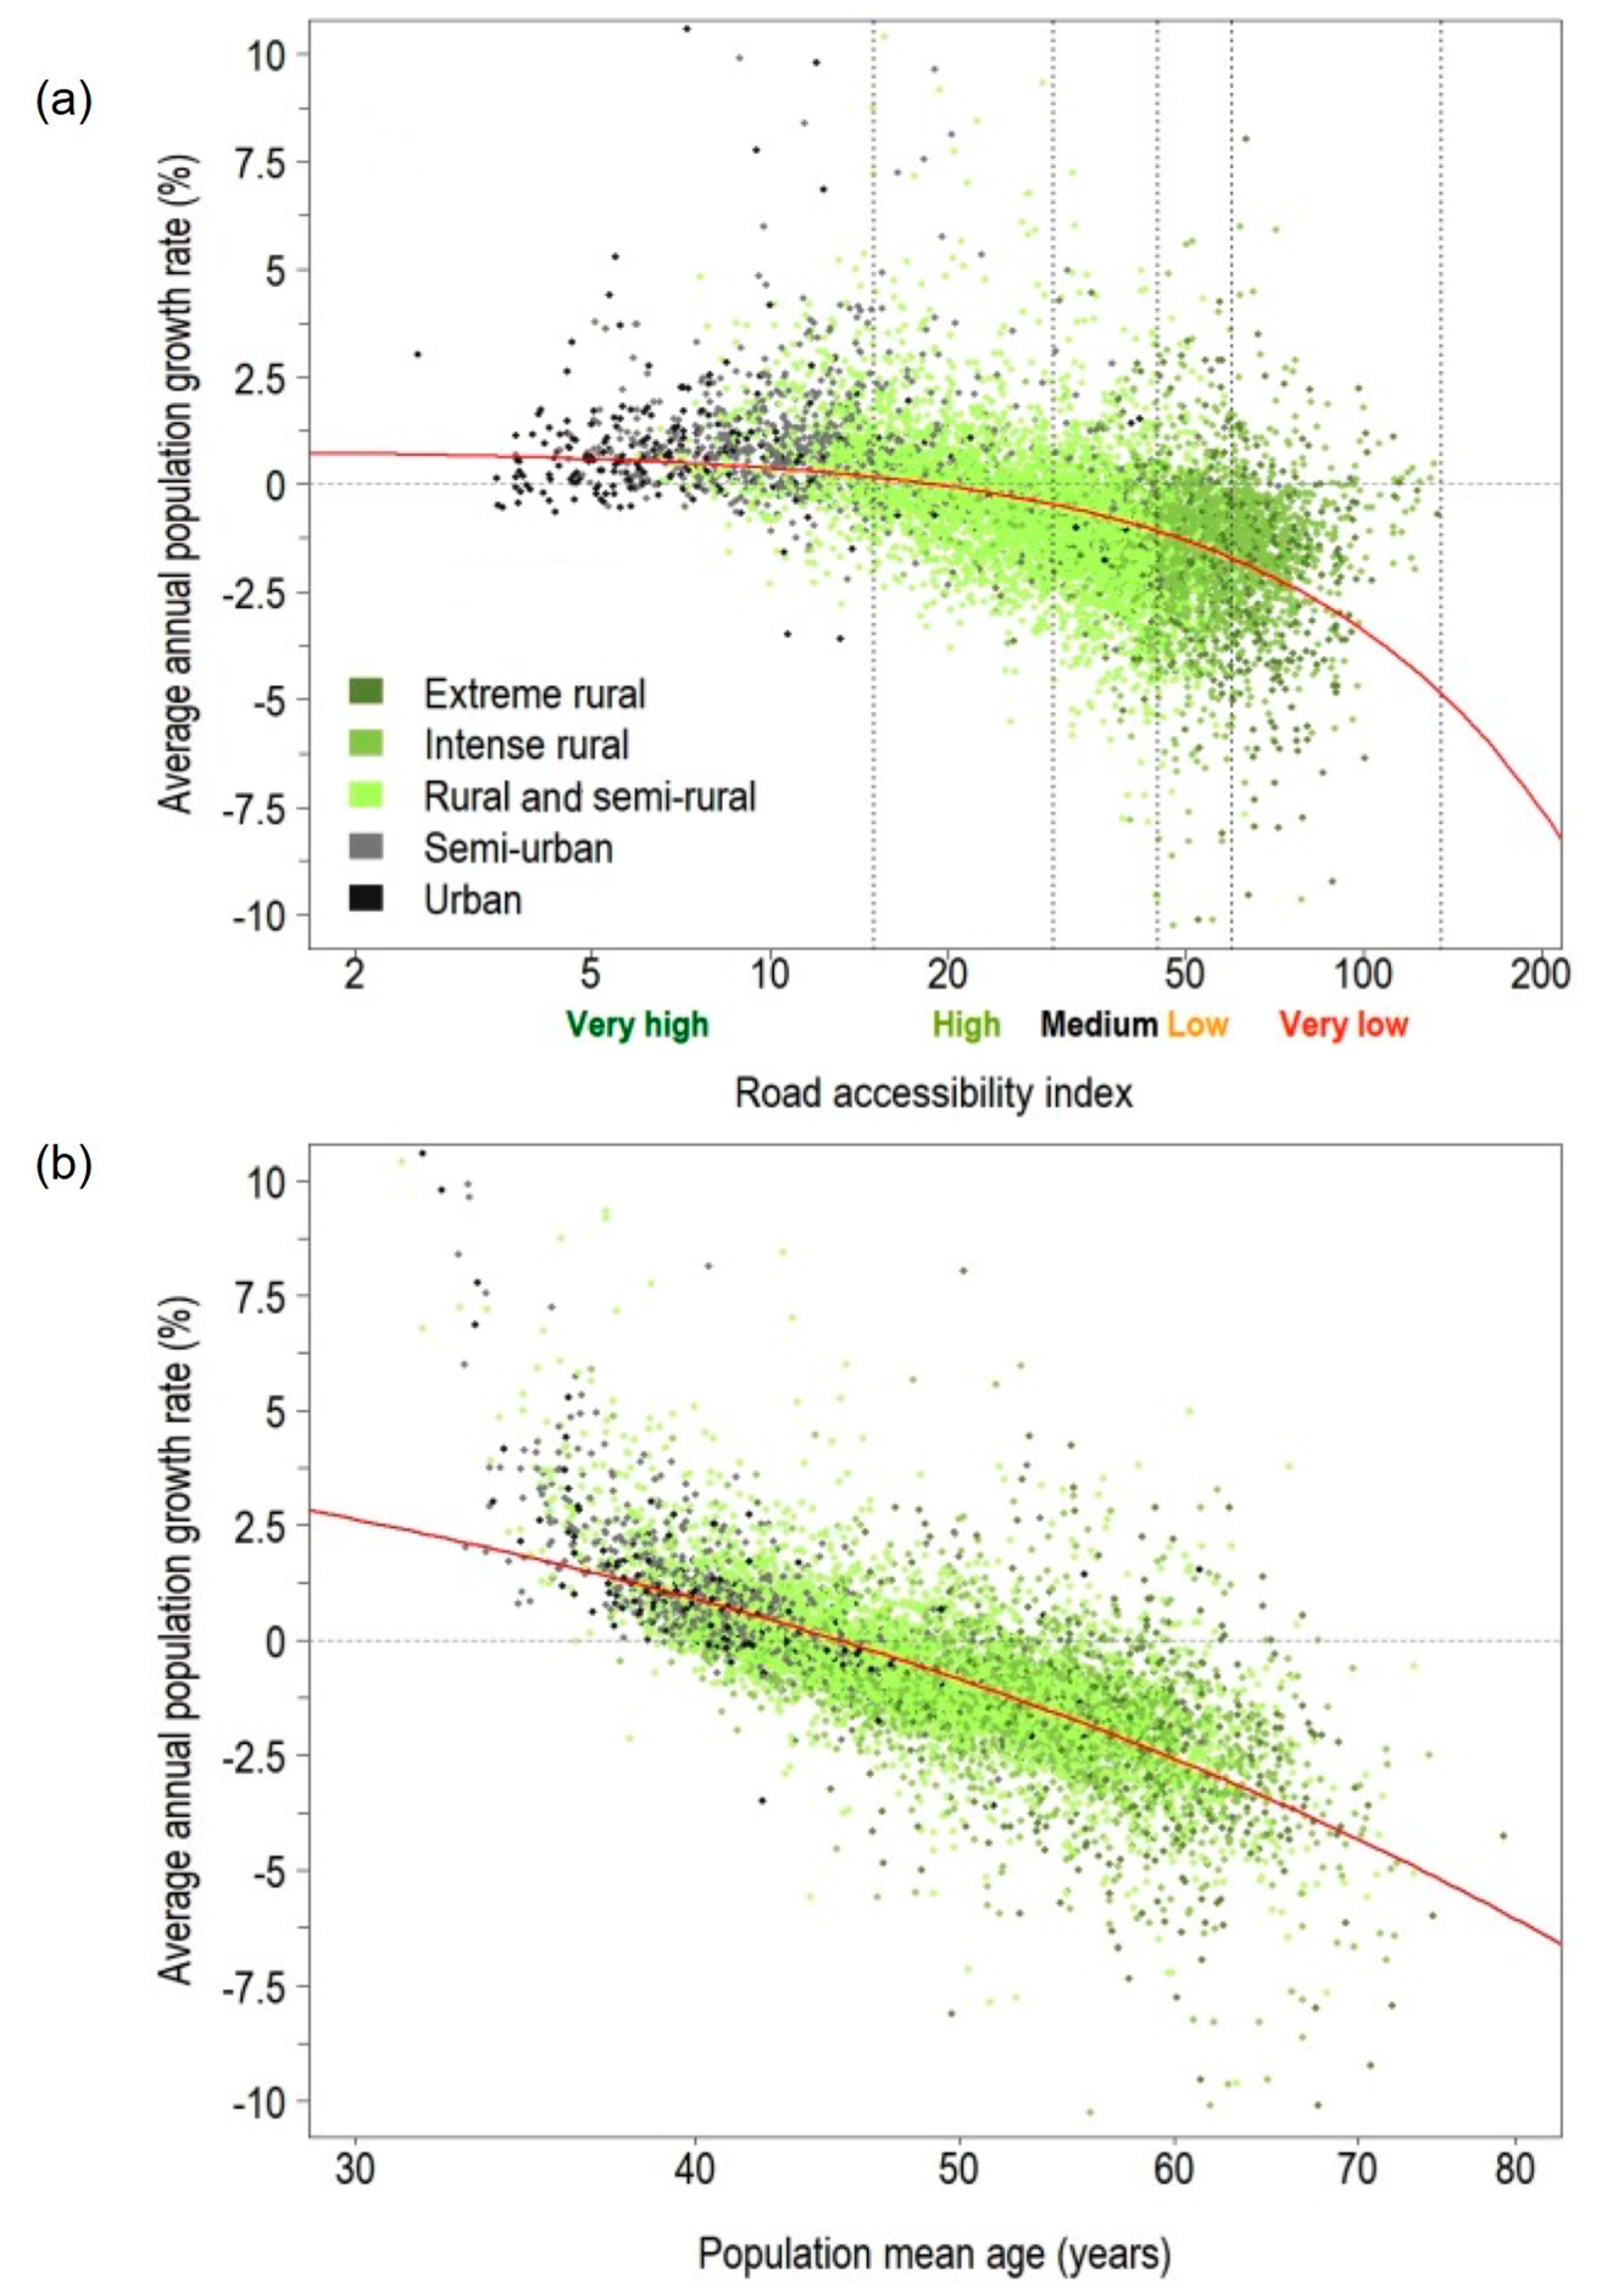
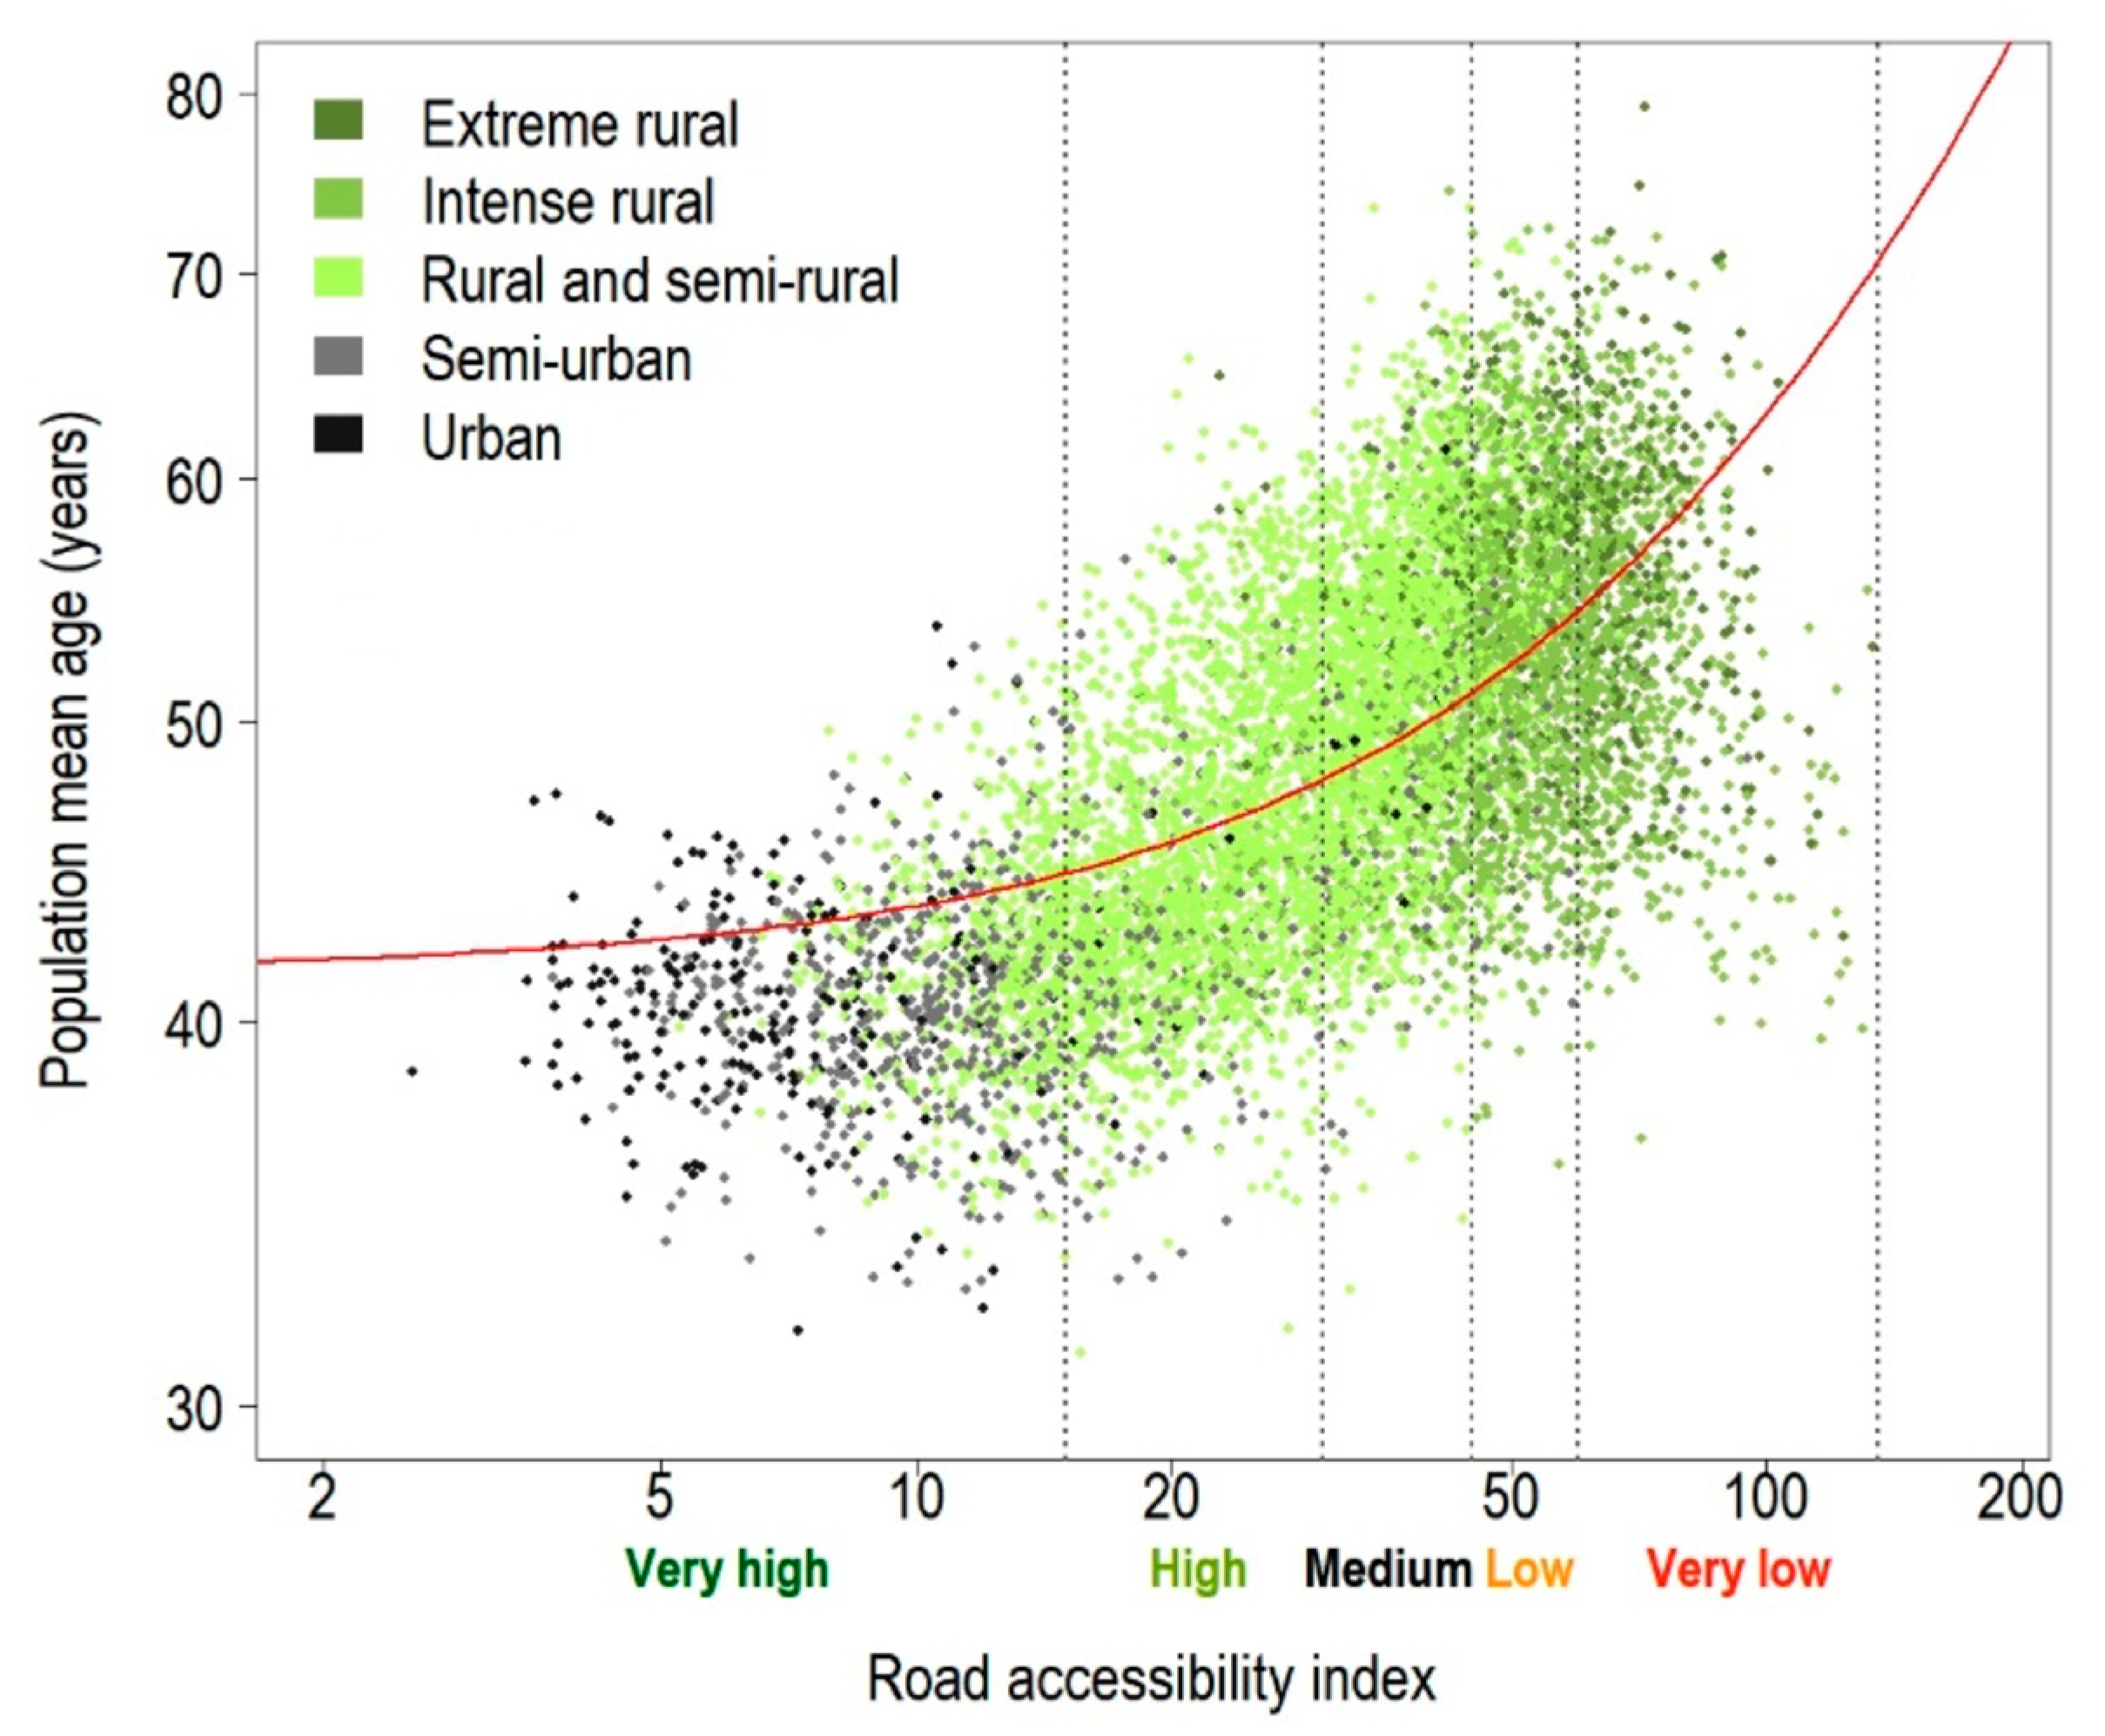
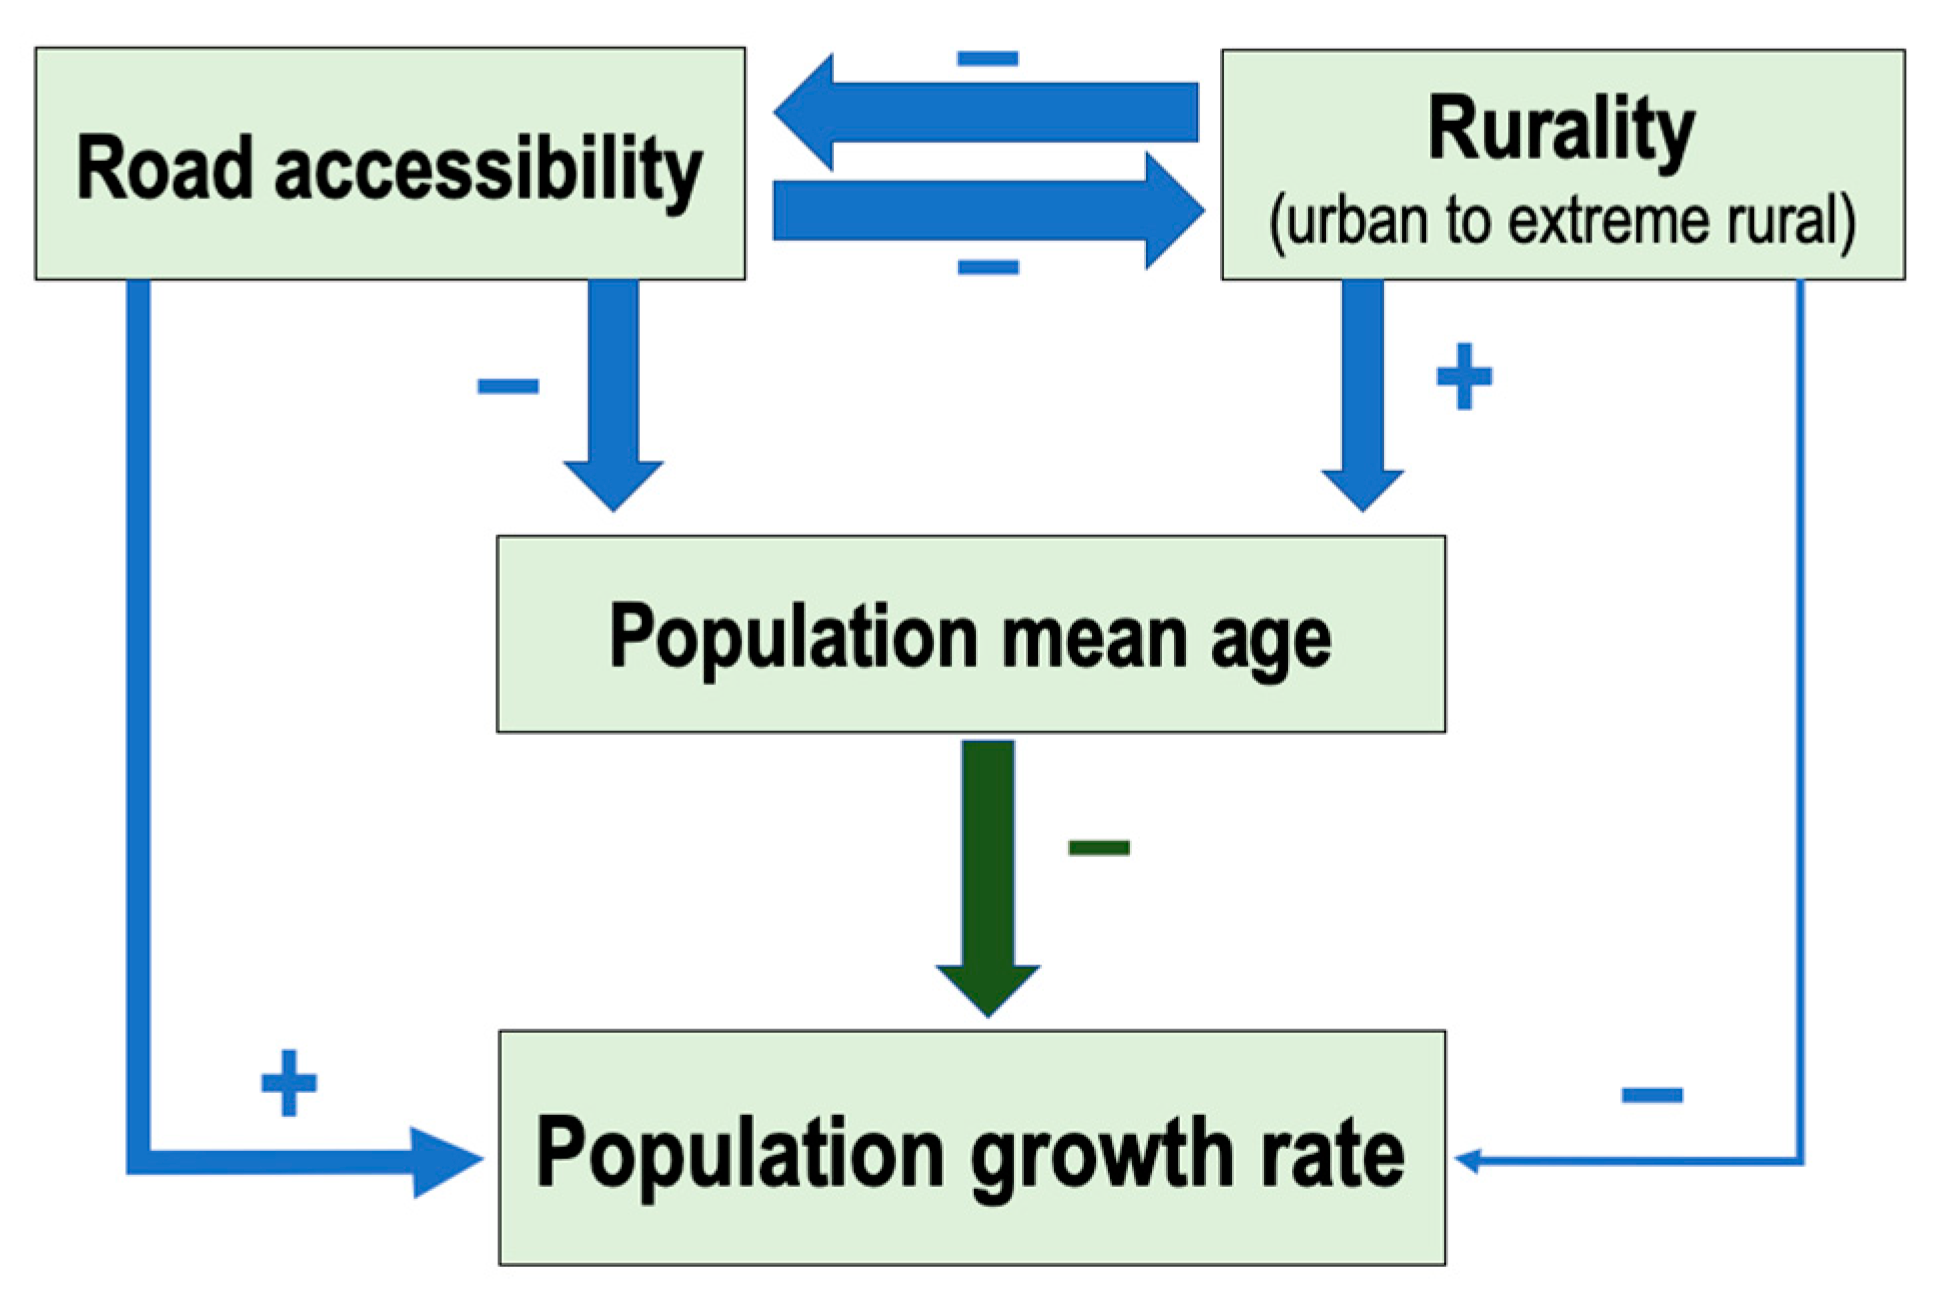
Table 1.
Absolute and relative figures of number of municipalities, total area and total population in 2016 by rurality categories [37].
Table 1.
Absolute and relative figures of number of municipalities, total area and total population in 2016 by rurality categories [37].
| Rurality Category | Municipalities | Area | Population | |||
|---|---|---|---|---|---|---|
| Number | Frequency (%) | km2 | Frequency (%) | People | Frequency (%) | |
| Extreme rural | 548 | 6.7 | 30,451.6 | 6.0 | 84,013 | 0.2 |
| Intense rural | 2167 | 26.7 | 167,669.6 | 33.2 | 2,673,965 | 5.7 |
| Rural and semi-rural | 4445 | 54.7 | 272,049.5 | 53.8 | 12,907,604 | 27.7 |
| Semi-urban | 731 | 9.0 | 30,088.1 | 6.0 | 14,111,638 | 30.4 |
| Urban | 234 | 2.9 | 4994.3 | 1.0 | 16,779,788 | 36.0 |
| Total | 8125 | 100.0 | 505,253.2 | 100.0 | 46,557,008 | 100.0 |
Table 2.
Loading factors of variables associated to PCA ordination space (see Figure 2). In bold, the highest values of each component are shown. All correlation coefficients with p < 0.001.
Table 2.
Loading factors of variables associated to PCA ordination space (see Figure 2). In bold, the highest values of each component are shown. All correlation coefficients with p < 0.001.
| Variable | PC1 | PC2 | PC3 |
|---|---|---|---|
| Population growth rate | −0.63 | 0.03 | −0.23 |
| Population mean age | 0.78 | −0.03 | 0.23 |
| Population size | −0.27 | 0.01 | 0.58 |
| Population density | −0.49 | 0.04 | 0.72 |
| Average elevation | 0.82 | 0.00 | 0.25 |
| Distance to coast | 0.55 | −0.43 | 0.24 |
| Annual mean temperature | −0.76 | −0.29 | −0.19 |
| Average terrain slope | 0.11 | 0.80 | −0.13 |
| Road accessibility index | 0.79 | 0.11 | 0.16 |
| Percentage of artificial land-use | −0.71 | 0.03 | 0.52 |
| Percentage of agricultural land-use | 0.21 | −0.91 | −0.17 |
| Percentage of forest land-use | 0.12 | 0.94 | −0.07 |
Table 3.
Regression predictive models of population growth rate (PGR), at local scale, using territorial and demographic explanatory variables. Multiple regression models include all variables of each type except the models of the last two rows. Access: road accessibility index; rurality categories: Int_Rur: intense rural, Rur_Semi-rur: rural and semi-rural, Semi-urb: semi-urban, Urb: urban; Artif: percentage of artificial area; Age: population mean age. For multiple regressions, adjusted R2 values are shown.
| Regression Model | Variable Type | Equation | R2 | F | p |
|---|---|---|---|---|---|
| Simple | Territorial | PGR = 4.08 − 3.23 × log Access | 0.25 | 2720 | <0.001 |
| Multiple | Territorial | PGR = −1.83 + 0.46 × Int_Rur + 1.25 × Rur_Semi-rur + 2.70 × Semi-urb + 2.61×Urb | 0.16 | 375 | <0.001 |
| Multiple | Territorial | PGR = 2.94 − 2.44 × log Access + 0.90 × log Artif − 0.31 × Int_Rur − 0.44 × Rur_Semi-rur − 0.52 × Semi-urb − 1.56 × Urb | 0.29 | 552 | <0.001 |
| Simple and multiple | Demographic | PGR = 33.2 − 20.1 × log Age | 0.52 | 8636 | <0.001 |
| Multiple | Territorial and demographic | PGR = 31.9 − 19 × log Age − 0.39 × log Access | 0.53 | 4437 | <0.001 |
| Multiple | Territorial and demographic | PGR = 31.7 − 19.3 × log Age − 0.08 × Int_Rur + 0.12 × Rur_Semi-rur + 0.35 × Semi-urb + 0.13 × Urb | 0.52 | 1753 | <0.001 |
© 2019 by the authors. Licensee MDPI, Basel, Switzerland. This article is an open access article distributed under the terms and conditions of the Creative Commons Attribution (CC BY) license (http://creativecommons.org/licenses/by/4.0/).
Share and Cite
MDPI and ACS Style
Montalvo, J.; Ruiz-Labrador, E.; Montoya-Bernabéu, P.; Acosta-Gallo, B. Rural–Urban Gradients and Human Population Dynamics. Sustainability 2019, 11, 3107. https://0-doi-org.brum.beds.ac.uk/10.3390/su11113107
AMA Style
Montalvo J, Ruiz-Labrador E, Montoya-Bernabéu P, Acosta-Gallo B. Rural–Urban Gradients and Human Population Dynamics. Sustainability. 2019; 11(11):3107. https://0-doi-org.brum.beds.ac.uk/10.3390/su11113107
Chicago/Turabian StyleMontalvo, Javier, Enrique Ruiz-Labrador, Pablo Montoya-Bernabéu, and Belén Acosta-Gallo. 2019. "Rural–Urban Gradients and Human Population Dynamics" Sustainability 11, no. 11: 3107. https://0-doi-org.brum.beds.ac.uk/10.3390/su11113107
Note that from the first issue of 2016, this journal uses article numbers instead of page numbers. See further details here.