Determinants of Continuous Intention on Food Delivery Apps: Extending UTAUT2 with Information Quality


1
Department of Hotel, Tourism, and Foodservice Management, Dongguk University-Gyeonju, 123, Dongdae-ro, Gyeongju-si, Gyeongsangbuk-do 38066, Korea
2
Department of Foodservice Management, Pai Chai University, 155-40, Baejae-ro, Seo-gu, Daejeon-si 35345, Korea
*
Author to whom correspondence should be addressed.
Sustainability 2019, 11(11), 3141; https://0-doi-org.brum.beds.ac.uk/10.3390/su11113141
Submission received: 3 May 2019
/
Revised: 1 June 2019
/
Accepted: 2 June 2019
/
Published: 4 June 2019
Abstract
:This study empirically analyzes an extended Unified Theory of Acceptance and Use of Technology 2 (UTAUT2) model that augments information quality to identify the determinants of continuous use intention for food delivery software applications. A sample survey of 340 respondents who had ordered or purchased food through delivery apps was used for the analysis. The results indicate that habit had the strongest influence on continuous use intention, followed by performance expectancy and social influence. Furthermore, information quality had an indirect effect on continuous use intention via performance expectancy. Consequently, this study confirms the importance of information quality, performance expectancy, habit, and social influence as factors in inducing users’ continuous use intention for food delivery apps. These findings expand previous research in online-to-offline business in the field of food services and suggest practical implications. Ultimately, the model proposed and validated in this study may be employed as a basis for future research on consumer behavior in the field of food e-commerce services.
1. Introduction
The rapid growth of e-commerce has spawned new forms of business, such as online to offline (O2O), and has changed the traditional performance of tasks and jobs [1,2]. O2O is a marketing method based on information and communications technology (ICT) in which customers are attracted online and then induced to complete a transaction in an offline setting [3]. In other words, it is a system in which customers place orders for goods or services online and then receive the goods or services at an offline outlet. Accessibility and the ability to share information quickly have led to the rapid growth of mobile commerce connecting suppliers and users via smartphone apps [4,5].
O2O services have emerged in various fields, including food services, hotels, real estate, and car rentals [6]. The real-time connectivity of food delivery apps on mobile devices provides busy users with speed and convenience [7]. The change in how consumers order food has spread globally. Restaurants in Los Angeles, Calif., have added 200–250 orders per week and have seen revenues grow by 3–35% after partnering with food delivery apps [2]. The apps are expected to become a significant part of the U.S. restaurant business alongside the fast-food business [2]. In China, more than one fifth of the population has used a food delivery app [8]. Food services via mobile apps have become a convenient way for take-out restaurants in China to boost sales revenue [2]. Similarly, the number of users in Korea’s delivery app market has risen dramatically, from 870,000 in 2013 to 25 million in 2018. The volume of transactions as of 2018 is estimated to be about 3 trillion KRW, accounting for 20% of the food delivery market (15 trillion KRW) [9]. Furthermore, according to the findings of the Factual Survey on Small Business’s Use of Online Delivery Services, 95.5% of 1000 restaurant owners nationwide using delivery apps reported that net profits either rose (46.2%) or stayed the same (49.3%) after adopting delivery apps. On the other hand, only 4.5% reported a decrease in net profits [10].
The growing popularity of food delivery apps has intensified competition within the food delivery market in Korea [7]. The food service industry in Korea has more proactively adopted O2O transactions compared to other industries because the apps offer a low-cost way for businesses to attract customers, promote their products, and facilitate contact with those customers, features that are especially attractive to small-scale restaurants [11]. Delivery apps offer food service customers the ability to search through diverse products and compare costs. Small-scale restaurants that have lower advertising and marketing abilities can use delivery apps as a convenient and highly efficient sales and marketing tool. Therefore, there is a need for further research on food service consumers’ continuous use intentions for delivery service apps.
This study aims to identify the determinants of the continuous use intention. In particular, this study employs the extended UTAUT2 (Unified Theory of Acceptance and Use of Technology 2) model for empirical analysis. This model is considered to have better explanatory power than the TAM (Technology Acceptance Model) and UTAUT models that have been used to explain users’ behavioral intentions toward various information technologies [12]. Although the rapid growth of delivery apps has drawn much discussion, there have been relatively few academic studies [2,7,13] on the subject. In particular, no previous studies on the subject have applied the UTAUT2 model. Therefore, this study focuses on the following research questions: What are the factors that might strengthen the continuous use intention of consumers who have previously used delivery app services? Which factors have the strongest influence on users’ continuous intention?
DeLone and McLean [14] have stated that, in addition to system quality, information quality plays a vital role in the success of an information system. Information quality, representing the most basic communication capacity between online buyer and seller, is regarded as the foundational determining factor for building trust [15]. Information quality implies that information itself has inherent qualities such as accuracy, reliability, and completeness. In particular, the importance of information quality has been shown through its relevancy, usefulness, and currency [16]. Information quality is frequently used to assess the performance of information systems [17] and has been found to significantly influence usefulness, ease of use, attitude, trust, satisfaction, and use intention in online environments [16,18,19,20,21,22].
Therefore, to expand previous research on food service consumer behavior and include the acceptance of information technology systems and user studies, this study employs an extended UTAUT2 model that augments the UTAUT2 model with information quality. This study adds to previous research by identifying the variables that influence consumers’ continuous intentions to use delivery app services along multiple perspectives. The study focuses on delivery app services as a marketing channel for restaurants and analyzes consumer behavior in food e-commerce. The findings offer useful research material that could contribute to marketing strategies for service providers and restaurant businesses.
2. Literature Review and Hypotheses
2.1. Information Quality
Information quality refers to the value, validity, and usability of information that is the output of an information system as well as the quality of that output [23]. Furthermore, information quality refers to the extent to which a system provides the user with useful and significant information in a speedy and accurate manner [22]. Ranganathan and Ganapathy [24] considered information quality to be the key determinant of a website’s quality. Better information quality may elicit enjoyment and positive behavioral intention [25]. Consumers form a positive perception of information quality when the information meets their expectations during the decision-making process and is provided in an adequate manner [26].
Information quality represents the most basic communication capacity between an online buyer and seller and is regarded as the foundational factor in building trust [15]. A review of the literature on technology acceptance shows that trust in information is a key predictive factor for behavioral intention [12,27,28,29]. User decisions made while using systems is determined by security and trust [30,31].
Depending on use and purpose, information quality may be assessed through understandability, reliability, timeliness, and usefulness. Seddon [32] proposed relevance, timeliness, and accuracy as evaluation items for information quality while Delone and McLean [14] argued that individualization, completeness, relevance, ease of understanding, and security determine success in e-commerce. Nelson, Todd, and Wixom [33] expanded on the factors presented by Delone and McLean [14] with sub-factors such as accuracy, completeness, currency, and format. Hsieh, Kuo, Yang, and Lin [34] stated that the key information quality factors of blogs were understandability, reliability, scope, and usefulness. As is evident from these studies, various categories of information quality have been presented but a standardized set of attributes has yet to be established [21]. Several studies have also conducted single-dimension examinations using these factors [22,35,36,37].
Numerous studies have established the relationship between information quality and performance expectancy (perceived usefulness), effort expectancy (perceived ease of use), and behavioral intention. Rai, Lang, and Welker [38] and Kulkarni, Ravindran, and Freeze [39] found that information quality had significant influence on perceived usefulness. Based on the TAM model, Shih [17] found that perceived information quality in Internet shopping had a positive effect on perceived ease of use and usefulness. Lin, Fofanah, and Liang [35] found that information quality had a strong influence on the perceived usefulness and ease of use of e-government systems. Using UTAUT, Alshehri, Drew, Alhussain, and Alghamdi [36] found that the website quality of e-government systems had a stronger influence on the intention to use than performance expectancy, effort expectancy, social influence, and facilitating conditions. Escobar-Rodriguez and Carvajal-Trujillo [40] found that the quality of information positively influenced intention to use by reinforcing consumers’ trust in e-commerce. Kang and Namkung [21] stated that, when purchasing food products, the quality of information provided by O2O commerce positively influenced perceived usefulness and ease of use. Zhao [22] found that the information quality provided by social network-based communities played a significant role in the intention to participate in communities.
Based on the relevant literature, this study specified the information quality of delivery app services as the determinant of performance expectancy, effort expectancy, and behavioral intention to analyze how these variables are related.
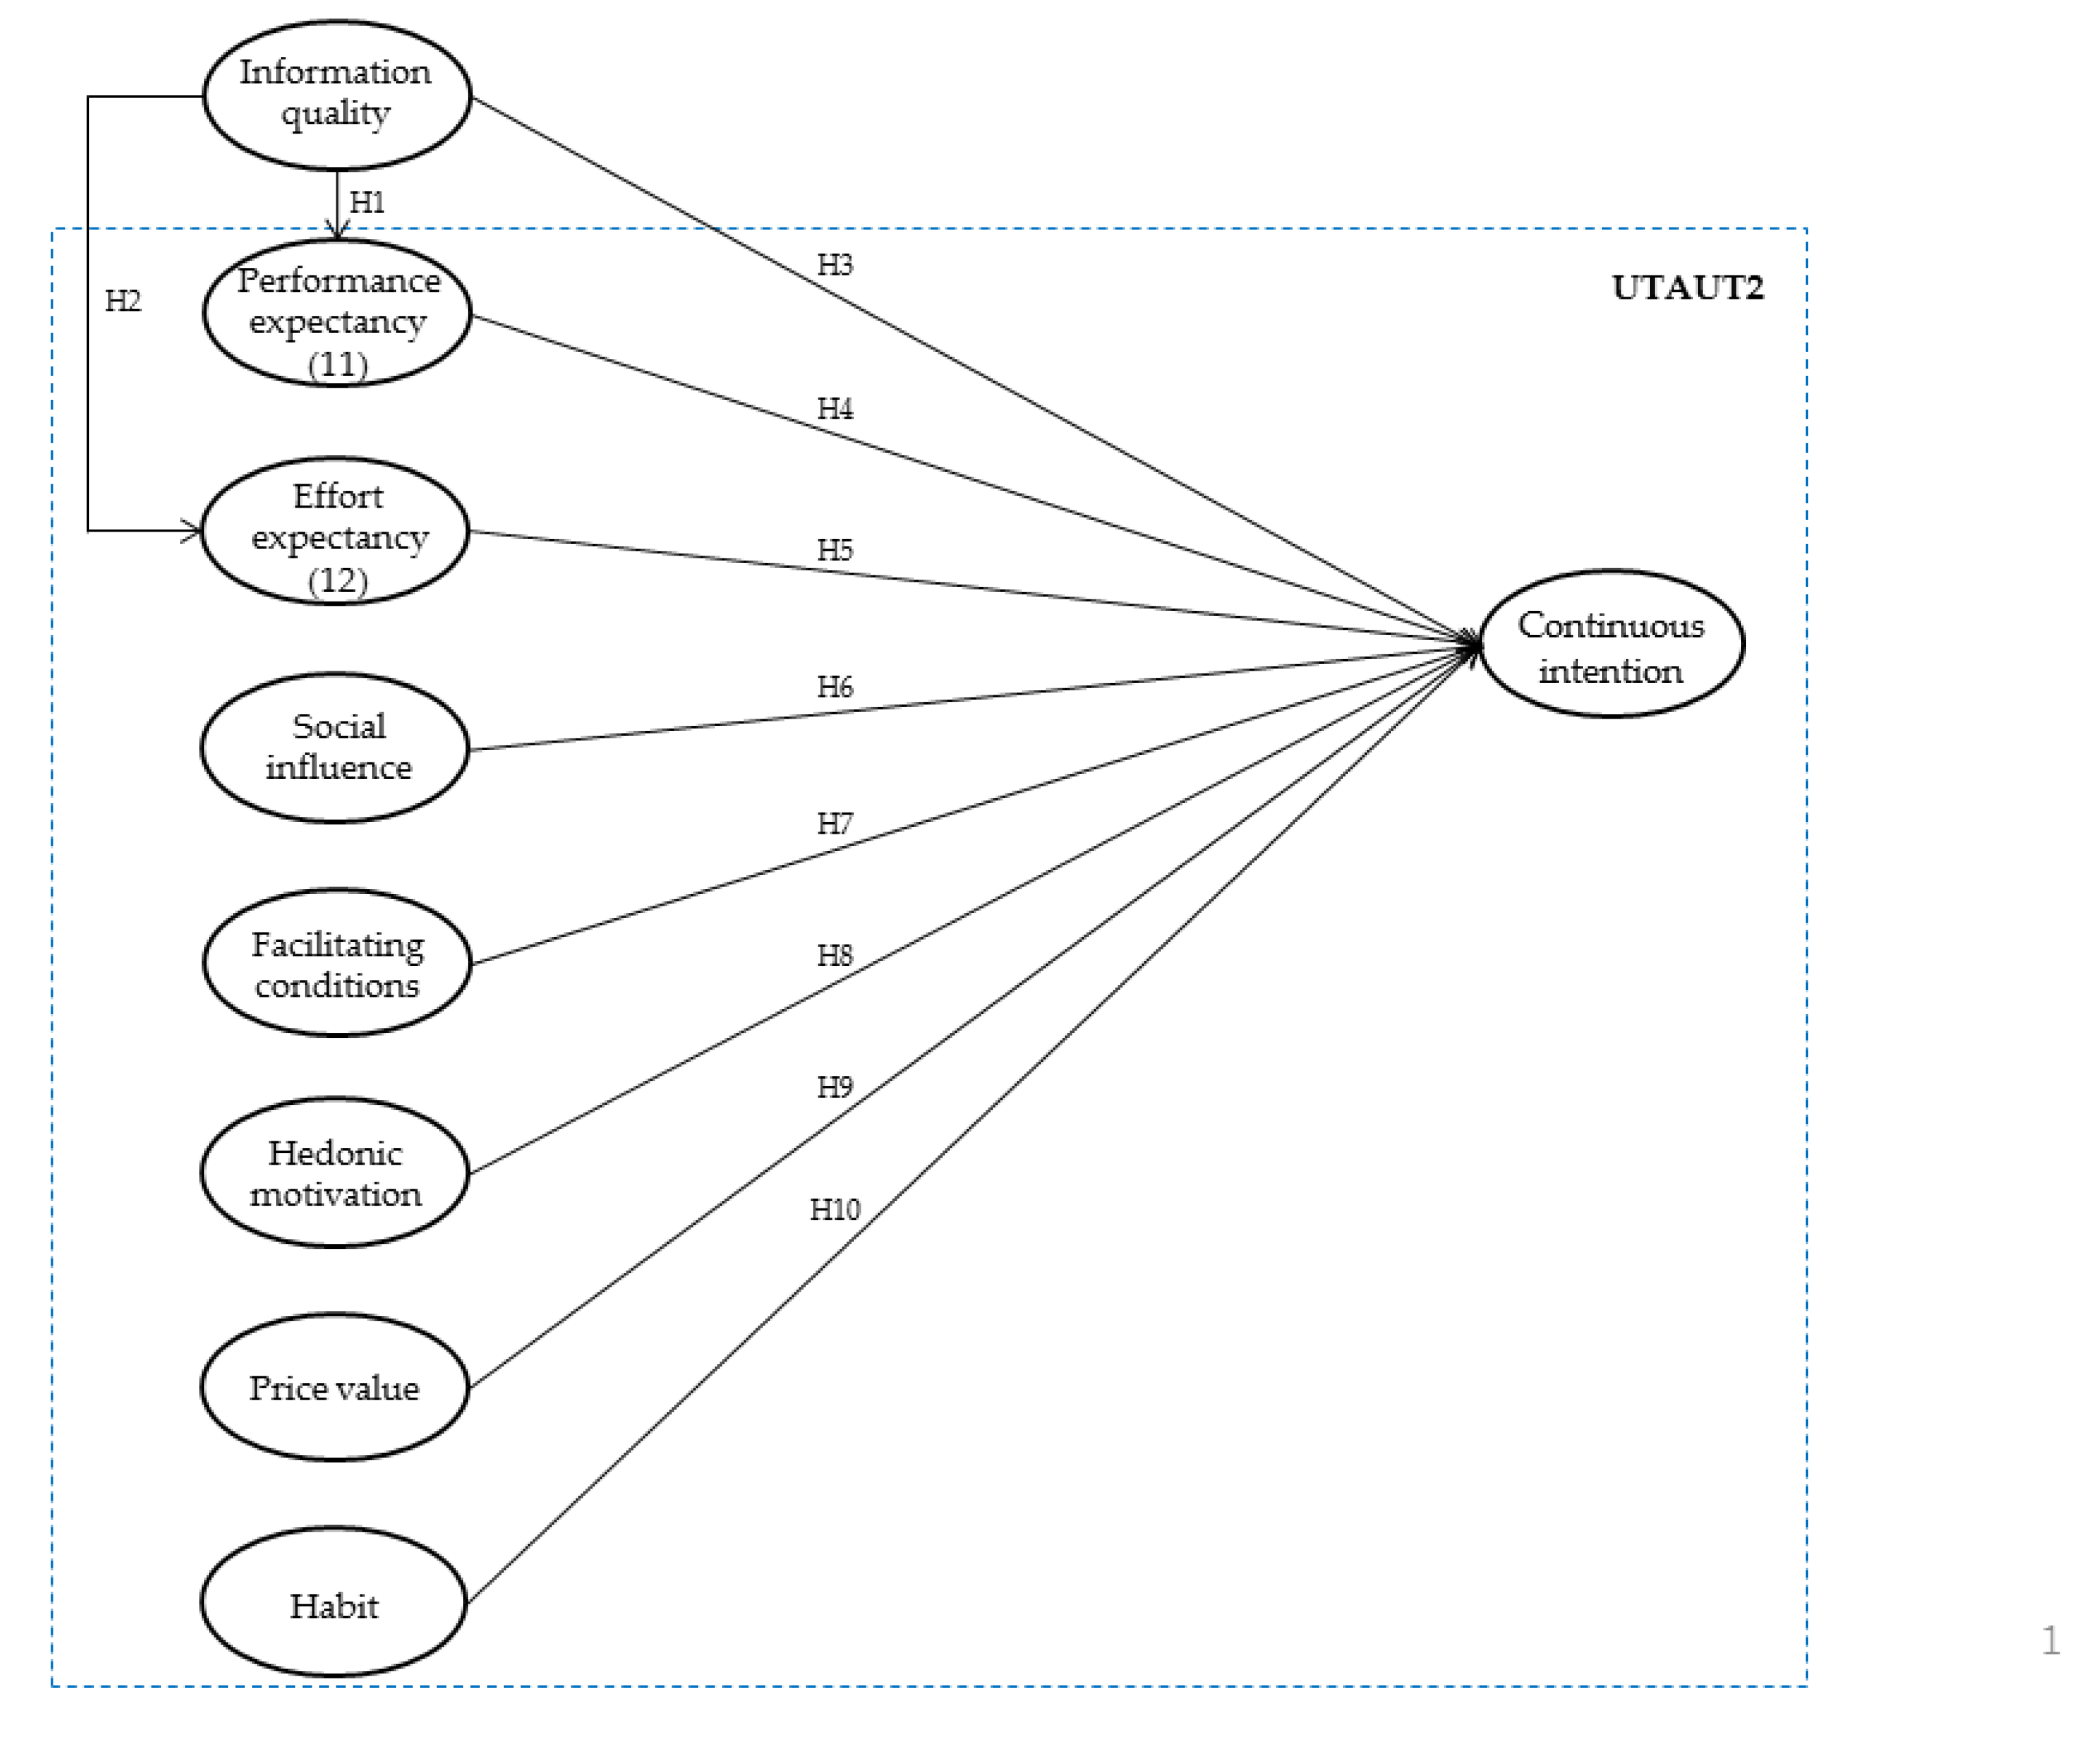
H1:
The information quality of delivery apps will significantly influence performance expectancy.
H2:
The information quality of delivery apps will significantly influence effort expectancy.
H3:
The information quality of delivery apps will significantly influence continuous intention.
2.2. Unified Theory of Acceptance and Use of Technology 2 (UTAUT2)
The TAM model, based on the theory of reasoned action (TRA) in the field of social psychology, has been employed in numerous studies to explain the acceptance of technology [41]. In particular, it has been applied to analyze information systems in mobile commerce [42], e-commerce [43], and social networks [44]. However, the model’s analysis of relationships between variables in IT environments is limited because it is unable to adequately account for the influences between various exogenous variables and the TAM variables [45]. Furthermore, it has been criticized for its inability to provide a general explanation of work-technology environments [46].
In order to address such shortcomings, Venkatesh, Morris, Davis, and Davis [47] proposed a comprehensive model with improved explanatory ability on the intention to use and the behavior of information system users–UTAUT, which unified various previous theories and models on technology acceptance, including TAM. UTAUT states that performance expectancy, effort expectancy, social influence, and facilitation conditions are the direct determinants of behavioral intention and use. Also, factors such as gender, age, experience, and voluntariness were noted as mediating factors [47]. Performance expectancy is a concept in line with perceived usefulness in the TAM model and refers to the extent of individual beliefs that the use of a system would prove helpful in improving task or job performance. The stronger the perception that a new technology will improve one’s work or life, the greater the intention to use that technology [12,47,48,49]. Performance expectancy is a key predictive factor for the behavioral intention of users. It has been repeatedly validated in studies on the factors determining the acceptance and use of new products and technologies [50]. Effort expectancy refers to the ease of use of a system and is in line with perceived ease of use in the TAM model. A stronger perception of ease of use will lead to a greater intention to use the technology [12,47,48]. Social influence reflects the fact that the use of a system or technology is influenced by the views of peers. It is analogous to that of subjective norms in TRA [12]. Thus, the more strongly peers perceive the use of a new technology, system, or service to be important, the more likely one is to follow along [51]. Social influence has been validated as positively influencing users’ behavioral intentions for new technologies, products, and services [12,47]. Facilitating conditions are defined as the extent of individual beliefs in the existence of organized technical support for the use of a system [50]. This includes a user’s belief that there will be access to guidance, training, and support while attempting to acquire a technology [52]. Users who deem facilitating conditions to be adequate are less averse to using a new service, thus strengthening their use intentions [12]. UTAUT posits that when these four exogenous variables influence users’ behavioral intentions or use intentions, factors such as gender, age, experience, and voluntariness could have mediating effects [53].
Several recent studies have applied UTAUT in the hospitality industry [13,50,54,55,56,57,58]. However, while the UTAUT model takes performance expectancy as corresponding to usefulness and effort expectancy as corresponding to ease of use, these variables are merely connected to services and views on the functional characteristics of technologies within organizational situations. As such, the model does not account for the cognitive or psychological states affecting intentions to accept technology [59]. To overcome this shortcoming, Venkatesh, Thong, and Xu [12] introduced the extended UTAUT model (UTAUT2) that augmented the UTAUT model with psychological and cognitive factors such as hedonic motivation, price value, and habit. Hedonic motivation is defined as the enjoyment derived from the use of technology and plays an important role in technology acceptance and use [60], directly influencing technology acceptance and use [12,61,62]. In terms of using an app, price value is defined as the perceived benefits of using an app versus the monetary costs incurred using the app [63]. Price value exerts positive influence on intention to use when the benefits of technology use are perceived to outweigh the monetary costs [12]. Habit is defined as tendencies that are performed automatically through learning [64]. Habit is sometimes affected by current environmental conditions or past experiences and may not be conscious [65]. Venkatesh et al. [12] stated that prior experience use is a prerequisite for habit to influence technology use and that habit was a key factor in future acceptance of technology.
Previous studies have empirically analyzed how the seven variables of the UTAUT2 model–performance expectancy, effort expectancy, social influence, facilitating conditions, hedonic motivation, price value, and habit–were related to intention to use [66,67]. This study posits the seven variables as factors influencing the continuous use intention for delivery app services. As such, we propose the following hypotheses.
H4:
The performance expectancy of delivery apps will significantly influence continuous intention.
H5:
The effort expectancy of delivery apps will significantly influence continuous intention.
H6:
The social influence regarding delivery apps will significantly influence continuous intention.
H7:
The facilitating conditions regarding delivery apps will significantly influence continuous intention.
H8:
The hedonic motivation regarding delivery apps will significantly influence continuous intention.
H9:
The price value of delivery apps will significantly influence continuous intention.
H10:
Habit regarding delivery apps will significantly influence continuous intention.
2.3. Mediating Role of Information Quality
In their study on Internet shopping, Ahn, Ryu, and Han [18] found that information quality had a significant effect on use intention, mediated through usefulness and ease of use. Liao, Palvia, and Lin [19] validated the mediating role of the quality of in-site content on the relationship between consumer trust, information usefulness, and continuous use of e-commerce. Shih [17] stated that perceived information quality affected users’ intentions to accept e-shopping through ease of use and usefulness. A study on an information system supporting emergency operations centers found that performance expectancy played a partial mediating role between information quality and acceptance [68]. In view of these findings, this study proposes performance expectancy and effort expectancy as the mediating variables between the information quality of delivery app services and behavioral intentions.
H11:
The performance expectancy of delivery apps will play a mediating role between information quality and continuous intention.
H12:
The effort expectancy of delivery apps will play a mediating role between information quality and continuous intention.
All the hypotheses in the theoretical model are depicted in Figure 1.
3. Methodology
3.1. Sampling and Data Collection
Residents of Korea who were at least 20 years old and had used a delivery app at least once a month were selected for the study sample. The delivery apps selected were Baedal-eu-Minjok, Yogiyo, and Baedal-tong, which account for more than 90% of the market. Therefore, the selected sample is representative of the whole population of delivery users.
Data collection took place over a 10-day period from February 1, 2019, to February 10, 2019, via an on-line survey administered by Nownservey, a survey agency with a panel of more than 100,000 respondents in Korea. Invitation links for the survey were sent to a total of 3000 prospective respondents. Study subjects were asked whether they had ever logged in to three delivery app, searched for a food item, and placed an order at least once per month. Of the 1000 prospective respondents who followed the link, only those who responded positively were selected for the survey. The statements were presented to all respondents in the same order, resulting in a final sample size of 340 for empirical analysis. Table 1 shows a profile of the sample.
3.2. Research Instrument
A total of nine factors were considered based on the findings of previous studies. Of the UTAUT2 factors, we followed Venkatesh et al. [12], San Martín and Herrero [50], Escobar-Rodriguez and Carvajal-Trujillo [69], and Singh and Matsui [66] in including four performance expectancy items, four effort expectancy items, three social influence items, four facilitating conditions items, three hedonic motivation items, three price value items, four habit items, and four behavioral intention items. We also included four items on information quality following Barnes and Vidgen [70] and Zhao [22]. Although all survey items were developed in English, they were translated into Korean and modified in consideration of the study’s goals and the characteristics of the respondents. All items were measured on a five-point Likert scale ranging from “strongly disagree” to “strongly agree.”
3.3. Analytical Methods
SPSS 22.0 was used to present the demographic profile of the respondents on sample data. We used a three-step approach to conducting data analysis. First, the reliability and construct validity were assessed by conducting confirmation factor analysis (CFA) in the first step. The research model and the proposed hypotheses were evaluated by the structural equation model (SEM) in the second step. Finally, we conducted multi-mediating effect analysis in order to examine the effects of the mediating variables. The analysis tool used in this study was AMOS 22.0.
4. Data Analysis and Results
4.1. Measurement Model
The measurement model fit was assessed by a CFA. Seven common model-fit measures were used to estimate the fit of the measurement model; χ²/df (<3), GFI(>0.90), RMSEA(<0.08), RMR(<0.08), NFI(>0.9), NNFI(>0.9), and CFI(>0.9) [71]. Table 2 reports the CFA results after discarding 2 facilitating conditions items and 1 price value item that were lowering model fit.
The measurement model had a good fit with the data collected. (χ² = 667.527, df = 361, CMIN/df = 1.849, RMR = 0.035, GFI = 0.887, AGFI = 0.854, NFI = 0.916, IFI = 0.959, CFI = 0.959, RMSEA = 0.050). The adequacy of the measurement model was evaluated based on the criteria of reliability, convergent validity, and discriminant validity. First, reliability was examined based on the composite reliability (CR) values. Table 2 shows that all of the values are above 0.7, indicating adequate composite reliability [71]. The average variance extracted (AVE) values for all variables were higher than the suggested threshold value of 0.5, suggesting the convergent validity of the scale [71].
To examine the discriminant validity of factors whose convergent validity have been established, we compared the average variance extracted (AVE) of each latent factor against the squared correlation coefficients between potential factors, verifying whether all of the AVE values exceed the squared correlation coefficients [72]. Analysis results are reported in Table 3 and show that the squared correlation coefficients among all potential factors was 0.055–0.474 and are smaller than the AVE values range 0.545–0.791, indicating that all potential factors had discriminant validity.
4.2. Structural Model
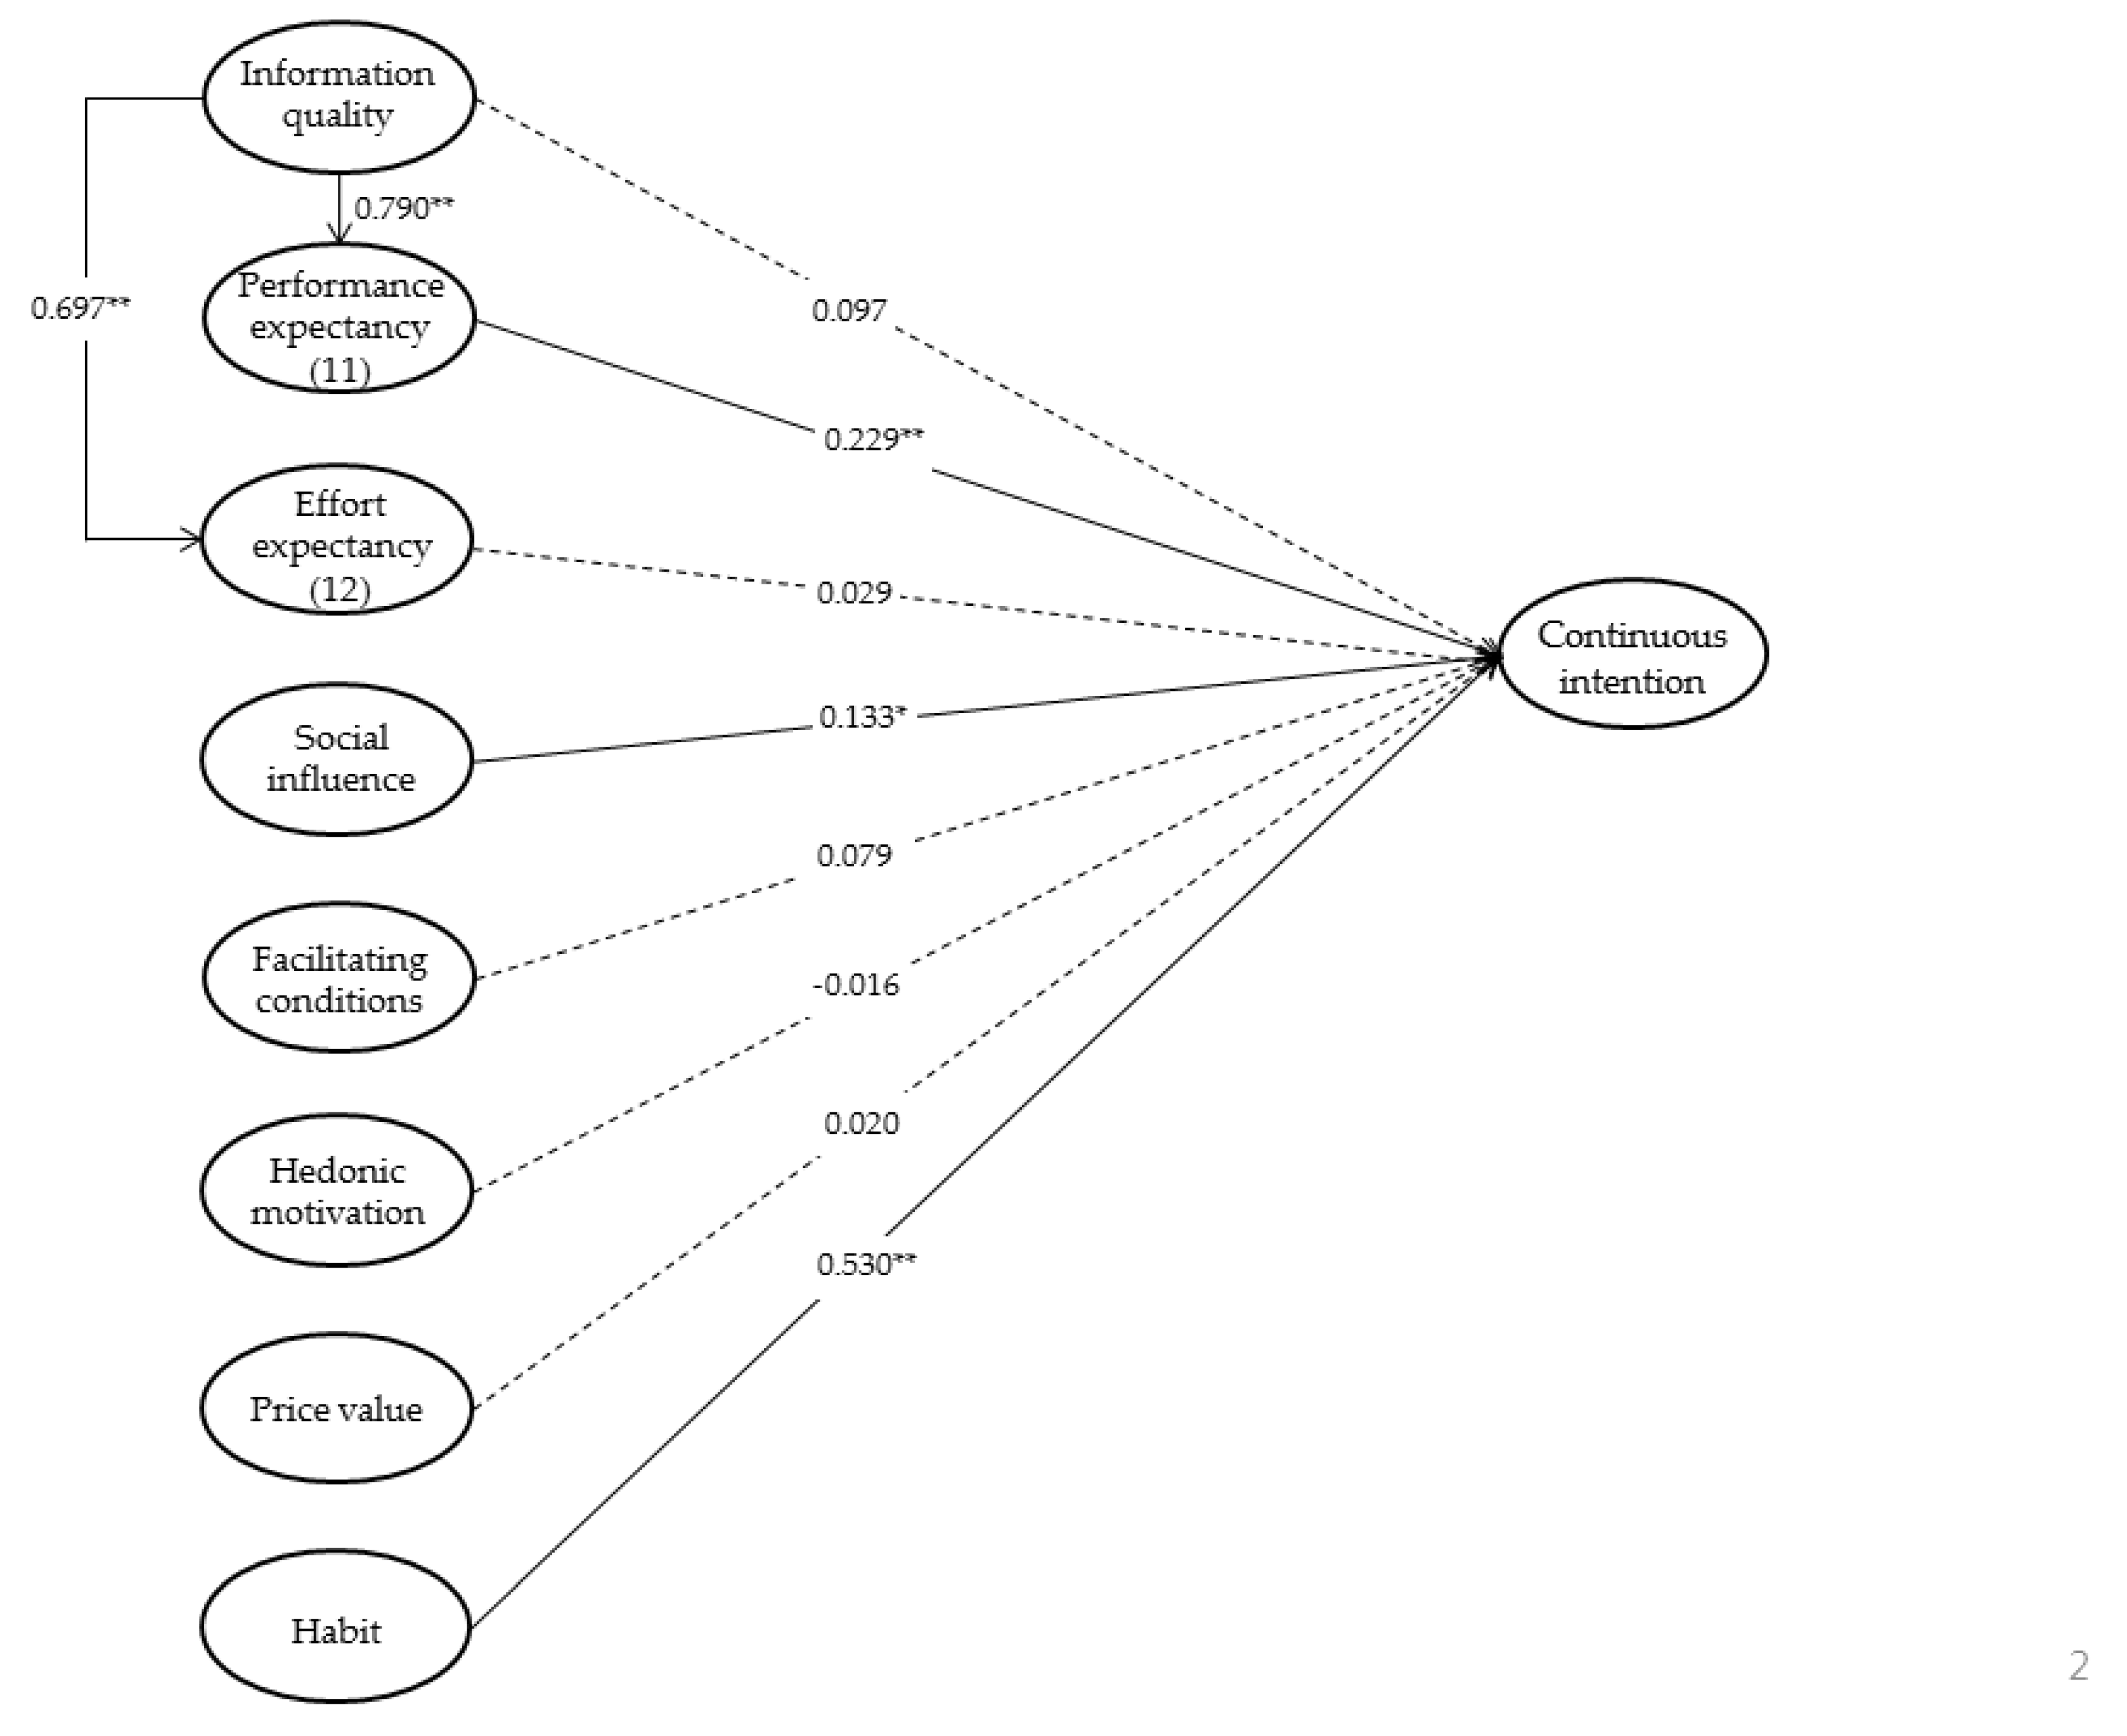
SEM was conducted using the AMOS 22.0 statistical package for hypothesis testing. In order to test the hypotheses using the path coefficients returned by SEM, it is necessary to first evaluate the model’s goodness-of-fit for the variables. The goodness-of-fit measures (χ² = 834.684, df = 367, p = 0.000, CMIN/df = 2.274, RMR = 0.054, GFI = 0.858, NFI = 0.895, IFI = 0.938, CFI = 0.937, RMSEA = 0.061) were found to largely satisfy the evaluation criteria. Table 4 and Figure 2 shows the results of the tests of the hypotheses on the relationship between each of the factors. Information quality (β = 0.790, t = 10.067, p = 0.000) was found to have a significantly positive effect on performance expectancy, thus supporting H1. Information quality (β = 0.697, t = 10.268, p = 0.000) was found to have a significantly positive effect on effort expectancy, thus supporting H2. Information quality (β = 0.097, t = 0.768, p = 0.443) was not found to have a significant effect on continuous use intention, thus rejecting H3. Performance expectancy (β = 0.229, t = 2.994, p = 0.003) was found to positively affect continuous use intention, thus supporting H4. Effort expectancy (β = 0.029, t = 0.565, p = 0.572) was not found to significantly affect continuous use intention, thus rejecting H5. Social influence (β = 0.133, t = 2.418, p = 0.016) was found to positively affect continuous use intention, thus supporting H6. Facilitating conditions (β = 0.079, t = 0.842, p = 0.400) were not found to significantly influence continuous use intention, thus rejecting H7.
Both hedonic motivation (β = −0.016, t = −0.314, p = 0.754) and price value (β = 0.020, t = 0.476, p = 0.634) were not found to affect continuous use intention, thus rejecting H8 and H9. Habit (β = 0.530, t = 9.788, p = 0.000) was found to have a positive effect on continuous use intention, thus supporting H10.
4.3. Multi Mediating Effect
Table 5 shows the results of the individual mediating effects of performance expectancy and effort expectancy, the mediation variables between information quality and continuous use intention. Using the bootstrap feature of the AMOS 22.0 software, we calculated the non-standardized total effects, direct effects, and indirect effects. Of the total effect of 0.442 between information quality and continuous use intention, the indirect effect via performance expectancy was found to be statistically significant (β = 0.267, p = 0.011), indicating that performance expectancy played a full mediation role. Thus, H11 was supported. On the other hand, the indirect effect via effort expectancy was not found to be statistically significant (β = 0.030, p = 0.613), thus rejecting H12.
5. Discussion and Conclusions
5.1. Discussion
The purpose of this study was to employ an extended UTAUT2 model that augments the UTAUT2 model with information quality to validate the key determinants affecting continuous use intention for food delivery apps. This model encompasses various explanatory variables as the determinants for use of delivery app services, including information quality, performance expectancy, effort expectancy, social influence, facilitating conditions, hedonic motivation, price value, and habit.
Data analysis results demonstrated that performance expectancy, social influence, and habit were determinants that positively influenced the continuous use intention of consumers. Additionally, information quality was found to positively influence continuous use intention with performance expectancy as the mediating variable. Therefore, the intention to use an app to order food depends on the user’s perceived information quality and performance expectancy of the app and on social influence and habit. These findings partially agree with earlier studies [7,13,68] and demonstrate that providing accurate and reliable information in a detailed manner via an adequate app design will lead consumers to perceive delivery apps as useful. This suggests that consumers will form continuous use intention when they perceive the usefulness of delivery app services, such as saving time, the speed of conducting a transaction, and the diversity of purchase opportunities. We also find that users were influenced by peers. The average value of the habit factor was 2.508, indicating that the positive relationship returned in the analysis results in fact implies a negative relationship. Thus, respondents’ use of delivery apps is not by force of habit. This result contrasts with those of Singh [66] and Shaw and Sergueeva [67] and indicates that consumers use delivery apps when they perceive them to be more useful than ordering food via phone or smartphone. Ultimately, this study demonstrates that the determinant factor with the strongest positive influence on the continuous use intention of delivery apps is performance expectancy and that information quality plays a crucial role in enhancing the effects of performance expectancy.
On the other hand, we found that ease of use, facilitating conditions, hedonic motivation, and price value were not key factors determining the continuous use intention of delivery apps. This is attributable to the advancement of smartphones and ICT technology that have stabilized app implementation to the extent that consumers face few difficulties in using them. The result on hedonic motivation may be attributable to the short process from search to order, giving consumers little time for enjoyment. Finally, consumers do not perceive a price-value benefit because there are no differences in material benefits between placing an order via phone/smartphone or delivery app. Furthermore, information quality was found to have no direct effect on the continuous use intention, implying that the accuracy and reliability of information has no effect unless their usefulness is perceived by the user. The empirical evidence demonstrates that the extended UTAUT2 model augmented with information quality can explain consumers’ intentions to continually order and purchase food using delivery apps.
5.2. Conclusions
From a theoretical perspective, this study employed the UTAUT2 model to examine e-commerce consumer behavior in the continuous use of mobile delivery app services. The UTAUT2 model is considered to have better explanatory power than the TAM model that had long been used to measure of technology acceptance as well as the UTAUT model that had complemented TAM. In particular, this study is significant in that it employed the UTAUT2 model that seldom has been applied in the field of food services to measure consumer behavior. Furthermore, by specifying information quality as an antecedent variable in the UTAUT2 model and analyzing how it is related with performance expectancy, effort expectancy, and continuous use intention, this study confirmed that it is a key variable in the acceptance of new information systems by food service consumers. This study makes substantial academic contributions as it integrates the research trends in the areas of food services and ICT. Thus, the theoretical framework presented in this model may be employed as a basis for future studies on the e-commerce behavior of food service consumers.
From a practical perspective, it is necessary to understand the importance of factors such as information quality, performance expectancy, habit, and social influence to induce consumers’ continued use of delivery app services. Managing the information provided will be necessary to enhance the performance expectancy of users. Delivery app operators will need to provide, in detail, the reliable information demanded by users. In order to do this, delivery app vendors need to ensure that the information they provide is of the highest quality in terms of accuracy and timeliness. To achieve this objective, vendors must update their menus and price fluctuation information regularly to eliminate user inconvenience. They should also make users aware of the fact that they are reliable by presenting restaurant information in detail. Especially, vendors should minimize user inconvenience and app complaints by checking their information frequently and confirming the accuracy of information such as business hours, holiday hours, delivery areas, restaurant events, and any excellence certification information.
Charging commission for the use of delivery apps is also strongly discouraged as the extra fee can lead to user dissatisfaction. In other words, there are instances where food ordered via delivery app has smaller portions compared to food ordered conventionally, in addition to the charging of delivery fees to consumers, which have led to user dissatisfaction. Therefore, delivery app providers and restaurants must establish a reasonable and mutually beneficial commission system that can minimizes the costs to food service consumers. In terms of app design, care must be taken to make the information legible to users. As a means of gaining consumers’ trust, we propose using big data, a technology that has gained traction, to provide objective information such as the number of orders across food categories and the rankings of popular menus.
In order to enhance performance expectancy as perceived by consumers, information on a wide range of restaurants across food categories should be provided to allow users to choose from a diverse range of foods. Furthermore, comparisons of products across restaurants and food categories should be made convenient to expedite consumer decision-making. The composition and design of delivery apps is crucial in this regard. There is also a need to simplify transaction processes in order to save time.
Since prior use experience is a prerequisite for habit in influencing technology use, managing consumers who have used delivery apps is an important task. As in the case of offline restaurants, managing prior customers is more important than attracting new ones. Therefore, it is crucial for a delivery app service to provide various benefits to users to prevent them from switching to another delivery app service.
Users were found to be substantially influenced by their peers when deciding which app to use, indicating that delivery app providers must be proactive in pursuing word-of-mouth marketing. In particular, in view of the fact that users in their 20s and 30s represent a sizable share of delivery app users and are avid users of social networks, there is a need to actively use social networks in order to target these age groups as a core user base.
5.3. Limitations and Future Research
In spite of the findings and implications of this study, is limited in certain aspects. First, data were collected only in Korea, so the generalizability of the findings may be limited. In other words, applying the findings of this study to other areas may not be appropriate. Second, in the sample, the proportion of respondents in their 20s and 30s was 75.6% since it used an online survey method, which tends to be favored by younger people and older people tend to be less familiar with online research. In addition, although online surveys are often used in consumer research, they may still lead to selection biases [73]. Therefore, future research needs to use different types of data collection methods in order to reduce these biases. However, considering the fact that people in their 20s and 30s represent the majority of delivery app users in Korea, narrowing the findings of this study to this age group may prove to be significant. Third, the growing number of single-person households in Korea has led to a rising number of “homeconomy” (home + economy) households in which the single household member engages in various economic activities without leaving the house. As of 2017, single-person households accounted for as much as 28.6% of all households in Korea [9]. Thus, future research could analyze the differences between single-person and multi-person households to formulate more comprehensive marketing strategies.
Author Contributions
H.M.J. and S.W.L. conceived and designed the experiments; H.M.J. performed the experiments and analyzed the data; H.M.J., S.W.L. and H.J.S. wrote the paper. All of authors contributed to read and approved the final manuscript.
Funding
No external funding was received for this work.
Conflicts of Interest
The authors declare no conflict of interest.
References
- Liu, W.; Batra, R.; Wang, H. Product touch and consumers’ online and offline buying: The role of mental representation. J. Retail. 2017, 93, 369–381. [Google Scholar] [CrossRef]
- Cho, M.H.; Bonn, M.A.; Li, J. Differences in perceptions about food delivery apps between single-person and multi-person households. Int. J. Hosp. Manag. 2019, 77, 108–116. [Google Scholar] [CrossRef]
- Ji, S.W.; Sun, X.Y.; Liu, D. Research on core competitiveness of Chinese retail industry based on O2O. Adv. Mater. Res. 2014, 834–836, 2017–2020. [Google Scholar] [CrossRef]
- Lyu, S.O.; Hwang, J. Are the days of tourist information centers gone? Effects of the ubiquitous information environment. Tour. Manag. 2015, 48, 54–63. [Google Scholar] [CrossRef]
- Kim, S.H.; Bae, J.H.; Jeon, H.M. Continuous intention on accommodation apps: Integrated value-based adoption and expectation—Confirmation model analysis. Sustainability 2019, 11, 1578. [Google Scholar] [CrossRef]
- Du, Y.; Tang, Y. Study on the development of O2O e-commerce platform of China from the perspective of offline service quality. Int. J. Bus. Soc. Sci. 2014, 5, 308–312. [Google Scholar]
- Lee, E.Y.; Lee, S.B.; Jeon, Y.J.J. Factors influencing the behavioral intention to use food delivery apps. Soc. Behav. Pers. 2017, 45, 1461–1474. [Google Scholar] [CrossRef]
- Maimaiti, M.; Zhao, X.; Jia, M.; Ru, Y.; Zhu, S. How we eat determines what we become: Opportunities and challenges brought by food delivery industry in a changing world in China. Eur. J. Clin. Nutr. 2018, 72, 1282–1286. [Google Scholar] [CrossRef] [PubMed]
- Joins. The ‘Stay-at-home Folk’ Behind the Growth of the Delivery App Market to 70 billion KRW, 5 March 2019. Available online: https://news.joins.com/article/23401558 (accessed on 19 April 2019).
- MK. Restaurant Owners Give ‘Thumbs Up’ to Delivery Apps, with 95% Seeing Boosts in Sales 31 December 2018. Available online: https://www.mk.co.kr/news/economy/view/2018/12/813675/ (accessed on 19 April 2019).
- Jeon, H.M.; Choi, H.M. Consumer’s acceptance on mobile delivery app service: Focused on UTATU2. Food Serv. Ind. J. 2017, 13, 67–82. [Google Scholar]
- Venkatesh, V.L.; Thong, J.Y.; Xu, X. Consumer acceptance and use of information technology: Extending the unified theory of acceptance and use of technology. MIS Q. 2012, 36, 157–178. [Google Scholar] [CrossRef]
- Okumus, B.; Ali, F.; Bilgihan, A.; Ozturk, A.B. Psychological factors influencing customers’ acceptance of smartphone diet apps when ordering food at restaurants. Int. J. Hosp. Manag. 2018, 72, 67–77. [Google Scholar] [CrossRef]
- Delone, W.H.; McLean, E.R. The DeLone and McLean model of information systems success: A ten-year update. J. Manag. Inf. Syst. 2003, 19, 9–30. [Google Scholar]
- Kim, S.; Park, H. Effects of various characteristics of social commerce (s-commerce) on consumers’ trust and trust performance. Int. J. Inf. Manag. 2013, 33, 318–332. [Google Scholar] [CrossRef]
- Demoulin, N.T.M.; Coussement, K. Acceptance of text-mining systems: The signaling role of information quality. Inf. Manag. 2018. [Google Scholar] [CrossRef]
- Shih, H.P. An empirical study on predicting user acceptance of e-shopping on the web. Inf. Manag. 2004, 41, 351–368. [Google Scholar] [CrossRef]
- Ahn, T.; Ryu, S.; Han, I. The impact of the online and office features on the user acceptance of internet shopping malls. Electron. Commer. Res. Appl. 2004, 3, 405–420. [Google Scholar] [CrossRef]
- Liao, C.; Palvia, P.; Lin, H.N. The roles of habit and web site quality in e-commerce. Int. J. Inf. Manag. 2006, 26, 469–483. [Google Scholar] [CrossRef] [Green Version]
- Wang, Y.S.; Liao, Y.W. The conceptualization and measurement of m-commerce user satisfaction. Comput. Hum. Behav. 2007, 23, 381–398. [Google Scholar] [CrossRef]
- Kang, J.W.; Namkung, Y. The information quality and source credibility matter in customers’ evaluation toward food O2O commerce. Int. J. Hosp. Manag. 2019, 78, 189–198. [Google Scholar] [CrossRef]
- Zhao, H. Information quality or entities’ interactivity? Understanding the determinants of social network-based brand community participation. Future Internet 2019, 11, 87. [Google Scholar] [CrossRef]
- Negash, S.; Ryan, T.; Igbaria, M. Quality and effectiveness in web-based customer support systems. Inf. Manag. 2003, 40, 757–768. [Google Scholar] [CrossRef]
- Ranganathan, C.; Ganapathy, S. Key dimensions of business-to-consumer websites. Inf. Manag. 2017, 39, 457–465. [Google Scholar] [CrossRef]
- Ahn, T.; Ryu, S.; Han, I. The impact of web quality and playfulness on user acceptance of online retailing. Inf. Manag. 2007, 44, 263–275. [Google Scholar] [CrossRef]
- Corbitt, B.J.; Thanasankita, T.; Yi, H. Trust and e-commerce: A study of consumer perceptions. Electron. Commer. Res. Appl. 2003, 2, 203–215. [Google Scholar] [CrossRef]
- Luo, X.; Li, H.; Zhang, J.; Shim, J.P. Examining multi-dimensional trust and multi-faceted risk in initial acceptance of emerging technologies: An empirical study of mobile banking services. Decis. Support Syst. 2010, 49, 222–234. [Google Scholar] [CrossRef]
- Yadav, R.; Sharma, S.K.; Tarhini, A. A multi-analytical approach to understand and predict the mobile commerce adoption. J. Enterp. Inf. Manag. 2016, 29, 222–237. [Google Scholar] [CrossRef]
- Sharma, S.K.; Joshi, A.; Sharma, H. A multi-analytical approach to predict the Facebook usage in higher education. Comput. Hum. Behav. 2016, 55, 340–353. [Google Scholar] [CrossRef]
- Gefen, D.; Straub, D.; Boudreau, M.C. Structural equation modeling and regression: Guidelines for research practice. Commun. Assoc. Inf. Syst. 2000, 4, 2–77. [Google Scholar] [CrossRef]
- El-Masri, M.; Tarhini, A. Factors affecting the adoption of e-learning systems in Qatar and USA: Extending the unified theory of acceptance and use of technology 2 (UTAUT2). Educ. Tech. Res. Dev. 2017, 65, 743–763. [Google Scholar] [CrossRef]
- Seddon, P.B. A respecification and extension of the DeLone and McLean model of IS success. Inf. Syst. Res. 1997, 8, 240–253. [Google Scholar] [CrossRef]
- Nelson, R.R.; Todd, P.A.; Wixom, B.M. Antecedents of information and system quality: An empirical examination within the context of data warehousing. J. Manag. Inf. Syst. 2005, 21, 199–235. [Google Scholar] [CrossRef]
- Hsieh, C.C.; Kuo, P.L.; Yang, S.C.; Lin, S.H. Assessing blog-user satisfaction using the expectation and disconfirmation approach. Comput. Hum. Behav. 2010, 26, 1434–1444. [Google Scholar] [CrossRef]
- Lin, F.; Fofanah, S.S.; Liang, D. Assessing citizen adoption of e-government initiatives in Gambia: A validation of the technology acceptance model in information systems success. Gov. Inf. Q. 2011, 28, 271–279. [Google Scholar] [CrossRef]
- Alshehri, M.; Drew, S.; Alhussain, T.; Alghamdi, R. The Effects of Website Quality on Adoption of E-Government Service: An Empirical Study Applying UTAUT Model Using SEM. In Proceedings of the 23rd Australasian Conference on Information Systems, Geelong, Australia, 3–5 December 2012. [Google Scholar]
- Xu, J.D.; Benbasat, I.; Cenfetelli, R.T. Integrating service quality with system and information quality: An empirical test in the e-service context. MIS Q. 2013, 37, 777–794. [Google Scholar] [CrossRef]
- Rai, A.; Lang, S.S.; Welker, R.B. Assessing the validity of is success models: An empirical test and theoretical analysis. Inf. Syst. Res. 2002, 13, 50–69. [Google Scholar] [CrossRef]
- Kulkarni, U.R.; Ravindran, S.; Freeze, R. A knowledge management success model: Theoretical development and empirical validation. J. Manag. Inf. Syst. 2006, 23, 309–347. [Google Scholar] [CrossRef]
- Escobar-Rodriguez, T.; Carvajal-Trujillo, E. Online purchasing tickets for low cost carriers: An application of the unified theory of acceptance and use of technology (UTAUT) model. Tour. Manag. 2014, 43, 70–88. [Google Scholar] [CrossRef]
- Pavlou, P.A. Consumer acceptance of electronic commerce: Integrating trust and risk with the technology acceptance model. Int. J. Electron. Commer. 2003, 7, 101–134. [Google Scholar]
- Lopez-Nicolas, C.; Molina-Csatillo, F.J.; Bouwman, H. An assessment of advanced mobile services acceptance: Contributions from TAM and diffusion theory models. Inf. Manag. 2008, 45, 359–364. [Google Scholar] [CrossRef]
- Ha, S.; Stoel, L. Consumer e-shopping acceptance: Antecedents in atechnology acceptance model. J. Bus. Res. 2009, 62, 565–571. [Google Scholar] [CrossRef]
- Pookulangara, S.; Koesler, K. Cultural influence on consumers’ usage of social networks and it’s impact on online purchase intentions. J. Retail. Consum. 2011, 18, 348–354. [Google Scholar] [CrossRef]
- Agarwal, R.; Karahanna, E. Time flies when you’re having fun: Cognitive absorption and beliefs about information technology usage. MIS Q. 2000, 24, 665–694. [Google Scholar] [CrossRef]
- Morosan, C.; DeFranco, A. It’s about time: Revisiting UTAUT2 to examine consumers’ intentions to use NFC mobile payments in hotels. Int. J. Hosp. Manag. 2016, 53, 17–29. [Google Scholar] [CrossRef]
- Venkatesh, V.; Morris, M.G.; Davis, G.B.; Davis, F.D. User acceptance of information technology, toward a unified view. MIS Q. 2003, 27, 425–478. [Google Scholar] [CrossRef]
- Venkatesh, V.; Thong, J.Y.L.; Xu, X. Unified theory of acceptance and use of technology: A synthesis and the road ahead. J. Assoc. Inf. Syst. 2016, 17, 328–376. [Google Scholar] [CrossRef]
- Alalwan, A.A.; Dwivedi, Y.K.; Rana, N.P.; Algharabat, R. Examining factors influencing Jordanian customers’ intentions and adoption of internet banking: Extending UTAUT2 with risk. J. Retail. Consum. Serv. 2018, 40, 125–138. [Google Scholar] [CrossRef]
- San Martin, H.; Herrero, A. Influence of the user’s psychological factors on the online purchase intention in rural tourism, integrating innovativeness to the UTAUT framework. Tour. Manag. 2012, 33, 341–350. [Google Scholar] [CrossRef]
- Bagozzi, R.P.; Lee, K.H. Multiple routes for social influence: The role of compliance, internalization, and social identity. Soc. Psychol. Q. 2002, 65, 226–247. [Google Scholar] [CrossRef]
- Shao, X.; Siponen, M. Consumer acceptance and use of information technology: Adding consumption theory to UTAUT2. Work. Pap. Inf. Syst. 2011, 11, 1–8. [Google Scholar]
- Nair, P.K.; Ali, F.; Leong, L.C. Factors affecting acceptance & use of ReWIND: Validating the extended unified theory of acceptance and use of technology. Interact. Technol. Smart Educ. 2015, 12, 183–201. [Google Scholar]
- No, E.; Kim, J.K. Determinants of the adoption for travel information on smartphone. Int. J. Tour. Res. 2014, 16, 534–545. [Google Scholar] [CrossRef]
- Boes, K.; Borde, L.; Egger, R. The Acceptance of NFC Smart Posters in Tourism; Springer International Publishing: Cham, Switzerland, 2015; pp. 435–447. [Google Scholar]
- Lai, I.K. Traveler acceptance of an app-based mobile tour guide. J. Hosp. Tour. Res. 2013, 39, 401–432. [Google Scholar] [CrossRef]
- Khalilzadeh, J.; Ozturk, A.B.; Bilgihan, A. Security-related factors in extended UTAUT model for NFC based mobile payment in the restaurant industry. Comput. Hum. Behav. 2017, 70, 460–474. [Google Scholar] [CrossRef]
- Jeon, H.M.; Ali, F.; Lee, S.W. Determinants of consumers’ intentions to use smartphones apps for flight ticket bookings. Serv. Ind. J. 2019, 39, 385–402. [Google Scholar] [CrossRef]
- Chen, L.; Holsapple, C.W. E-business adoption research: State of the art. J. Electron. Commer. 2013, 14, 262–286. [Google Scholar]
- Brown, S.A.; Venkatesh, V. Model of adoption of technology in the household, a baseline model test & extension incorporating household life cycle. MIS Q. 2005, 29, 399–426. [Google Scholar]
- Van der Heijden, H. User Acceptance of hedonic information system. MIS Q. 2004, 28, 695–704. [Google Scholar] [CrossRef]
- Thong, J.Y.L.; Hong, S.J.; Tam, K.Y. The effects of post-adoption beliefs on the expectation-confirmation model for information technology continuance. Int. J. Hum. Comput. Stud. 2006, 64, 799–810. [Google Scholar] [CrossRef]
- Dodds, W.B.; Monroe, K.B.; Grewal, D. Effects of price, brand, and store information on buyers. J. Mark. Res. 1991, 28, 307–319. [Google Scholar]
- Limayem, M.; Hirt, S.G.; Cheung, C.M.K. How habit limits the predictive power of intentions: The case of information systems continuance. MIS Q. 2007, 31, 705–737. [Google Scholar] [CrossRef]
- Hsu, M.H.; Chang, C.M.; Chuang, L.W. Understanding the determinants of online repeat purchase intention & moderating role of habit, the case of online group-buying in Taiwan. Int. J. Inf. Manag. 2015, 35, 45–56. [Google Scholar]
- Singh, M.; Matsui, Y. How long tail and trust affect online shopping behavior: An extension to UTAUT2 framework. Pac. Asia J. Assoc. Inf. Syst. 2017, 9, 1–24. [Google Scholar] [CrossRef]
- Shaw, N.; Sergueeva, K. The non-monetary benefits of mobile commerce: Extending UTAUT2 with perceived value. Int. J. Inf. Manag. 2019, 45, 44–55. [Google Scholar] [CrossRef]
- Prasanna, R.; Huggins, T.J. Factors affecting the acceptance of information systems supporting emergency operations centres. Comput. Hum. Behav. 2016, 57, 168–181. [Google Scholar] [CrossRef]
- Escobar-Rodríguez, T.; Carvajal-Trujillo, E. Online drivers of consumer purchase of website airline tickets. Air Transp. Manag. 2013, 32, 58–64. [Google Scholar] [CrossRef]
- Barnes, S.J.; Vidgen, R.T. An integrative approach to the assessment of e-commerce quality. J. Electron. Commer. Res. 2002, 3, 114–127. [Google Scholar]
- Hair, J.F.; Hult, G.T.M.; Ringle, C.; Sarstedt, M. Primer on Partial Least Squares Structural Equation Modelling (PLS-SEM); Sage: Los Angeles, CA, USA, 2016. [Google Scholar]
- Fornell, C.R.; Larcker, D.F. Evaluating structural equation models with unobservable variables and measurement error. J. Mark. Res. 1981, 18, 39–50. [Google Scholar] [CrossRef]
- Wright, K.B. Researching internet-based populations: Advantages and disadvantages of online survey research, online questionnaire authoring software packages, and web survey services. J. Comput.-Mediat. Commun. 2005, 10, JCMC1034. [Google Scholar] [CrossRef]
Figure 1.
Theoretical Framework.

Figure 2.
Structural equation model with parameter estimates. * p < 0.05, ** p < 0.01. Non-significant paths are shown in dotted lines.
Figure 2.
Structural equation model with parameter estimates. * p < 0.05, ** p < 0.01. Non-significant paths are shown in dotted lines.


Table 1.
Respondent Profile.
| Demographic Characteristics | Frequency | Percentage | |
|---|---|---|---|
| Gender | Male | 137 | 40.3 |
| Female | 203 | 59.7 | |
| Age | 20–29 years | 160 | 47.1 |
| 30–39 years | 97 | 28.5 | |
| 40–49 years | 65 | 19.1 | |
| 50–59 years | 16 | 4.7 | |
| Above 60 years | 2 | 0.6 | |
| Marital status | Single | 192 | 56.5 |
| Married | 148 | 43.5 | |
| Educational level | High school | 35 | 10.3 |
| College degree | 49 | 14.4 | |
| University degree | 197 | 57.9 | |
| Graduate school | 59 | 17.4 | |
| Annual income | Below USD 20,000 | 115 | 33.8 |
| USD 20,000–29,000 | 95 | 27.9 | |
| USD 30,000–39,000 | 42 | 12.4 | |
| USD 40,000–49,000 | 36 | 10.6 | |
| USD 50,000–59,000 | 24 | 7.1 | |
| Above USD 60,000 | 28 | 8.2 | |
| Occupation | Student | 85 | 25.0 |
| Office worker | 88 | 25.9 | |
| Sales & Services | 63 | 18.5 | |
| Government employee | 11 | 3.2 | |
| Professional job | 44 | 12.9 | |
| Self-employed | 12 | 3.5 | |
| House wife | 21 | 6.2 | |
| Other | 16 | 4.7 | |
| Frequency of use for 1 month | 1–2 times | 34 | 1.4 |
| 3–4 times | 191 | 20.9 | |
| 5–6 times | 94 | 25.7 | |
| 7–8 times | 13 | 22.2 | |
| Above 9 times | 8 | 29.8 | |
Table 2.
Measurement model assessment.
| Variable and Item | Standardized Loading | CR | AVE |
|---|---|---|---|
| Information quality (α = 0.831) | |||
| Using food delivery apps provides accurate information | 0.821 | 0.898 | 0.550 |
| Using food delivery apps provides believable information | 0.866 | ||
| Using food delivery apps provides information at the right level of detail | 0.622 | ||
| Using food delivery apps presents the information in an appropriate format | 0.626 | ||
| Performance expectancy (α = 0.850) | |||
| I find food delivery apps useful in my daily life. | 0.755 | 0.881 | 0.545 |
| Using food delivery apps increases my chances of purchasing foods that are important to me. Using food delivery apps enables me to accomplish the purchasing process more quickly. | 0.782 0.726 | ||
| I can save time when I use food delivery apps for purchasing foods. | 0.692 | ||
| Effort expectancy (α = 0.905) | |||
| Learning how to use food delivery apps for purchasing foods is easy for me | 0.755 | 0.943 | 0.672 |
| My interaction with food delivery apps for the purchase of foods is clear and understandable. | 0.904 | ||
| Using food delivery apps is easy for me | 0.887 | ||
| It is easy for me to become skillful at using food delivery apps for purchasing foods. | 0.790 | ||
| Social influence (α = 0.902) | |||
| People who are important to me think that I should use food delivery apps for purchasing foods. | 0.853 | 0.942 | 0.757 |
| People who influence my behavior think that I should use food delivery apps for purchasing books. | 0.911 | ||
| People whose opinions I value prefer that I use food delivery apps for purchasing books. | 0.847 | ||
| Facilitating conditions (α = 0.691) | |||
| I have the knowledge necessary to use food delivery apps for purchasing foods. | 0.606 | 0.782 | 0.546 |
| I feel comfortable using food delivery apps for purchasing foods. | 0.850 | ||
| Hedonic motivation (α = 0.916) | |||
| Using food delivery apps for purchasing foods is fun. | 0.879 | 0.939 | 0.791 |
| Using food delivery apps for purchasing foods is enjoyable. | 0.944 | ||
| Using food delivery apps for purchasing foods is very entertaining. | 0.843 | ||
| Price value (α = 0.874) | |||
| I can save money by using food delivery apps for purchasing foods by comparing the prices offered at different online stores. I like to search for cheap deals at different online stores when I purchase foods through food delivery apps. | 0.952 0.816 | 0.896 | 0.785 |
| Habit (α = 0.889) | |||
| Purchasing foods through food delivery apps is almost like a habit for me. | 0.874 | 0.874 | 0.639 |
| I am addicted to using food delivery apps for the purchase of foods. I must use food delivery apps for purchasing foods. | 0.698 0.736 | ||
| Using food delivery apps for purchasing foods has become natural to me. | 0.877 | ||
| Continuous intention (α = 0.916) | |||
| I intend to continue using food delivery apps in the future. | 0.860 | 0.930 | 0.738 |
| I will always try to use food delivery apps in my daily life. | 0.818 | ||
| I plan to continue to use food delivery apps frequently. I have decided to use food delivery apps for purchasing foods the next time | 0.918 0.839 | ||
Table 3.
Correlation analysis between the variables.
| Variable | 1 | 2 | 3 | 4 | 5 | 6 | 7 | 8 | 9 |
|---|---|---|---|---|---|---|---|---|---|
| 1. IQ | 0.550 | ||||||||
| 2. PE | 0.471 | 0.545 | |||||||
| 3. EE | 0.357 | 0.525 | 0.672 | ||||||
| 4. SI | 0.429 | 0.562 | 0.499 | 0.757 | |||||
| 5. FC | 0.330 | 0.537 | 0.666 | 0.522 | 0.546 | ||||
| 6. HM | 0.371 | 0.586 | 0.336 | 0.542 | 0.428 | 0.791 | |||
| 7. PV | 0.330 | 0.413 | 0.292 | 0.346 | 0.362 | 0.417 | 0.785 | ||
| 8. HT | 0.233 | 0.440 | 0.263 | 0.441 | 0.370 | 0.520 | 0.235 | 0.639 | |
| 9. CI | 0.460 | 0.640 | 0.482 | 0.609 | 0.561 | 0.572 | 0.346 | 0.689 | 0.738 |
| Mean | 3.564 | 3.555 | 3.891 | 3.351 | 3.798 | 3.041 | 3.394 | 2.508 | 3.265 |
| S.D. | 0.592 | 0.668 | 0.664 | 0.695 | 0.720 | 0.799 | 0.859 | 0.893 | 0.827 |
Diagonal elements show the average variance extracted (AVE). Below the diagonal is the correlation coefficient.
Table 4.
Result of structural model analysis.
| Hypotheses | Beta | t-Value | p-Value | Decision | |
|---|---|---|---|---|---|
| H1 | IQ -> PE | 0.790 | 10.067 ** | 0.000 | supported |
| H2 | IQ -> EE | 0.697 | 10.268 ** | 0.000 | supported |
| H3 | IQ -> CI | 0.097 | 0.768 | 0.443 | rejected |
| H4 | PE -> CI | 0.229 | 2.994 ** | 0.003 | supported |
| H5 | EE -> CI | 0.029 | 0.565 | 0.572 | rejected |
| H6 | SE -> CI | 0.133 | 2.418 * | 0.016 | supported |
| H7 | PC -> CI | 0.079 | 0.842 | 0.400 | rejected |
| H8 | HM -> CI | −0.016 | −0.314 | 0.754 | rejected |
| H9 | PV -> CI | 0.020 | 0.476 | 0.634 | rejected |
| H10 | HT -> CI | 0.530 | 9.788 ** | 0.000 | supported |
Note: Critical t-values. * p<.05, ** p<.01.
Table 5.
Result of multi mediating effect analysis.
| Hypotheses | Total Effect | Direct Effect | Indirect Effect | p-Value | Decision | |
|---|---|---|---|---|---|---|
H11 | IQ -> CI IQ -> EE -> CI | 0.442 - | 0.144 - | 0.298 0.267 * | - 0.011 | full mediated |
| H12 | IQ -> EE -> CI | - | - | 0.030 | 0.613 | rejected |
Note: Critical t-values. * p < 0.05.
© 2019 by the authors. Licensee MDPI, Basel, Switzerland. This article is an open access article distributed under the terms and conditions of the Creative Commons Attribution (CC BY) license (http://creativecommons.org/licenses/by/4.0/).
Share and Cite
MDPI and ACS Style
Lee, S.W.; Sung, H.J.; Jeon, H.M. Determinants of Continuous Intention on Food Delivery Apps: Extending UTAUT2 with Information Quality. Sustainability 2019, 11, 3141. https://0-doi-org.brum.beds.ac.uk/10.3390/su11113141
AMA Style
Lee SW, Sung HJ, Jeon HM. Determinants of Continuous Intention on Food Delivery Apps: Extending UTAUT2 with Information Quality. Sustainability. 2019; 11(11):3141. https://0-doi-org.brum.beds.ac.uk/10.3390/su11113141
Chicago/Turabian StyleLee, Suk Won, Hye Jin Sung, and Hyeon Mo Jeon. 2019. "Determinants of Continuous Intention on Food Delivery Apps: Extending UTAUT2 with Information Quality" Sustainability 11, no. 11: 3141. https://0-doi-org.brum.beds.ac.uk/10.3390/su11113141
Note that from the first issue of 2016, this journal uses article numbers instead of page numbers. See further details here.