An Approach to Determine Risk Indices for Drinking Water–Study Investigation


Department of Water Supply and Sewerage Systems, Faculty of Civil, Environmental Engineering and Architecture, Rzeszow University of Technology, Al. Powstancow Warszawy 6, 35-959 Rzeszow, Poland
*
Author to whom correspondence should be addressed.
Sustainability 2019, 11(11), 3189; https://0-doi-org.brum.beds.ac.uk/10.3390/su11113189
Submission received: 3 May 2019
/
Revised: 28 May 2019
/
Accepted: 2 June 2019
/
Published: 7 June 2019
(This article belongs to the Special Issue Sustainability and Risks in Construction Management)
Abstract
:In accordance with the water quality standard, the safe functioning of the water treatment system operation is considered. This paper alludes to extreme situations, which arise where there is periodic deterioration of the quality of raw water, for which the technological process of water treatment is not prepared. A conception method is presented by which to assess indices of risk vis-à-vis drinking water, on the basis of a probability estimation methodology. The categorisation of water pipes in line with quality-reliability as regards the physical and chemical composition of drinking water or water intended for business purposes is proposed. An example of the method being put to use is also offered, and it is recognised how the approach being proposed could be the basis for further analysis that takes different conditions of functioning of water-supply systems into account.
1. Introduction
National or supranational provisions require further adaptation and development of research methods related to the safety of water supply systems (WSSs). The terms safety and risk are commonly used in various aspects of everyday waterworks practice [1]. The presented notions meet the current so-called “water safety plans,” which scope includes an overall assessment of WSSs. This means an analysis of the risk and safety of the water supply system from water intake from treatment to its consumption. The analysis is aimed at assessing whether the system is able to provide water that meets health standards in accordance with applicable water quality standards for human consumption. An important aspect in this regard is also the emergency water supply from alternative sources. The continuity of drinking water supply services is a vital concern; that is why efforts and resources are combined to enhance its resilience in case of a disruption. The methodology for integrating cascades of failures presented by Eid M. contributes to the development of a resilience concept as to help in crisis management decision-making [2]. Referring to water supply systems, risks associated with the management of the water supply system are considered primarily from the point of view of water consumers [3]. In this respect, the risk related to the possibility of drinking water of inadequate quality, which may result in poisoning, disease, and the lack of water supply as a result of a system failure, can be considered [4,5]. The developed methods of reliability assessment concerning the point of view of consumer’s needs [6,7] are helpful in determining the quality service standards of supplied water to the consumers. In fact, a challenge for science and technology is clearly posed by the centralisation of water-production and related services, the mass consumption of tap water, and consumer expectations for that water [8]. Water supply operators should maintain the services at high operational level, with full respect of safety and availability standards in regard to its cleanliness, healthiness, and taste water; and indeed all the more so in the face of extraordinary events of an undesirable nature, as well as the unprecedented terrorist threat [9]. According to these requirements, the assessment of diversification degree of water supply for human consumption from independent sources should be performed. Such possibility provides the Shannon Wiener index, which allows for objective comparison between water supply systems with different final water production [10]. Other methods for estimating the risk of failure are based on the assumptions of classical matrix methods while information from the system operation is inaccurate, as proposed in [11,12]. Also, an important issue constitutes an analysis of failure scenarios framework in order to determine the probability of the threat occurrence by implementation of the Fault Tree Analysis or the Preliminary Hazard Analysis Method, which are helpful for failure analysis in a decision-making process and preventive strategies [13,14]. Conclusions arising out of the history of particular failures entailing the large-scale contamination of tap water in urban agglomerations offer a perfect guide as to how risk management of an active nature needs to be engaged in [9].
This leaves it vital that risk-reduction procedures be pursued, and decision-support tools devised, on the basis of analyses and risk assessments that accompany the functioning of a WSS, also in compliance with guidelines vis-à-vis risk and crisis management where the security of the supply of drinking water is concerned [15,16], with account also taken of the principles of sustainable development. The paradigm becomes the argument, as we wish to live—and to drink safe water—in conditions of peace and certainty, in the belief that there is no risk or effective protection against it [17]. Meanwhile, the specialist scientific literature puts a clear emphasis on the view that quantitative risk analysis and assessment methods of water supply system failure form the basis upon which to manage security of a WSS [18,19,20,21,22,23,24,25,26,27,28,29], in the context of belonging to critical infrastructure [30].
Natural waters are very rarely of a composition allowing their safe use as drinking water. Almost always proper treatment is going to be essential, and the aim of the processes involved in that is to bring water up into line with specific requirements set out in the regulation on conditions to be met by drinking water and suitable for economic purposes [31,32,33,34]. It should be emphasised here that drinking water needs to reach users of the supply in sufficient quantity and quality, in accordance with the existing law outlined in Council Directive of the European Union 98/83/EC on the quality of water intended for human consumption [35]. Now, however, work is underway on a new Directive obliging water-supply companies to implement WSPs—on the basis of analyses and risk assessments.
The threshold values for permissible concentrations of pollutants of water that are set out in various norms allow suitability for drinking and for economic purposes to be determined [36,37]. However, in a majority of cases, technological processes relating to water treatment do not take account extreme situations, in which there are times during which the designed or existing water-treatment process does not guarantee compliance with quality standards [38,39,40,41].
Some examples of extreme situations influencing many recipients in recent years were as follows:
- In 2014, Ohio, according to the Surveillance for Waterborne Disease Outbreaks Associated with Drinking Water in the United States, the microcystin contamination event occur in a drinking water system, about 110 people were illed. During this event, an extensive emergency response occurred to ensure that the approximately 500,000 people affected had access to information about the advisory,
- In 2013, Subcarpathian province, the secondary pollution of water took place and lasted about two weeks, probably due to a poorly chosen cleaning agent for the water supply network. Escherichia Coli bacteria were detected in the water network supplying 50,000 inhabitants. In the period of danger, the hospital recorded 100 cases of various types of ailments in patients (poisoning, diarrhoea).
The current level of technical knowledge allows for treatment of even the most polluted water, while economic considerations suggest the intake of best-quality water only. However, this may also experience periodic contamination with specific substances, for which the technological processes of treatment in either existing and planned treatment plants are not always prepared [42,43,44]. To clarify the concept of contaminated water, i.e., water not fit to drink, it is necessary to achieve normalisation of composition where quality is concerned.
Decisions to limit or interrupt the production of water are made in line with the type of contamination, on the basis of a physico-chemical analysis of treated or raw water. In cases of small exceedances of the normative values for pollution indicators (when there is no need to stop production), it is possible to carry out repeat analyses, as well as to correct the technological process being followed. The cessation of production by a plant is thus a final step that generally results in supply shortages to the concerned population. The negative economic and social consequences of such a decision ensure that its adoption tends to be blocked repeatedly. In the face of periodic checks on water quality, it is not possible to be sure that the standard between checks is always met, and the only alternative would be for a water treatment plant (WTP) to be equipped with continuous measurement equipment [4,7]. In line with data on the quality of raw water obtained over many years of research, technological processes could be introduced to allow for periodic intensification of treatment with specified criteria [45]. The development of a warning system would allow a plant to be shut down for a period through which obtainment of an acceptable level of water quality specified for emergency conditions is precluded. And the solution here thus requires that frequencies and durations of periods of non-compliance be determined [8,39].
This is possible on the basis of reliability theory, which provides for study of the random phenomena that cause periodic reductions in the amount or quality of water [40]. This is done using the so-called risk indices that allow for numerical characterisation of damage resulting from various failures, and contaminations occurring periodically in a random manner.
The ultimate aim of the proposal presented here is in fact to limit the duration of situations in which waterworks briefly produce water that is treated, but of inadequate quality in relation to standards, given that there is a slight increase, taking into account above-average concentration of contaminants.
2. Material and Methods
Taking the mentioned circumstances into account, a modification was proposed to the method by which normative values for water quality are determined. If it is impossible to preclude typically random cases in which periods of non-normative values for treated water arise, then limitations on the duration and frequency of such undesirable situations should be introduced. It is also necessary to set limits for exceedance of the normative values for drinking-water quality. In other words, instead of adhering to an assumption questionable in practice as to the inadmissibility of water-quality exceedances, it is better to introduce limits on the scope and frequency of such non-compliance with standards. The introduction of such criteria provides a basis for additional security.
2.1. The Approach to Obtaining a Water-Pollution Criterion
As a criterion for drinking-water contamination, pollutant concentrations corresponding to individual physico-chemical indicators of composition were assumed. Next, the indicators included in the current standard for the quality of water intended for human consumption were divided into three groups, in line with their harmful effects on the human organism:
- The first group (A) includes indices determining the suitability of drinking water, inter alia colour, turbidity, iron, manganese, sulphates and chlorides, for which it is assumed that periodic and limited exceedances of normative concentrations do not threaten human health,
- The next group (B) includes indicators that present a significant risk to human health. Included here are forms of nitrogen and phosphorus, fluorides, Chemical Oxygen Demand (COD), nanoparticles, hormones, antibiotics and pH,
- The last group (C) includes indicators that pose a toxic threat to the human body, among others: heavy metals, phenol, cyanides, and DDT and its metabolites. The indicators from group A thus concern the pollutants least harmful to people, while group C indicators are substances i.a. having a carcinogenic impact.
Additional parameters identified as significant for monitoring for a given water supply zone are determined on the basis of the results of a risk assessment carried out in accordance with the existing standard. In such case, risk means a measure by which to assess a hazard or threat resulting either from probable events beyond our control or from the possible consequences of a decision, which have been developed.
For all indices from the presented groups, the following index for the exceedance of quality standards for drinking water relating to specific physico-chemical indices for water was introduced. Such a criterion is used to assess whether the functioning of a WTP is appropriate when it comes to the quality of water for consumption.
An Exceedance Index (EI) is thus determined, in line with the following dependence relationship [7,39]:
where Co is the observed concentration of a given physical and chemical indicator of drinking water, higher than the value constituting the current standard [35], Cmax is the maximum short-term permissible concentration of a given physical and chemical indicator of drinking water, adopted after data on tolerance criteria for chemical substances and numbers of indicator microorganisms, and Cacc is the acceptable concentration of a given physical-chemical indicator for drinking water in accordance with standards and WHO guidelines.
Values of EI can be described as follows:
- Satisfactory quality of water, which has quality parameters above threshold values for norms, where EI = 0,For:Co ≤ Cacc
- Quality of water non-normative, but permissible for short periods of a duration that is nevertheless limited and to be determined, where 0 < EI < 1.0,
- Quality of the water that is unacceptable, making it absolutely necessary for a plan and WTP to be shut off in order to prevent that water from reaching recipients, where EI = 1.0,
For:
Co ≥ Cmax
In practice, the Cmax concentrations prove especially difficult to determine in relation to human health. Harmful doses depend on many biological features of the body, including the degree of habituation, innate sensitivity or immunity, and rate of absorption. However, adoption of Cmax concentration values in line with the aforementioned recommendation would seem to relate to a daily human intake of water equal to 2.5 dm3, as well as a limited period over which water in the above category is consumed [4,7,39].
2.2. Probability Estimation Methodology
The probability that the concentration of a pollutant exceeds the normative is different for various degrees of exceedance, but the method presented here allows account to be taken of different levels of normative concentration and weightings relating to probabilities of exceedance. Such issues were considered by reference to a time unit equal to one year.
The proposed categorisation of water pipes in line with quality-reliability as regards the physical and chemical composition of drinking water or water intended for business purposes is as follows:
- 1st category: water-supply systems of urban and industrial agglomerations of more than 500,000 inhabitants, where quality control in respect of water is carried out at least four times every 24 h,
- 2nd category: water-supply systems of cities with populations in the 100,000–500,000 range, in which quality control in respect of water is carried out 3 times in 24-h periods,
- 3rd category: water-supply systems of cities with populations in the 10,000–100,000 range, in which quality control in respect of water is carried out twice a day,
- 4th category: water-supply systems of towns or settlements with under 10,000 people, in which one check on water quality is carried out each 24 h, or in justified cases less than once a day (e.g., where a catchment is forested or otherwise undeveloped).
The categorisation regards the volume of water supplied or produced in the supply zone according to the existing directive on the quality of water intended for human consumption.
The degree to which a concentration provided for in law is exceeded is associated with an arbitrary threshold value adopted for indicators of exceedance of water quality for consumption EI. The method then assumes a frequency of occurrence of periods in which such EIt threshold values may arise within the period of one year. Assumed values can be estimates derived from waterworks practice and expert experience.
The probability of occurrence of such periods can be determined in line with the dependence relationship [7,39]:
where Fi is the frequency of occurrence of periods in which threshold values EIt can occur and Ti is the duration of the i-th period, in d.
For states in which the condition is of there being no exceedance of given indicators in relation to what is provided for, we can write [7,39]:
The factor representing the unreliability of the WTP in relation to the quality delivered to the municipal waterworks is the concentration of a given pollution index above the normative value, and determined indirectly by reference to the EI value. Hence, the generalised reliability index is [7,39]:
RI = 1 − Funr
Generalised unreliability is determined by reference to the ratio of the value of EI exceedance, including cases when EI exceed 0 to 1 marked as Funr up to the limit value of this exceeding.
3. Application Example
RI values calculated according to the probability estimation methodology in Section 2.2 are summarised in Table 1.
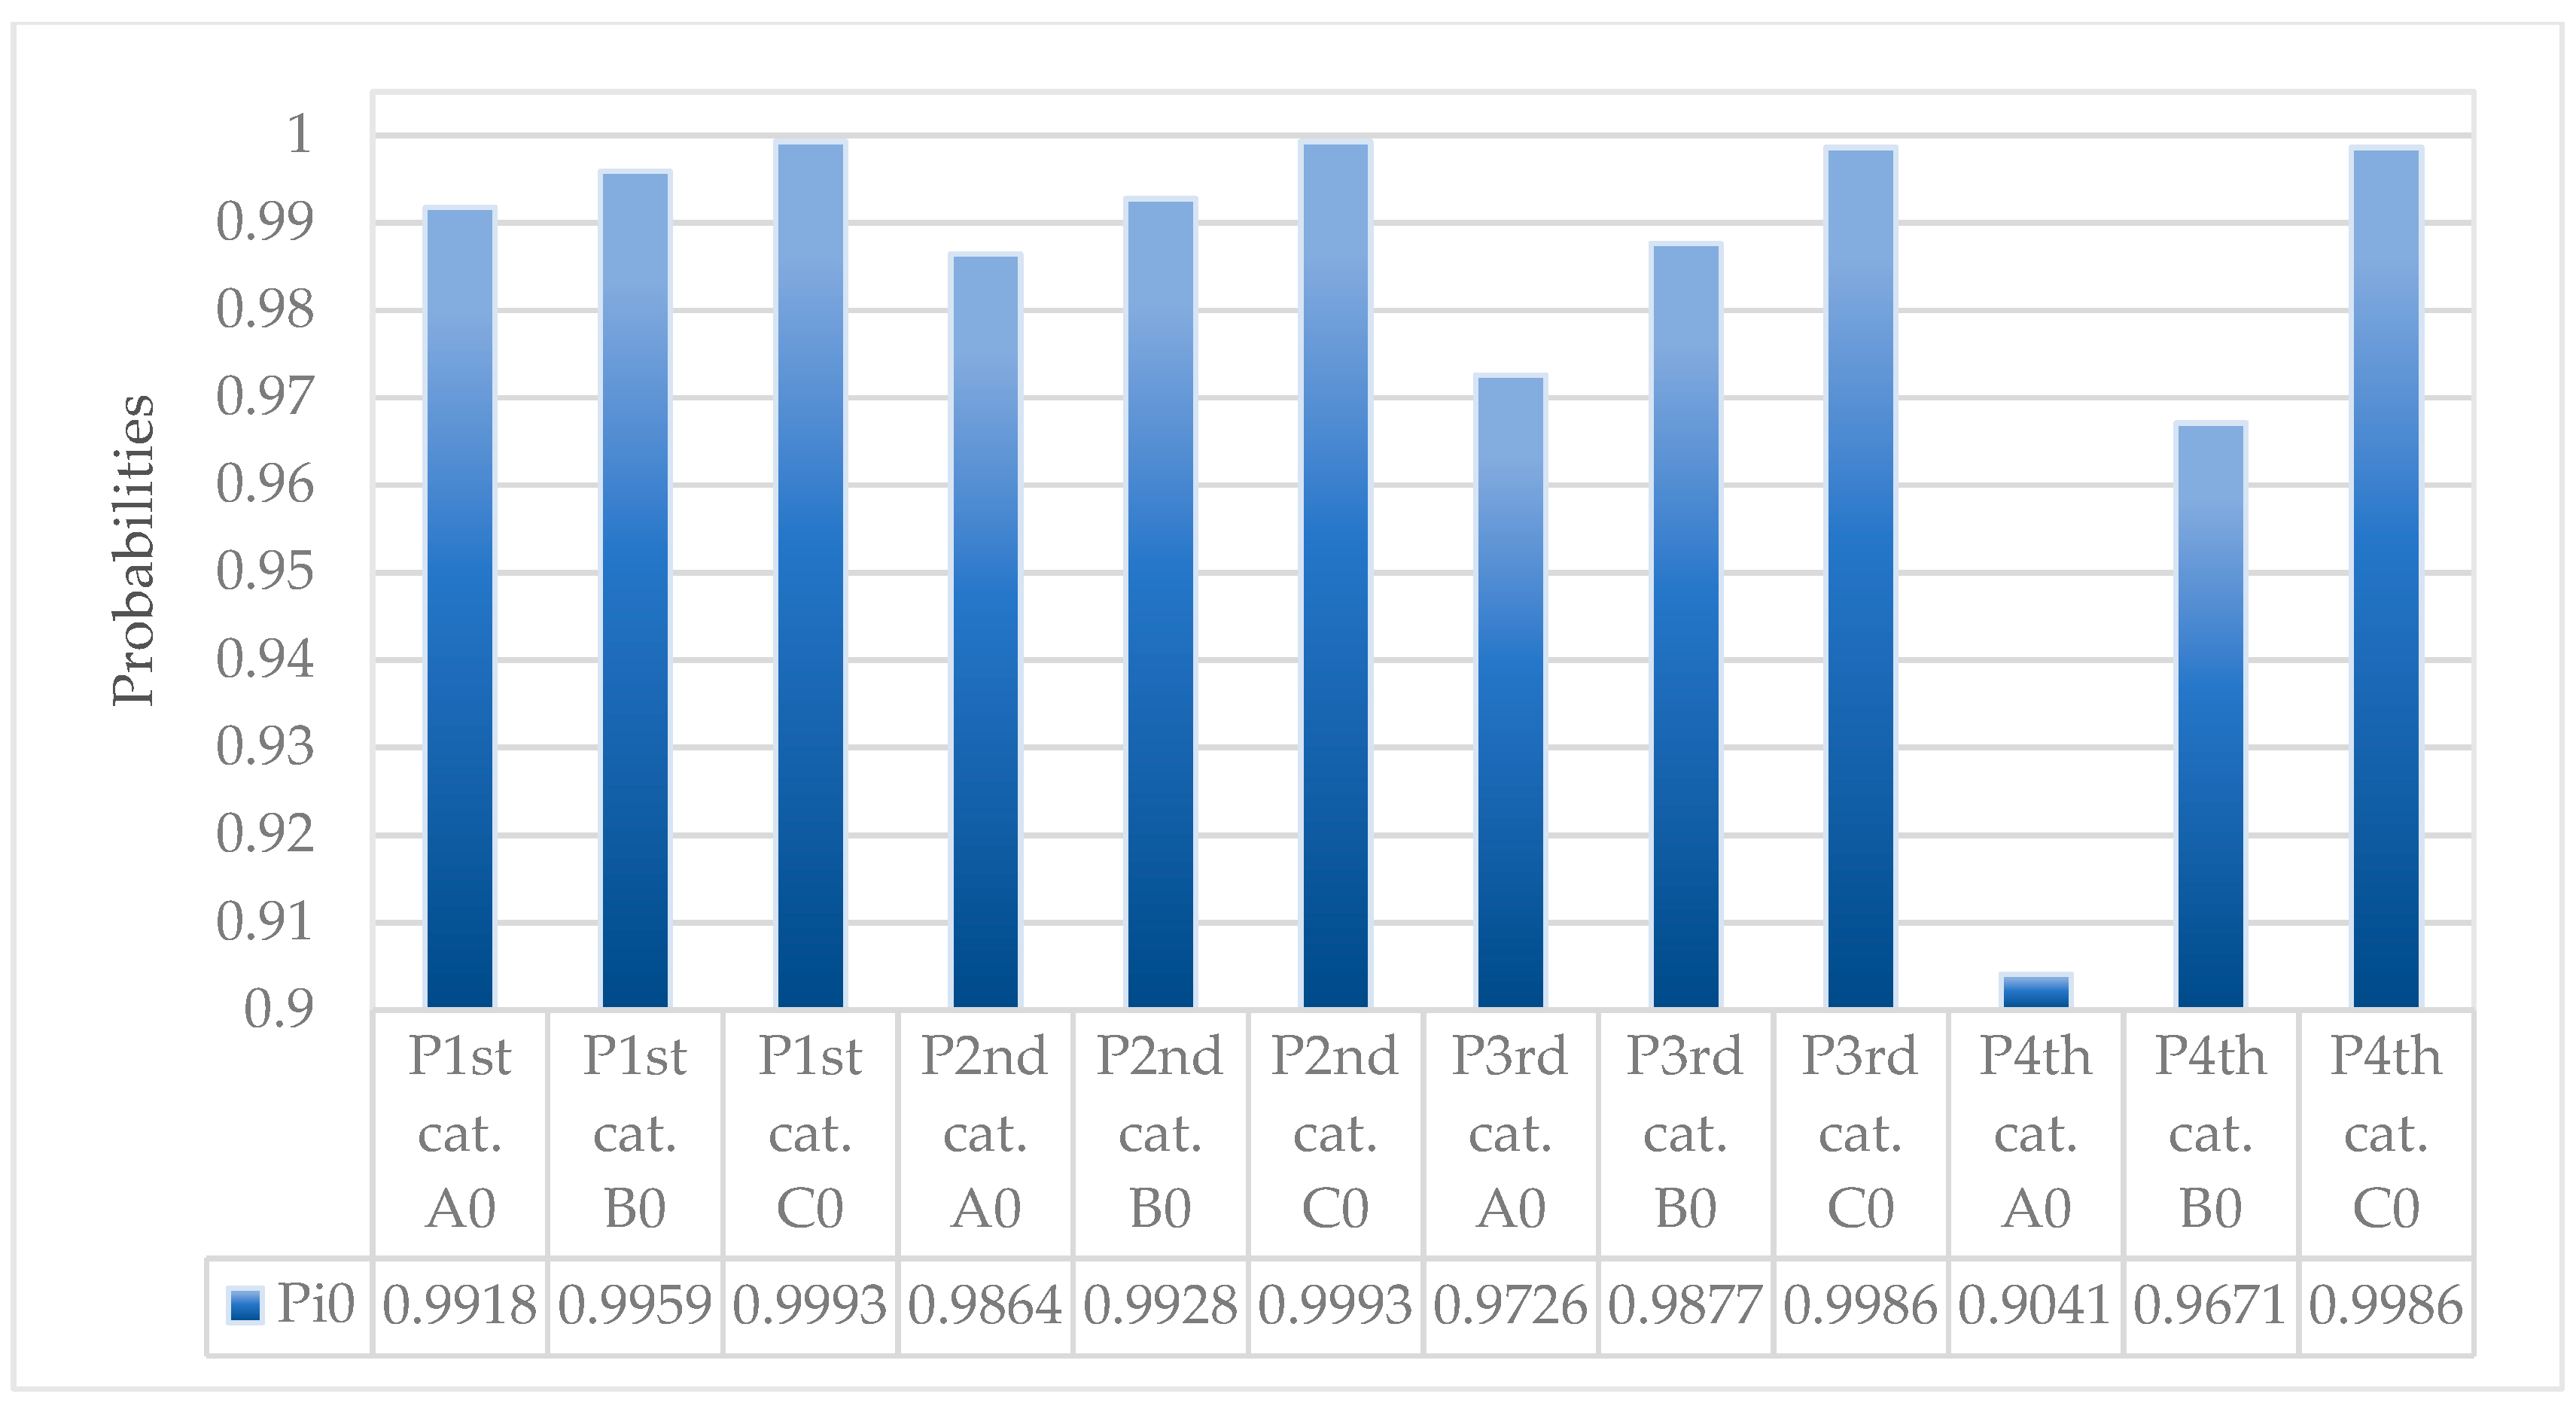
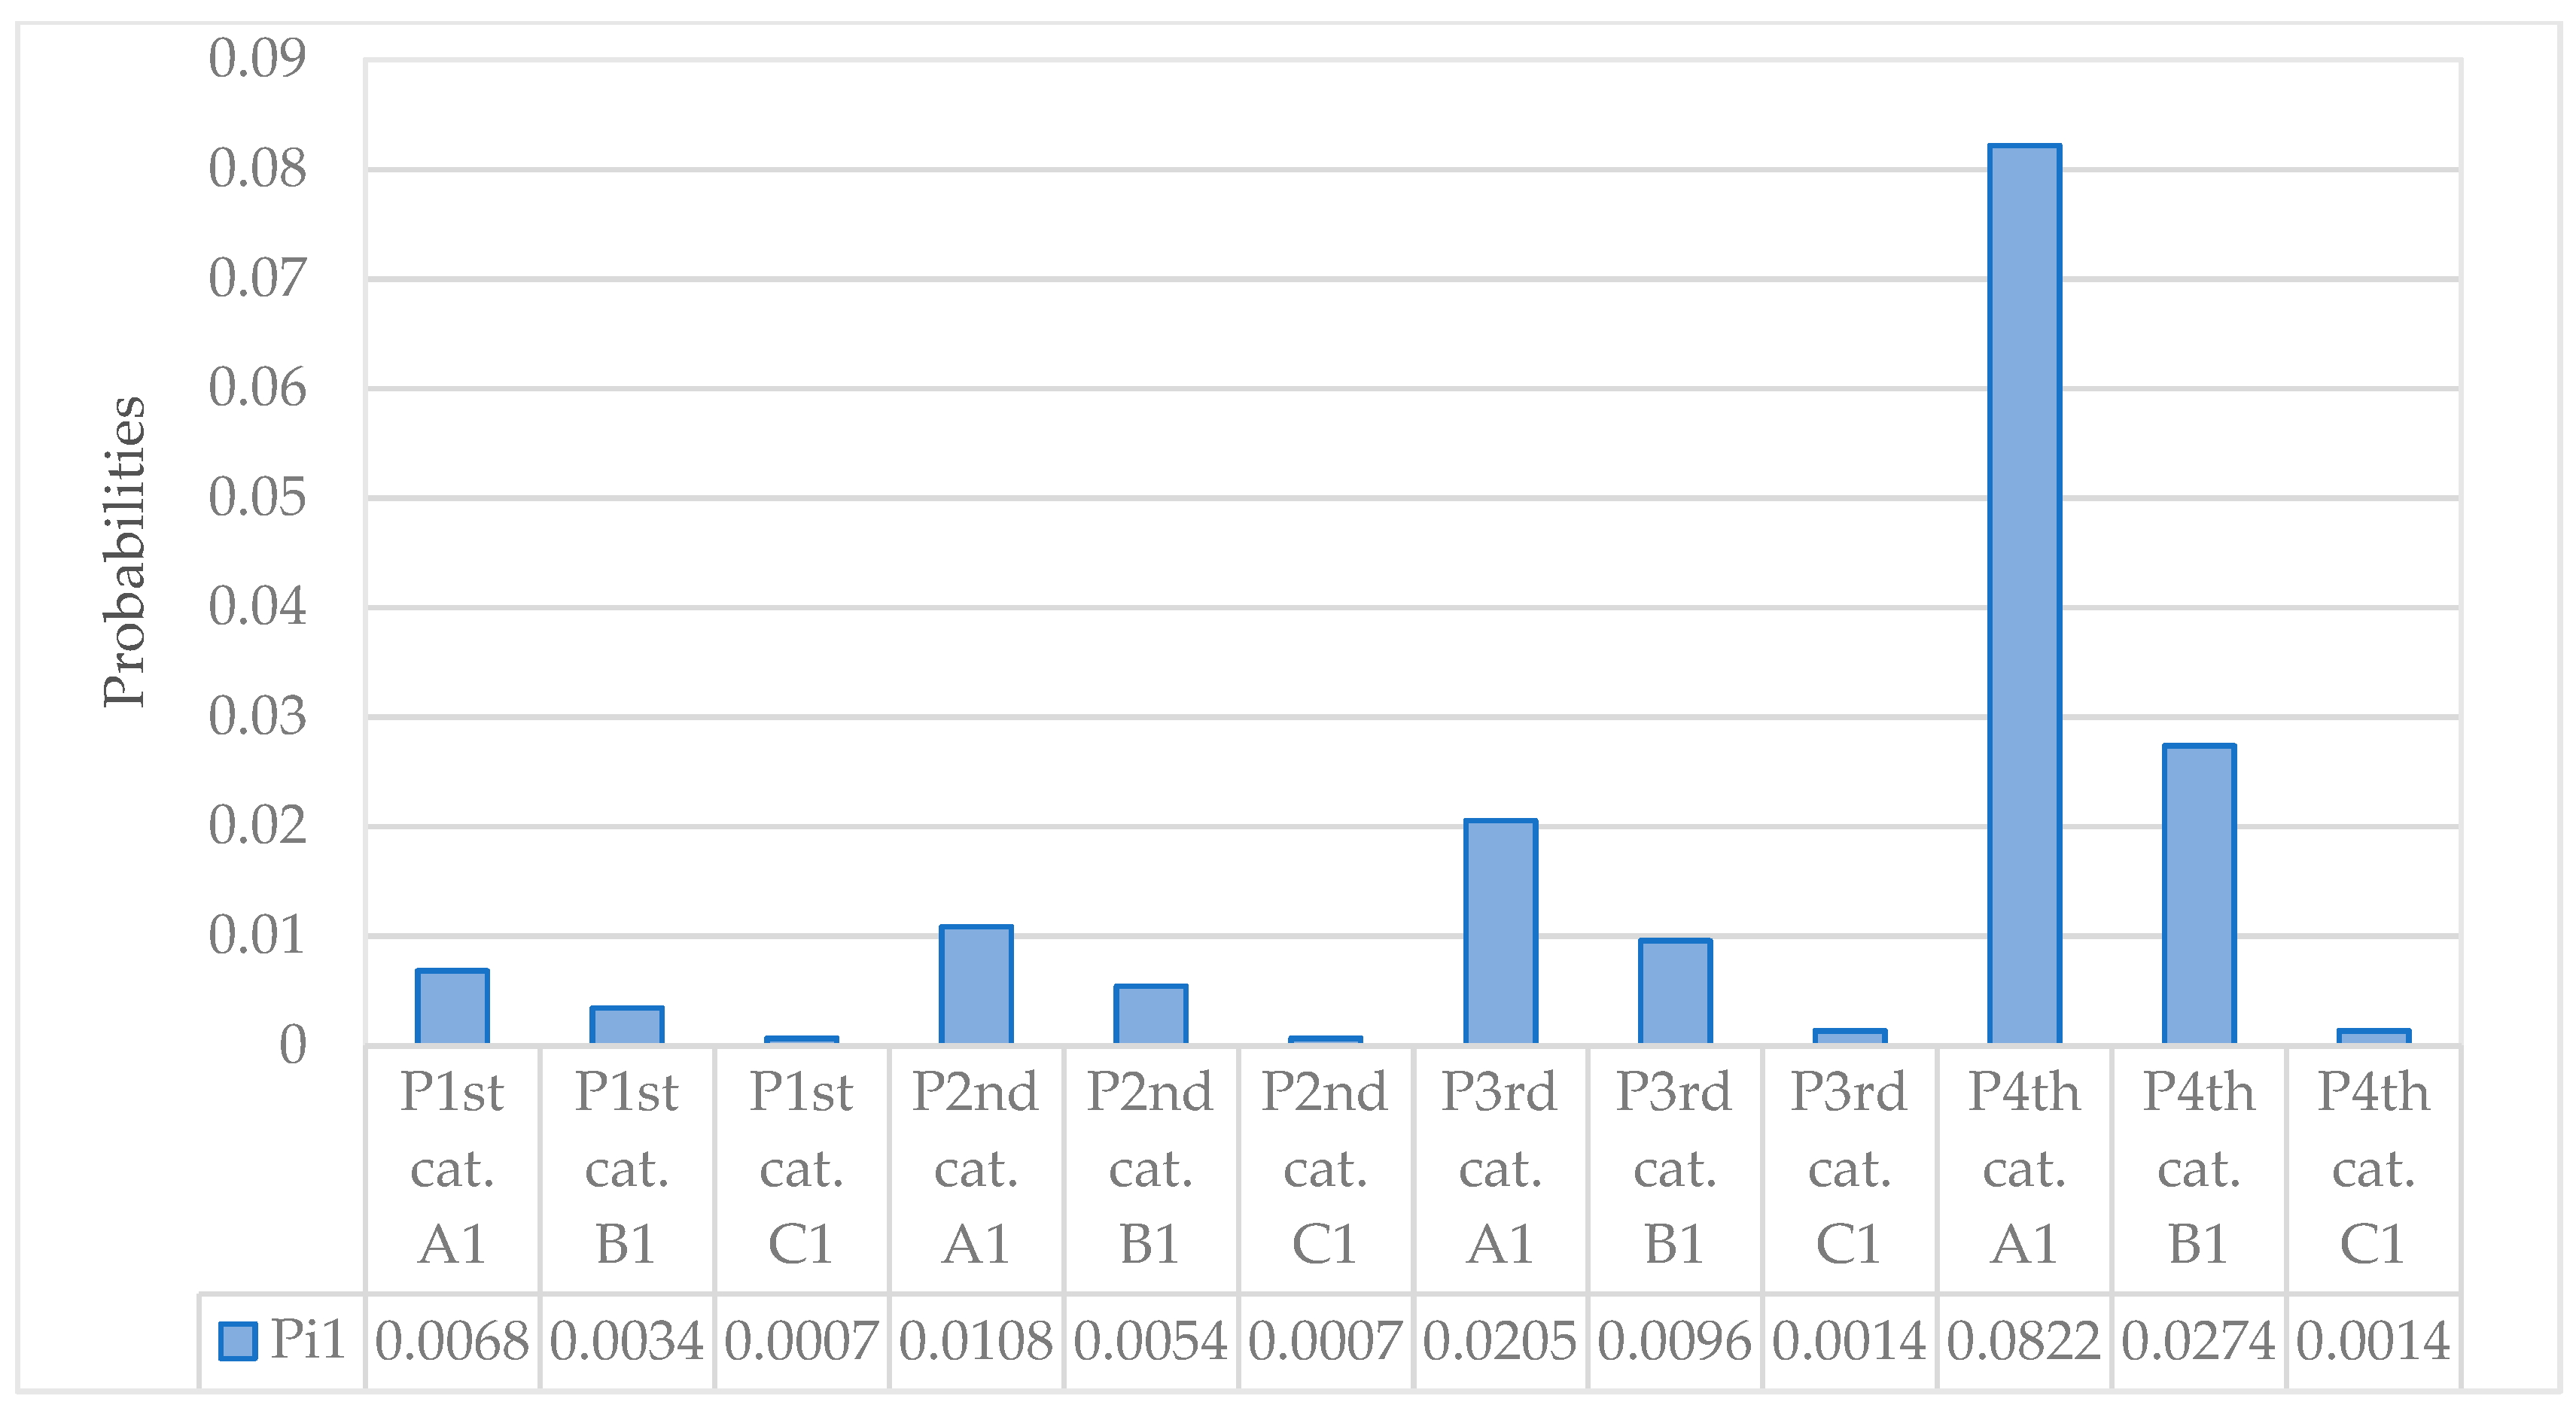
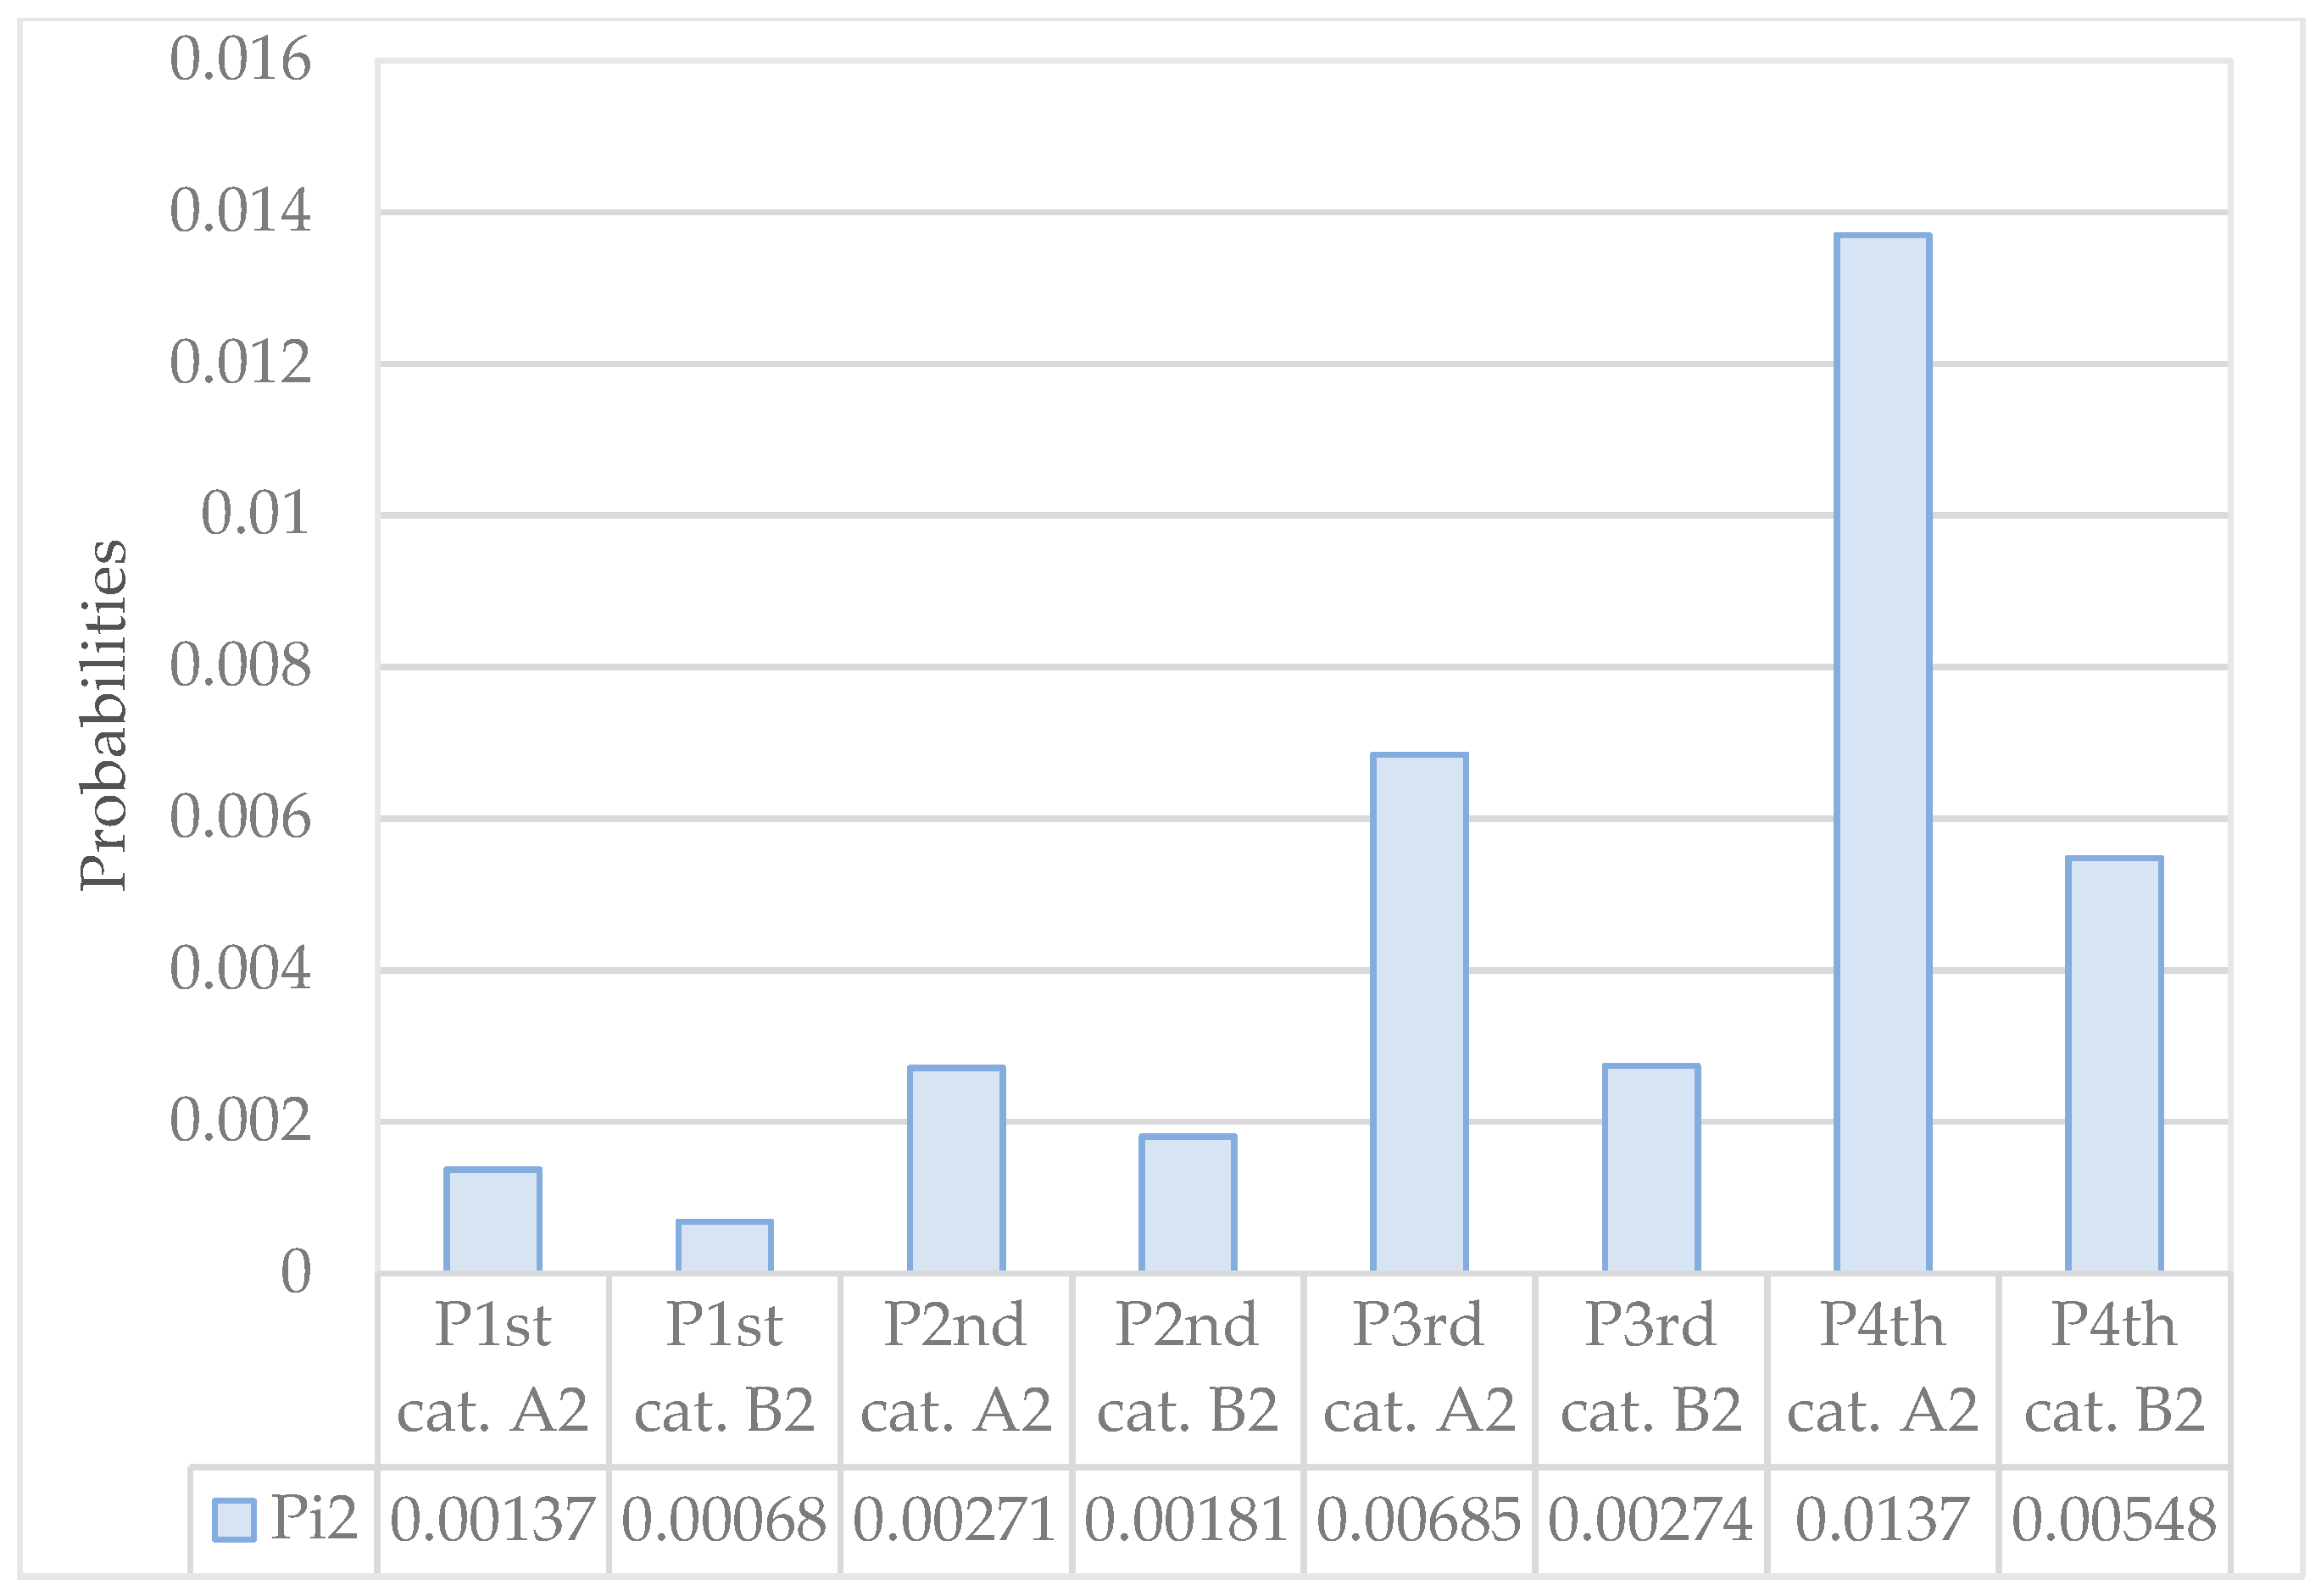
From the point of view of engineering practice, it is interesting to know the probability at any given time that a WTP will provide water corresponding to the standard. This value applies to the case of EI = 0 and is equal to P0. The values for probabilities associated with drinking water risks by WSS division into reliability categories for water supply, for different assumptions of probabilities is as follows (Figure 1, Figure 2 and Figure 3).
As regards the second category of calculation, case B and 0 < EI ≤ 0.1, the exceedance of the normative value concerned a contaminant from group B, within the range 0 < EI ≤ 0.1, which may not arise more than 6 times a year, with the duration in each case not exceeding 0.33 days, i.e., 8 h. EI1 means a threshold EIp = 0.1, and P1 probabilities of all combined cases.
For comparison in the case of the fourth category and calculation case B and 0.1 < EI ≤ 0.3, the frequency of occurrence of periods in which threshold values EIt cannot occur more than 10 times a year, with the duration of distinguished period three times bigger, than in the previously mentioned case.
The RIacc value applies to the whole group of cases, i.e., for EI = 0, 0 < EI ≤ 0.1 and 0.1 < EI ≤ 0.3. Reference to the Table 1 indicates a need to calculate values of the RI and P0 indices for each WTP, and to check whether the inequality is met.
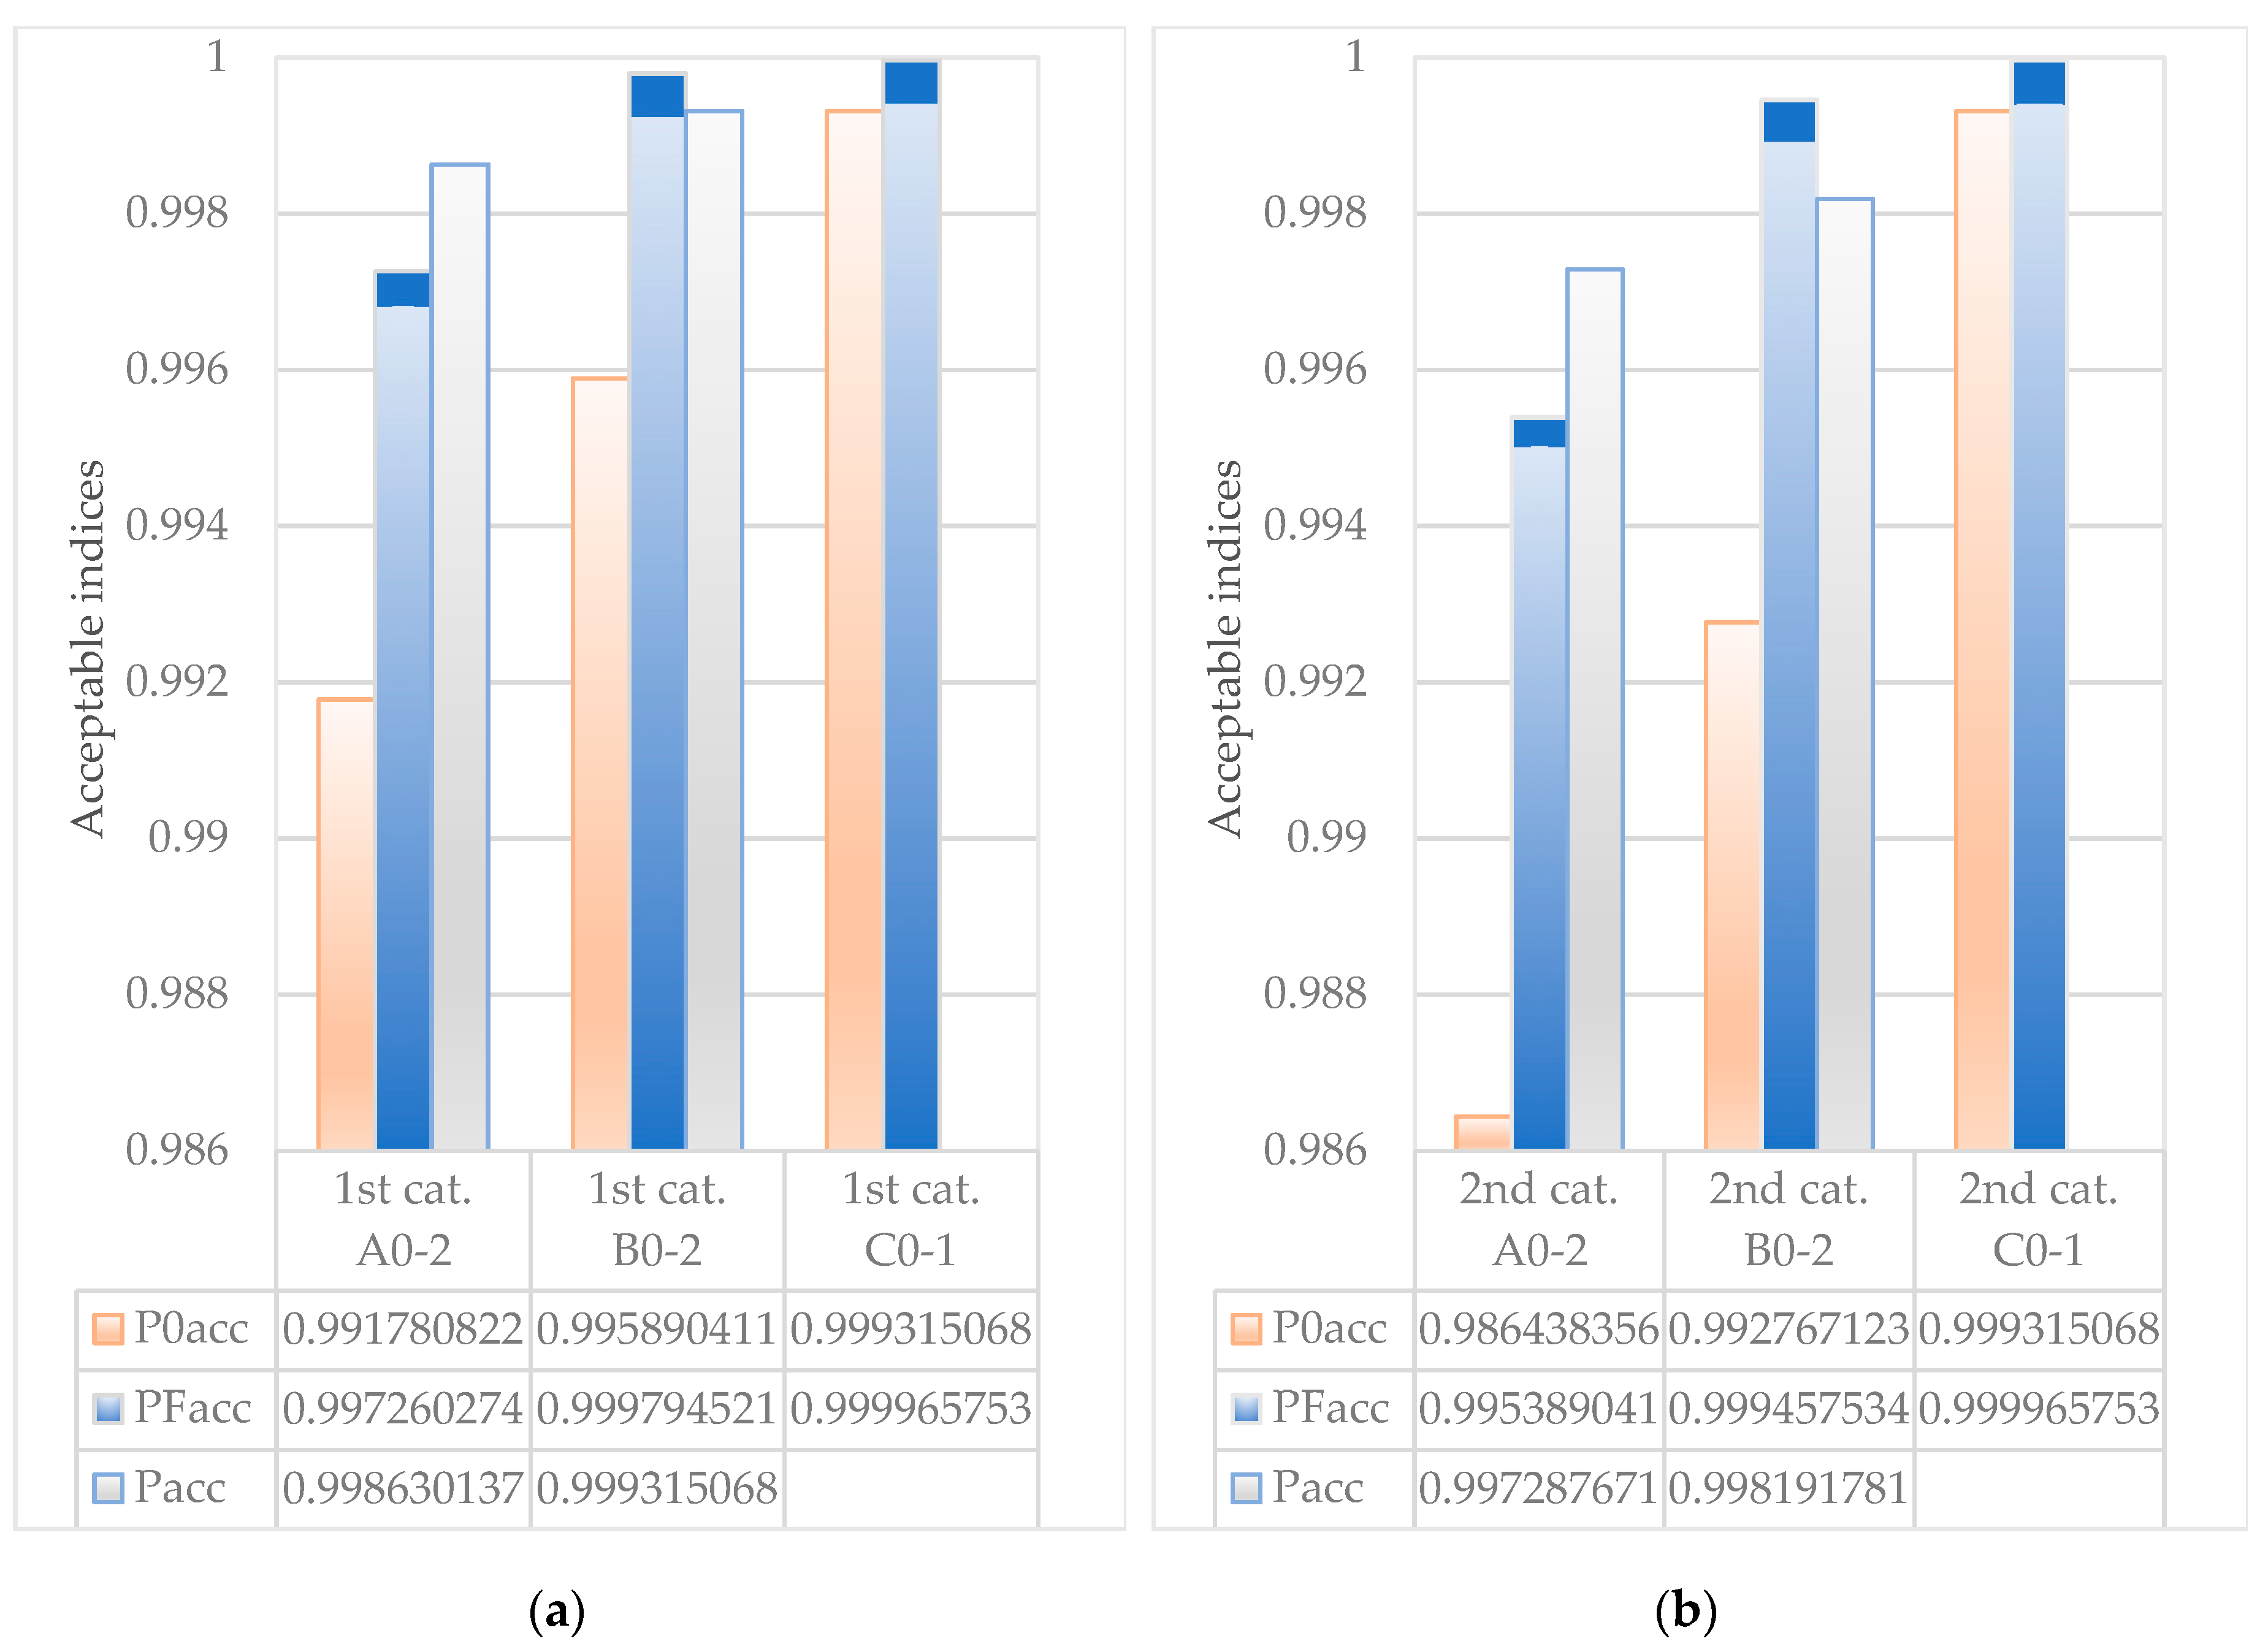
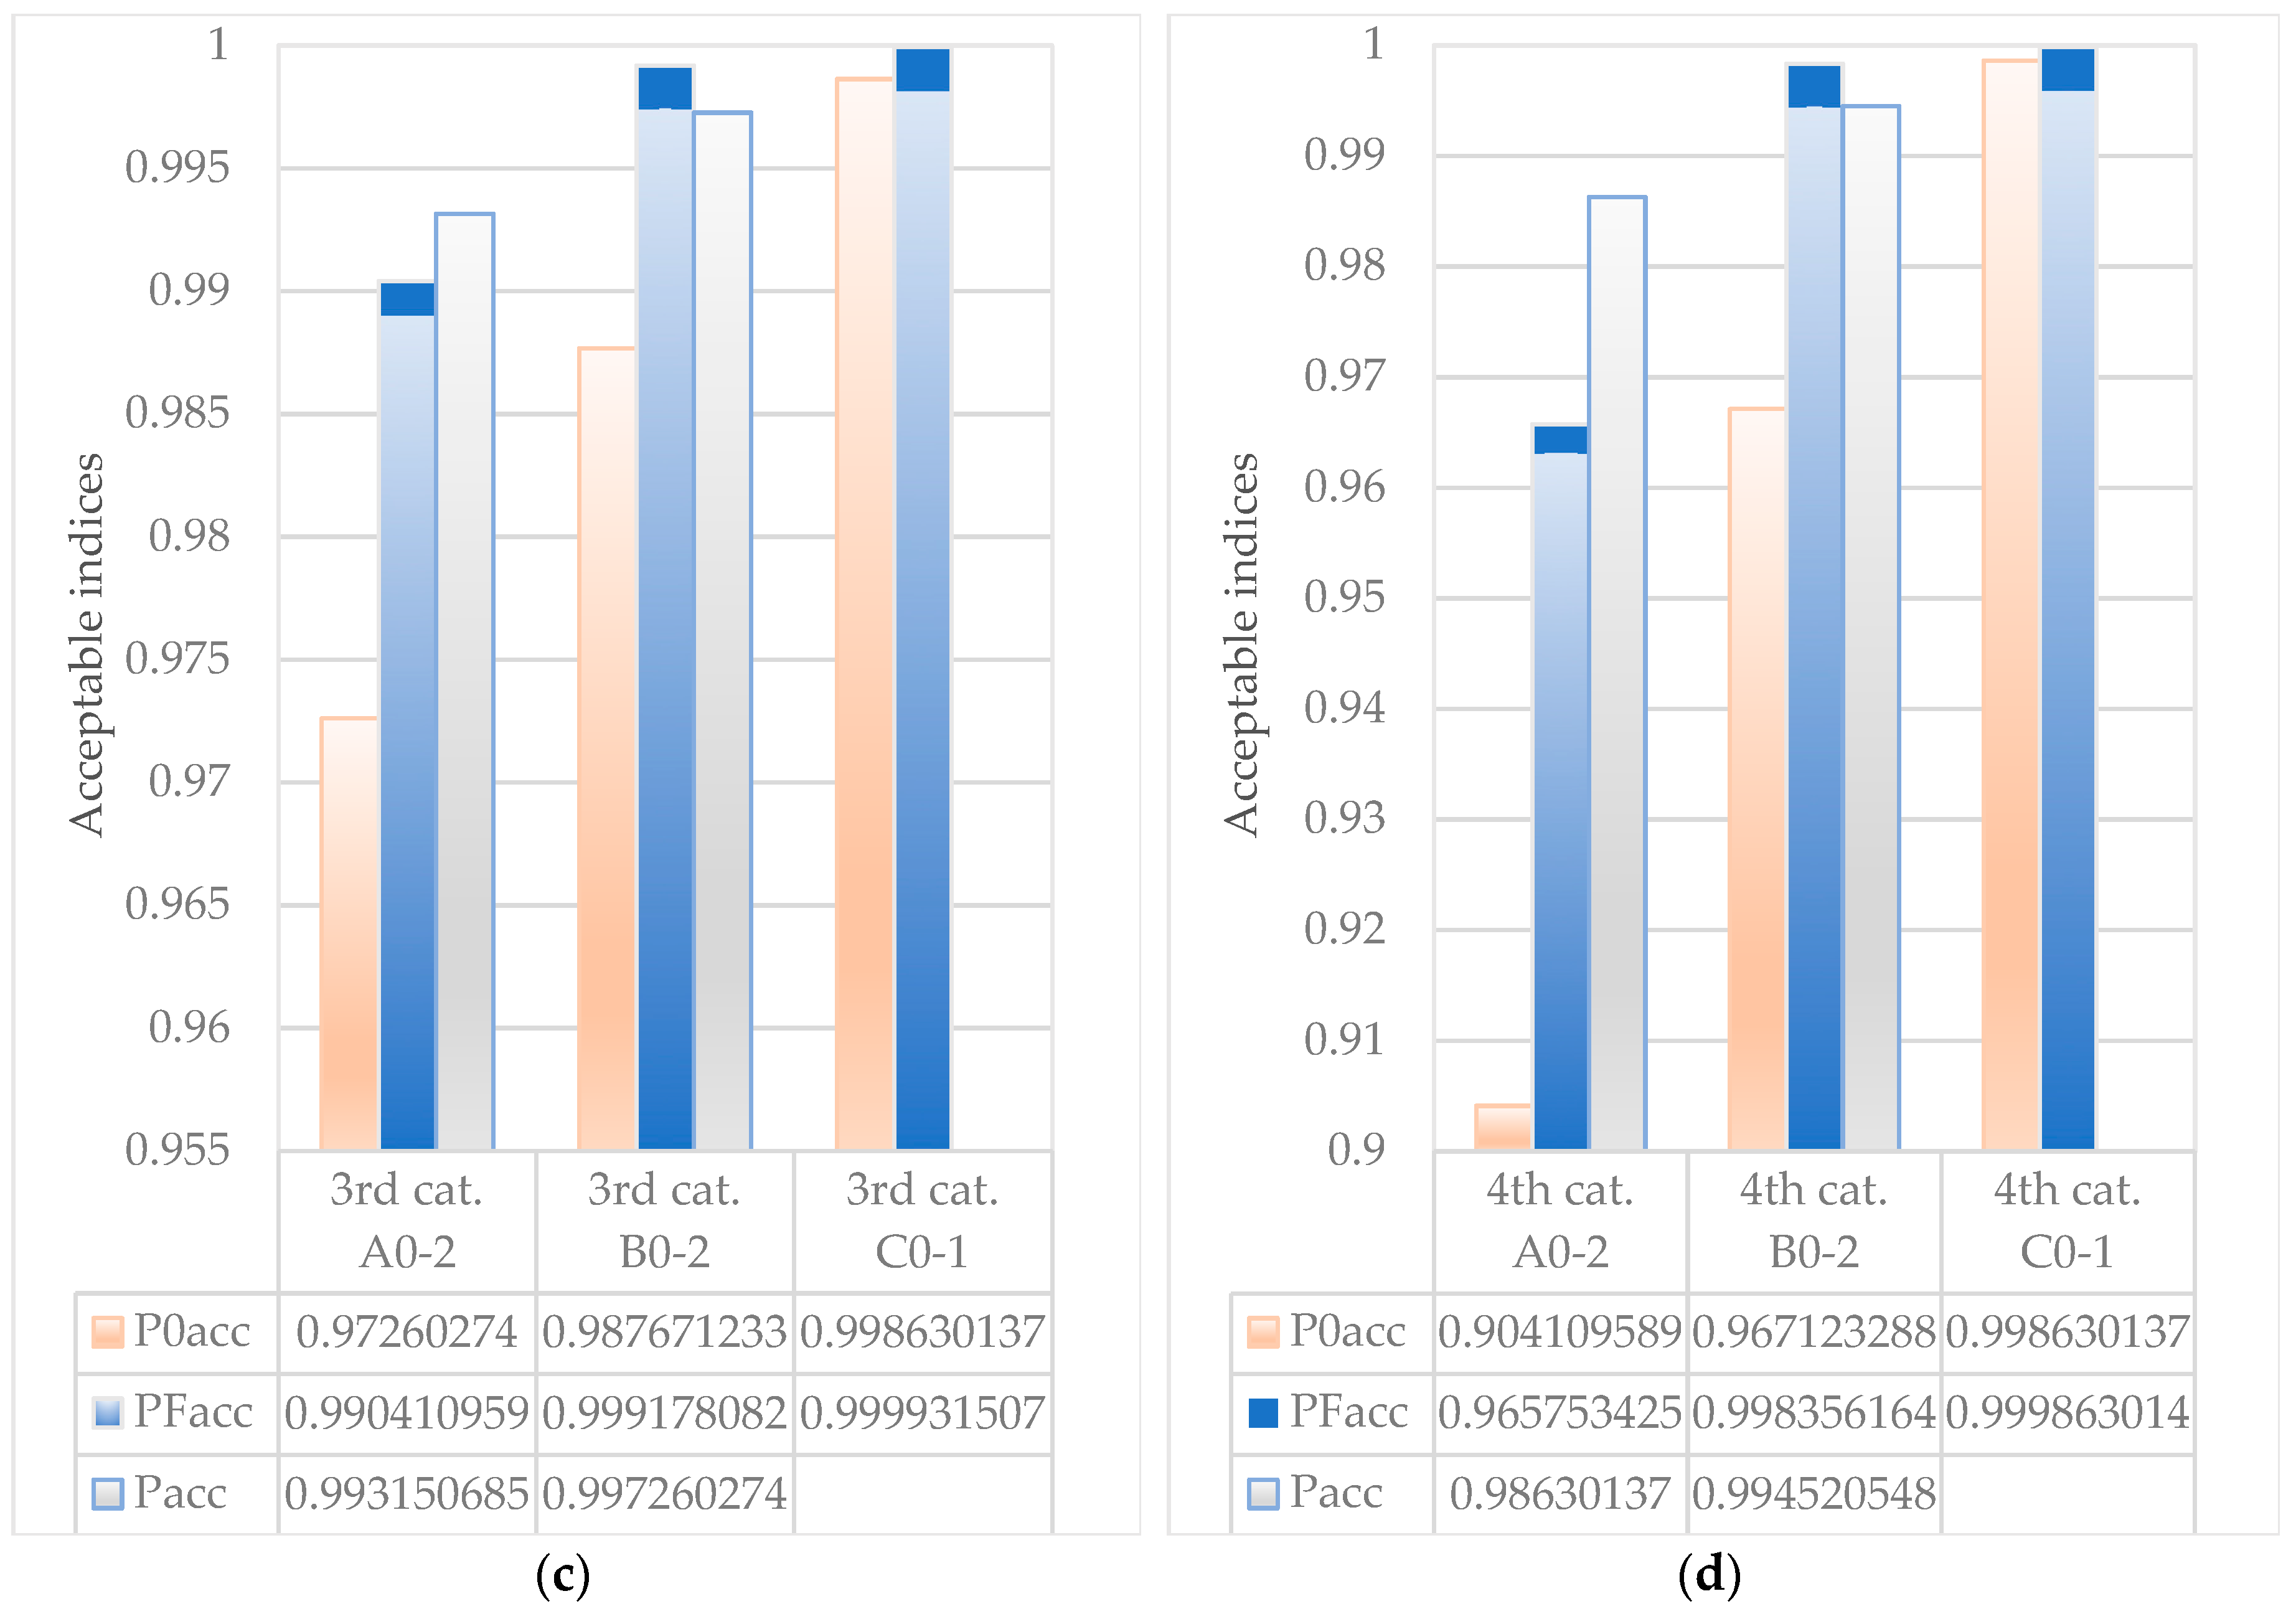
where IPF is the index of proper functioning of a WTP defined as the index of RI or P0, IPFacc is the acceptable value for the IPF (RIacc, P0acc, Pacc) (Figure 4).
The obtained results depend on the mentioned index the frequency of occurrence of periods in which threshold values can occur and the duration of the i-th period, in d.
The strictest criteria were proposed for the first category ‘C’ of water-supply systems of urban and industrial agglomerations of more than 500,000 inhabitants, where quality control in respect of water is carried out at least four times every 24 h, which is expressed by the obtained probabilities of acceptable indices associated with drinking water by:
- P0acc = 0.999315068,
- PFacc = 0.999965753.
The assumed acceptable indices associated with drinking water are identified with the non-occurrence of not particularly big losses associated with poor water quality in the water supply system or a lack of water supply.
If the inequality in (7) is not met, then the WTP is not in line with proposed values and should be modernised. An alternative solution would be to ensure that appropriate services capable of reacting quickly to exceedances of standard conditions. In such cases, these services would decide on the temporary exclusion of a WTP from operation. The important aspects are the costs associated with the improvement of technical and organizational solutions that should be analyzed taking into account the multi-criteria decision-making processes. The reduction of risk should entail the calculation of costs related to introducing changes eliminating threats and the benefits of improving the safety of the water supply system [12].
4. Conclusions and Perspectives
The implementation of the methodology and research for this article allowed to formulate the following conclusions:
- While recipients of water are today looking increasingly for continuity of both the supply and the quality of water, sources may unfortunately be exposed to contamination by various dangerous substances that are not always monitored. Determination of risk indices for drinking water that are then set against acceptable levels allows the functioning of a system to be assessed,
- The concept presented here in no way understates the validity of water-quality norms that seem justified given verification over many years of application. However, that does not change what is an expression of current trends that will probably be corrected as the whole problem grows,
- The presented methodology can be implemented in water safety plans and evaluate new strategies in the security management process of the water supply systems,
- The objective reality of the functioning of a WTP involves various undesirable events causing a deterioration in water quality (final product), and reducing the reliability of public water supply, to the point where the safety of consumers is sometimes affected significantly.
The future considerations due to different water supply systems will constitute the basis for the analysis of costs and risk control effects. As the lack of water supply or supply water with poor quality deal with costs, which are borne by both the producer and the water consumer. It is therefore necessary to determine the effectiveness of risk reduction taking into account the economic factor, which will constitute the basis for the further research. Risk reduction may take place at the level of a modernization project and prevention procedures, including solutions with reserved and active protection requiring intervention or operator supervision. The introduction of the proposed development in respect of existing normative conditions would seem likely to encourage resort to more flexible technologies and to the development of certain reserve capacity at WTPs. The most effective solutions in the sense of risk reduction should be implemented. It might also encourage more-effective and more-frequent checks on the quality of water, with a view to fuller assurance of proper conditions being achieved.
Author Contributions
All authors contributed to the development of this manuscript.
Funding
This research was funded by the Faculty of Civil and Environmental Engineering and Architecture, Rzeszow University of Technology, 35-959 Rzeszow, Poland.
Acknowledgments
We thank the reviewers for their feedback, what helped to improve the manuscript quality.
Conflicts of Interest
The authors declare no conflict of interest.
References
- Rak, J. A study of the qualitative methods for risk assessment in water supply systems. Environ. Prot. Eng. 2003, 29, 123–133. [Google Scholar]
- Eid, M. Modelling sequential events for risk, safety and maintenance assessments. J. Pol. Saf. Reliabil. Assoc. 2010, 1, 83–87. [Google Scholar]
- Tchorzewska-Cieslak, B. Estimating the acceptance of bearing the cost of the risks associated with the management of water supply system. Ochr. Sr. 2007, 29, 69–72. [Google Scholar]
- Rak, J.R. Methods of reliability index determination concerning municipal water quality. J. Konbin 2008, 5, 157–173. [Google Scholar] [CrossRef]
- Szpak, D.; Tchórzewska-Cieslak, B. Assessment of the failure rate of water supply system in terms of safety of critical infrastructure. Chemik 2014, 6, 862–867. [Google Scholar]
- Kwietniewski, M. Field reliability tests of water distribution system from the point of view of consumer’s needs. Civ. Eng. Environ. Syst. 2006, 23, 287–294. [Google Scholar] [CrossRef]
- Kwietniewski, M.; Roman, M. Reliability assessment of water supply systems. J. Water Supply Res. Technol. 1997, 46, 283–287. [Google Scholar]
- Sitzenfrei, R.; Zischg, J.; Sitzmann, M.; Bach, P.M. Impact of hybrid water supply on the centralised water system. Water 2018, 9, 855. [Google Scholar] [CrossRef]
- Rak, J.R. Some aspects of risk management in waterworks. Ochr. Sr. 2007, 29, 61–64. [Google Scholar]
- Rak, J.R.; Wloch, A. Models of level diversification assessment of water supply subsystem. Undergr. Infrastruct. Urban Areas 2015, 3, 237–244. [Google Scholar]
- Rak, J.; Tchórzewska-Cieślak, B. Review of matrix methods for risk assessment in water supply system. J. Konbin 2006, 1, 67–76. [Google Scholar]
- Tchórzewska-Cieślak, B. Bayesian Model of Urban Water Safety Management. Glob. Nest. J. 2011, 16, 667–675. [Google Scholar]
- Krolikowska, J. Damage evaluation of a town’s sewage system in southern poland by the preliminary hazard analysis method. Environ. Prot. Eng. 2011, 37, 131–142. [Google Scholar]
- Rak, J.; Boryczko, K. Assessment of water supply diversification using the Pielou index. Environ. Eng. 2017, 5, 53–58. Available online: https://books.google.pl/books?id=4H10DwAAQBAJ&pg=PA53&lpg=PA53&dq=Assessment+of+water+supply+diversification+using+the+Pielou+index&source=bl&ots=rUfm9Gc0bw&sig=ACfU3U1rLdZl_Oml3K0rzN3lJv2Dwh5D-g&hl=pl&sa=X&ved=2ahUKEwji87Lt5dTiAhVrmIsKHb-9BIwQ6AEwBnoECAkQAQ#v=onepage&q=Assessment%20of%20water%20supply%20diversification%20using%20the%20Pielou%20index&f=false (accessed on 3 June 2019).
- EN 15975-1. Security of Drinking Water Supply. Guidelines for Risk and Crisis Management. Part. 1 Crisis Management. Available online: https://infostore.saiglobal.com/preview/98705108051.pdf?sku=875255_SAIG_NSAI_NSAI_2080671 (accessed on 3 June 2019).
- EN 15975-2. Security of Drinking Water Supply. Guidelines for Risk and Crisis Management. Part. 2. Risk Management. Available online: https://circabc.europa.eu/webdav/CircaBC/env/Water%20Industries/Library/DRINKING%20WATER/C%20-%20Meetings%20and%20Workshops/1%20-%20Drinking%20Water%20Expert%20Group/2%20-%20Meetings%20of%20the%20Drinking%20Water%20Expert%20Group/05%20-%20Fifth%20Meeting%20of%20the%20Drinking%20Water%20Expert%20Group%20-%2022_01_2016/Presentations/Item%204%20EN%20150975-2%20Castell-Exner.pdf (accessed on 3 June 2019).
- World Health Organization. Guidelines for Drinking-Water Quality, 4th ed.; World Health Organization: Geneva, Switzerland, 2011. [Google Scholar]
- Estokova, A.; Ondrejka Harbulakova, V.; Luptakova, A.; Stevulova, N. Performance of fiber-cement boards in biogenic sulphate environment. Adv. Mater. Res. 2014, 897, 41–44. [Google Scholar] [CrossRef]
- Kowalski, D.; Kowalska, B.; Kwietniewski, M. Monitoring of water distribution system effectiveness using fractal geometry. Bull. Pol. Acad. Sci. 2015, 63, 155–161. [Google Scholar] [CrossRef] [Green Version]
- Kutyłowska, M. Prediction of failure frequency of water-pipe network in the selected city. Period. Polytech. Civ. Eng. 2017, 61, 548–553. [Google Scholar] [CrossRef]
- Ondrejka Harbulakova, V.; Estokova, A.; Stevulova, N.; Luptakova, A. Different aggressive media influence related to selected characteristics of concrete composites investigation. Int. J. Energy Environ. Eng. 2014, 5, 1–6. [Google Scholar] [CrossRef] [Green Version]
- Romano, E.; Guyennon, N.; Duro, A.; Giordano, R.; Petrangeli, A.B.; Portoghese, I.; Salerno, F.A. Stakeholder oriented modelling framework for the early detection of shortage in water supply systems. Water 2018, 10, 762. [Google Scholar] [CrossRef]
- Sapkota, M.; Arora, M.; Malano, H.; Sharma, A.; Moglia, M. Integrated evaluation of hybrid water supply systems using a promethee-gaia approach. Water 2018, 10, 610. [Google Scholar] [CrossRef]
- Shalamzari, M.J.; Zhang, W. Assessing water scarcity using the water poverty index in golestan province of Iran. Water 2018, 10, 1079. [Google Scholar] [CrossRef]
- Sun, X.; Zhang, H.; Zhong, M.; Wang, Z.; Liang, X.; Huang, T.; Huang, H. Analyses on the temporal and spatial characteristics of water quality in a seagoing river using multivariate statistical techniques: A case study in the duliujian river, China. Int. J. Environ. Res. Public Health 2019, 16, 1020. [Google Scholar] [CrossRef] [PubMed]
- Wang, J.; Tao, T.; Yan, H. Effects of sulfate, chloride, and bicarbonate on iron stability in a PVC–U drinking pipe. Int. J. Environ. Res. Public Health 2017, 14, 660. [Google Scholar] [CrossRef] [PubMed]
- Wang, X.L.; Wang, G.X.; Wu, Y.X.; Xu, Y.; Gao, H. Comprehensive assessment of regional water usage efficiency control based on game theory weight and a matter-element model. Water 2017, 9, 113. [Google Scholar] [CrossRef]
- Zheng, J.; Zhang, H.; Xing, Z. Re-examining regional total-factor water efficiency and its determinants in China: A parametric distance function approach. Water 2018, 10, 1286. [Google Scholar] [CrossRef]
- Zimoch, I. Pressure control as part of risk management for a water-pipe network in service. Ochr. Sr. 2012, 34, 57–62. [Google Scholar]
- Council Directive 2008/114/EC of 8 December 2008 on the Identification and Designation of European Critical Infrastructures and the Assessment of the Need to Improve Their Protection, OJ L 345. Available online: https://eur-lex.europa.eu/legal-content/EN/TXT/?uri=CELEX%3A32008L0114 (accessed on 3 June 2019).
- Hippe, Z.S.; Zamorska, J. A new approach to application of pattern recognition methods in analytical chemistry–II. Prediction of missing values in water pollution grid using modified KNN-method. Chem. Anal. 1999, 44, 597–602. [Google Scholar]
- Pietrucha-Urbanik, K.; Studziński, A. Case Study of Failure Simulation of Pipelines Conducted in Chosen Water Supply System. Eksploat. Niezawodn. 2017, 19, 317–323. [Google Scholar] [CrossRef]
- Zamorska, J.; Papciak, D. Activity of nitrifying biofilm in the process of water treatment in diatomite bed. Environ. Prot. Eng. 2008, 34, 37–52. [Google Scholar]
- Zimoch, I. Modeling of trihalomethane concentrations in tap water. Ochr. Sr. 2011, 33, 35–42. [Google Scholar]
- Council Directive 98/83/EC of 3 November 1998 on the quality of water intended for human consumption, with its latest amendments, OJ L 330, 5.12.1998. Available online: https://eur-lex.europa.eu/legal-content/EN/TXT/?uri=CELEX%3A31998L0083 (accessed on 3 June 2019).
- Krolikowska, J.; Krolikowski, A. Fees for a storm water discharge-needs and possibilities. Rocz. Ochr. Sr. 2013, 15, 1143–1152. [Google Scholar]
- Krolikowska, J.; Debowska, B.; Krolikowski, A. An evaluation of potential losses associated with the loss of vacuum sewerage system reliability. Environ. Eng. 2013, 4, 51–57. [Google Scholar]
- Kowalski, D.; Kowalska, B.; Kwietniewski, M. Localization method for water quality measuring points in water network monitoring system. Ochr. Sr. 2013, 35, 45–48. [Google Scholar]
- Rak, J. Safety of Water Supply System; Polish Academy of Science: Warsaw, Poland, 2009. [Google Scholar]
- Rak, J.R. Selected Aspects of the Safety of Water Supply Systems; Publishing House of Rzeszow University of Technology: Rzeszow, Poland, 2015. [Google Scholar]
- Zimoch, I.; Kotlarczyk, B.; Soltysik, A. Use of prehydrolyzed coagulants for the enhancement of water treatment efficiency in the czaniec water treatment plant. Ochr. Sr. 2007, 29, 45–49. [Google Scholar]
- Gaska, K.; Generowicz, A.; Zimoch, I.; Ciula, J.; Iwanicka, Z. A high-performance computing (HPC) based integrated multithreaded model predictive control (MPC) for water supply networks. Archit. Civ. Eng. Environ. 2017, 10, 141–151. [Google Scholar] [CrossRef]
- Han, S.; Koo, D.D.; Kim, Y.; Park, J. Gap analysis based decision support methodology to improve level of service of water services. Sustainability 2017, 9, 1578. [Google Scholar] [CrossRef]
- Piegdon, I.; Tchorzewska-Cieslak, B.; Szpak, D. The use of geographical information system in the analysis of risk of failure of water supply network. Environ. Eng. 2017, 5, 7–16. [Google Scholar]
- Szpak, D. Method of water consumers safety analysis and assessment. E3S Web of Conf. 2017, 17, 00092. Available online: https://www.e3s-conferences.org/articles/e3sconf/pdf/2017/05/e3sconf_eko2017_00092.pdf (accessed on 3 June 2019). [CrossRef]
Figure 1.
Values for probabilities associated with drinking water risks by WSS division into reliability categories for water supply, for different assumptions of probabilities—Pi0.
Figure 1.
Values for probabilities associated with drinking water risks by WSS division into reliability categories for water supply, for different assumptions of probabilities—Pi0.

Figure 2.
Values for probabilities associated with drinking water risks by WSS division into reliability categories for water supply, for different assumptions of probabilities—Pi1.
Figure 2.
Values for probabilities associated with drinking water risks by WSS division into reliability categories for water supply, for different assumptions of probabilities—Pi1.

Figure 3.
Values for probabilities associated with drinking water risks by WSS division into reliability categories for water supply, for different assumptions of probabilities—Pi2.
Figure 3.
Values for probabilities associated with drinking water risks by WSS division into reliability categories for water supply, for different assumptions of probabilities—Pi2.

Figure 4.
Acceptable indices associated with drinking water by WSS division into reliability categories for water supply. (a): 1st category; (b): 2nd category; (c): 3rd category; (d): 4th category.
Figure 4.
Acceptable indices associated with drinking water by WSS division into reliability categories for water supply. (a): 1st category; (b): 2nd category; (c): 3rd category; (d): 4th category.


Table 1.
Frequency of occurrence of water-quality states in line with the WSS division into reliability categories for water.
Table 1.
Frequency of occurrence of water-quality states in line with the WSS division into reliability categories for water.
| 1st Category | ||||||||
| Application Example | A | B | C | |||||
| 0 | 1 | 2 | 0 | 1 | 2 | 0 | 1 | |
| EI= 0 | 0 < EI ≤ 0.3 | 0.3 < EI ≤ 0.5 | EI= 0 | 0 < EI ≤ 0.1 | 0.1 < EI ≤ 0.3 | EI= 0 | 0 < EI ≤ 0.05 | |
| Fi, a−1 | - | 10 | 2 | - | 5 | 1 | - | 1 |
| Ti, d | - | 0.25 | 0.25 | - | 0.25 | 0.25 | - | 0.25 |
| EIi | EI0 | EI1 | EI2 | EI0 | EI1 | EI2 | EI0 | EI1 |
| 0 | 0.3 | 0.5 | 0 | 0.1 | 0.3 | 0 | 0.05 | |
| 2nd Category | ||||||||
| Application Example | A | B | C | |||||
| 0 | 1 | 2 | 0 | 1 | 2 | 0 | 1 | |
| EI = 0 | 0 < EI ≤ 0.3 | 0.3 < EI ≤ 0.5 | EI= 0 | 0 < EI ≤ 0.1 | 0.1 < EI ≤ 0.3 | EI= 0 | 0 < EI ≤ 0.05 | |
| Fi, a−1 | - | 12 | 3 | - | 6 | 2 | - | 1 |
| Ti, d | - | 0.33 | 0.33 | - | 0.33 | 0.33 | - | 0.25 |
| EIi | EI0 | EI1 | EI2 | EI0 | EI1 | EI2 | EI0 | EI1 |
| 0 | 0.3 | 0.5 | 0 | 0.1 | 0.3 | 0 | 0.05 | |
| 3rd Category | ||||||||
| Application Example | A | B | C | |||||
| 0 | 1 | 2 | 0 | 1 | 2 | 0 | 1 | |
| EI= 0 | 0 < EI ≤ 0.3 | 0.3 < EI ≤ 0.5 | EI= 0 | 0 < EI ≤ 0.1 | 0.1 < EI ≤ 0.3 | EI= 0 | 0 < EI ≤ 0.1 | |
| Fi, a−1 | - | 15 | 5 | - | 7 | 2 | - | 1 |
| Ti, d | - | 0.5 | 0.5 | - | 0.5 | 0.5 | - | 0.5 |
| EIi | EI0 | EI1 | EI2 | EI0 | EI1 | EI2 | EI0 | EI1 |
| 0 | 0.3 | 0.5 | 0 | 0.1 | 0.3 | 0 | 0.05 | |
| 4th Category | ||||||||
| Application Example | A | B | C | |||||
| 0 | 1 | 2 | 0 | 1 | 2 | 0 | 1 | |
| EI = 0 | 0 < EI ≤ 0.3 | 0.3 < EI ≤ 0.7 | EI= 0 | 0 < EI ≤ 0.1 | 0.1 < EI ≤ 0.3 | EI = 0 | 0 < EI ≤ 0.1 | |
| Fi, a−1 | - | 30 | 5 | - | 10 | 2 | - | 1 |
| Ti, d | - | 1 | 1 | - | 1 | 1 | - | 0.5 |
| EIi | EI0 | EI1 | EI2 | EI0 | EI1 | EI2 | EI0 | EI1 |
| 0 | 0.3 | 0.7 | 0 | 0.1 | 0.3 | 0 | 0.1 | |
© 2019 by the authors. Licensee MDPI, Basel, Switzerland. This article is an open access article distributed under the terms and conditions of the Creative Commons Attribution (CC BY) license (http://creativecommons.org/licenses/by/4.0/).
Share and Cite
MDPI and ACS Style
Rak, J.R.; Pietrucha-Urbanik, K. An Approach to Determine Risk Indices for Drinking Water–Study Investigation. Sustainability 2019, 11, 3189. https://0-doi-org.brum.beds.ac.uk/10.3390/su11113189
AMA Style
Rak JR, Pietrucha-Urbanik K. An Approach to Determine Risk Indices for Drinking Water–Study Investigation. Sustainability. 2019; 11(11):3189. https://0-doi-org.brum.beds.ac.uk/10.3390/su11113189
Chicago/Turabian StyleRak, Janusz R., and Katarzyna Pietrucha-Urbanik. 2019. "An Approach to Determine Risk Indices for Drinking Water–Study Investigation" Sustainability 11, no. 11: 3189. https://0-doi-org.brum.beds.ac.uk/10.3390/su11113189
Note that from the first issue of 2016, this journal uses article numbers instead of page numbers. See further details here.