Does Quality of Government Matter in Public Health?: Comparing the Role of Quality and Quantity of Government at the National Level

1
Department of Welfare Administration, School of Social Welfare, Seowon University, Musimseoro 377-3, Cheongju 28674, Korea
2
Department of Public Administration, Honam University, 417, Eodeung-daero, Gwangsan-gu, Gwangju 62399, Korea
*
Author to whom correspondence should be addressed.
Sustainability 2019, 11(11), 3229; https://0-doi-org.brum.beds.ac.uk/10.3390/su11113229
Submission received: 10 April 2019
/
Revised: 30 May 2019
/
Accepted: 31 May 2019
/
Published: 11 June 2019
Abstract
:This study aims to examine the degree of direct or indirect impact of quality and quantity of government on public health. It is a very important topic in that previous studies did not consider the role of government; they focused on the impact of national economic, social, and political factors on public health, therefore, disregarding the governmental factors. We measured the quantity of government by public expenditure on heath (i.e., rate of share of government budget to gross domestic product (GDP)) and the quality of government by five variables such as corruption control, government effectiveness, regulatory quality, voice and accountability, and rule of law. Based on national-level panel data (three waves) that covered 148–194 countries, we examined how quality and quantity of government has an impact on four kinds of public health, i.e., infant mortality, under-five mortality, maternal mortality, and life expectancy. Results show that both the quality and quantity of government had a significant impact on public health. In the quality of government, government effectiveness has a positive impact on life expectancy and a negative influence on infant deaths. Moreover, the quality of government has a greater impact on public health than the quantity of government. Lastly, the quality of government plays a role in moderating the relationships between quantity of government and the predicted variables.
1. Introduction
The purpose of this study is to verify, at national level, whether the quality and quantity of government affect public health. Many previous studies focused on political, economic, and social variables that influence people’s health status at the national level. The dominant research in public health is the study on the relationship between economic factors and health. It has focused on how economic factors have consistently influenced the public health. For example, after analyzing major determinants of life expectancy in the United States during the period 1960–2012, Ketenci and Murthy [1] showed that the level of real per capita income significantly enhances the level of life expectancy. Pritchett and Summers [2] explained that higher average incomes induce public investment in health infrastructure and sufficient expenditure on medicine, all of which contribute to protecting the public health. Sen [3] showed that the pattern of life expectancy increase is opposite to the expansion of gross domestic product per capita. This economic development could increase the input of resource for health.
Sustainable health state does not depend fully on the economic factors. Sustainable development is possible under social and environmental development. Therefore, in recent years, several studies have focused on non-economic factors such as inequality and education. Inequality has a negative effect on health [4]. After reviewing 168 articles from the literature on income inequality and population health, Wilkinson and Pickett [5] found that over 70% of the 168 analyses showed that health becomes worse in societies when income inequality is great. Moreover, education has been examined as a predictor for public health. For example, Rajan et al. [4] demonstrated that illiteracy is an important determinant of public health in India. Also, Meara et al. [6] examined the effect of educational disparities in mortality and life expectancy among non-Hispanic blacks and whites in the 1980s and 1990s, and they reported that, except black males, those with better education showed all recent gains in life expectancy at age 25.
However, previous studies have overlooked the role of government since they focus on social, economic, and political variables outside the government. Therefore, this study focuses on the role of the quality and quantity of government as well as traditional political economy variables. There is a growing interest in government variables that affect the public health. Such attention has led mainly to focus on government’s quantitative input on health and its effects. For example, Aísa et al. [7] found that public health expenditure plays a significant role in enhancing longevity whereas private has a lower impact on longevity. However, the effect of public health expenditure decreases as the size of the public health sector of GDP increases. Nixon and Ulmann [8] found that the increases in health care expenditure are significantly related to improvements in infant mortality but only marginally with life expectancy. Self and Grabowski [9] demonstrated that the greater public expenditure depends on the wealth of nation; in wealthier countries, the disability-adjusted health-expectancy is not a result of greater public health expenditures. In less developed countries, there are some effects of public involvement on improvement of healthcare. Moreover, Farag et al. [10] showed that health spending has a significant positive impact on infant and under-five child mortality.
In this study, we argue that, compared to other political and economic variables, the quantitative and qualitative roles of government directly or indirectly influence the public health. Therefore, the purpose of this study is to verify the impact of government ‘s quantitative and qualitative factors on public health. Specifically, the contribution of this study is as follows: First, it analyzed whether the quality and quantity of government, which were neglected in previous health studies, affects public health. Second, we compared the impact of social, economic, and political variables on public health with that of quality and quantity of government. Third, we examined how the quantitative aspect of government affects public health through the qualitative aspect.
This study consists of five sections, as follows. The next section examines the theoretical question of why government’s quality and quantity are important to health. Next, a literature review is conducted on the issues in the quality and quantity of government. The third section describes the data and measurements. The fourth is the analysis results, and the last section contains the result and its implication.
2. Theoretical Background
2.1. Why Are the Quality and Quantity of Government Important to Public Health?
There are several studies focusing on the relationship between the quality and quantity of government and public health. Quantitative aspects of the government influence public health. The impact of government appears not only in the government’s various activities and priorities in welfare policy, but also in the amount of spending on social and health expenditures. Based on cross-sectional regressions, Cevik and Taşar [11] showed that there is a robust strength of association between public health expenditures and the child and infant mortality rate at the national level. They found that (1) government health spending as a share of GDP and (2) government spending as a share of total health expenditures are negatively related to lower levels of under-5 mortality. Moreover, Gupta et al. [12] examined the relationship between public spending on healthcare and the health status of the poor by analyzing cross-country data. They reported that public spending on healthcare significantly affects the health of poor people. However, increased public spending alone will not fully explain all improvement in public health. This means that not only quantity of government, but also other factors contribute to better public health. Aísa and Pueyo [13] proposed a model of endogenous longevity that has a non-monotonic relationship between government spending on economic growth and longevity of its citizens. The effectiveness of publicly provided healthcare is the key element for increasing life expectancy. Based on the data collected from 175 world countries, Jaba et al. [14] analyzed the relationship between the dynamics of the inputs, i.e., healthcare expenditures per capita (in current US$), and the outputs of healthcare systems, i.e., life expectancy. They reported a significant relationship between health expenditures and life expectancy. Of course, the quantity of government is a critical factor to influence the public health. Makuta and O’Hare [15] pointed out that spending on health has long been viewed as a potential factor to complement the economic growth by improving health. Gupta et al. [16] showed that increased public expenditure on healthcare is related to the reduction of mortality rates for infants and children.
However, such quantitative side of government explained a partial portion of variance in public health. According to Filmer and Pritchett [17], public spending on health explains less than one-tenth of one percent of the observed differences in mortality across countries. Large variations in mortality rates can be explained by a country’s per capita income, the distribution of income, the extent of women’s education, the level of ethnic fragmentation, and the predominant religion. To understand the ineffectiveness of public spending on health, they found that the allocation of public spending, the net impact of additional public supply, and the efficacy of the public sector should be considered. Gupta et al. [16] showed that the relationship between healthcare spending and mortality rates is weak. According to Biadgilign et al. [18], there are no statistically significant relationships between public health spending and childhood undernutrition. Moreover, regarding the impact of the quantity of government, Bjørnskov et al. [19] showed that a larger government reduces quality of life.
Such limited explanation by the quantitative side of public spending demands highlighting another side of government, i.e., quality of governance. Why is quality of government important? Rothstein and Teorell [10] argued that democracy in the form of political equality on the input side must be complemented with impartiality on the output side of the political system (p. 170). The quality of government is a matter of exercising public authority with impartiality. Why might quality of government influence public health? Makuta and O’Hare [15] argued that the resource for public health is all about enhancing the public health: Efficient use of the available resources is necessary to secure the desired improvements in public health. In case of public sector, Yaqub et al. [20] explained that the improvement of quality of governance through reduced corruption and maladministration will contribute to bringing out efficient use of resources in the health sector. On the other hand, poor governance i.e., abusing citizens, failing to provide the equal protection under the law, or corrupting and mismanaging resources, infrastructure, or the economy, can deteriorate the public health [21]. Israr and Islam [22] demonstrated that good governance characterized by transparency, accountability, and meaningful community participation plays the critical role in the sustainability of donor-funded health system projects in Pakistan.
On the causality between quality of government and public health, Bloom and Canning [23] argues that a high level of quality in government will lead to more economic growth, and this economic growth will lead to better food, housing, safe drinking water, and sanitation, finally improving the accessibility of the labor force, alleviating harsh working conditions, and reducing the poverty of the people. Therefore, a causal relationship can be deduced in which the quality of government promotes citizen’s health. Moreover, Gupta et al. [16] analyzed the impact on the perception of corruption in public services on the public health service. They showed that reducing corruption, i.e., a key component of the government’s quality concept, can have significant social benefits in reducing child and infant mortality rates.
The effect of public health spending can be enhanced by good governance [10]. Rajkumar and Swaroop [24] demonstrated that public spending has an impact on governance; a 1% increase in the share of public health spending in gross domestic product (GDP) reduces under-five mortality rate by 0.32% in countries with good governance, by 0.20% in countries with average governance, and has no impact in countries with weak governance. Also, Rajkumar and Swaroop [24] showed empirically that the efficacy of public spending on health can be largely influenced by the quality of governance: Public health spending lowers child mortality rates more in countries with good governance. Existing research shows that the quality and quantity of government critically affects public health. However, previous studies did not analyze the relationship between quality and quantity. In this study, we compare the explanatory power of the quality and quantity of government and analyze how the quality of government moderates the effect of quantity of government on public health.
2.2. Literature Review: What Are Theoretical Issues in the Quality and Quantity of Government?
Studies on the quality of government have been carried out in three theoretical perspectives. First, it concerns the conceptualization of the quality and quantity of government. Second, it concerns the scope and type of quality of the government. Third, it is about the direct or indirect role of government quality in the causal mechanism.
First, concerning conceptualization of quality of government, conclusive and acceptable definition of the concept of quality of government has not been found yet. La Porta et al. [25] approached the quality of government in terms of economic performance. When they constitute “good government”, they use the term “good” to stand for good for economic development. However, such definition narrowly based on economic performance does not capture the abstract conceptual dimensions of quality of government. Rothstein and Teorell [26] pointed out that some problems may be identified with existing definitions of quality of government: Either they are extremely broad, suffer from a functionalist slant, or they deal only with corruption.
To conceptualize the complex concepts of quality of government, Kaufmann et al. [27] suggested six components for good governance in terms of measurement; voice and accountability, political stability and absence of violence, government effectiveness, regulatory quality, rule of law and control of corruption. Based on Kaufmann et al. [28], we proposed five components for quality of government; control of corruption, government effectiveness, regulatory quality, voice and accountability, and rule of law. Since quality of government has an extensive range of meanings, it is reasonable to set up several conceptual components representing the quality of government. In the same vein, after Agnafors [29] referred to quality of government as a desired character of the exercise of public authority, he proposed six components (public ethos, good decision making, principle of beneficence, the rule of law, efficiency, and stability) to capture this abstract and broad conceptual dimension. Those six components have the range from threshold and surplus attributes to meter the degree of quality of government. Choi et al. [30] defined the quality of government as the degree to which the government possesses the attributes that make it not only ready and able to complete its mission, but also actively contribute to achieving it. In addition, they posited that the quality of government depends on its value, structure, and behavior, and verified the role of those three constructs through empirical analysis. Rothstein and Teorell [26] described the quality of government as based on norms of impartiality in exercising public authority.
In this study, we define the quality of government as impartiality, which is considered to be the main principle when governments enforce policies and deliver the public service.
Compared to complex discussion about the quality of government, the quantitative side of government is reduced to the public expenditure, which generally means the ratio of government spending on public health to total GDP. Gupta et al. [16], Biadgilign et al. [18], and Rajkumar and Swaroop [24] used the spending on public health as a proxy for quantity of government. Similarly, our study adopted the public expenditure as proxy for quantity of government.
Second, there has been a theoretical effort to expand the scope of quality of government, develop the type of it, and test the role of developed type of it. Biadgilign et al. [18] showed that good governance in Ethiopia plays a significant role in reducing childhood undernutrition; government effectiveness, regulatory quality, and control of corruption were associated with stunting and underweight. Lin et al. [31] examined whether or not six dimensions of governance (perceptions of voice and accountability, political stability and absence of violence, government effectiveness, regulatory quality, rule of law, and control of corruption) have an impact on infant mortality. Rajkumar and Swaroop [24] examined the role of governance by ways of the level of corruption and the quality of bureaucracy. Makuta and O’Hare [15] demonstrated that an improvement in the quality of government increases the overall impact of public spending on health on infant mortality. Gupta et al. [16] found that countries with high corruption have high child and infant mortality rates. Farag et al. [10] used government effectiveness, one of six dimensions of the worldwide governance indicators (WGI) developed by the World Bank, to examine the association between health expenditures, health outcomes, and the role of good governance.
We conceptualized the quality of government by introducing five variables such as corruption control, government effectiveness, regulatory quality, voice and accountability, and rule of law.
Third, quality of government has not only a direct, but also indirect impact on public health. Evans [32] critically commented that the relationship between the quality of the government and the public health, which is mediated by economic growth, cannot be determined because there is large variation in infant mortality rates and average life expectancies across countries with the same economic level. When discussing health, some studies have focused on the relationship between the quality of government and social capital [33]. Lindstrom and Mohseni [34] and Schultz et al. [35] showed that the quality of government is positively related to social capital, which in turn has a positive effect on health. Scholz and Lubell [36] argued that the high quality of government increases the effectiveness of government spending on health by enabling the efficient allocation of resources, thereby increasing the overall health of the population. Wilkinson and Picket [5] argued that there is a significant relationship between equality and wellbeing. Inequality in society deteriorates not only the state of mental and physical health and shortens life expectancy, but also affects the mental health of the public. Since the qualitative role of government generally puts pressure on reducing inequality in society, it can be a factor to influence the public health.
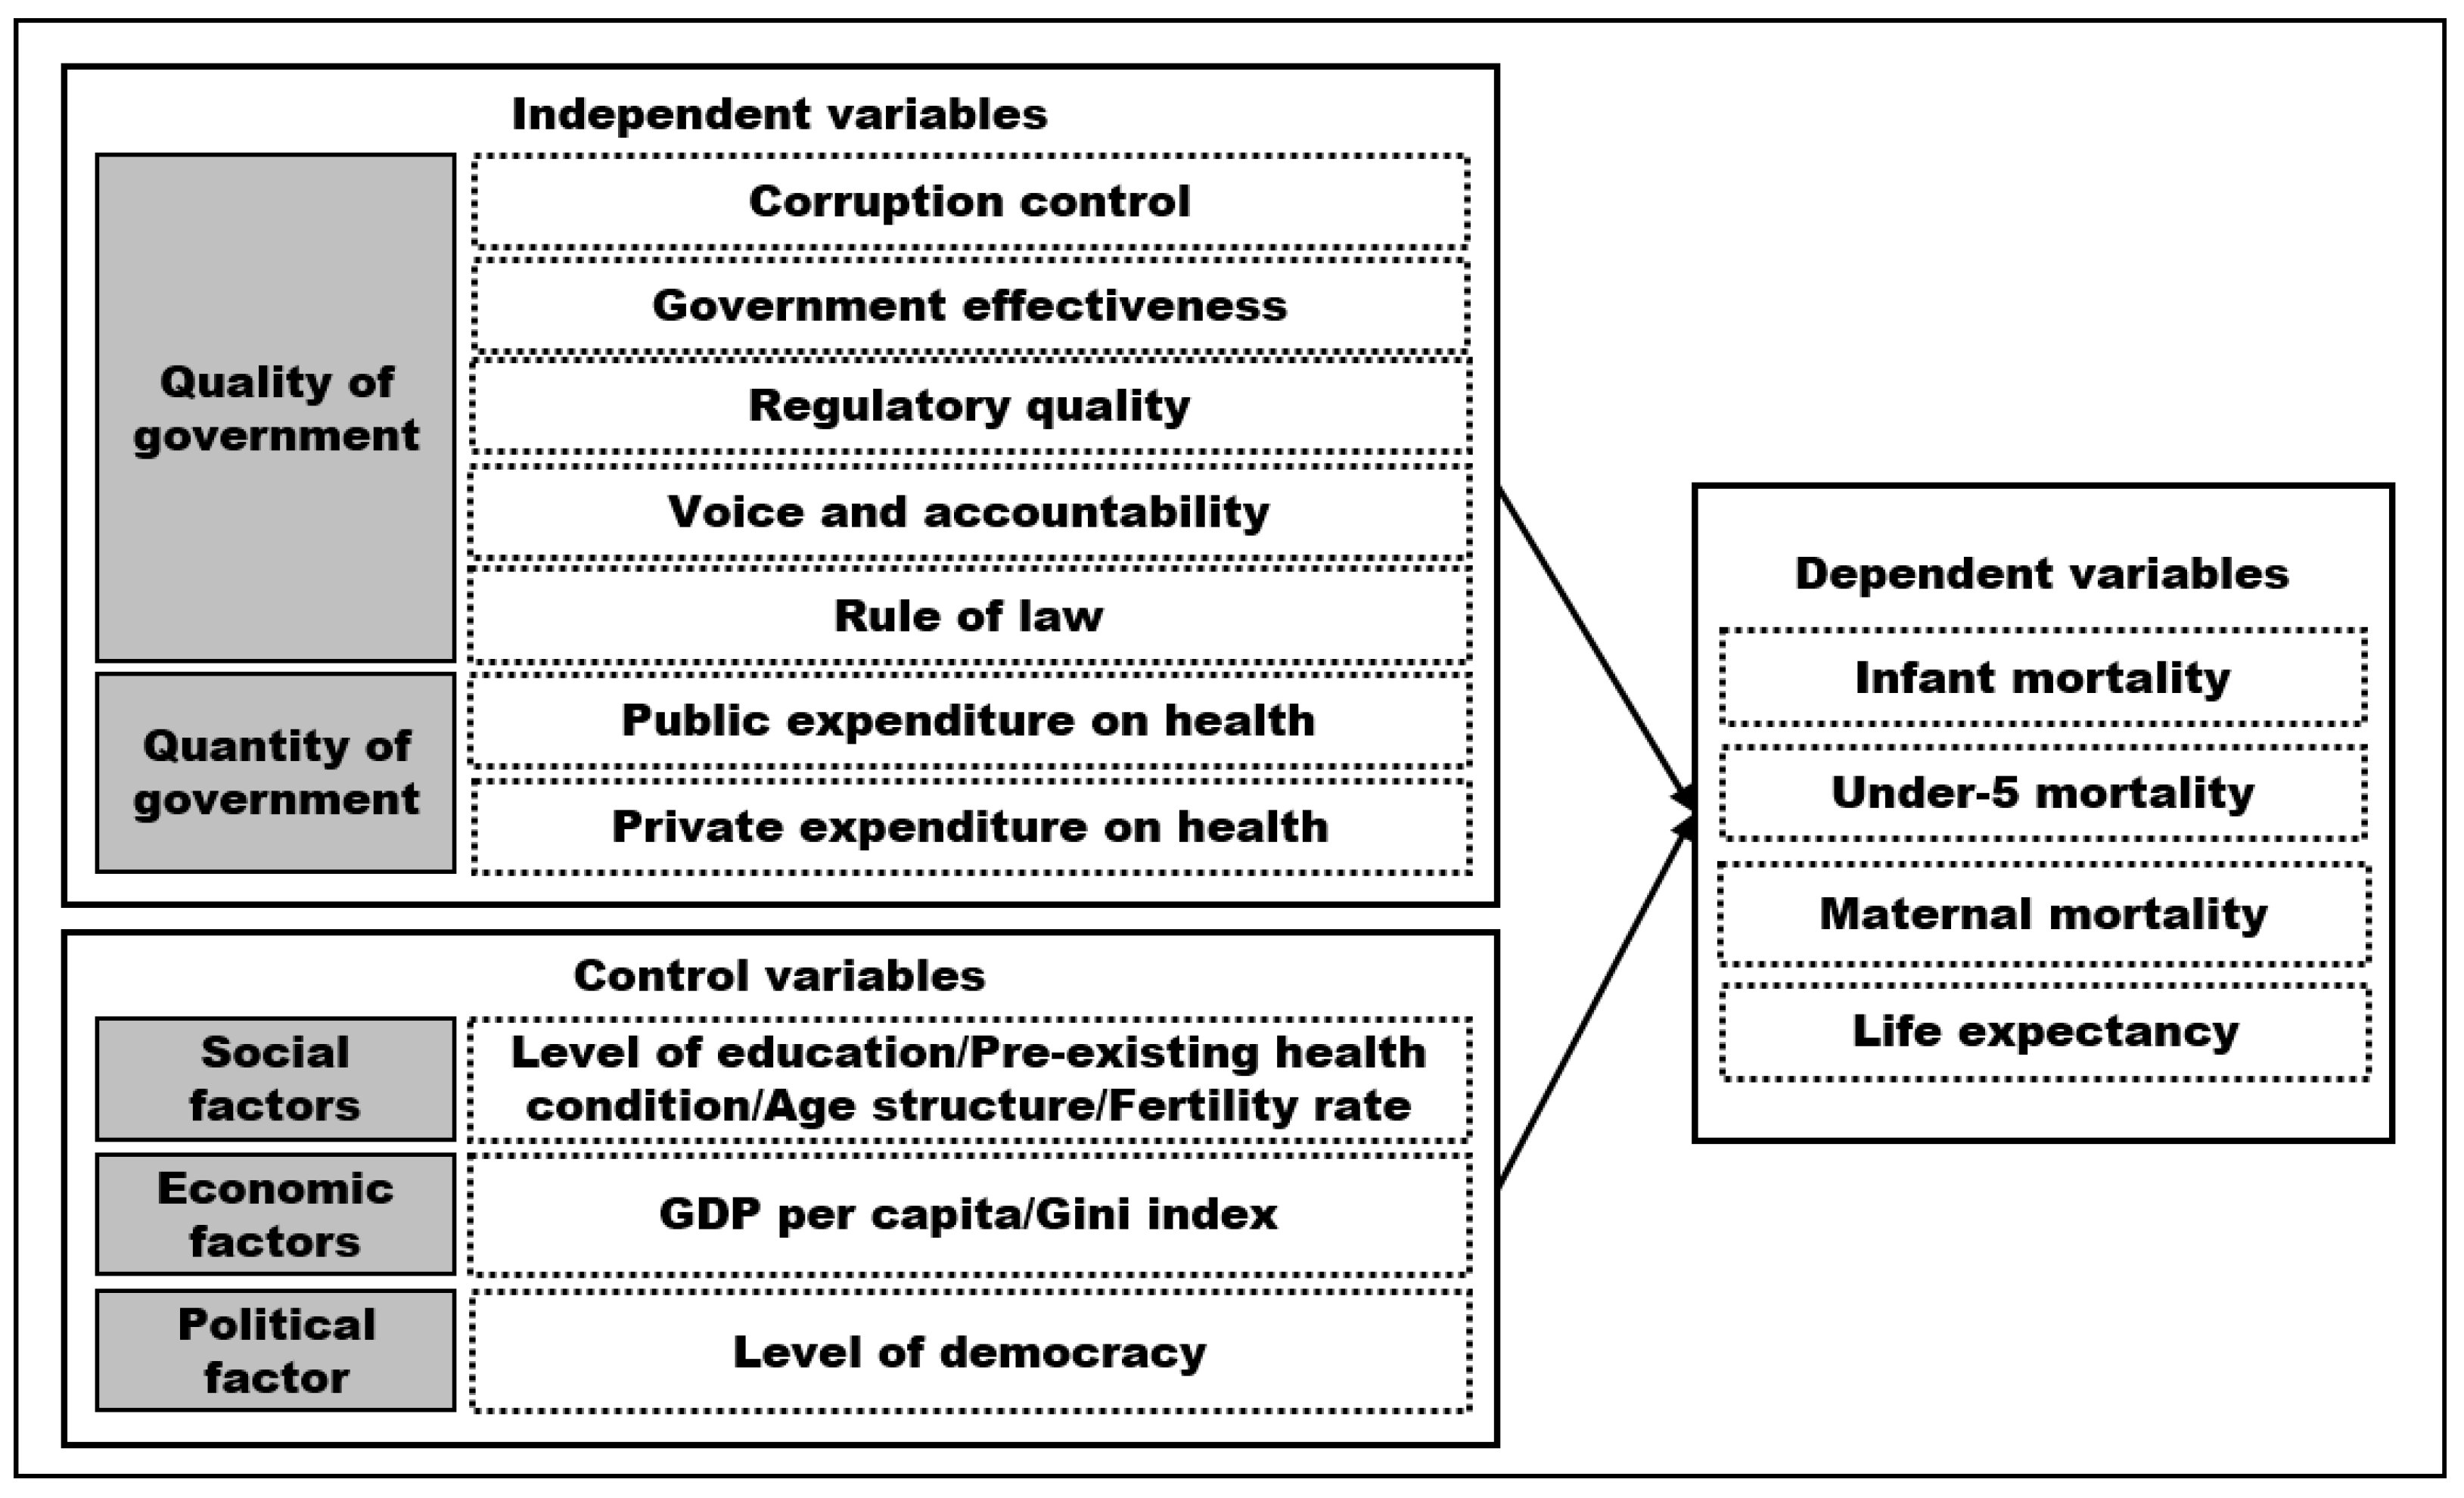
We propose the following research framework. First, after we divide the government factors into the quality and quantity of government, we compare them in terms of their impact on public health. To know the relative explanatory power of the quality and quantity of government, we set up political, economic, and social factors as control variables. Second, to understand more specifically the impact of different quality of government on public health, we adopt five kinds of qualities of government: Control of corruption, government effectiveness, regulatory quality, and rule of law. Third, to specify the role of the quality of government, this study examines the indirect moderating effect of quality of government on the relationship between the quantity of government and public health. The research model based on the quality of government, the quantity of government, and the control variables is shown in the following Figure 1.
3. Data and Measure
3.1. Dependent Variables
3.1.1. Theoretical Base for Measures
The dependent variable in this study is the level of public health in a given country. To measure the public health, Gupta et al. [16] used child mortality as an indicator. Filmer and Pritchett [17] measured public health by using infant mortality as an indicator in a study that analyzed the impact of public spending on health. This variable was used by Anyanwu and Erhijakpor [37], Bokhari et al. [38], Gupta et al. [39], and Novignon et al. [40]. On the other hand, many studies that have examined the role of government in public health have used life expectancy as an indicator for public health [41,42,43]. This study adopted, as the dependent variable, both mortality rate and life expectancy to represent the public health at the national level. Specific measures are as follows.
3.1.2. Infant Mortality Rate (per 1000 Live Births)
Infant mortality rate is the number of infants dying before reaching one year of age, per 1000 live births in a given year. The source of the data is the World Bank, and the period is from 2013 to 2015.
3.1.3. Under-Five Mortality Rate (per 1000 Live Births)
Under-five mortality rate is the probability per 1000 that a newborn baby dies before reaching age five. The source of the data is the World Bank, and the period is from 2013 to 2015.
3.1.4. Maternal Mortality Ratio (Modeled Estimate, per 100,000 Live Births)
Maternal mortality ratio is the number of women who die from pregnancy-related causes while they are pregnant or within 42 days of pregnancy termination per 100,000 live births. The source of the data is the World Bank, and the period is from 2013 to 2015.
3.1.5. Life Expectancy at Birth
Life expectancy at birth is the average number of years that a newborn could expect to live, if he or she were to pass through life exposed to the sex- and age-specific death rates prevailing at the time of his or her birth, for a specific year, in a given country, territory, or geographic area. The source of the data is the World Health Organization (WHO), and the period is from 2013 to 2015.
3.2. Independent Variables
3.2.1. Quality of Government
The independent variable in this study is the quality and quantity of government. As the data for the proxy for the quality of government, many studies used the worldwide governance indicators (WGI) provided by the World Bank [25,41,42,43,44]. WGI includes six sub indicators. Kaufmann et al. [43] defined six sub indicators as follows (Table 1).
Among the six sub indicators, political stability and absence of violence/terrorism is not a direct measure of government quality, but rather an indicator of the political condition in the country. Therefore, in this study, we use five sub indicators to measure the quality of government, except for ‘political stability and absence of violence/terrorism variables’. Political stability is used as a control variable for political conditions. All indicators covered years from 2012 to 2014. All indicators of quality of government have a value of −2.5 to 2.5; the higher the score, the higher the quality of government.
3.2.2. Quantity of Government
Quantity of government is measured by public expenditure on health. It means the ratio of public expenditure on health to GDP. Public health expenditure consists of recurrent and capital spending from government (central and local) budgets, external borrowings and grants (including donations from international agencies and nongovernmental organizations), and social (or compulsory) health insurance funds [44]. The source of the data is the World Bank, and the period is from 2012 to 2014.
In this study, we include public expenditure on health and private expenditure on health as a measure of the quantity of government as like Self and Grabowski [9] and Asia et al. [7]. Private expenditure on health includes direct household (out-of-pocket) spending, private insurance, charitable donations, and direct service payments by private corporations. [44] This indicator is an indirect measure of the quantitative aspects of government because the increase in ratio of private expenditure on health in total expenditure on health means a decrease in ratio of public expenditure on health. Indicators for quantity of government covered years from 2012 to 2014.
3.3. Control Variables
3.3.1. Education
In relation to the level of education, after Cutler et al. [6] analyzed the difference in mortality and life expectancy for non-Hispanic blacks and whites in the 1980s and 1990s, they found that the difference in life expectancy was due to the educational gap. Ketenci and Murthy [1] also suggested that level of educational attainment is the most important factor in life expectancy. Moreover, Grossman [45], Rosen and Taubman [46], and Elo and Preston [47] emphasized the importance of education to public health. Education-level data utilizes mean years of schooling provided by human development indicators (UNDP) [48].
3.3.2. Pre-Existing Health Condition
Self and Grabowski [9] assumed that public health condition shows consistent pattern. They emphasized the importance of pre-existing health conditions, claiming that public health status in the past affects current public health status. They used the life expectancy data to measure pre-existing health conditions, where countries’ data on life expectancy were fully aggregated. We used the data provided in 1961–1963. It is the oldest data for life expectancy, which are provided by the world development indicators [49].
3.3.3. The Proportion of Population over 65 Years and Fertility Rate
The proportion of the population over 65 years and fertility rate are included in control variables. In population structure, the proportion of people over 65 years and fertility rate affect life expectancy. Data on the proportion of people aged 65 and over are calculated by using the ratio of ages 65 and over to the total population. Data on the proportion of people over 65 years were provided by human development indicators of UNDP [49]. We used data of fertility rate, provided by World Bank. Two indicators for social condition covered three years (2012–2014).
3.3.4. GDP per Capita and GINI Index
Economic condition variables include GDP per capita and GINI index, which means the degree of income inequality. Ketenci and Murthy [1] showed GDP per capita with level of educational attainment as variables affecting life expectancy. This result implies that the size of GDP per capita, which indicates the level of economic development, can affect the public health. Likewise, Cornia and Mwabu [50], Lopes [51], and Musgrove [52] included GDP as a variable affecting health status. However, Gleditsch [24] reported there is little or no influence by GDP per capita.
The Gini index is the degree of economic inequality. De Vogli et al. [53] showed that income inequality affects life expectancy. Studies by Mayer and Sarin [54] and Drabo [55] verify that income inequality affects health status, such as child mortality. However, a study by Hu et al. [56] showed that income inequality in European countries does not have an independent impact on mortality. The impact of income inequality on health status is not consistent. We used both GDP per capita and the GINI index, provided by World Bank [49] (world development indicators) with a period from 2012 to 2014.
3.3.5. Democracy
We include political condition in control variables. Bollyky et al. [57] analyzed how experience about democracy is related to adult’s health and mortality. Based on panel data covering 36 years, they show that experience of democracy is positively related to mortality decline. After analyzing the influence of political factors on the public health, Safaei [58] reported that democracy has an indirect positive effect on the public health. Similarly, after criticizing that existing studies about national health focused mainly on social and economic factors whereas the influence of political environment was overlooked, Ruger [59] showed the significant relationships between political institutions and health. The democracy level as control variable is provided by Freedom House and covers from 2012 to 2014 years. The scale of democracy ranges from 0–10, where 0 is the least democratic and 10 is the most democratic.
Next, Table 2 shows the variable list and basic descriptive statistics in dependent, independent, and control variables.
4. Analysis and Findings
4.1. Anova-Test
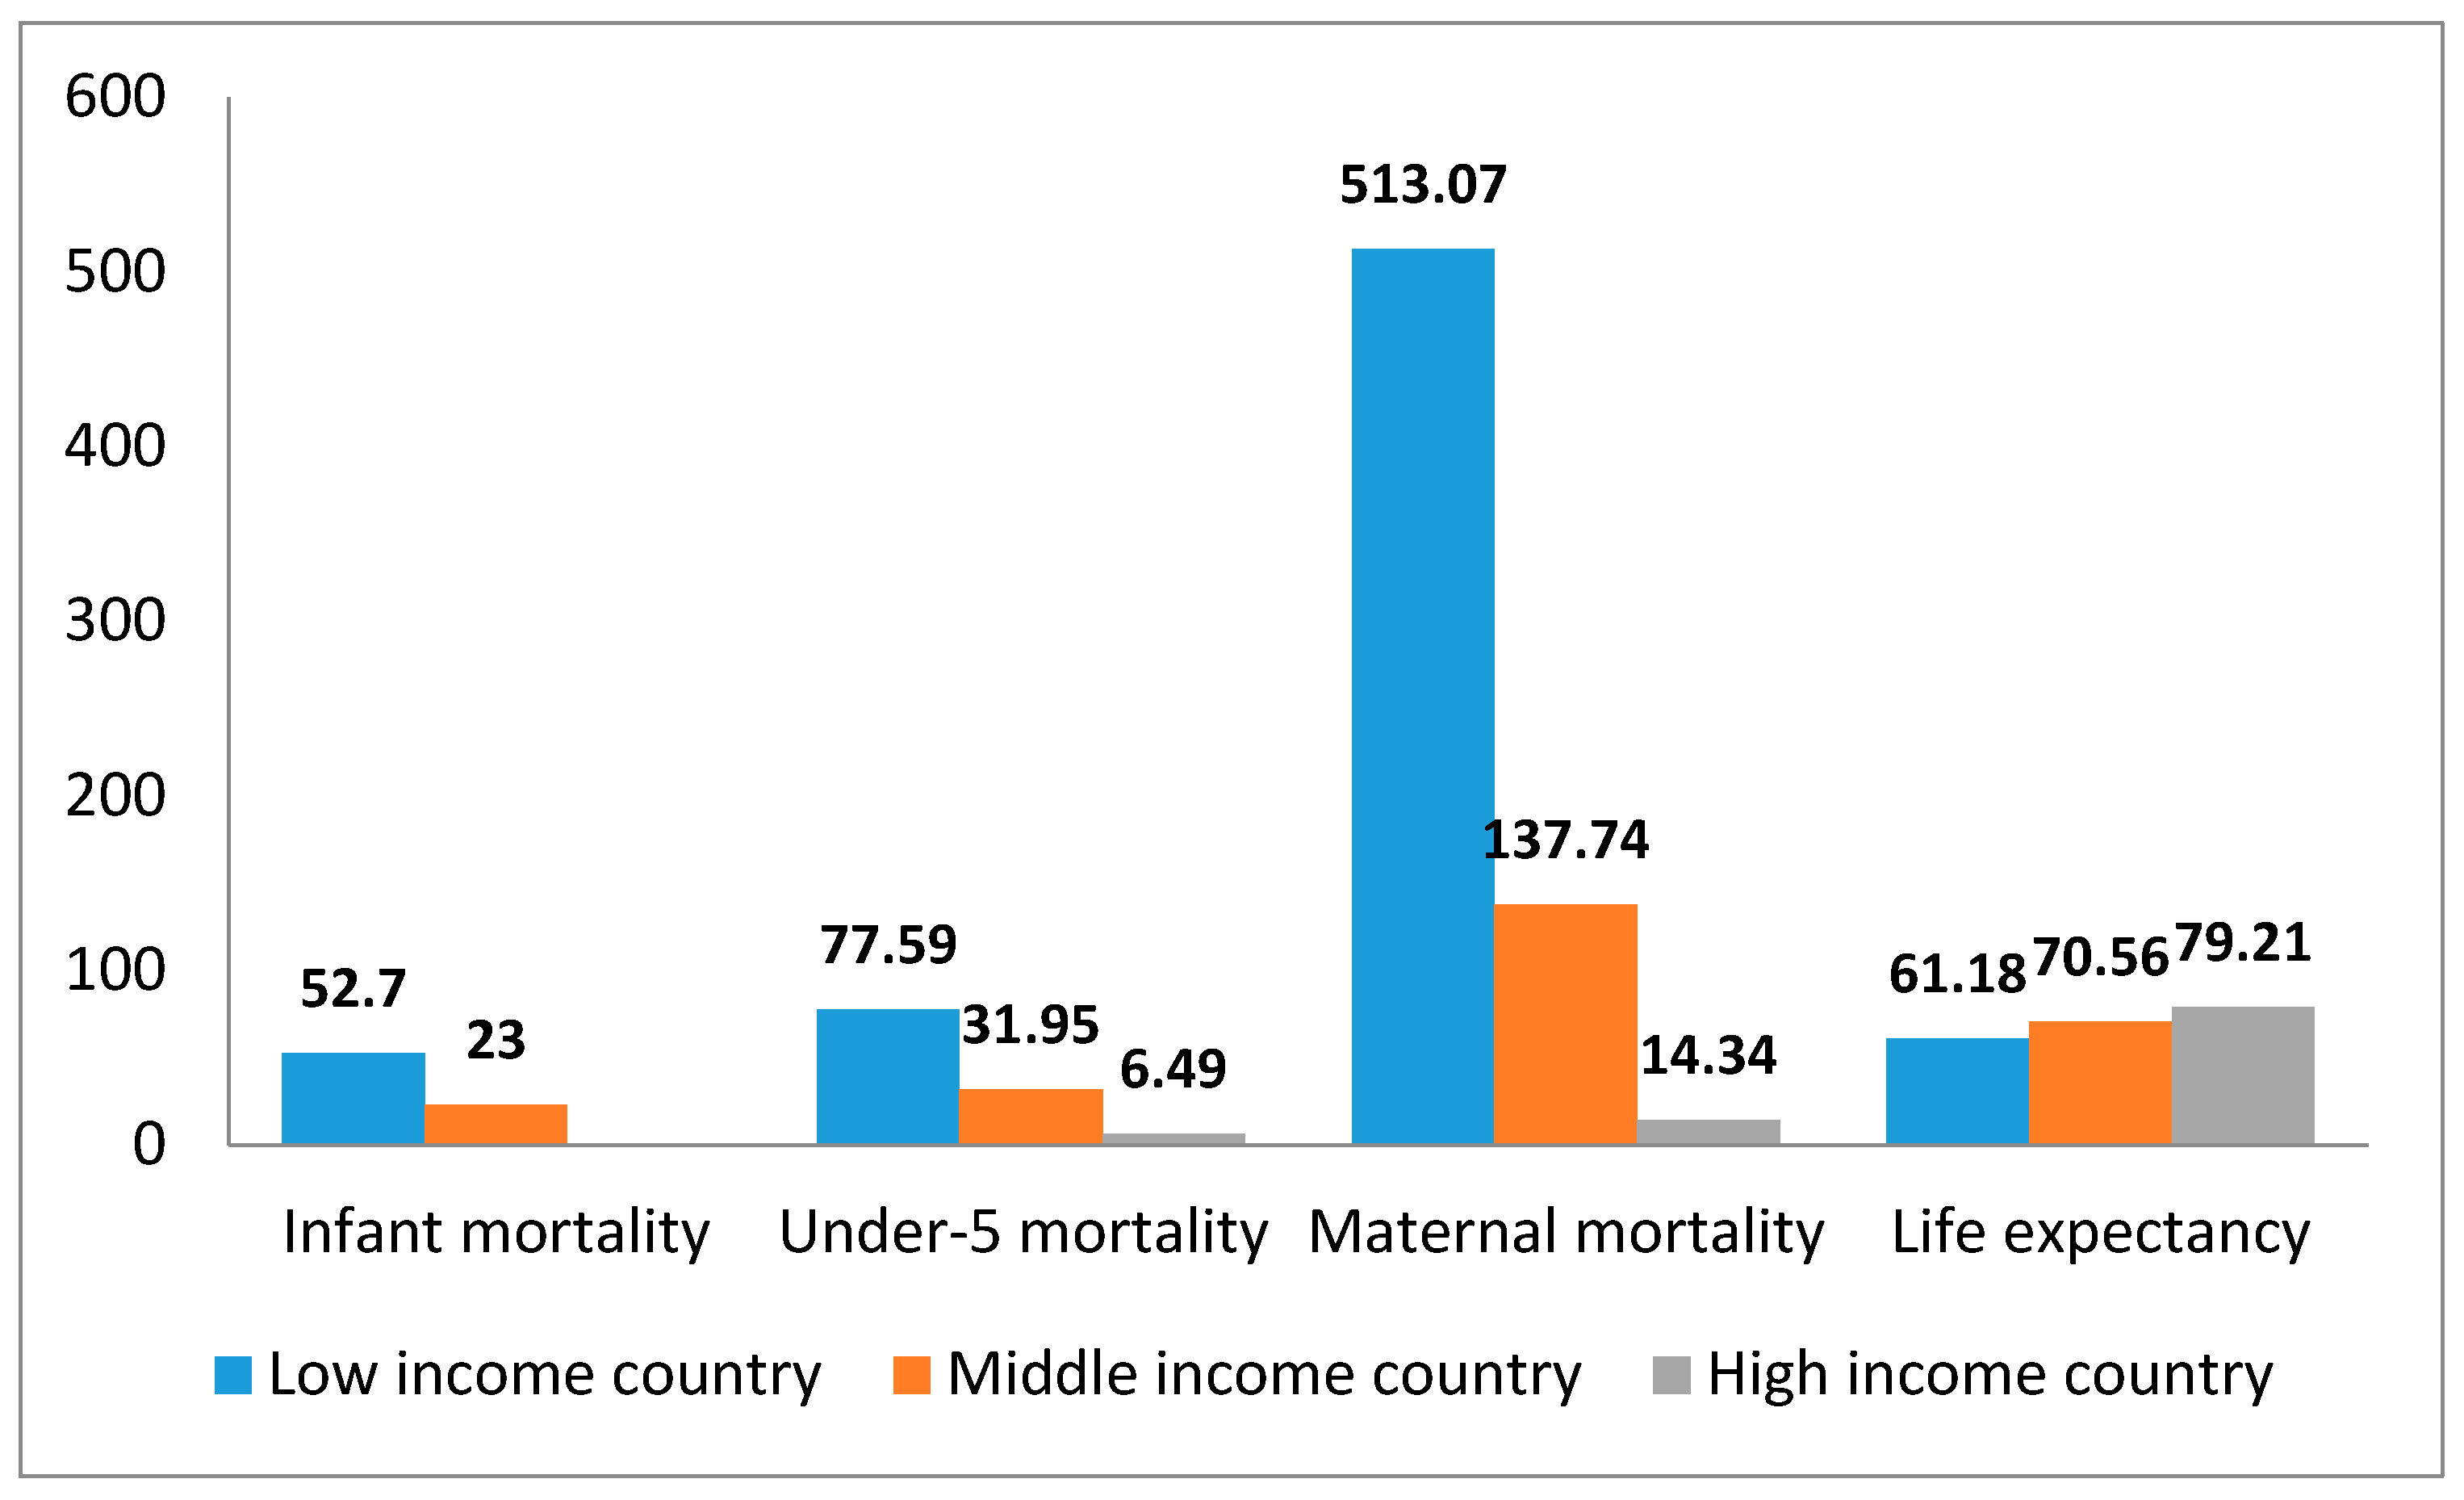
We compared the mean differences in four dependent variables among three country groups, dividing the target countries into high-income, middle-income, and low-income countries by applying the criteria of World Health Organization and World Bank. Figure 2 shows the mean differences among the three country groups for the four sub-variables that measure the level of public health. The difference in four variables between three groups is statistically significant at the 5% significance level. The higher the economic level of all indicators, the lower the three deaths and the higher the average life expectancy. Especially, in the case of maternal mortality, the difference among the three country groups according to the level of economic development is very large.
4.2. Correlation
We executed the correlation analysis to know the relationships between variables. Table 3 shows the simple correlation coefficients between variables. Almost all coefficient values were statistically significant at significance level of 0.01. A very high correlation between the four public health variables suggests that there are close relationships among health-related variables. The four variables that constitute government quality are highly correlated with public health. When comparing two health variables, the quality of government has a greater correlation with life expectancy than with the other three mortality variables. This suggests that the effect on the quality of government may vary depending on which types of public health type it is. In addition, among five government quality indicators, the government effectiveness is highly correlated with public health, followed by rule of law and regulation quality. Voice and accountability, on the other hand, was less associated with public health than other types of governmental quality were. Those findings suggest that there may be differences in public health impacts according to types of quality of government.
Public and private expenditure on health, which represents the quantitative aspect of the government, show both positive and negative relationship with public health. Public health expenditure has a positive relationship with life expectancy but has a negative relationship with other mortality variables. On the other hand, private expenditure on health shows the opposite impact. It has a positive relationship with life expectancy and a negative relationship with other mortality variables. In short, spending in the public sector is positive for public health, but spending in the private sector may not be positive for public health. This implies that the quantity of public sides takes the critical role in bringing out the good results in the public health. The significant role of public domain is confirmed by fact that the correlation coefficient shows that public spending on health has a stronger relationship with public health than private sector spending.
The relationship between variables other than government’s factors and public health are as follows. In relation to the social condition, mean years of schooling, which reflects education level of country, has a negative relationship with mortality and a positive relationship with life expectancy. This result suggests that the higher the level of education in the country, the higher level of public health. Next, life expectancy and mortality were found to be significantly related to life expectancy in 60′s, which is the pre-existing health condition proposed by Self and Grabowski [9]. This demonstrated that the better the pre-existing public health condition, the better the present health states. The fertility rate is positively related to infant mortality, while it has a negative relationship with life expectancy. These results suggest that the higher the birth rate, the higher the likelihood of infant death, and consequently, results in a decrease in life expectancy. Lastly, in the population structure, the higher the percentage of elderly people aged 65 or older, the lower the number of mortality and the higher the life expectancy. This implied that the high percentage of elderly population represents the better statue of health. In addition, aging and fertility rates were found to be inversely related to public health. The birth rate per woman is positively related to mortality, while it has a negative relationship with life expectancy. These results suggest that the higher the birth rate, the higher the likelihood of infant or maternal mortality and, finally, the higher the decrease in life expectancy. In addition, the aging and fertility rates have opposite relationships with the national health.
In economic condition, per capita GDP has a negative relationship with mortality and a positive relationship with life expectancy. The latter has a higher correlation with the GDP than the former does. On the basis of the fact that the coefficient of GDP per capita with public health is low, compared with the quality of government, not only can national economic power be important for public health, but also the capability of government in operating this economic resource. The GINI index, which indicates the level of economic equality, has a negative relationship with life expectancy, among public health indicators but a positive relationship with mortality. This result suggests that the higher the level of income inequality, the worse the public health.
Lastly, as a political context, the level of democracy has a significant relationship with health variables. It has a negative relationship with infant mortality, whereas it has a positive relationship with life expectancy. These results mean that the higher level of democracy, the better public health.
In short, generally the correlation analysis notified that the qualitative factors of the government are more strongly related to the public health than the quantitative factors and other political, economic, and social variables.
4.3. Causal Analysis
4.3.1. Model Testing and Selection
In order to analyze the impact of the quality and quantity of government quality on the public health, we conducted a causal analysis by using the panel regression model. To diagnose and test the suitability of the panel regression model, we completed the following steps. First, in case of Model 1, in which infant mortality was set up as a dependent variable, to select one of the OLS and fixed-effect models, we check the significance of F-test in fixed effect model. As a result, F-value is significant at 5% significance level (F (145, 274) = 583.08, Prob > F = 0.000)), so the fixed effect model is selected as a more suitable model.
Second, to verify the suitability of the OLS or random-effect models, we performed the test of Breusch–Pagan Lagrange multiplier (LM). The random-effect model is appropriate when the Chi2 value is significant within 5% significance level [60]. The results of the data analysis showed that the Chi2 value is significant at 5% significance level (Chi2 (01) = 418.78, Prob > Chi2 = 0.000). This result means that the random-effect model was more suitable for analysis method than OLS. Third, the Hausman test shows the fitness of the fixed effect or the random effect model, the Chi2 value is significant at 5% significance level (Chi2 (14) = 45.59, Prob > Chi2 = 0.000). The fixed-effect model proved to be more suitable than the random-effect model.
To choose the appropriate panel regression model of Model 2 (life expectancy), 3 (under-five mortality rate), and 4 (maternal mortality rate), we executed the same procedure as used in Model 1. The results confirmed that the fixed-effect model was the more suitable than all other models.
On the other hand, to check the autocorrelation and heteroscedasticity problems in the fixed-effects model, we run the Wooldridge test and the modified Wald test. The Wooldridge test showed that there was a problem of autocorrelation in Models 1, 3, and 4 but not in Model 2. The modified Wald test showed that there were heteroscedasticity problems in four models. In order to improve the problem of autocorrelation and heteroscedasticity in those models, we apply Newey–West standard errors regression model in this study. We have to generate estimates of the standard errors that are robust to both autocorrelation and heteroscedasticity. We used the computing method that was often termed autocorrelation and heteroscedasticity consistent standard errors developed by Newey and West, referred to as Newey–West standard errors [61]. Table 4 shows the results of the regression analysis by applying the Newey–West standard error in the four models.
4.3.2. Findings 1: Mortality
In the case of infant mortality (Model 1), the government effectiveness has a negative impact on infant mortality. Among the five variables of government quality, government effectiveness had a significant effect on the infant mortality. It reduced infant mortality. However, other variables of government quality did not have a statistically significant effect. On the other hand, the increase in public expenditure on health, which represents the quantity of government, lowered infant mortality rates. However, private spending led to infant mortality. These results suggest that the role of the public sector is more significant than the private one.
In the control variables, except for education level, all variables had significant impacts on infant mortality. Life expectancy in the 1960s, which is a pre-condition of health, negatively influenced the infant mortality. The better the health of the population during some time in the past, the lower the number of child deaths was. In addition, the per capita income level had a negative impact on the number of child deaths. The larger the per capita income, the lower the number of child deaths. These results show that the higher the level of economic development, the lower the number of child deaths. Among control variables, birth rate, elderly population ratio, and income inequality had positive effects on the number of child deaths. The higher the birth rate, the elderly population rate, and the income inequality, the higher the number of child deaths.
Based on the coefficient, fertility rate had the highest explanatory power, followed by government effectiveness, GDP per capita, and private and public expenditure on health. It is worth noting that the quality of government plays a more important role than the quantity of government.
Model 3 shows the determinants structure similar to results in Model 1, except the democracy variable. The higher the democracy, the lower the mortality rate under the age of five.
In Model 4, government effectiveness and public expenditure did not have a significant impact on maternal mortality, whereas regulation quality had a positive impact on maternal mortality. This implies that strong rules have a negative impact on public health.
4.3.3. Findings 2: Life Expectancy
In the case of life expectancy, like infant mortality, only government effectiveness in quality variables shows statistical significance. Other variables of government quality do not have a statistically significant effect on life expectancy.
In relation to quantity of government, public spending on health was significant at the 5% significance level, and private expending on health at the 10% significance level. Public spending on health had a positive impact on life expectancy. However, private spending did not contribute to the life expectancy.
Among the control variables, all control variables had an impact on the life expectancy. Mean years of schooling, which reflects education level, had a negative impact on life expectancy. This result is in contrast with findings that showed the positive effect of education on the public health [47,48,49,50]. Fertility rate, age 65 and older, and GINI index also had a negative impact on life expectancy. However, life expectancy in the 1960s and GDP per capita had positive impacts on the dependent variable. Past health status and level of economic development are influential positive factors on public health.
Based on the coefficient, government effectiveness is the highest in explaining the variance of life expectancy, followed by fertility rate, GDP per capita, public spending on health, and age 65 and older. Based on these results, we conclude that the quality of government has a decisive impact on life expectancy. However, such influence depends on the type of quality of government. Only the effectiveness of government increases the life expectancy of the public. In addition, it implies that the quality of government is more important than the quantity of government.
4.3.4. Findings 3: Model Comparison
When comparing Model 1 and Model 2, the independent variables’ impact direction on public health is similar. Both the quality and quantity of government affect public health. The quality of government had a decisive impact on the overall public health: Government effectiveness was the most important factor to promote the health of the people, except maternal mortality. According to Rothstein [34], the effectiveness of government increases the efficiency of resource distribution and enhances the overall level of public health due to the effective use of budget for promoting the public health.
Furthermore, this result implies that the multidimensional factors of quality of government should be considered for the sake of the improvement of public health. On the other hand, in relation to the quantitative aspect of the government, it suggested that the public expenditure on public health contributes to promoting overall public health, while private expenditure is does not have a positive impact. In other words, it means that the expenditure for public health can be effective, when it is mobilized through the government or the public sector.
This study shows that among control variables, economic and social factors on public health are important. The health status in the past has a significant influence in the present time. This suggested that the present level of public health would have a significant impact on the health level of future generations. Education year and GDP per capital have positive impacts on public health whereas GINI index has a negative impact. This study proves that ‘the wealthier, the healthier’. This study supports Self and Grabowski’s [9] hypothesis and result, in which health has consistent attributes.
Those findings imply that in order to improve the public health at the national level, the government needs to promote economic development, to input the investment into education, to reduce the economic inequality, and to make the democracy work better.
4.4. Moderation Analysis
In this study, to clarify the role of quality of government, we analyzed quality of government as moderator between quantity of government, i.e., public expenditure on health, and public health. To do this, variables in the quality and quantity of government were used to construct the interaction terms, and we analyzed their statistical significance. We followed the moderation method and procedure designed by Baron and Kenny [62]. As a result of the analysis, one interaction term was statistically significant when the dependent variable was life expectancy, and five were significant in the case of infant mortality. The moderating functions performed by quality of government appear in simple slope diagrams, as shown in Figure 3, Figure 4, Figure 5, Figure 6, Figure 7 and Figure 8.
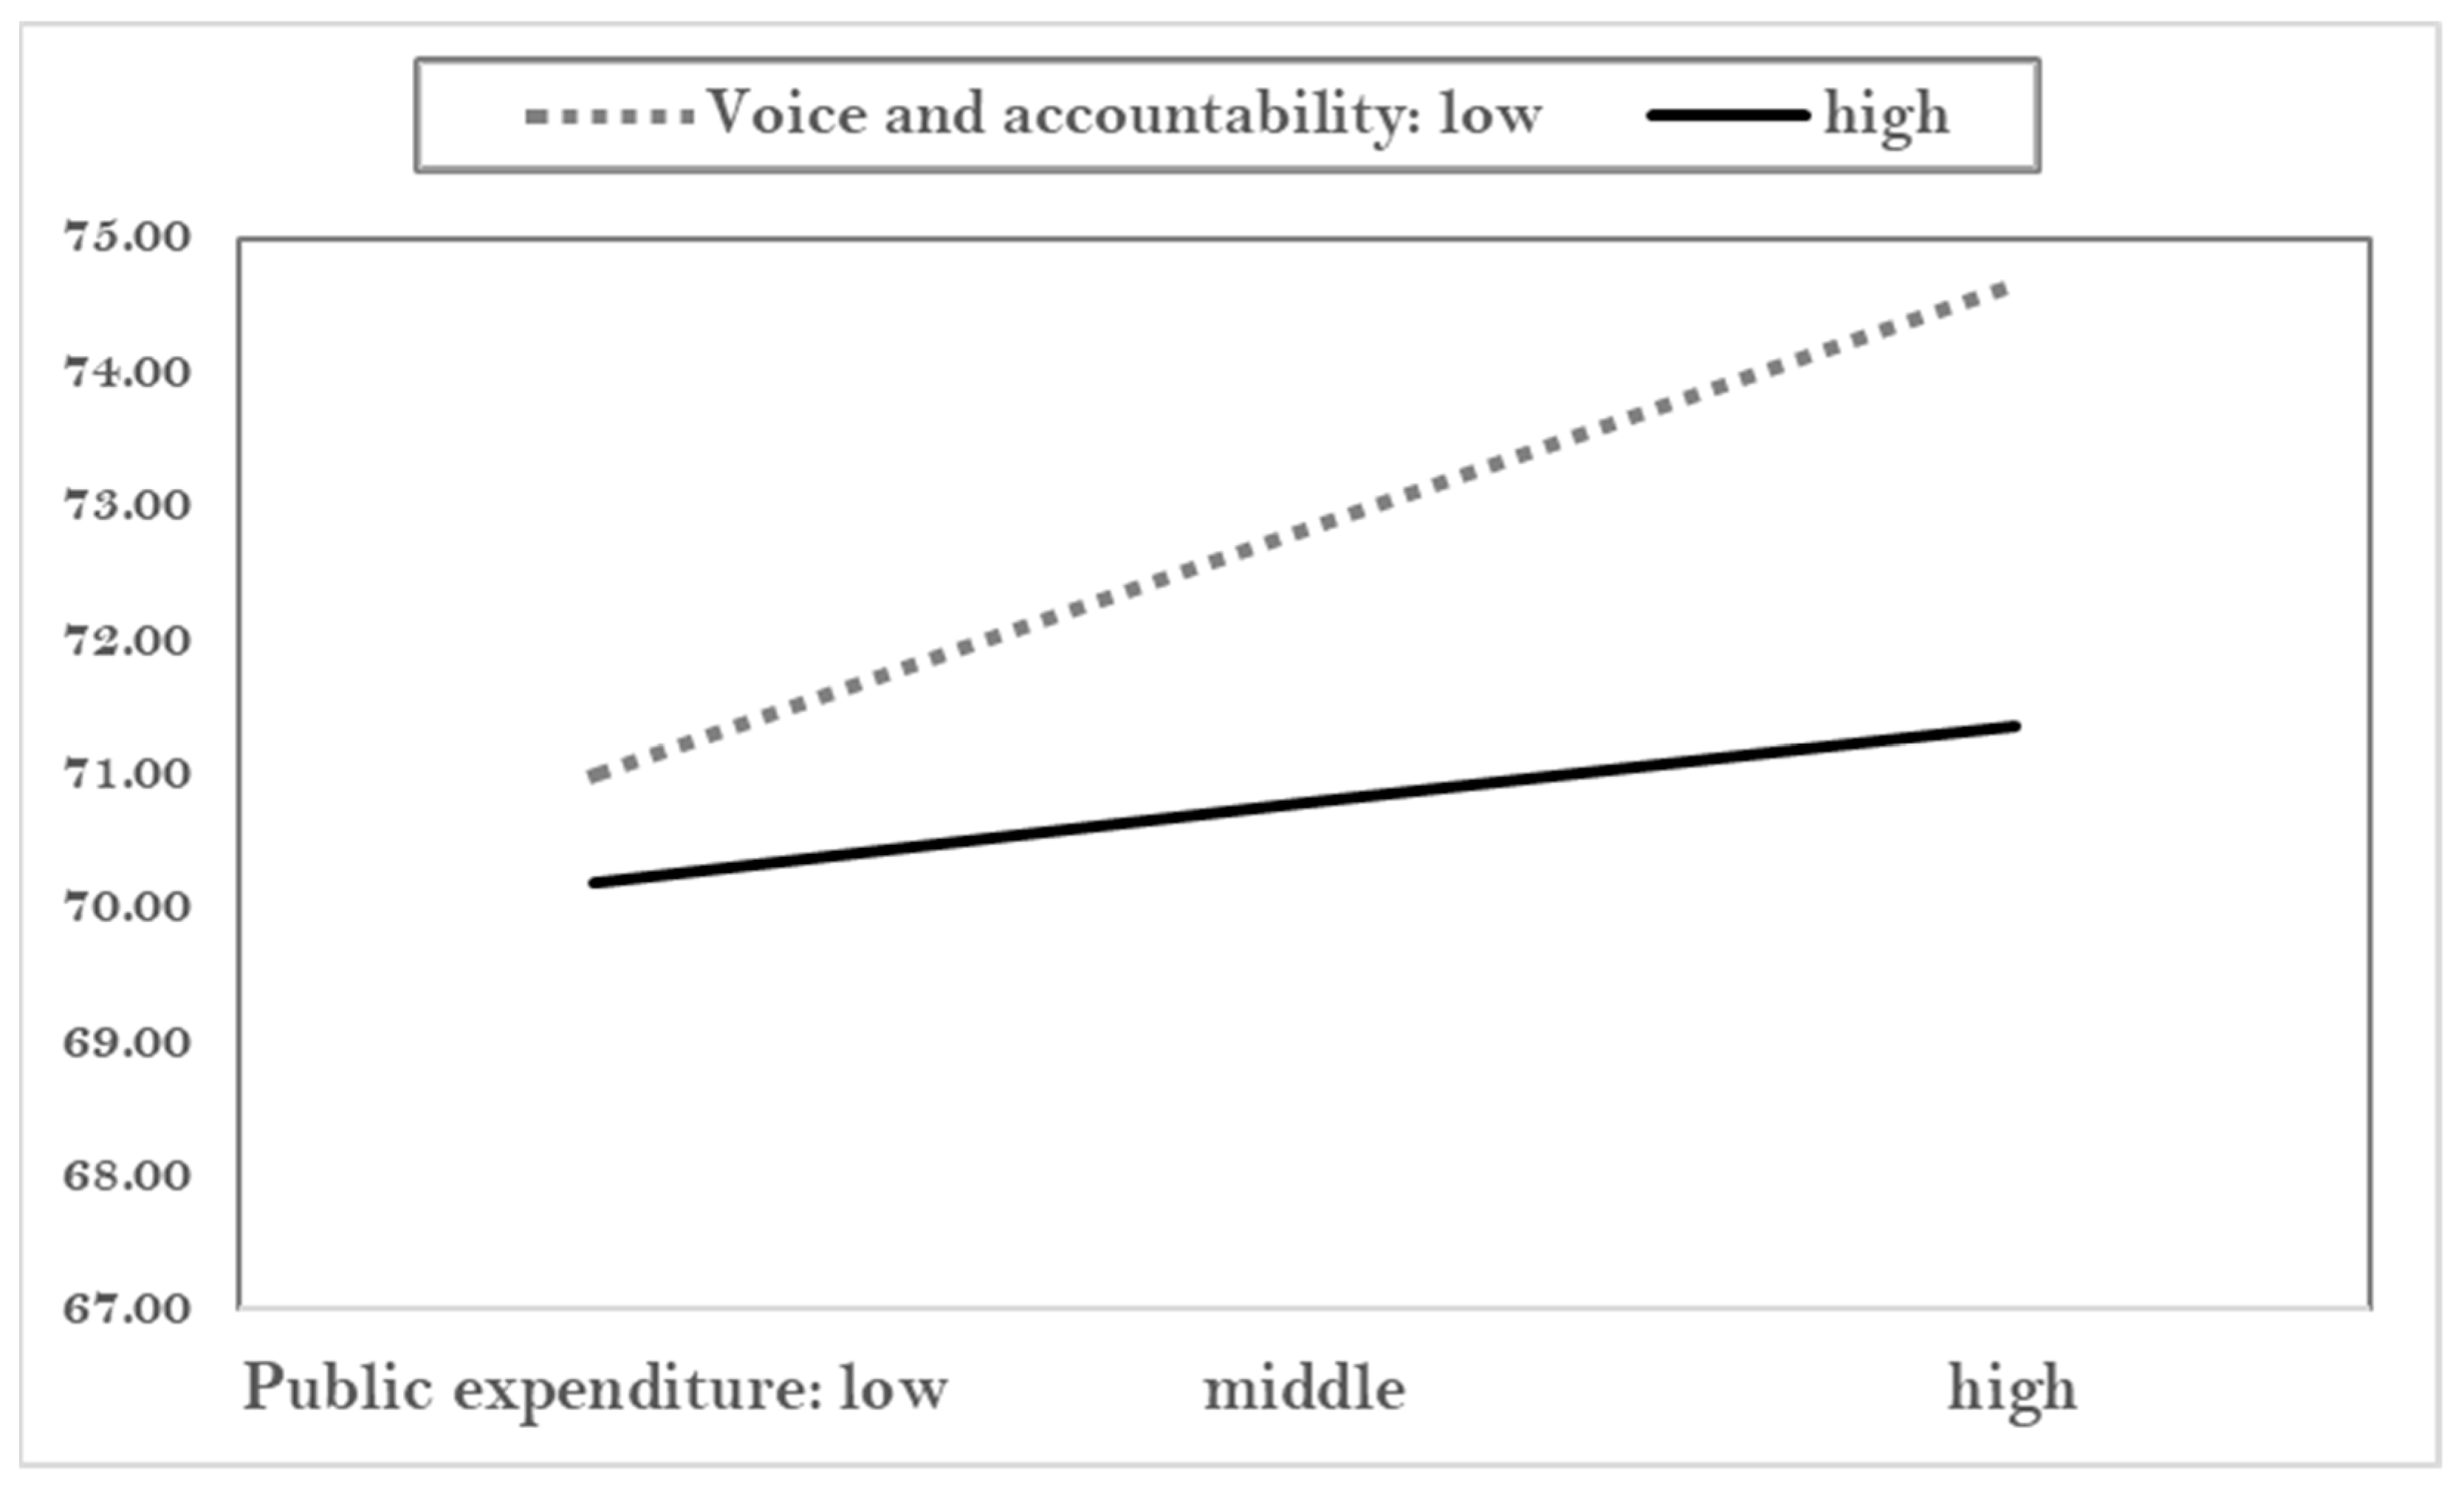
Figure 3 shows the moderation effect of voice and accountability on life expectancy. Generally, the more public expenditure, the more life expectancy. However, such an effect appears more in cases of low levels of voice and accountability. Voice and accountability are the perception of the extent to which citizens in a given country are able to participate in selecting their government, as well as freedom of expression, freedom of association, and a free media [44]. This definition connotes the positive role of active voice and participation. However, our research demonstrates that higher voice and participation were not have stronger power than lower voice in increasing public health.
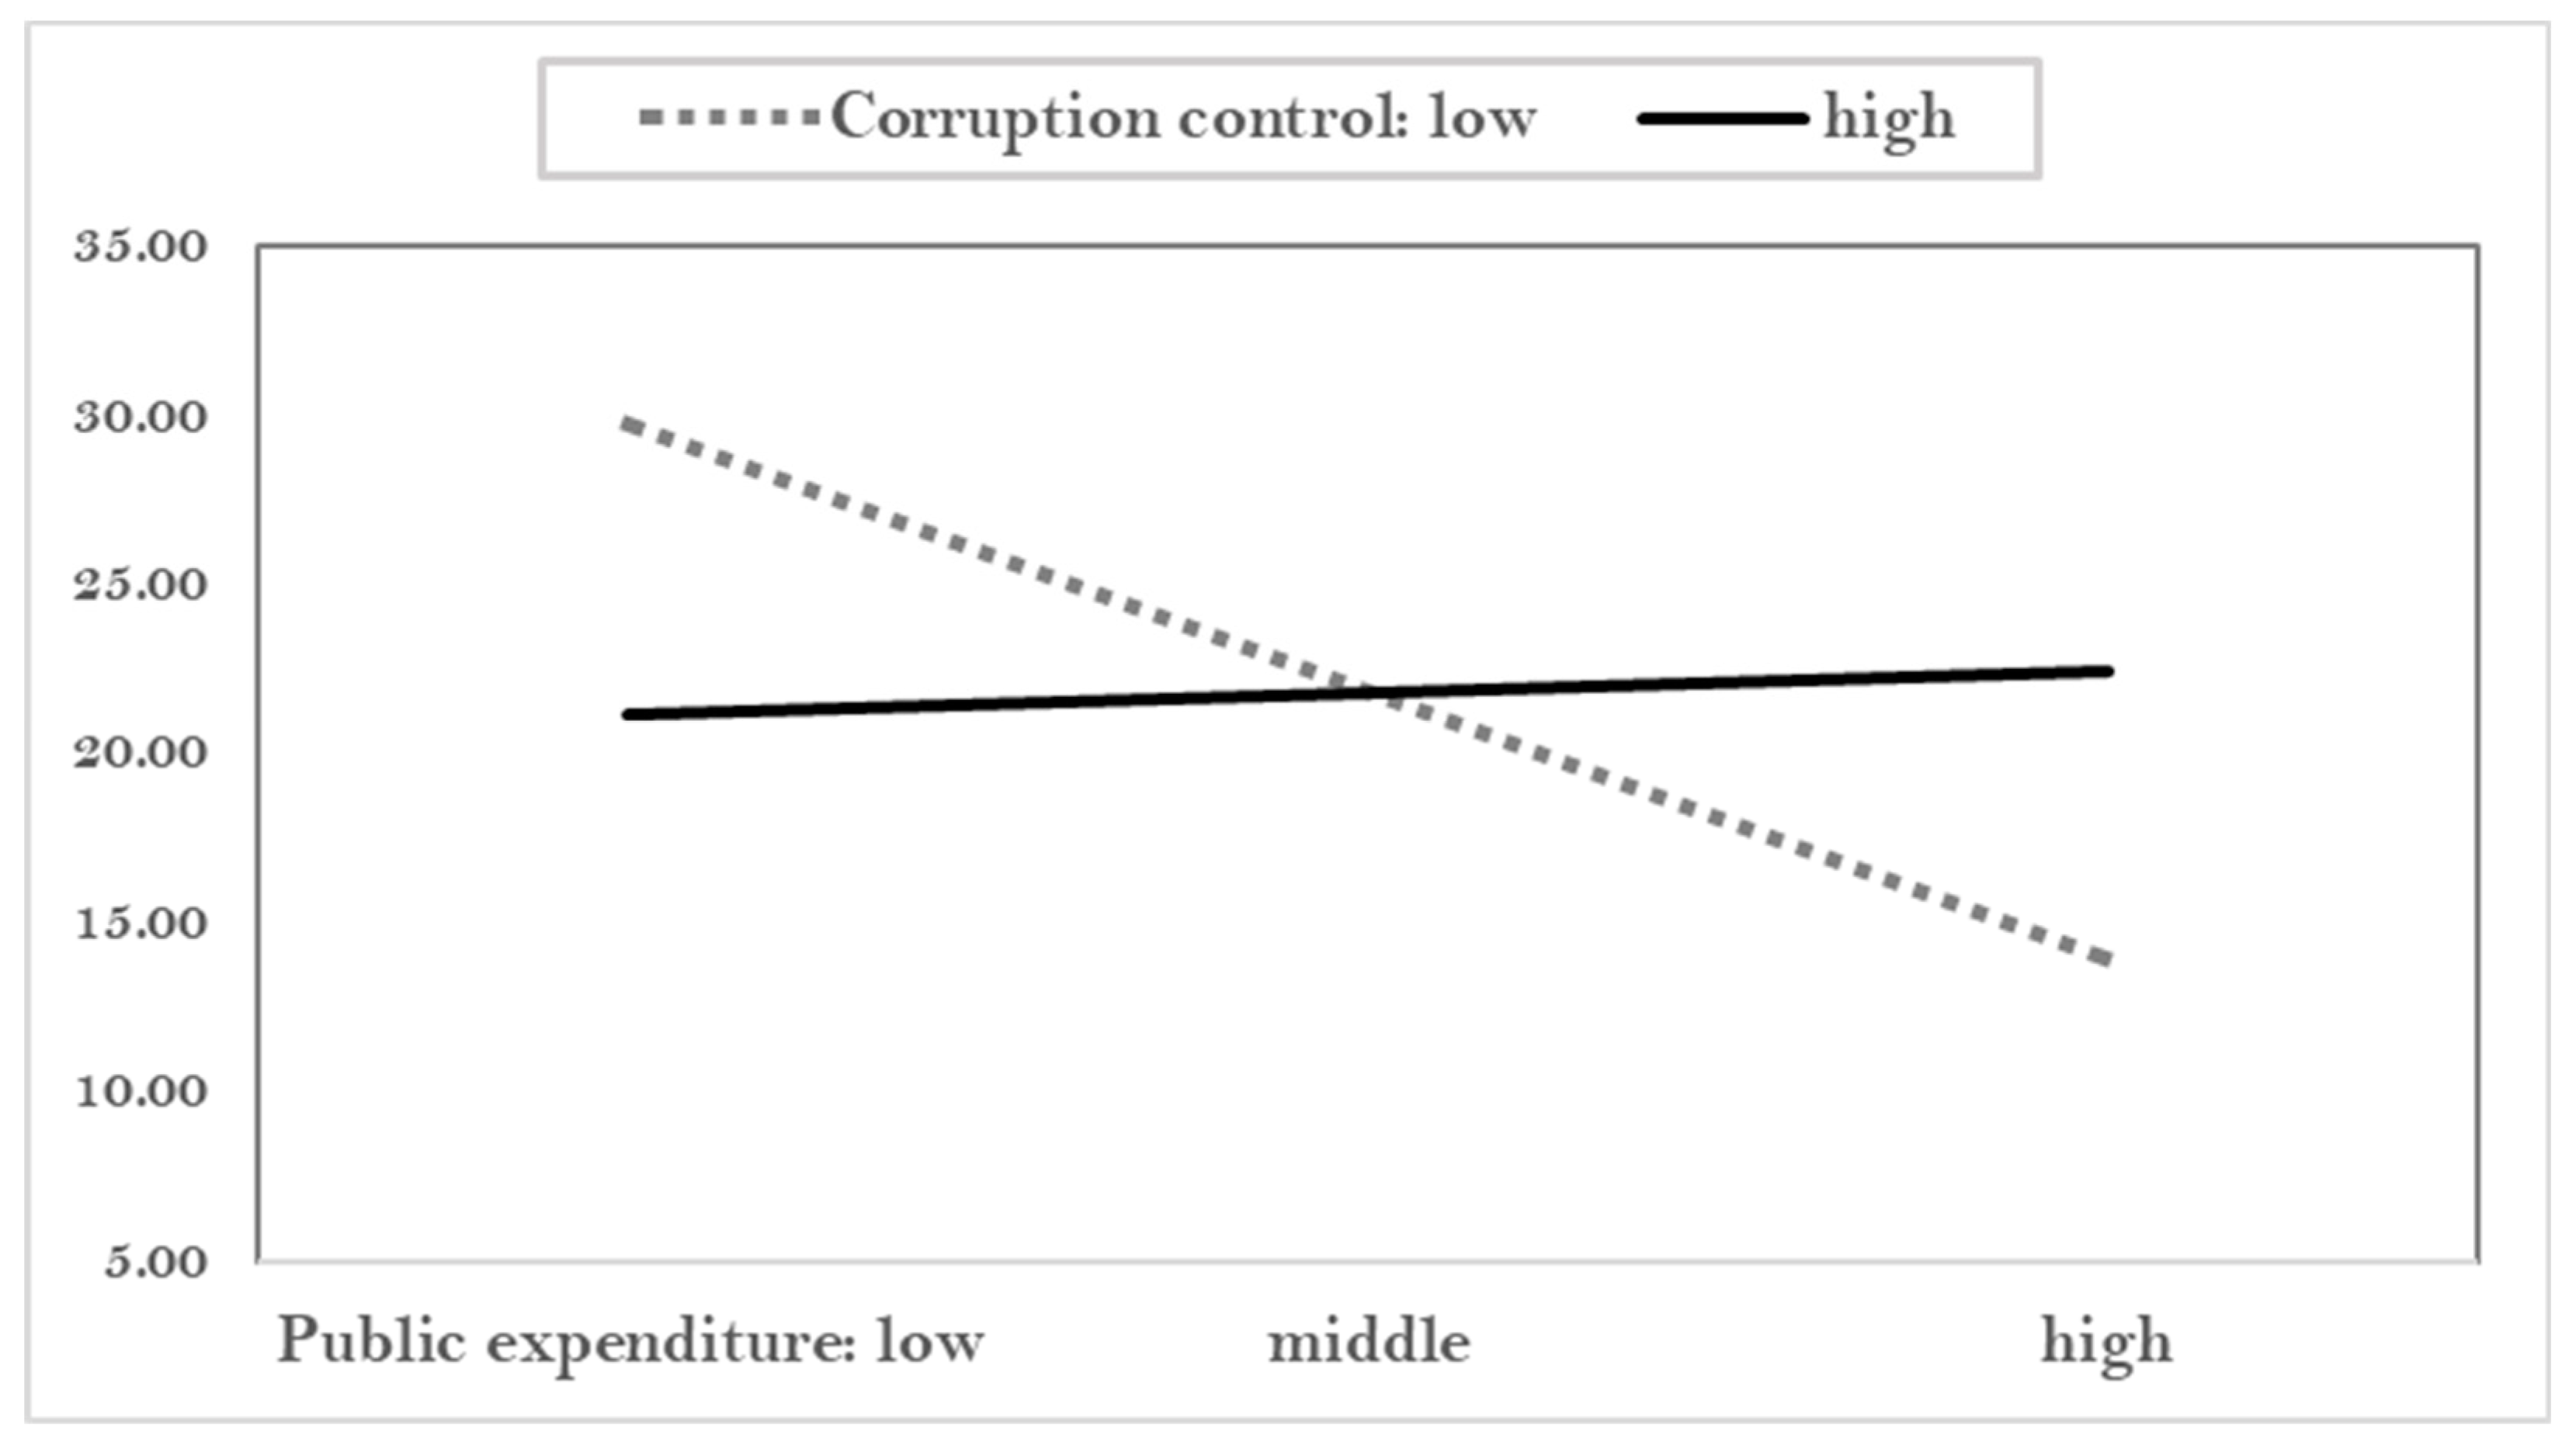
Figure 4 shows that under lower corruption control, the likelihood of infant mortality is reduced when the public expenditure is increased. However, under higher corruption control, public expenditure does not reduce the infant mortality. Why is weak control corruption effective in reducing the mortality? It is suggested that the weak control of corruption brings out the flexibility in a given society; this flexibility had a positive impact on health outcome.
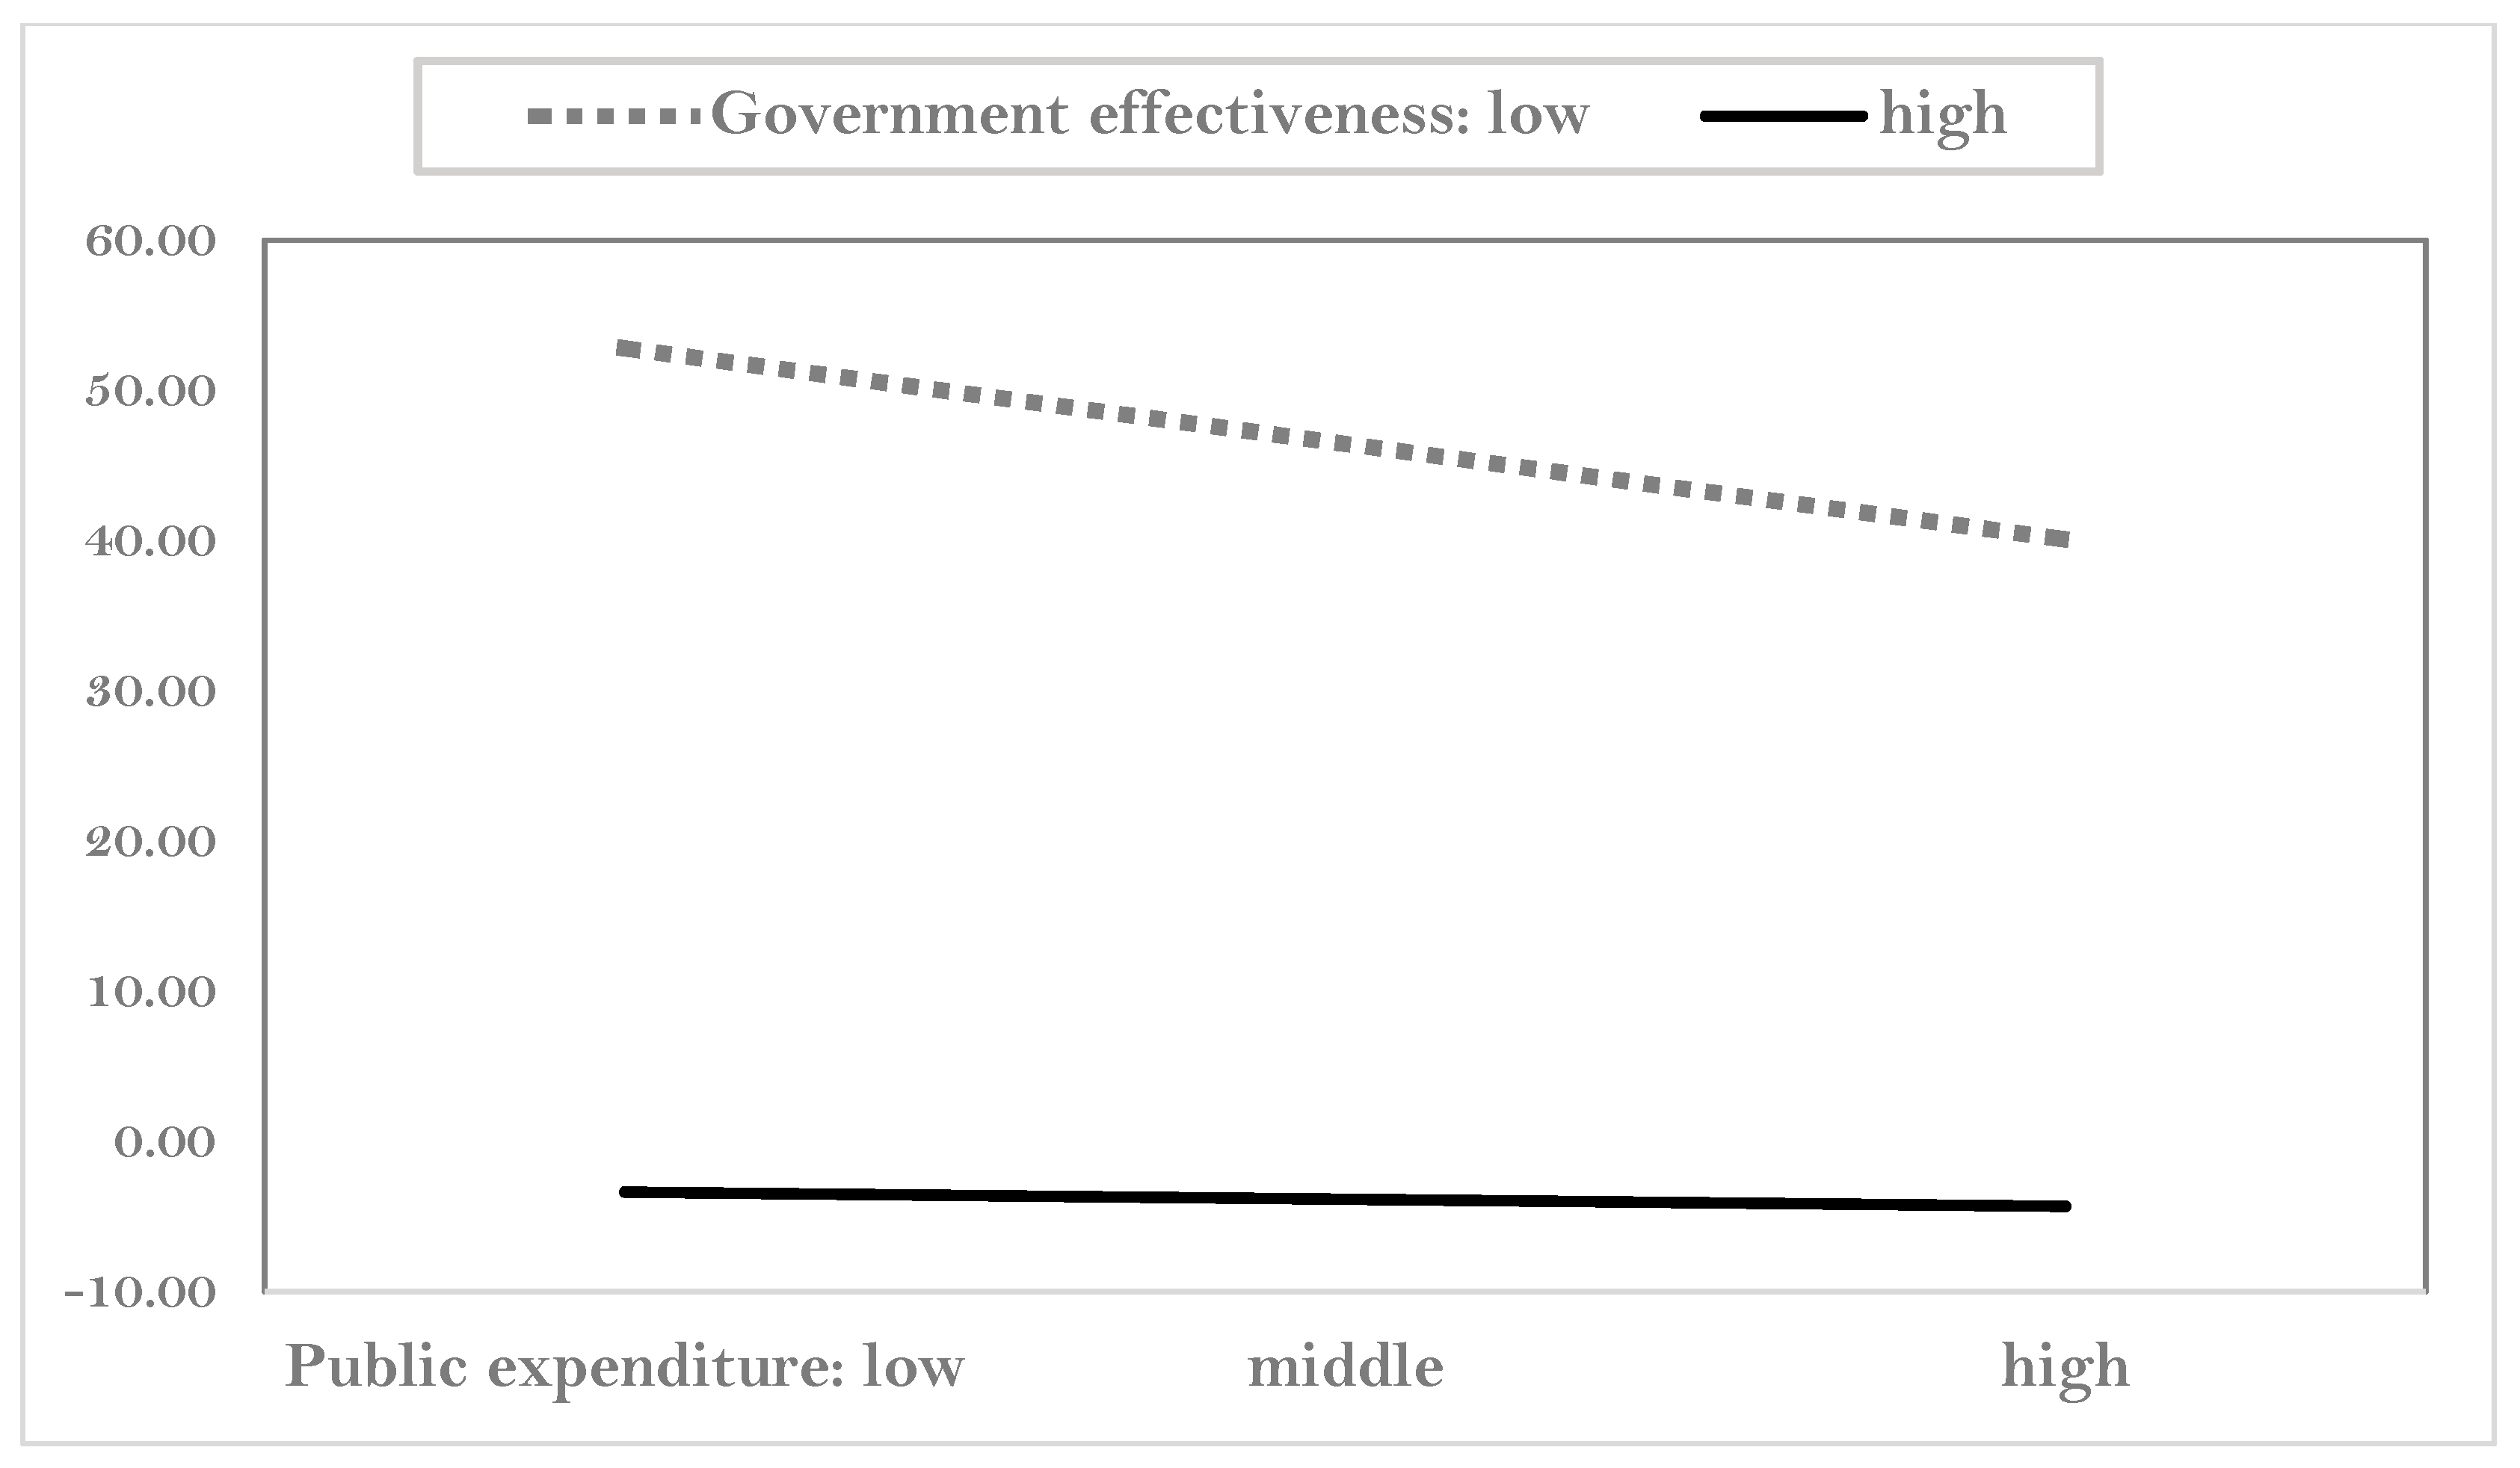
Figure 5 shows how government effectiveness moderates the relationship between public expenditure and infant mortality. Public expenditure contributes to decreasing the infant mortality rate, but this effect becomes stronger under high government effectiveness compared to under low government effectiveness.
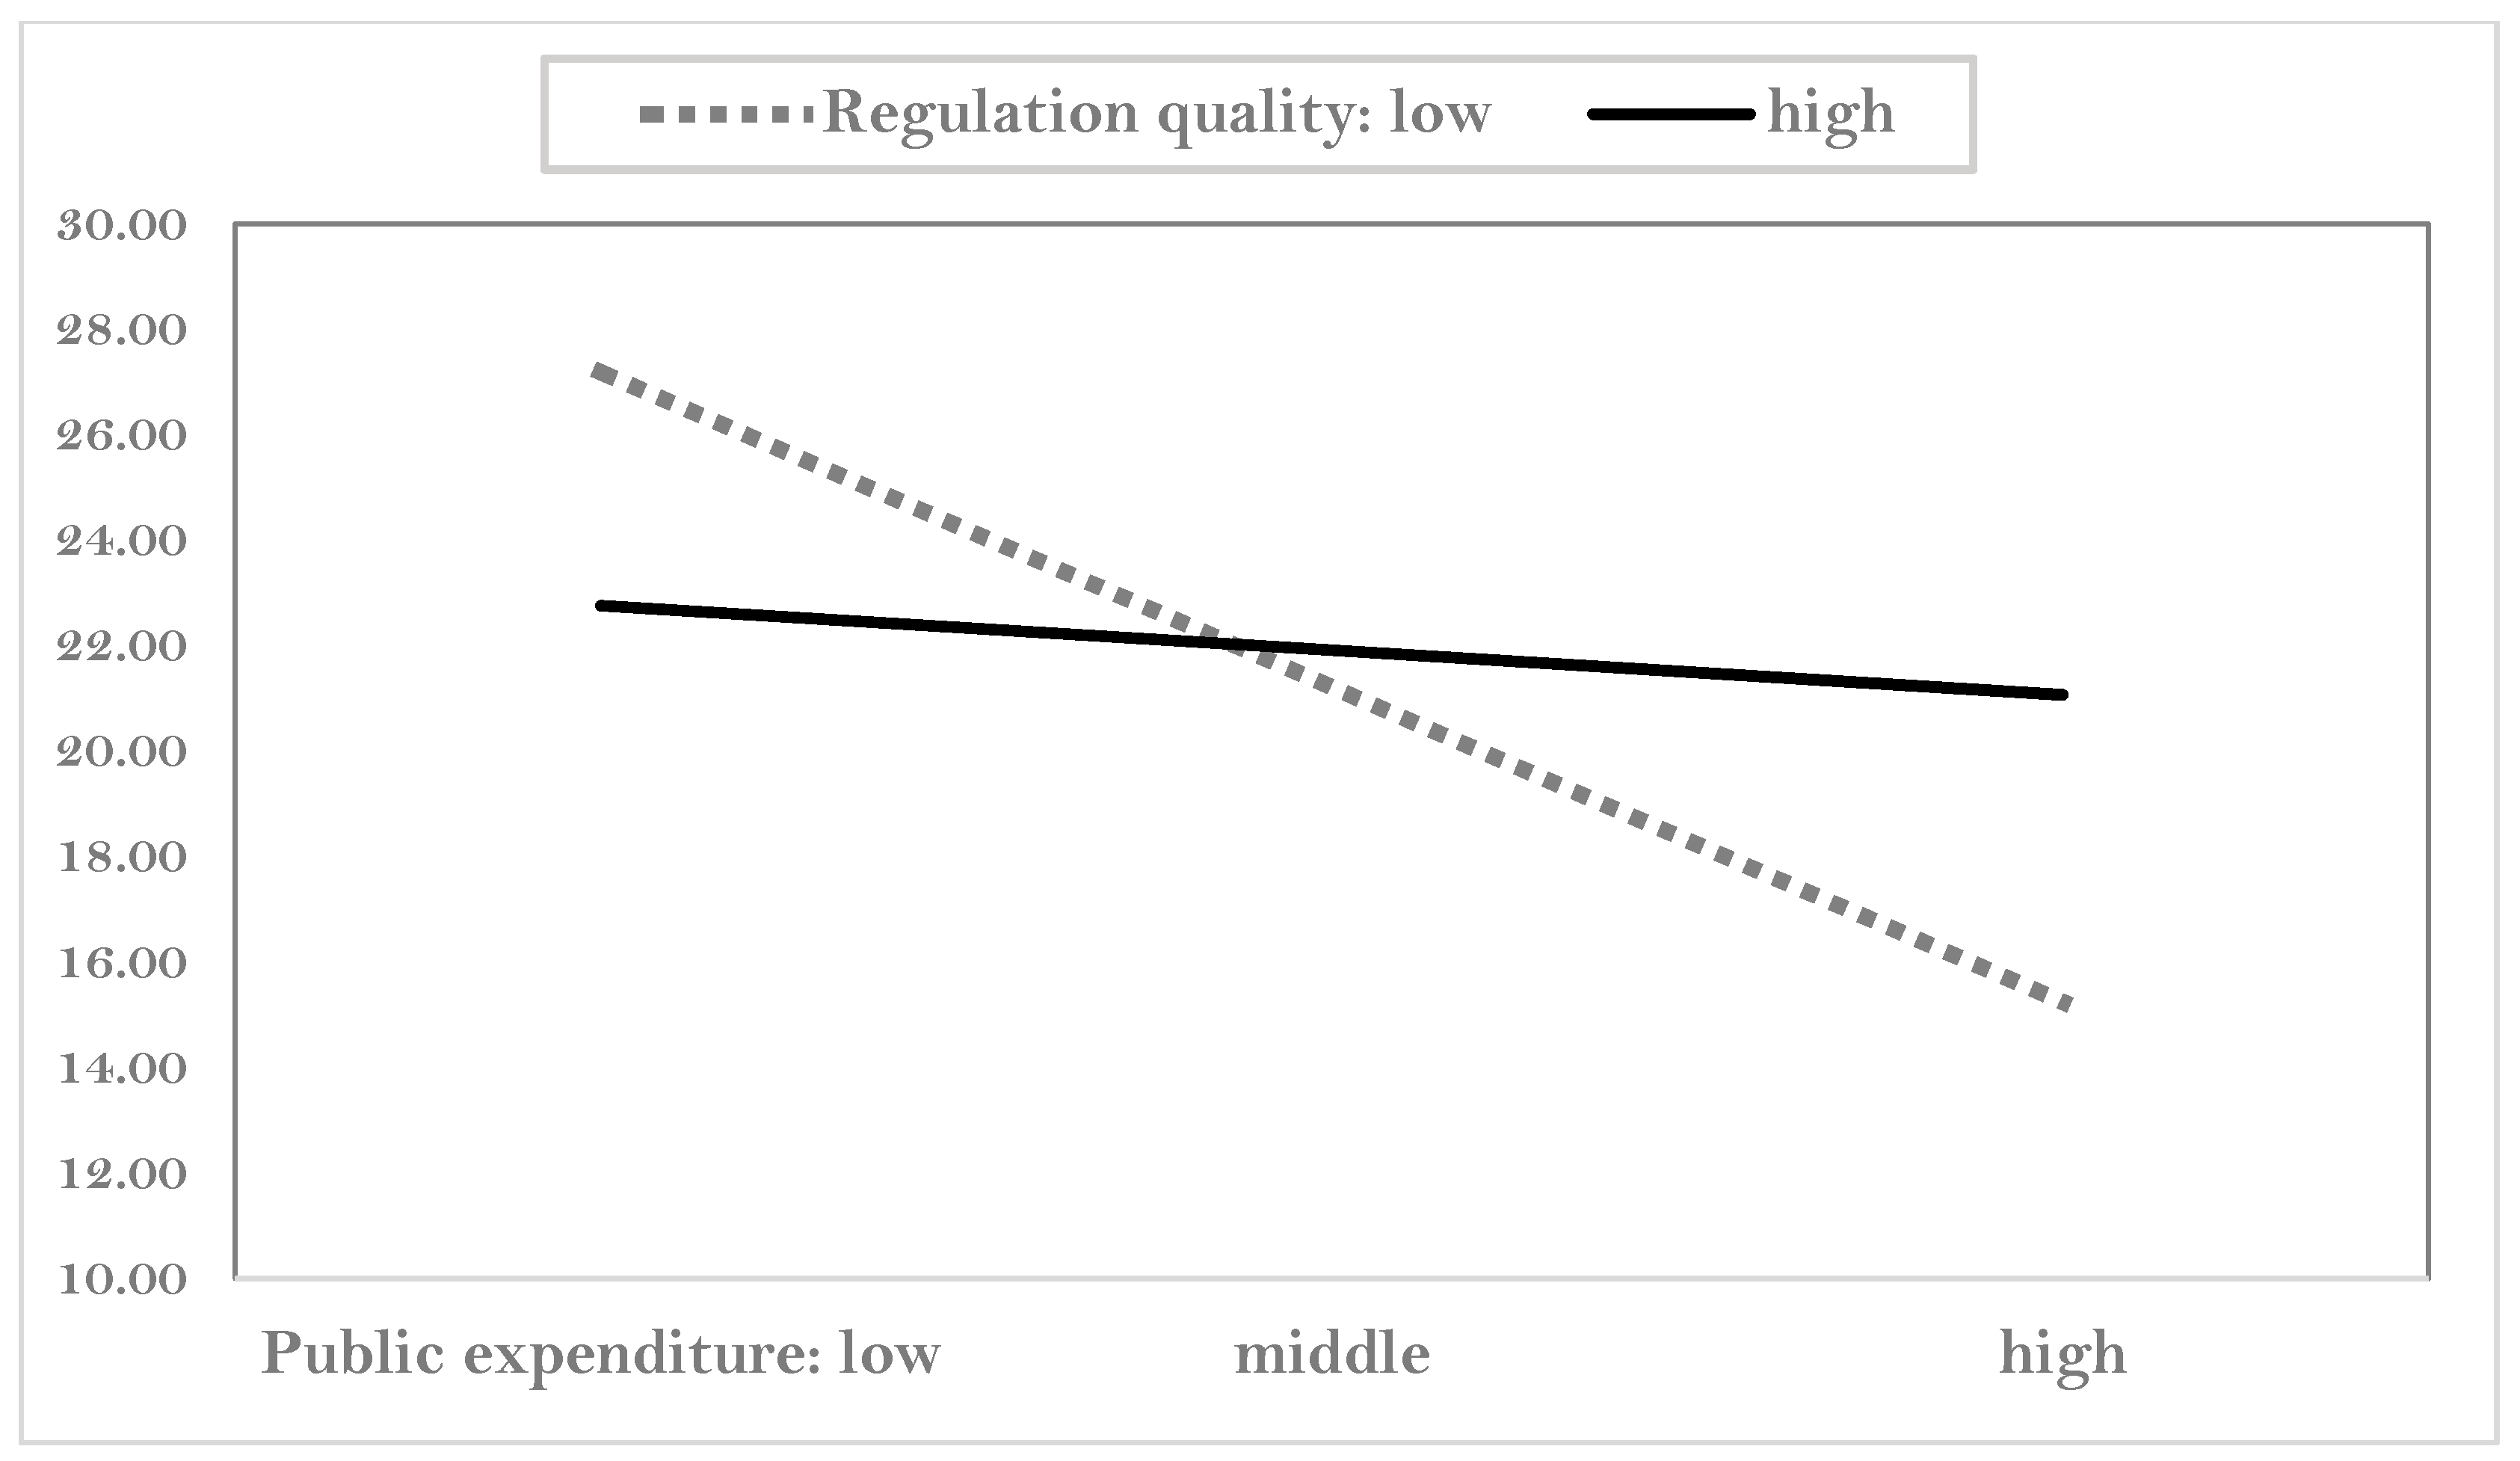
Figure 6 shows the moderating impact of regulation quality on infant death. Public expenditure affects mortality, but it is entirely dependent on regulation quality. When public expenditure is low, higher regulation quality contributes to decreasing the infant mortality. However, under higher public expenditures, compared to weak regulation, strong regulation played a small role in reducing the mortality. This seems to be the adverse effect of strong regulation.
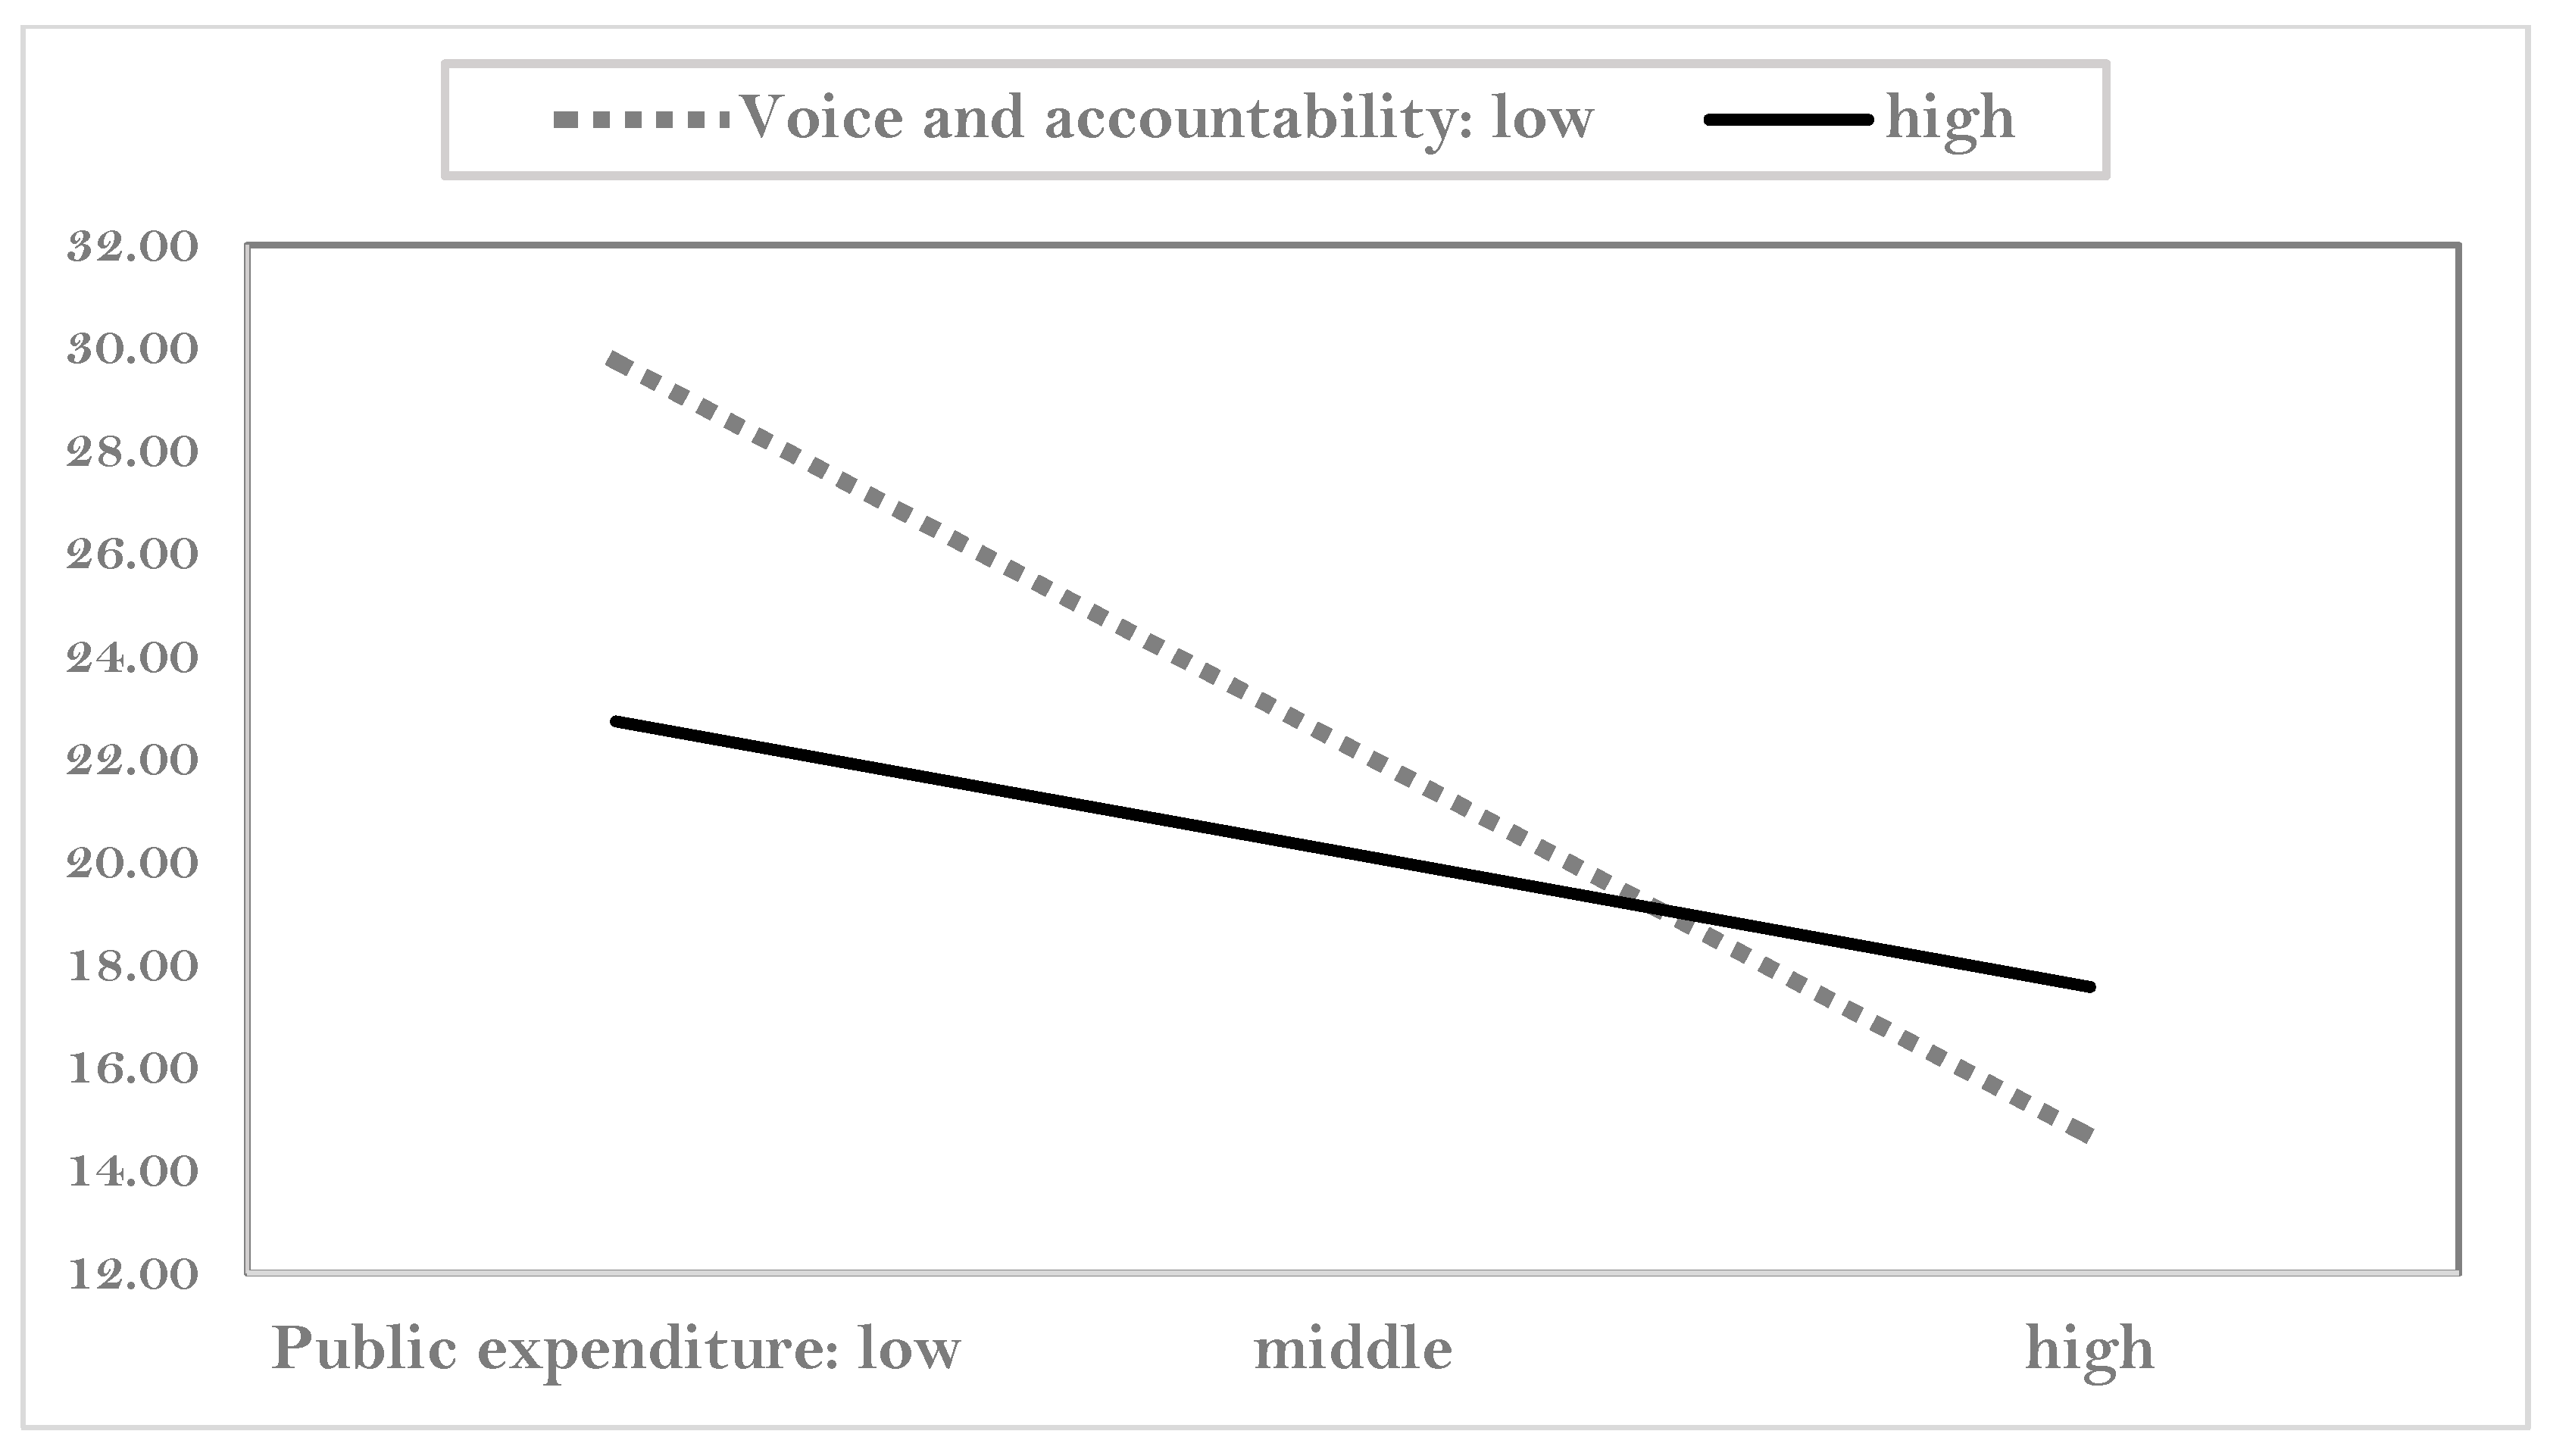
Figure 7 shows the moderating role of voice and accountability. Infant mortality decreases when public expenditure increases. This effect is dependent on voice and accountability. When public expenditure per capita is low, the effect of voice and accountability on public health is strong. On the other hand, when public expenditure rises, the impact of stronger voice and accountability on health becomes weak. This suggests that in lower expenditure, voice and accountability may be an important factor in public health, whereas in higher expenditure, factors other than the voice and accountability may be more important. It is noticeable that voice and accountability are not significant in the regression analysis. This implies that voice and accountability have indirect, not direct, effects on infant mortality through public expenditure.
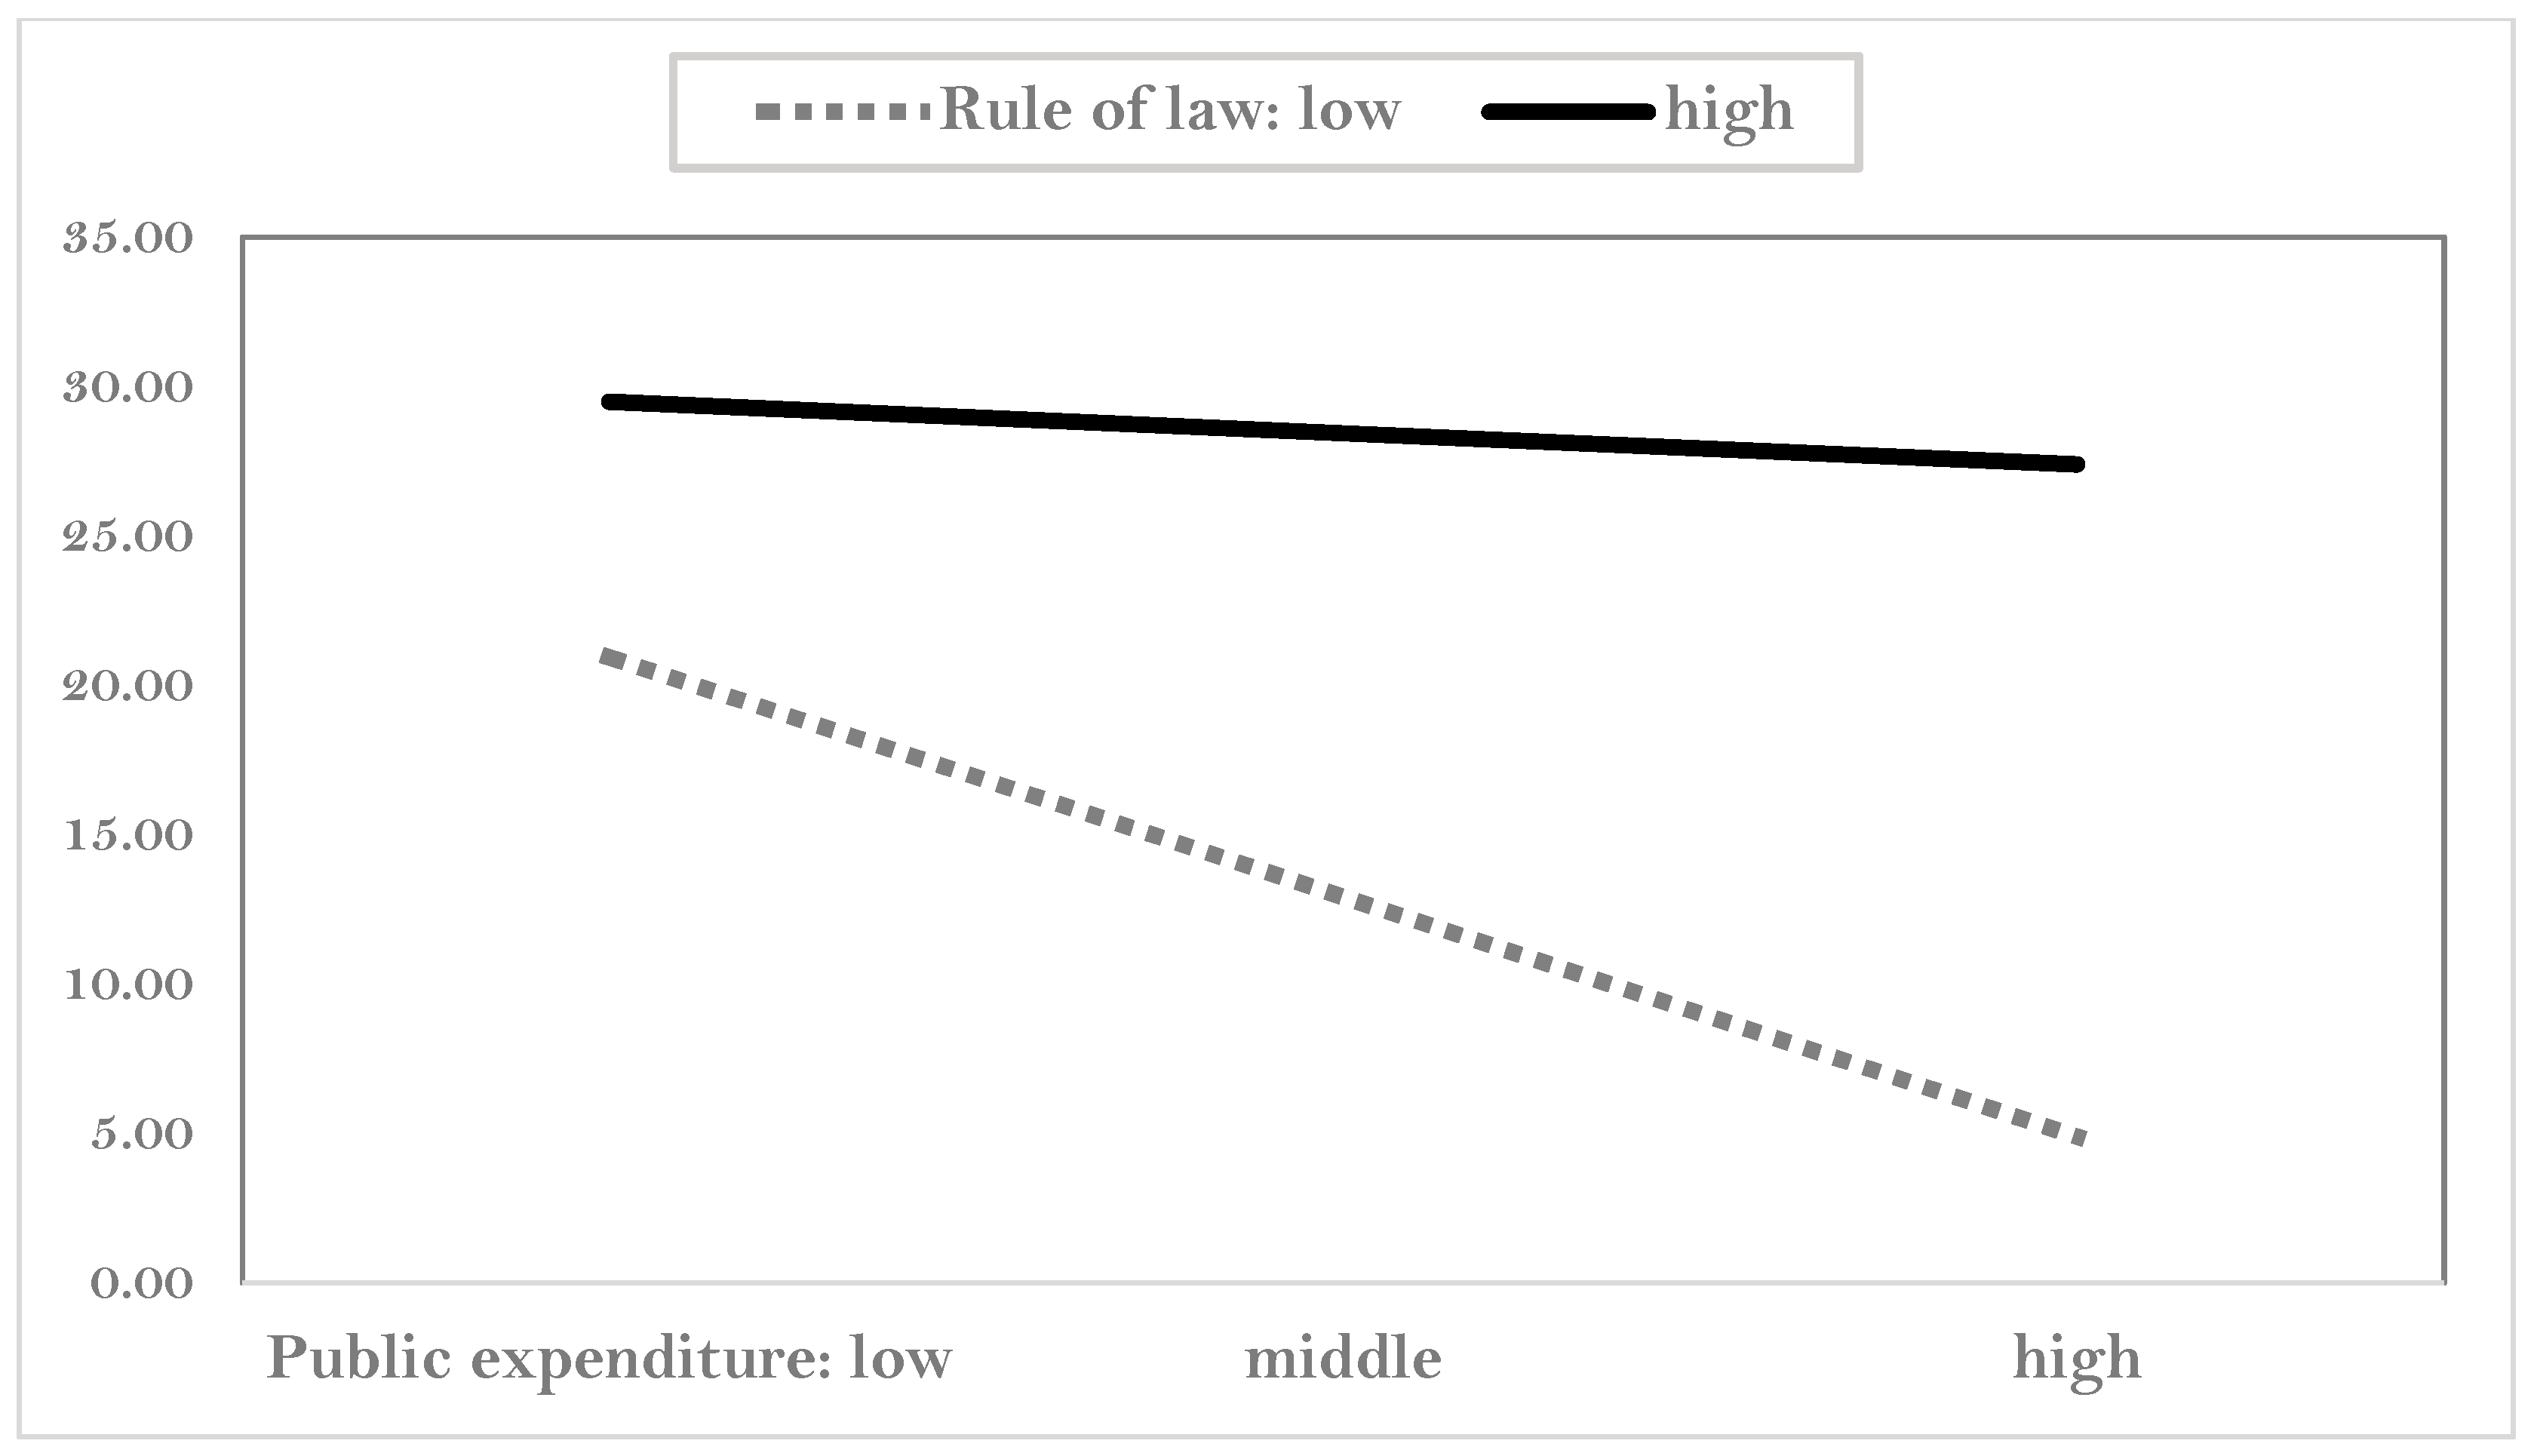
Figure 8 shows the moderating effect of the rule of law on infant deaths. If the rule of law is weak, public expenditure lowers the infant mortality rate. However, as public expenditure on health increases, higher rule of law increases the mortality. As mentioned earlier, it shows the negative aspects of strong rule of law.
In short, even if not all, the quality of government has a positive impact on public health when the public expenditure is low. Since, generally, low public expenditure is the attribute of less developed or developing countries, it concludes that the quality of government is more important in less developed countries than developed ones.
5. Summary and Implication
5.1. Main findings
This study started with the research question, “Does quantity of government significantly influence public health?” There are few studies on how the quality of government can influence the public health. Even if some studies, such as Gupta et al. [16] and Doces and Sanjian [63], suggested that the quality of government has a positive effect on people’s health, those studies did not adopt comparative approaches. Therefore, we compared the impact of government in terms of (1) quantity versus quality, (2) quality versus quality, and (3) quantity/quality versus other factors. Moreover, this study focused on how the quality of government moderates the relationship between the quantity of government and public health. Our main findings are as follows.
First, basic descriptive studies show there is a large difference in public health. The life expectancy ranges from 51 to 84; the number of infant deaths per 1000 newborns ranges from 2 to 94. This suggests that too much variation exists among countries. The quality of government has a stronger correlation with life expectancy than with mortality, while the effect on the quality of government may vary depending on which type of public health it is. In addition, government effectiveness is highly correlated with public health as compared with other types of quality of government. This implies that the type of quality of government matters. Public expenditure on health has a positive relationship with life expectancy and a negative relationship with mortality. The private expenditure shows the impact contrasting with that of public expenditure. The correlation between the quality and quantity of government is moderate (0.152–0.613). It implies that the quality and quantity of government have different characteristics.
Second, in causal analysis, the quality and quantity of government have impacts on public health. While government effectiveness and public expenditure have a positive impact on life expectancy, private expenditure has a negative impact on it. On the other hand, those two variables significantly affect mortality. Moreover, private expenditure on health increases mortality and decreases life expectancy. Among quality of government, government effectiveness plays a role in promoting public health. Moreover, the quality of government has a more decisive influence on public health than quantity of government. In the other hand, strong regulation has a negative impact in increasing the maternal mortality. Based on the coefficients, government effectiveness has the highest impact on life expectancy, followed by fertility rate, and GDP per capita. The fertility rate has the highest impact on infant mortality and under-five mortality, followed by GDP per capita, and government’s effectiveness. In regression analysis, some economic and social variables, for example, fertility rate and GDP per capita, have consistent impacts on public health. They have more explanation power on health than government effectiveness does.
Third, the quality and quantity of government play a significant role in moderating the relationships between the public expenditure and public health. Quality of government decreases or increases the impact of public expenditures on the public health. As the public expenditure increases, weak voice and accountability increase the life expectancy whereas strong ones decrease it. Under low public expenditure, corruption control, regulation quality, and voice and accountability contribute to decreasing the infant mortality. However, those positive roles of quality of government decreases when the public expenditure increases. Moreover, strong rule of law has a negative impact on public health through public expenditure. All of those findings suggested that the quality of government has a positive impact under low public expenditure, which are the attributes of less developed or developing countries. It implies that quality of government is more important in less developed countries than developed ones.
In short, the quality and quantity of government affect public health. Those government factors are more important than political, economic, and social factors. Moreover, the quality of government has a greater impact on health than the quantity of government. Finally, quality of government moderates the relationships between quantity of government and public health.
5.2. Implication
Table 5 for presents the connection between analysis/findings and discussion/implication.
The implication of this study is that the quality and quantity of government plays an important role in maintaining a reasonable level of public health. We founded the role of sustainable government at public health. Governments should strive to improve their own effectiveness. The government’s policies and budgets are important to improve public health, rather than just economic accumulation and political stability are. This effect is particularly useful in underdeveloped countries. The health problems currently occurring in underdeveloped countries are not merely economic problems but are caused by the lack of good government. The improvement of public health requires efforts to build effective governments and public budget.
Our findings have implications in terms of theoretical and practical sides. From the theoretical point of view, the relationship between public health and its causal factor is specified, and in particular, the role of the quality and quantity of government is identified. The lack of effective governance results in failure to construct a good healthcare system. The healthy states can be achieved by appropriate institutional design, which demands information about better quality of the government. Our studies clearly provide theoretical evidences for good governance in terms of quality and quantity of government [22].
From the practical point of view, countries should make efforts toward providing healthier systems and social living environments through making more effective governance. How can the government be more effective and efficient? Makuta and O’Hare [15] pointed out that it needs to increase both efficiency in the use of available public resources and better allocation of them. Our study showed that the effectiveness of government is a significant variable. Kaufmann et al. [43] defined that government effectiveness is about perceptions of the quality of public services, the quality of the civil service and the degree of its independence from political pressures, the quality of policy formulation and implementation, and the credibility of the government’s commitment to such policies. Based on the concept of effectiveness, it is necessary to form policies that reflect the opinions of citizens in the input side of the government system, enhance transparency in the policy making process, and deliver effective and efficacious service in the policy implementation.
5.3. Further Research Topics
We suggest several research themes for further developments. First, the current dimensions of the quality and quantity of government are inevitably limited in that the qualitative and quantitative elements of the government have various dimensions. Future studies should find out new dimensions of the quality and quantity of government. For example, the quality of government bureaucracy, quality of government policy and service outcomes, and trust in government can be considered as candidate variables for representing the quality of government. In quantitative variables, not only government expenditure, but also specific expenditure sectors should be considered as variables. Second, it needs to analyze the quality of the government in terms of a more objective perspective. The five variables representing the quality of government are all perceptual variables. Since there is a possibility that individual bias will intervene in the subjective judgment, it is necessary to develop an objective variable that substitutes for subjective ones. For example, the control of corruption can be measured by the number of actual corruption cases, the quality of regulation through the number of regulatory laws, and accountability through the number of events involving citizens. Third, this study was based on cross-sectional data. However, conducting time-series research considering time variables is required, in that the determinants of public health vary when the context and time change. Fourth, there are significant dimensions that are not considered in the control variables. The quality of government should be analyzed in terms of these dimensions. Sen [3] focuses on another aspect of inequality, which our research overlooked. Based on simple descriptive data, he showed that differential mortality rates of females and males have been consistently associated with these differences in the ‘sex ratio’ of the population mortality. Fifth, it needs more directive factors to influence the health state. For example, Sen [3] showed another side of enhancing public health by a ‘support-led’ (rather than the ‘growth-mediated’) process, which concerns providing social services (particularly healthcare) that reduce mortality and enhance the quality of life.
The limitations of this study are as follows. First, it does not fully reflect the various proxy variables that represent the quality and quantity of government in the research model. Second, significant control variables were not fully adopted. For example, health knowledge and healthy behaviors at the individual level, and proper sanitation and good healthcare facilities at the national level, have been overlooked. Third, it was difficult to explain those outlier cases, since our analysis focused on an overall trend across countries at the aggregate level.
Author Contributions
Conceptualization, methodology, writing—review and editing, S.K.; formal analysis, writing—original draft preparation, J.W.
Funding
This research received no external funding.
Acknowledgments
This study was conducted without any financial assistance.
Conflicts of Interest
The authors declare no conflict of interest.
References
- Ketenci, N.; Murthy, V. Some determinants of life expectancy in the United States: Results from cointegration tests under structural breaks. J. Econ. Finance 2018, 42, 508–525. [Google Scholar] [CrossRef]
- Pritchett, L.; Summers, L.H. Wealthier is healthier. J. Hum. Resour. 1996, 31, 841–868. [Google Scholar] [CrossRef]
- Sen, A. Mortality as an Indicator of Economic Success and Failure. Econ. J. 1998, 108, 1–25. [Google Scholar] [CrossRef]
- Rajan, K.; Kennedy, J.; King, L. Is wealthier always healthier in poor countries? The health implications of income, inequality, poverty, and literacy in India. Soc. Sci. Med. Med. 2013, 88, 98–107. [Google Scholar] [CrossRef]
- Wilkinson, R.G.; Pickett, K.E. Income inequality and population health: A review and explanation of the evidence. Soc. Sci. Med. Med. 2006, 62, 1768–1784. [Google Scholar] [CrossRef]
- Meara, E.R.; Richards, S.; Cutler, D.M. The gap gets bigger: Changes in mortality and life expectancy, by education, 1981–2000. Health Aff. 2008, 27, 350–360. [Google Scholar] [CrossRef]
- Aisa, R.; Clemente, J.; Pueyo, F. The influence of (public) health expenditure on longevity. Int. J. Public Health 2014, 59, 867–875. [Google Scholar] [CrossRef]
- Nixon, J.; Ulmann, P. The relationship between health care expenditure and health outcomes. Evidence and Caveats for a causal link. Eur. J. Health Econ. 2006, 7, 7–18. [Google Scholar] [CrossRef]
- Self, S.; Grabowski, R. How effective is public health expenditure in improving overall health? A cross-country analysis. Appl. Econ. 2003, 35, 835–845. [Google Scholar] [CrossRef]
- Farag, M.; Nandakumar, A.K.; Wallack, S.; Hodgkin, D.; Gaumer, G.; Erbil, C. Health expenditures, health outcomes and the role of good governance. Int. J. Health Care Finance Econ. 2013, 13, 33–52. [Google Scholar] [CrossRef]
- Cevik, S.; Taşar, M. Public spending on health care and health outcomes: A cross-country comparison. J. Bus. Econ. Finance 2013, 2, 82–100. [Google Scholar]
- Gupta, S.; Verhoeven, M.; Tiongson, E.R. Public spending on health care and the poor. Health Econ. 2003, 12, 685–696. [Google Scholar] [CrossRef] [PubMed]
- Aísa, R.; Pueyo, F. Government health spending and growth in a model of endogenous longevity. Econ. Lett. 2006, 90, 249–253. [Google Scholar] [CrossRef]
- Jaba, E.; Balan, C.B.; Robu, I.B. The relationship between life expectancy at birth and health expenditures estimated by a cross-country and time-series analysis. Procedia Econ. Finance 2014, 15, 108–114. [Google Scholar] [CrossRef]
- Makuta, I.; O’Hare, B. Quality of governance, public spending on health and health status in Sub Saharan Africa: A panel data regression analysis. BMC Emerg. Med. 2015, 15, 932. [Google Scholar] [CrossRef] [PubMed]
- Gupta, S.; Davoo, H.R.; Tiongson, E.R. Corruption and the Provision of Health Care and Education Services; Working Paper 00/116; International Monetary Fund: Washington, DC, USA, 2000. [Google Scholar]
- Filmer, D.; Pritchett, L. Child Mortality and Public Spending on Health: How Much Does Money Matter? World Bank Policy Research Working Paper No. 1864. 1999. Available online: https://ssrn.com/abstract=615010 (accessed on 20 August 2018).
- Biadgilign, S.; Ayenew, H.Y.; Shumetie, A.; Chitekwe, S.; Tolla, A.; Haile, D.; Gebreyesus, S.H.; Deribew, A.; Gebre, B. Good governance, public health expenditures, urbanization and child undernutrition Nexus in Ethiopia: An ecological analysis. BMC Health Serv. Res. 2019, 19, 40. [Google Scholar] [CrossRef] [PubMed]
- Bjørnskov, C.; Dreher, A.; Fischer, J. The bigger the better?: Evidence of the effect of government size on life satisfaction around the world. Pubic Choice 2007, 130, 267–292. [Google Scholar] [CrossRef]
- Yaqub, J.O.; Ojapinwa, T.V.; Yussuff, R.O. Public health expenditure and health outcomes in Nigeria. Eur. J. Hosp. Pharm. Sci. 2012, 8, 190–201. [Google Scholar]
- Sachs, J.D.; McArthur, J.W. The millennium project: A plan for meeting the millennium development goals. Millenn. Proj. 2005, 365, 347–353. [Google Scholar] [CrossRef]
- Israr, S.M.; Islam, A. Good governance and sustainability: A case study from Pakistan. Int. J. Health Plan. Manag. 2006, 21, 313–325. [Google Scholar] [CrossRef]
- Bloom, D.E.; Canning, D. The health and wealth of nations. Science 2000, 287, 1207–1209. [Google Scholar] [CrossRef] [PubMed]
- Rajkumar, A.S.; Swaroop, V. Public spending and outcomes: Does governance matter? J. Dev. Econ. 2008, 86, 96–111. [Google Scholar] [CrossRef] [Green Version]
- La Porta, R.; Lopez-de-Silanes, F.; Shleifer, A.; Vishny, R. The quality of government. J. Law Econ. Organ. 1999, 15, 222–279. [Google Scholar] [CrossRef]
- Rothstein, B.; Teorell, J. What is quality of government? A theory of impartial government institutions. Governance 2008, 21, 165–190. [Google Scholar] [CrossRef]
- Kaufmann, D.; Kraay, A.; Zoido-Lobaton, P. Governance Matters; Development Economics Research Group, World Bank: Washington, DC, USA, 1999. [Google Scholar]
- Kaufman, D.; Kraay, A.; Mastruzzi, M. Governance matters III: Governance indicators for 1996, 1998, 2000, and 2002. World Bank Econ. Rev. 2004, 18, 253–287. [Google Scholar] [CrossRef]
- Agnafors, M. Quality of government: Toward a more complex definition. Am. Political Sci. Rev. 2013, 107, 433–445. [Google Scholar] [CrossRef]
- Choi, J.W.; Yoon, G.-S.; Kim, H. Exploring the construction of quality concepts in government. J. Gov. Stud. 2012, 18, 53–76. [Google Scholar]
- Lin, R.T.; Chien, L.C.; Chen, Y.M.; Chan, C.C. Governance matters: An ecological association between governance and child mortality. Int. Health 2014, 6, 249–257. [Google Scholar] [CrossRef]
- Evans, P.B. Harnessing the State: Rebalancing Strategies for Monitoring and Motivation. In States and Development; Lange, M., Rueschemeyer, D., Eds.; Palgrave Macmillan: New York, NY, USA, 2005. [Google Scholar]
- Rothstein, B. The Quality of Government: Corruption, Social Trust and Inequality in a Comparative Perspective; University of Chicago Press: Chicago, IL, USA, 2011. [Google Scholar]
- Lindstrom, M.; Mohseni, M. Social capital, political trust and self-reported psychological health: A population-based study. Soc. Sci. Med. 2009, 68, 436–443. [Google Scholar] [CrossRef]
- Schultz, P.W.; Khazian, A.M.; Zaleski, A.C. Using Normative Social Influence to Promote Conservation among Hotel Guests. Soc. Influ. 2008, 3, 4–23. [Google Scholar] [CrossRef]
- Scholz, J.T.; Lubell, M. Trust and taxpaying: Testing the heuristic approach to collective action. Am. J. Pol. Sci. 1998, 42, 398–417. [Google Scholar] [CrossRef]
- Anyanwu, J.; Erhijakpor, A. Health expenditures and health outcomes in Africa. Afr. Dev. Rev. 2009, 21, 400–433. [Google Scholar] [CrossRef]
- Bokhari, F.A.S.; Gai, Y.; Gottret, P. Government expenditures the health and the health outcomes. Health Econ. 2007, 16, 257–273. [Google Scholar] [CrossRef] [PubMed]
- Gupta, S.; Verhoeven, M.; Tiongson, E.R. The effectiveness of government spending on education and health care in developing and transition economies. Eur. J. Polit. Econ. 2002, 18, 717–737. [Google Scholar] [CrossRef]
- Novignon, J.; Olakojo, S.A.; Nonvignon, J. The effects of public and private health expenditure on health status in sub-Saharan Africa: New evidence from panel data analysis. Health Econ. Rev. 2012, 2, 2–22. [Google Scholar] [CrossRef]
- Akinkugbe, O.; Afeikhena, J. Public health care spending as a determinant of health status: a panel data analysis for SSA and MENA. In Applied Macroeconomics and Economic Development; Adenikinju, A., Olaniyan, O., Eds.; Ibadan University Press: Ibadan, Nigeria, 2000. [Google Scholar]
- Shaw, J.W.; Horrace, W.C.; Vogel, R.J. The determinants of life expectancy: An analysis of the OECD health data. South Econ J. 2005, 71, 768–783. [Google Scholar] [CrossRef]
- Kaufmann, D.; Kraay, A.; Mastruzzi, M. The Worldwide Governance Indicators: Methodology and Analytical Issues; Draft Policy Research Working Paper; The World Bank: Washington, DC, USA, 2010. [Google Scholar]
- Dahlberg, S.; Holmberg, S.; Rothstein, B.; Pachon, N.A.; Svensson, R. The Quality of Government Basic Dataset; Version Jan18; The Quality of Government Institute, University of Gothenburg: Gothenburg, Sweden, 2018; Available online: http://www.qog.pol.gu.se (accessed on 21 December 2018).
- Grossman, M. The correlation between health and schooling. In Household Production and Consumption; Terleckyj, N.E., Ed.; Columbia University Press: New York, NY, USA, 1975. [Google Scholar]
- Rosen, S.; Taubman, P. Some socioeconomic determinants of mortality. In Economics of Health Care; van der Gragg, J., Neeman, W.B., Tsukahara, T., Eds.; Praeger Publishers: New York, NY, USA, 1982. [Google Scholar]
- Elo, I.; Preston, S.H. Educational differentials in mortality: United States, 1979–85. Soc. Sci. Med. 1996, 42, 47–57. [Google Scholar] [CrossRef]
- Human Development Data (1990–2017). Available online: http://hdr.undp.org/en/data (accessed on 25 December 2018).
- The World Development Indicators. Available online: http://wdi.worldbank.org (accessed on 26 December 2018).
- Cornia, G.A.; Mwabu, G. Health Status and Health Policy in Sub-Saharan Africa: A Long-Term Perspective. Discussion Paper. 1997. Available online: www.wider.unu.edu (accessed on 23 July 2018).
- Lopes, P.S. A comparative analysis of Government Social Spending Indicators and their Correlation with Social Outcomes in Sub-Saharan Africa. (IMF Working Paper 02/176). 2002. Available online: http://www.imf.org/external/pubs/cat/longres.aspx?sk=16103 (accessed on 23 July 2018).
- Musgrove, P. Public and Private Roles in Health: Theory and Financing Patterns. HNP Discussion Paper. 1996. Available online: http://siteresources.worldbank.org (accessed on 25 August 2018).
- De Vogli, R.; Mistry, R.; Gnesotto, R.; Cornia, G.A. Has the relation between income inequality and life expectancy disappeared? Evidence from Italy and top industrialised countries. J. Epidemiol. Community Health 2005, 59, 158–162. [Google Scholar] [CrossRef] [Green Version]
- Mayer, S.E.; Sarin, A. Some mechanisms linking economic inequality and infant mortality. Soc. Sci. Med. 2005, 60, 439–455. [Google Scholar] [CrossRef]
- Drabo, A. impact of income inequality on health: Does environment quality matter? Environ. Plan. A Econ. Space 2011, 43, 146–165. [Google Scholar] [CrossRef]
- Hu, Y.; van Lenthe, F.J.; Mackenbach, J.P. Income inequality, life expectancy and cause-specific mortality in 43 European countries, 1987–2008: A fixed effects study. Eur. J. Epidemiol. 2015, 30, 615–625. [Google Scholar] [CrossRef] [PubMed]
- Bollyky, T.J.; Templin, T.; Cohen, M.; Schoder, D.; Dieleman, J.L.; Wigley, S. The relationships between democratic experience, adult health, and cause-specific mortality in 170 countries between 1980 and 2016: An observational analysis. Lancet 2019. [Google Scholar] [CrossRef]
- Safaei, J. Is democracy good for health? Int. J. Health Serv. 2006, 36, 767–786. [Google Scholar] [CrossRef]
- Ruger, J.P. Democracy and health. QJM Int. J. Med. 2005, 98, 299–304. [Google Scholar] [CrossRef] [PubMed] [Green Version]
- Torres-Reyna, O. Panel Data Analysis Fixed and Random Effects using Stata (v. 4.2). 2007. Available online: http://december2007ss.princeton.edu/training/ (accessed on 25 December 2018).
- Wooldridge, J.M. Introductory Econometrics: A Modern Approach; South-Western: Mason, OH, USA, 2006. [Google Scholar]
- Baron, R.M.; Kenny, D.A. The moderator—Mediator variable distinction in social psychological research: Conceptual, strategic, and statistical considerations. J. Pers. Soc. Psychol. 1986, 51, 1173–1182. [Google Scholar] [CrossRef]
- Doces, J.A.; Sanjian, G.S. Achieving the UN is the ’S MDGs. Corruption, Human Development, and Child Mortality. Paper Presented at the Annual Meeting of the American Political Science Association, Montreal, QC, Canada, 2–6 September 2009. [Google Scholar]
Figure 1.
Research framework.

Figure 2.
Analysis of mean difference in four public health.

Figure 3.
Public expenditure × voice and accountability = life expectancy.

Figure 4.
Public expenditure on health × control corruption = mortality.

Figure 5.
Public expenditure on health × government effectiveness = mortality.

Figure 6.
Public expenditure on health × regulation quality = mortality.

Figure 7.
Public expenditure on health × voice and accountability = mortality.

Figure 8.
Public expenditure on health × rule of law = mortality.


Table 1.
Definition of governance indicators.
| Governance Indicators | Definition |
|---|---|
| Voice and accountability | Capturing perceptions of the extent to which a country’s citizens are able to participate in selecting their government, as well as freedom of expression, freedom of association, and a free media |
| Political stability and absence of violence/terrorism | Capturing perceptions of the likelihood that the government will be destabilized or overthrown by unconstitutional or violent means, including politically motivated violence and terrorism |
| Government effectiveness | Capturing perceptions of the quality of public services, the quality of the civil service and the degree of its independence from political pressures, the quality of policy formulation and implementation, and the credibility of the government’s commitment to such policies |
| Regulatory quality | Capturing perceptions of the ability of the government to formulate and implement sound policies and regulations that permit and promote private sector development |
| Rule of law | Capturing perceptions of the extent to which agents have confidence in and abide by the rules of society, and in particular the quality of contract enforcement, property rights, the police, and the courts, as well as the likelihood of crime and violence |
| Corruption | Capturing perceptions of the extent to which public power is exercised for private gain, including both petty and grand forms of corruption, as well as “capture” of the state by elites and private interests. |
Source: Kaufmann et al. [43].
Table 2.
Variables list and descriptive analysis.
| Variables | Indicators | Scale | Year | Sources | N | Min. | Max. | Mean | S.D. | |
|---|---|---|---|---|---|---|---|---|---|---|
| Dependent variable | Public health | Infant mortality | Number of deaths/1000 live births | 2013~2015 | World Bank | 192 | 1.767 | 93.933 | 24.143 | 21.736 |
| Under-5 mortality | Probability of deaths/1000 newborn baby | World Bank | 190 | 2.333 | 139.833 | 32.202 | 32.729 | |||
| Maternal mortality | The number of deaths/100,000 live births | World Bank | 179 | 3.000 | 1410.000 | 172.650 | 239.601 | |||
| Life expectancy at birth | Years | WHO | 182 | 50.900 | 83.767 | 71.323 | 7.855 | |||
| Independent variable | Quality of Government | Control of corruption | −2.5 ~2.5 | 2012~2014 | World Bank | 192 | −1.630 | 2.344 | −0.075 | 0.996 |
| Government effectiveness | 192 | −2.288 | 2.146 | −0.069 | 0.989 | |||||
| Rule of law | 194 | −2.392 | 1.996 | −0.071 | 0.984 | |||||
| Regulatory quality | 191 | −2.416 | 2.057 | −0.080 | 0.986 | |||||
| Voice and Accountability | 192 | −2.242 | 1.717 | −0.035 | 0.993 | |||||
| Quantity of Government | Public expenditure on health | % of GDP | 190 | 0.860 | 15.507 | 4.120 | 2.499 | |||
| Private spending on health | % of GDP | 190 | 0.116 | 9.450 | 2.629 | 1.523 | ||||
| Control variable | Education | Mean years of schooling | Years | UNDP | 186 | 1.400 | 14.000 | 8.286 | 3.127 | |
| Pre-existing health condition | Life expectancy at birth61~63 | Years | 1961~1963 | World Bank | 180 | 28.554 | 73.460 | 54.398 | 12.095 | |
| Fertility rate | - | Births per woman | 2012~2014 | 185 | 1.230 | 7.380 | 2.866 | 1.437 | ||
| Age structure | Ages 65 and older | % of Total population | 182 | 0.934 | 24.621 | 7.898 | 5.629 | |||
| Economic condition | GDP per capita | Current prices | 183 | 709 | 122,933 | 17,421 | 19,009 | |||
| Income inequality | GINI index | 0~100 | 148 | 16.600 | 63.267 | 38.341 | 8.104 | |||
| Political condition | Level of Democracy | 0~10 | Freedom House | 194 | 0.000 | 10.000 | 6.744 | 3.053 | ||
Table 3.
Correlation statistics.
| 1 | 2 | 3 | 4 | 5 | 6 | 7 | 8 | 9 | 10 | 11 | 12 | 13 | 14 | 15 | 16 | 17 | |
|---|---|---|---|---|---|---|---|---|---|---|---|---|---|---|---|---|---|
| 1. Infant mortality, deaths/1000 live births | 1 | ||||||||||||||||
| 2. Life expectancy | −0.931 ** | 1 | |||||||||||||||
| 3. Under-five mortality | 0.990 ** | −0.926 ** | 1 | ||||||||||||||
| 4. Maternal mortality | 0.887 ** | −0.852 ** | 0.910 ** | 1 | |||||||||||||
| 5. Control of corruption | −0.617 ** | 0.692 ** | −0.590 ** | −0.506 ** | 1 | ||||||||||||
| 6. Government effectiveness | −0.723 ** | 0.785 ** | −0.693 ** | −0.606 ** | 0.923 ** | 1 | |||||||||||
| 7. Rule of law | −0.661 ** | 0.720 ** | −0.632 ** | −0.537 ** | 0.950 ** | 0.946 ** | 1 | ||||||||||
| 8. Regulatory quality | −0.635 ** | 0.698 ** | −0.599 ** | −0.509 ** | 0.852 ** | 0.932 ** | 0.899 ** | 1 | |||||||||
| 9. Voice and accountability | −0.491 ** | 0.553 ** | −0.469 ** | −0.394 ** | 0.762 ** | 0.731 ** | 0.805 ** | 0.733 ** | 1 | ||||||||
| 10. Public expenditure on health | −0.424 ** | 0.546 ** | −0.412 ** | −0.381 ** | 0.552 ** | 0.468 ** | 0.584 ** | 0.416 ** | 0.613 ** | 1 | |||||||
| 11. Private expenditure on Health | 0.214 ** | −0.187 * | 0.208 ** | 0.266 ** | −0.152 * | −0.142 | −0.166 * | −0.044 | −0.056 | −0.132 | 1 | ||||||
| 12. Mean years of schooling | −0.792 ** | 0.776 ** | −0.790 ** | −0.727 ** | 0.617 ** | 0.717 ** | 0.671 ** | 0.647 ** | 0.555 ** | 0.504 ** | −0.142 | 1 | |||||
| 13. Life expectancy 61~63 | −0.815 ** | 0.805 ** | −0.802 ** | −0.741 ** | 0.653 ** | 0.751 ** | 0.696 ** | 0.688 ** | 0.608 ** | 0.558 ** | −0.118 | 0.900 ** | 1 | ||||
| 14. Fertility rate, total(births per woman) | 0.859 ** | −0.843 ** | 0.879 ** | 0.826 ** | −0.558 ** | −0.669 ** | −0.594 ** | −0.585 ** | −0.453 ** | −0.422 ** | 0.116 | −0.771 ** | −0.792 ** | 1 | |||
| 15. Ages 65 and older | −0.665 ** | 0.715 ** | −0.632 ** | −0.538 ** | 0.639 ** | 0.711 ** | 0.685 ** | 0.682 ** | 0.652 ** | 0.627 ** | −0.050 | 0.739 ** | 0.799 ** | −0.690 ** | 1 | ||
| 16. GDP per capita | −0.789 ** | 0.817 ** | −0.775 ** | −0.732 ** | 0.666 ** | 0.778 ** | 0.702 ** | 0.703 ** | 0.463 ** | 0.329 ** | −0.283 ** | 0.772 ** | 0.755 ** | −0.768 ** | 0.627 ** | 1 | |
| 17. GINI | 0.360 ** | −0.407 ** | 0.342 ** | 0.309 ** | −0.253 ** | −0.306 ** | −0.310 ** | −0.269 ** | −0.196 * | −0.187 * | 0.066 | −0.380 ** | −0.399 ** | 0.295 ** | −0.466 ** | −0.374 ** | 1 |
| 18. Level of democracy | −0.392 ** | 0.432 ** | −0.387 ** | −0.310 ** | 0.588 ** | 0.572 ** | 0.640 ** | 0.602 ** | 0.942 ** | 0.514 ** | 0.028 | 0.439 ** | 0.500 ** | −0.388 ** | 0.575 ** | 0.132 | −0.091 |
Note: * p < 0.05, ** p < 0.01.
Table 4.
Regression analysis with Newey–West standard errors.
| Model 1: Infant Mortality | Model 2: Life Expectancy | Model 3: Under-five Morality | Model 4: Maternal Mortality | |||||||
|---|---|---|---|---|---|---|---|---|---|---|
| Coef. (Newey–West S.E.) | t | Coef. (Newey–West S.E.) | t | Coef. (Newey–West S.E.) | t | Coef. (Newey–West S.E.) | t | |||
| Constant | 57.316 *** (10.393) | 5.51 | 57.611 *** (3.513) | 16.40 | 71.493 *** (15.535) | 4.60 | 314.308 * (149.538) | 2.10 | ||
| Indep. var. | Quality of govern-ment | Corruption control | 1.974 (1.768) | 1.12 | 0.457 (0.580) | 0.79 | 0.455 ** (2.750) | 0.17 | −3.747 (21.437) | −0.17 |
| Government effectiveness | −6.773 *** (1.846) | −3.67 | 2.563 *** (0.681) | 0.377 | −7.634 (2.664) | −2.87 | −35.236 (24.687) | −1.43 | ||
| Rule of law | 1.452 (2.392) | 0.61 | −1.298 (0.821) | −1.58 | 2.468 (3.686) | 0.67 | 17.407 (30.704) | 0.57 | ||
| Regulation quality | −0.102 (1.267) | −0.08 | −0.184 (0.513) | −0.36 | 0.869 (1.878) | 0.46 | 31.917 * (15.179) | 2.10 | ||
| Voice and accountability | 3.747 (3.357) | 1.12 | −0.835 (1.030) | −0.81 | 7.442 (4.657) | 1.60 | −32.573 (36.764) | −0.89 | ||
| Quantity of govern-ment | Public expenditure on health | −0.887 * (0.388) | −2.29 | 0.385 ** (0.144) | 2.67 | −1.335 * (0.540) | −2.47 | 0.986 (3.415) | 0.29 | |
| Private expenditure on health | 1.015 * (0.440) | 2.30 | −0.217+ (0.130) | −1.66 | 1.522 * (0.625) | 2.43 | 24.609 ** (9.108) | 2.70 | ||
| Control var. | Mean years of schooling | −0.120 (0.342) | −0.35 | −0.399 *** (0.119) | −3.34 | −0.679 (0.499) | −1.36 | 1.264 (4.459) | 0.28 | |
| Life expectancy at birth 1960s | −0.543 *** (0.104) | −5.24 | 0.161 *** (0.034) | 4.72 | −0.759 *** (0.152) | −5.00 | −8.471 *** (1.734) | −4.88 | ||
| Fertility rate | 6.903 *** (0.640) | 10.78 | −2.311 *** (0.217) | −10.66 | 12.885 *** (0.930) | 13.85 | 103.746 *** (8.098) | 12.81 | ||
| Ages 65 and older | 0.785 *** (0.160) | 4.92 | −0.220 *** (0.055) | −4.00 | 1.721 *** (0.231) | 7.46 | 18.786 *** (2.066) | 9.09 | ||
| GDP per capita | −3.320 *** (0.956) | −3.47 | 2.138 *** (0.299) | 7.15 | −4.496 ** (1.539) | −2.92 | −36.997 ** (13.996) | −2.64 | ||
| GINI index | 0.223 ** (0.086) | 2.60 | −0.146 *** (0.029) | −4.98 | 0.371 ** (0.122) | 3.05 | 2.628 * (1.131) | 2.32 | ||
| Democracy | −0.953 (0.854) | −1.12 | 0.317 (0.239) | 1.33 | −2.226+ (1.169) | −1.90 | 2.342 (10.162) | 0.23 | ||
| F-value | 168.88 *** | 268.23 *** | 141.10 *** | 71.50 *** | ||||||
| N | 430 | 430 | 432 | 432 | ||||||
Note: + p < 0.01, * p < 0.05, ** p < 0.01, *** p < 0.001.
Table 5.
Findings and implication.
| Findings | Implication |
|---|---|
| The quality and quantity of government have an impact on public health. | The role of government is critical for public health |
| Government effectiveness and public expenditure have a positive impact on life expectancy. | It needs to explore ways to design governments more efficiently and operate them strategically. Also, it requires effort to increase public spending on health. |
| The quality of government has a more decisive influence on public health than quantity of government | Before increasing finances for public health, it needs an approach to improve the quality of government. |
| Government effectiveness has the greatest impact on life expectancy, and second impact on other mortality rates. | In order to increase the life expectancy, it is important to create an effective government whereas in order to reduce the mortality rate, it needs a strategy to improve the quality of society. |
| The level of education, economy, and inequalities are affecting public health. | The government should make efforts to improve public health through investment in education, economic development, and decreasing inequality. |
© 2019 by the authors. Licensee MDPI, Basel, Switzerland. This article is an open access article distributed under the terms and conditions of the Creative Commons Attribution (CC BY) license (http://creativecommons.org/licenses/by/4.0/).
Share and Cite
MDPI and ACS Style
Kim, S.; Wang, J. Does Quality of Government Matter in Public Health?: Comparing the Role of Quality and Quantity of Government at the National Level. Sustainability 2019, 11, 3229. https://0-doi-org.brum.beds.ac.uk/10.3390/su11113229
AMA Style
Kim S, Wang J. Does Quality of Government Matter in Public Health?: Comparing the Role of Quality and Quantity of Government at the National Level. Sustainability. 2019; 11(11):3229. https://0-doi-org.brum.beds.ac.uk/10.3390/su11113229
Chicago/Turabian StyleKim, Sunhee, and Jaesun Wang. 2019. "Does Quality of Government Matter in Public Health?: Comparing the Role of Quality and Quantity of Government at the National Level" Sustainability 11, no. 11: 3229. https://0-doi-org.brum.beds.ac.uk/10.3390/su11113229
Note that from the first issue of 2016, this journal uses article numbers instead of page numbers. See further details here.