Analysing Stakeholder Consensus for a Sustainable Transport Development Decision by the Fuzzy AHP and Interval AHP


Abstract
:1. Introduction
2. Materials and Methods
2.1. Overall Methodology
- Conducting a questionnaire-based survey among the target groups and obtaining their preferences via comparison matrices of conditioning criteria.
- Structuring the FAHP based on the linguistic variables and obtaining the final fuzzy weight scores for all groups.
- Applying the IAHP for obtaining the weight scores for all groups based on the interval pairwise comparison matrices.
- Estimating the agreement degree among the target groups using the Kendall’s coefficient of concordance (W) based on the results of the FAHP and IAHP approaches.
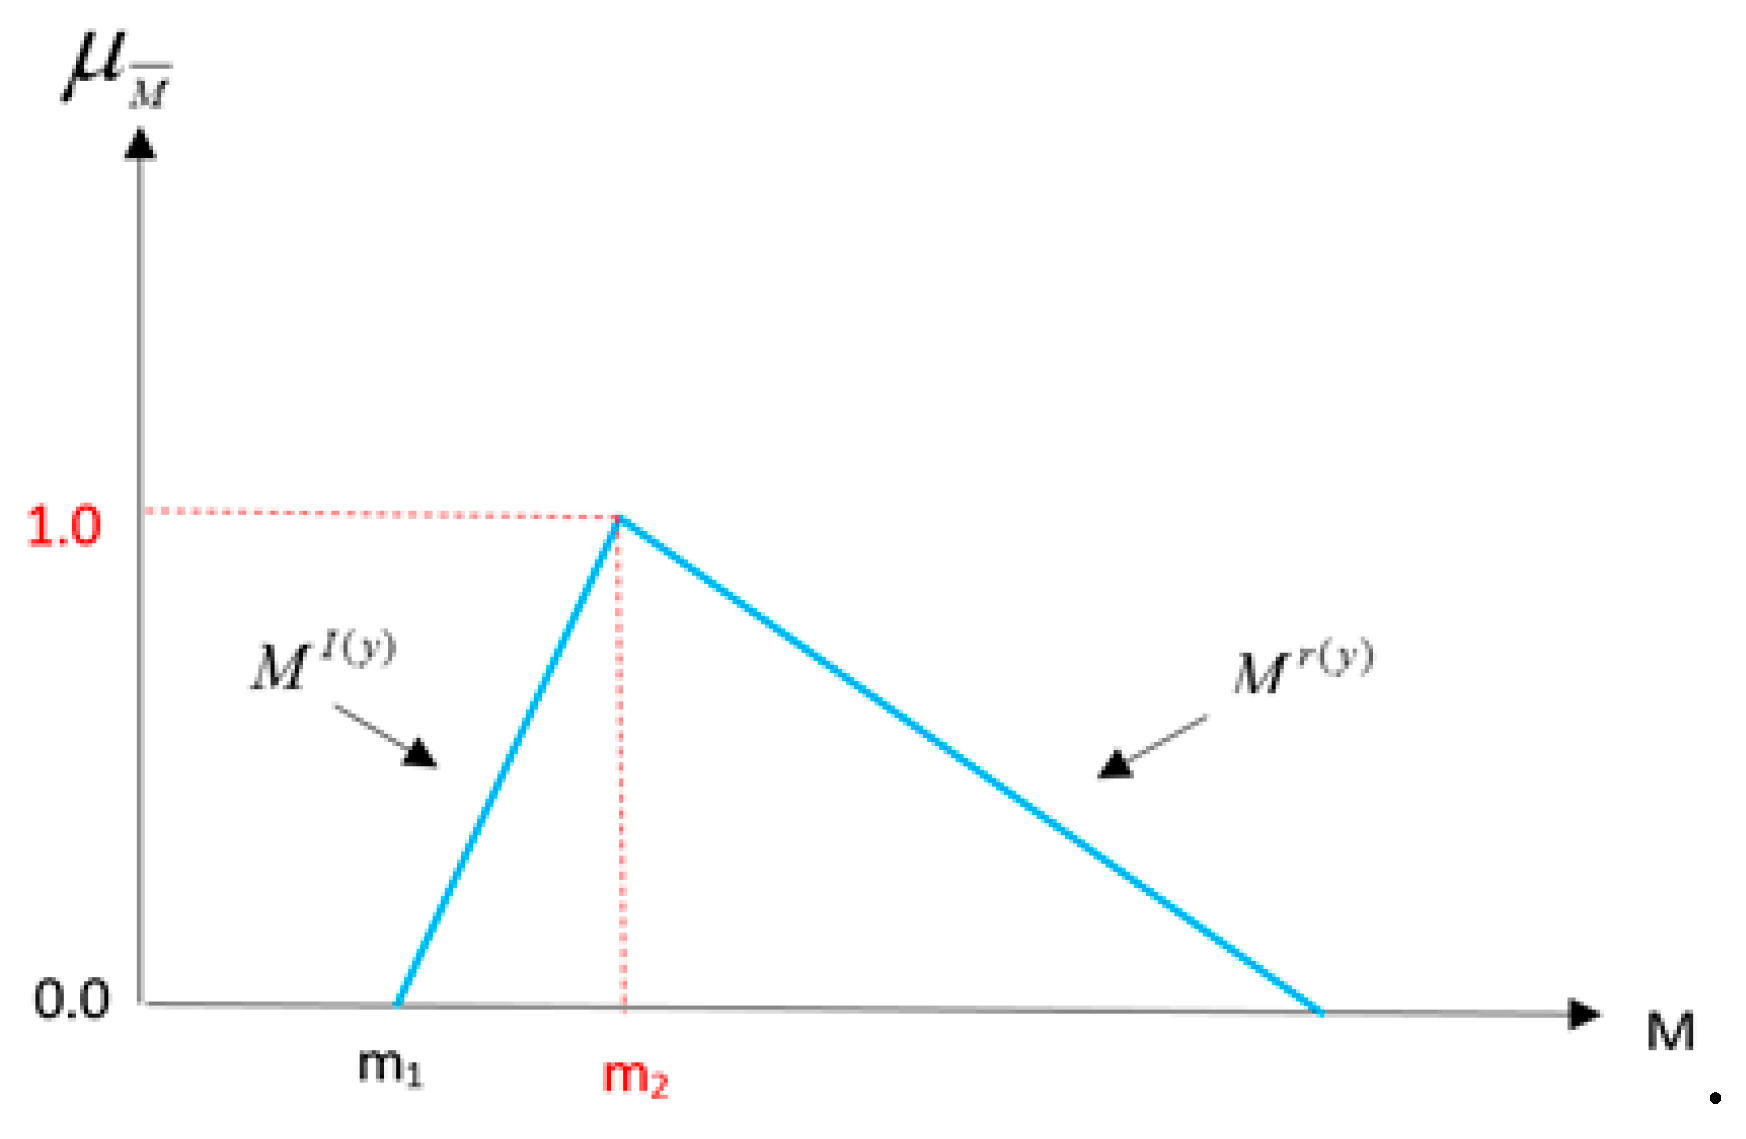
2.2. Fuzzy AHP
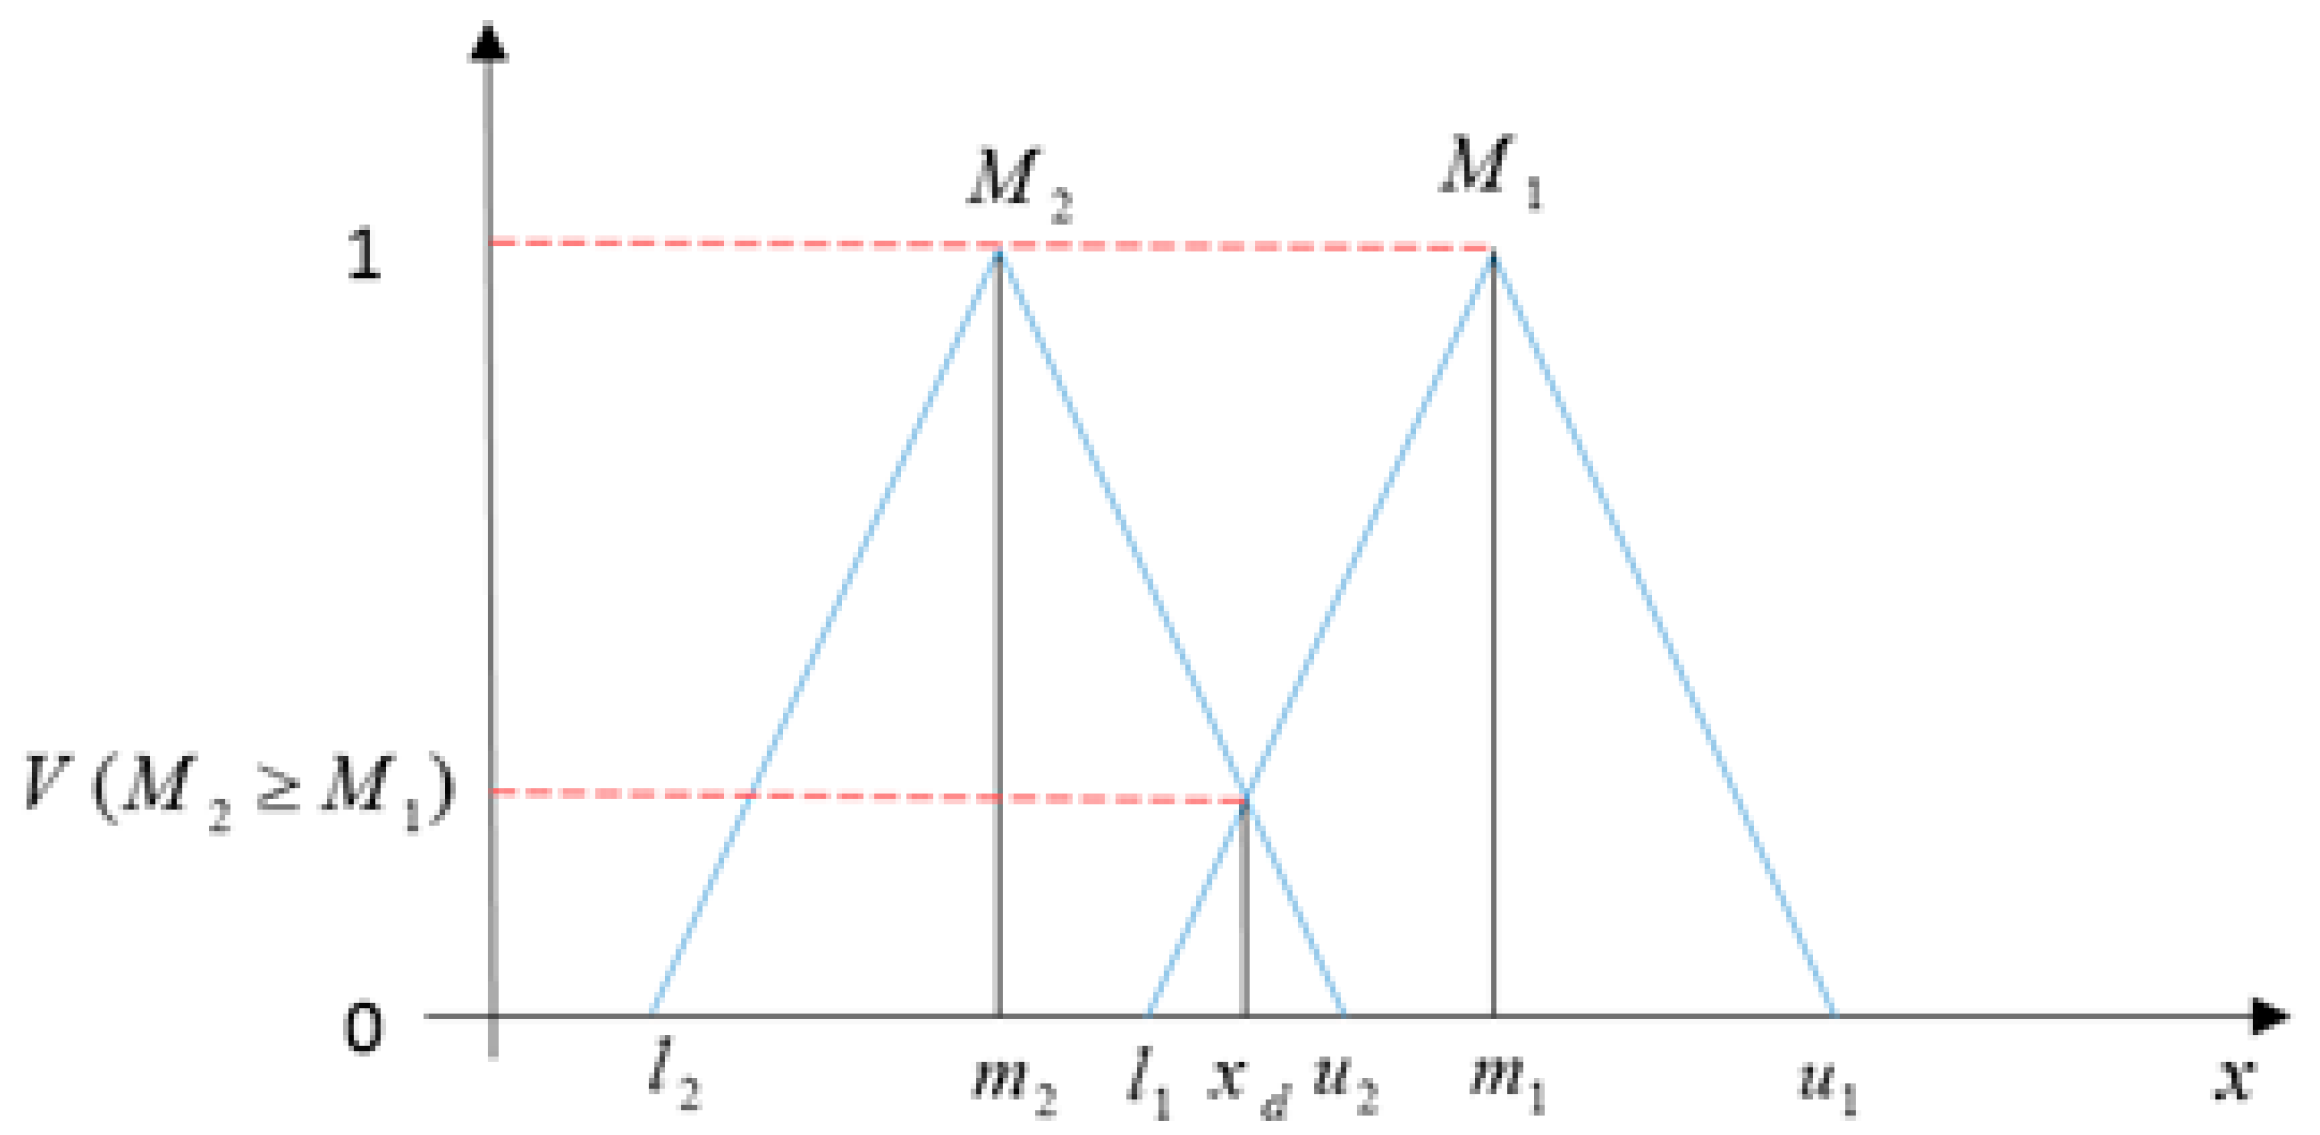
2.3. Interval AHP
2.4. Kendall’s Coefficient of Concordance (W)
3. Results of the Conducted Survey
- One hundred evaluators (10 government official workers in the relevant field + 45 regular users + 45 potential users) were asked among the total population of 1,773,852. The citizens were randomly selected at nearby bus stops in different districts of the city. The government experts are all members of the local municipality transportation department and have more than five years of experience in transport planning and policy. The number of evaluators is not statically representative; however, the MCDM provides a more in-depth insight based on PCs than a simple statistical survey [64]. Moreover, experiments proved [65] that in expressing preferences, a group consisting of over 20 randomly selected members behaves according to the phenomenon known as, “the wisdom of the crowd”. Thus, extreme opinions are filtered out, and the final decision becomes very reliable at this number of membership.
- The dynamic questionnaire was evaluated between October and December 2018 and analysed at the end of February 2019. Regular passengers, potential passengers and decision makers participated.
- For the computation, MS Excel was applied. We note that there are other possibilities for software such as MATLAB, Expert Choice, Super Decisions.
3.1. Results of Fuzzy AHP
3.2. Results of the Interval AHP
3.3. Results of Kendall’s Coefficient of Agreement (W)
4. Discussion
5. Conclusions
Author Contributions
Funding
Acknowledgments
Conflicts of Interest
References
- Hashim, H. Grassroots Participation in Local Planning Process. Master’s Thesis, Iowa State University, Ames, IA, USA, 1986, unpublished. [Google Scholar]
- Duleba, S.; Moslem, S. Examining Pareto optimality in analytic hierarchy process on real data: An application in public transport service development. Expert Syst. Appl. 2019, 116, 21–30. [Google Scholar] [CrossRef]
- Duleba, S.; Mishina, T.; Shimazaki, Y. A dynamic analysis on public bus transport’s supply quality by using AHP. Transport 2012, 27, 268–275. [Google Scholar] [CrossRef]
- Pérez, J. Some comments on Saaty’s AHP. Manag. Sci. 1995, 41, 1091–1095. [Google Scholar] [CrossRef]
- Fischer, J.W. Resources, Science, and Industry Division. Safe, Accountable, Flexible, Efficient Transportation Equity Act—A Legacy for Users (SAFETEA-LU Or SAFETEA): Selected Major Provisions. Libr. Congr. Congr. Res. Serv. 2005, 14, 59–109. [Google Scholar]
- Tosun, C. The roots of unsustainable tourism development at the local level: The case of Urgup in Turkey. Tour. Manag. 1998, 19, 595–610. [Google Scholar] [CrossRef]
- Benítez, J.; Delgado-Galván, X.; Izquierdo, J.; Pérez-García, R. Consistent completion of incomplete judgments in decision making using AHP. J. Comput. Appl. Math. 2015, 290, 412–422. [Google Scholar] [CrossRef]
- Shafabakhsh, G.; Hadjihoseinlou, M.; Taghizadeh, S.A. Selecting the appropriate public transportation system to access the Sari International Airport by fuzzy decision making. Eur. Transp. Res. Rev. 2014, 6, 277–285. [Google Scholar] [CrossRef]
- Mikusova, M. Proposal of benchmarking methodology for the area of public passenger transport. Period. Polytech. Transp. Eng. 2019, 47, 166–170. [Google Scholar] [CrossRef]
- Ha, M.H.; Yang, Z.; Lam, J.S.L. Port performance in container transport logistics: A multi-stakeholder perspective. Transp. Policy 2019, 73, 25–40. [Google Scholar] [CrossRef]
- Wang, H.; Jiang, Z.; Zhang, H.; Wang, Y.; Yang, Y.; Li, Y. An integrated MCDM approach considering demands-matching for reverse logistics. J. Clean. Prod. 2019, 208, 199–210. [Google Scholar] [CrossRef]
- Tripathy, P.; Khambete, A.K.; Chauhan, K.A. An Innovative Approach to Assess Sustainability of Urban Mobility—Using Fuzzy MCDM Method. In Innovative Research in Transportation Infrastructure; Springer: Singapore, 2019; pp. 55–63. [Google Scholar]
- Balaji, M.; Santhanakrishnan, S.; Dinesh, S.N. An Application of Analytic Hierarchy Process in Vehicle Routing Problem. Period. Polytech. Transp. Eng. 2018, 47, 196–205. [Google Scholar] [CrossRef] [Green Version]
- Shafiei, S.; Vaelizadeh, R.; Bertrand, F.; Ansari, M. Evaluating and Ranking of Travel Mode in Metropolitan. A Transportation Economic Approach. Civ. Eng. J. 2018, 4, 1303–1314. [Google Scholar] [CrossRef]
- Dudek, M.; Solecka, K.; Richter, M. A multi-criteria appraisal of the selection of means of urban user transport using the Electre and AHP methods. Czas. Tech. 2018, 6, 79–93. [Google Scholar]
- Moslem, S.; Duleba, S. Application of AHP for evaluating user demand for public transport improvements in Mersin, Turkey. Pollack Period. 2018, 13, 67–76. [Google Scholar] [CrossRef]
- Ma, F.; He, J.; Ma, J.; Xia, S. Evaluation of urban green transportation planning based on central point triangle whiten weight function and entropy-AHP. Transp. Res. Procedia 2017, 25, 3634–3644. [Google Scholar] [CrossRef]
- Murat, Y.S.; Arslan, T.; Cakici, Z.; Akçam, C. Analytical Hierarchy Process (AHP) based Decision Support System for Urban Intersections in Transportation Planning. In Using Decision Support Systems for Transportation Planning Efficiency; IGI Global, Gazi University: Ankara, Turkey, 2016; pp. 203–222. [Google Scholar] [Green Version]
- Wong, J.K.W.; Li, H. Application of the analytic hierarchy process (AHP) in multi-criteria analysis of the selection of intelligent building systems. Build. Environ. 2008, 43, 108–125. [Google Scholar] [CrossRef]
- Ghorbanzadeh, O.; Feizizadeh, B.; Blaschke, T.; Khosravi, R. Spatially Explicit Sensitivity and Uncertainty Analysis for the landslide risk assessment of the Gas Pipeline Networks. In Proceedings of the 21st AGILE conference on Geo-information science, Lund, Sweden, 12–15 June 2018; pp. 1–7. [Google Scholar]
- De Brito, M.M.; Evers, M.; Almoradie, A.D.S. Participatory flood vulnerability assessment: A multi-criteria approach. Hydrol. Earth Syst. Sci. 2018, 22, 373. [Google Scholar] [CrossRef]
- Jin, H.; Zhang, M.; Yuan, Y. Analytic network process-based multi-criteria decision approach and sensitivity analysis for temporary facility layout planning in construction projects. Appl. Sci. 2018, 8, 2434. [Google Scholar] [CrossRef]
- Hervás-Peralta, M.; Poveda-Reyes, S.; Molero, G.D.; Santarremigia, F.E.; Pastor-Ferrando, J.-P. Improving the performance of dry and maritime ports by increasing knowledge about the most relevant functionalities of the terminal operating system (TOS). Sustainability 2019, 11, 1648. [Google Scholar] [CrossRef]
- Ligmann-Zielinska, A.; Jankowski, P. Spatially-explicit integrated uncertainty and sensitivity analysis of criteria weights in multicriteria land suitability evaluation. Environ. Model. Softw. 2014, 57, 235–247. [Google Scholar] [CrossRef]
- Ghorbanzadeh, O.; Feizizadeh, B.; Blaschke, T. Multi-criteria risk evaluation by integrating an analytical network process approach into GIS-based sensitivity and uncertainty analyses. Geomat. Nat. Hazards Risk 2018, 9, 127–151. [Google Scholar] [CrossRef]
- Meena, S.R.; Ghorbanzadeh, O.; Blaschke, T. A comparative study of statistics-based landslide susceptibility models: A case study of the region affected by the Gorkha earthquake in Nepal. ISPRS Int. J. Geo-Inf. 2019, 8, 94. [Google Scholar] [CrossRef]
- Ha, M.H.; Yang, Z.; Heo, M.W. A new hybrid decision making framework for prioritising port performance improvement strategies. Asian J. Shipp. Logist. 2017, 33, 105–116. [Google Scholar] [CrossRef]
- Prasetyo, D.H.; Mohamad, J.; Fauzi, R. A GIS-based multi-criteria decision analysis approach for public school site selection in Surabaya, Indonesia. Geomatica 2018, 72, 69–84. [Google Scholar] [CrossRef]
- Chen, Y.; Wang, S.; Yao, J.; Li, Y.; Yang, S. Socially responsible supplier selection and sustainable supply chain development: A combined approach of total interpretive structural modeling and fuzzy analytic network process. Bus. Strategy Environ. 2018, 27, 1708–1719. [Google Scholar] [CrossRef]
- Grošelj, P.; Zadnik Stirn, L. Evaluation of several approaches for deriving weights in fuzzy group analytic hierarchy process. J. Decis. Syst. 2018, 27, 217–226. [Google Scholar] [CrossRef]
- Pourghasemi, H.R.; Pradhan, B.; Gokceoglu, C. Application of fuzzy logic and analytical hierarchy process (AHP) to landslide susceptibility mapping at Haraz watershed, Iran. Nat. Hazards 2012, 63, 965–996. [Google Scholar] [CrossRef]
- Fan, G.; Zhong, D.; Yan, F.; Yue, P. A hybrid fuzzy evaluation method for curtain grouting efficiency assessment based on an AHP method extended by D numbers. Expert Syst. Appl. 2016, 44, 289–303. [Google Scholar] [CrossRef]
- Pirnazar, M.; Karimi, A.Z.; Feizizadeh, B.; Ostad-Ali-Askari, K.; Eslamian, S.; Hasheminasab, H.; Ghorbanzadeh, O.; Hamedani, M.H. Assessing flood hazard using GIS based multi-criteria decision making approach; study area: East-Azerbaijan province (Kaleybar Chay basin). J. Flood Eng. 2017, 8, 203–223. [Google Scholar]
- Nazmfar, H.; Saredeh, A.; Eshgi, A.; Feizizadeh, B. Vulnerability evaluation of urban buildings to various earthquake intensities: A case study of the municipal zone 9 of Tehran. Hum. Ecol. Risk Assess. Int. J. 2019, 3, 1–20. [Google Scholar] [CrossRef]
- Razandi, Y.; Pourghasemi, H.R.; Neisani, N.S.; Rahmati, O. Application of analytical hierarchy process, frequency ratio, and certainty factor models for groundwater potential mapping using GIS. Earth Sci. Inform. 2015, 8, 867–883. [Google Scholar] [CrossRef]
- Ghorbanzadeh, O.; Moslem, S.; Blaschke, T.; Duleba, S. Sustainable urban transport planning considering different stakeholder groups by an interval-AHP decision support model. Sustainability 2019, 11, 9. [Google Scholar] [CrossRef]
- Cabrera-Barona, P.; Ghorbanzadeh, O. Comparing classic and interval analytical hierarchy process methodologies for measuring area-level deprivation to analyze health inequalities. Int. J. Environ. Res. Public Health 2018, 15, 140. [Google Scholar] [CrossRef] [PubMed]
- Saaty, T.L. The Analytic Hierarchy Process; McGraw-Hill: New York, NY, USA, 1980. [Google Scholar]
- Duleba, S.; Moslem, S. Sustainable Urban Transport Development with Stakeholder Participation, an AHP-Kendall Model: A Case Study for Mersin. Sustainability 2018, 10, 3647. [Google Scholar] [CrossRef]
- Duleba, S. An AHP-ISM approach for considering public preferences in a public transport development decision. Transport 2019, 17, 1–10. [Google Scholar] [CrossRef]
- Farooq, D.; Moslem, S. Evaluation and Ranking of Driver Behavior Factors Related to Road Safety by Applying The Analytic Network Process. Period. Polytech. Transp. Eng. 2019, in press. [Google Scholar]
- Chowdhury, S.; Hadas, Y.; Gonzalez, V.A.; Schot, B. Public transport users’ and policy makers’ perceptions of integrated public transport systems. Transp. Policy 2018, 61, 75–83. [Google Scholar] [CrossRef]
- Kumar, A.; Pal, A.; Vohra, A.; Gupta, S.; Manchanda, S.; Dash, M.K. Construction of Capital Procurement Decision Making Models to Optimize Supplier Selection Using Fuzzy Delphi and AHP-DEMATEL. Benchmarking Int. J. 2018, 25, 1528–1547. [Google Scholar] [CrossRef]
- Feizizadeh, B. A Novel Approach of Fuzzy Dempster–Shafer Theory for Spatial Uncertainty Analysis and Accuracy Assessment of Object-Based Image Classification. IEEE Geosci. Remote Sens. Lett. 2018, 15, 18–22. [Google Scholar] [CrossRef]
- Abastante, F.; Corrente, S.; Greco, S.; Ishizaka, A.; Lami, I.M. Choice architecture for architecture choices: Evaluating social housing initiatives putting together a parsimonious AHP methodology and the Choquet integral. Land Use Policy 2018, 78, 748–762. [Google Scholar] [CrossRef] [Green Version]
- Haghighathoseini, A.; Bobarshad, H.; Saghafi, F.; Rezaei, M.S.; Bagherzadeh, N. Hospital enterprise Architecture Framework (Study of Iranian University Hospital Organization). Int. J. Med. Inform. 2018, 114, 88–100. [Google Scholar] [CrossRef] [PubMed]
- Gupta, V. Comparative performance of contradictory and non-contradictory judgement matrices in AHP under qualitative and quantitative metrics. Int. J. Decis. Support Syst. Technol. (IJDSST) 2018, 10, 21–38. [Google Scholar] [CrossRef]
- Tan, R.R.; Aviso, K.B.; Huelgas, A.P.; Promentilla, M.A.B. Fuzzy AHP approach to selection problems in process engineering involving quantitative and qualitative aspects. Process Saf. Environ. Prot. 2014, 92, 467–475. [Google Scholar] [CrossRef]
- Saaty, T.L. Transport planning with multiple criteria: The analytic hierarchy process applications and progress review. J. Adv. Transp. 1995, 29, 81–126. [Google Scholar] [CrossRef]
- Triantaphyllou, E.; Mann, S.H. Using the analytic hierarchy process for decision making in engineering applications: Some challenges. Int. J. Ind. Eng. Appl. Pract. 1995, 2, 35–44. [Google Scholar]
- Bandler, W.; Kohout, L. Fuzzy power sets and fuzzy implication operators. Fuzzy Sets Syst. 1980, 4, 13–30. [Google Scholar] [CrossRef]
- Turner Ii, B.L. Response to Thrift’s “The future of geography”. Geoforum 2002, 33, 427–429. [Google Scholar] [CrossRef]
- Zadeh, L.A. Fuzzy sets. Inf. Control 1965, 8, 338–353. [Google Scholar] [CrossRef] [Green Version]
- Balezentiene, L.; Streimikiene, D.; Balezentis, T. Fuzzy decision support methodology for sustainable energy crop selection. Renew. Sustain. Energy Rev. 2013, 17, 83–93. [Google Scholar] [CrossRef]
- Bui, K.T.; Bui, D.T.; Zou, J.; Van Doan, C.; Revhaug, I. A novel hybrid artificial intelligent approach based on neural fuzzy inference model and particle swarm optimization for horizontal displacement modeling of hydropower dam. Neural Comput. Appl. 2018, 29, 1495–1506. [Google Scholar] [CrossRef]
- Feizizadeh, B.; Blaschke, T.; Roodposhti, M.S. Integrating GIS Based Fuzzy Set Theory in Multicriteria Evaluation Methods for Landslide Susceptibility Mapping. Int. J. GeoInform. 2013, 9, 49–57. [Google Scholar]
- Ghorbanzadeh, O.; Feizizadeh, B.; Blaschke, T. An interval matrix method used to optimize the decision matrix in AHP technique for land subsidence susceptibility mapping. Environ. Earth Sci. 2018, 77, 584. [Google Scholar] [CrossRef]
- Vidal, L.-A.; Marle, F.; Bocquet, J.-C. Using a Delphi process and the analytic hierarchy process (AHP) to evaluate the complexity of projects. Expert Syst. Appl. 2011, 38, 5388–5405. [Google Scholar] [CrossRef]
- Lehner, A.; Erlacher, C.; Schlögl, M.; Wegerer, J.; Blaschke, T.; Steinnocher, K. Can iso-defined urban sustainability indicators be derived from remote sensing: An expert weighting approach. Sustainability 2018, 10, 1268. [Google Scholar] [CrossRef]
- Fu, S.; Yan, X.; Zhang, D.; Zhang, M. Risk influencing factors analysis of arctic maritime transportation systems: A Chinese perspective. Marit. Policy Manag. 2018, 45, 439–455. [Google Scholar] [CrossRef]
- Liu, F. Acceptable consistency analysis of interval reciprocal comparison matrices. Fuzzy Sets Syst. 2009, 160, 2686–2700. [Google Scholar] [CrossRef]
- Kendall, M.G.; Smith, B.B. The problem of m rankings. Ann. Math. Stat. 1939, 10, 275–287. [Google Scholar] [CrossRef]
- Siegel, S. Nonparametric Statistics for the Behavioral Sciences; McGraw-Hill: New York, NY, USA, 1956. [Google Scholar]
- Saaty, T.L. A scaling method for priorities in hierarchical structures. J. Math. Psychol. 1977, 15, 234–281. [Google Scholar] [CrossRef]
- Solomon, M. Groupthink versus “The wisdom of crowds”: The social epistemology of deliberation and dissent. South. J. Philos. 2006, 44, 28–42. [Google Scholar] [CrossRef]
- Macharis, C.; De Witte, A.; Ampe, J. The Multi-Actor, Multi-Criteria Analysis Methodology (MAMCA) for the evaluation of transport projects: Theory and practice. J. Adv. Transp. 2008, 43, 183–202. [Google Scholar] [CrossRef]


| Combined Applications in Integration Models | References |
|---|---|
| AHP & MCS | Ligmann-Zielinska andJankowski, 2014 [24]; Ghorbanzadeh et al., 2018 [25] |
| AHP & FR & SMCE | Meena et al., 2019 [26] |
| Fuzzy theory & TOPSIS | Ha et al., 2017 [27] |
| Fuzzy theory & AHP | Prasetyo., 2018 [28]; Chen et al., [29]; Grošelj and Zadnik Stirn, 2018 [30]; Park et al., [31]; Fan et al., [32] |
| Fuzzy theory & ANP | Nazmfar et al., 2019 [34] |
| ANP & FR | Razandi et al., 2015 [35] |
| ANP & MCS | Ghorbanzadeh et al., 2018 [25] |
| Interval calculus & AHP | Ghorbanzadeh et al., 2019 [36]; Cabrera-Barona and Ghorbanzadeh et al., 2018 [37] |
| Linguistic Variables | Triangular Fuzzy Numbers | Reciprocal Triangular Fuzzy Numbers |
|---|---|---|
| Extremely strong | (9, 9, 9) | (1/9, 1/9, 1/9) |
| Very strong | (6, 7, 8) | (1/8, 1/7, 1/6) |
| Strong | (4, 5, 6) | (1/6, 1/5, 1/4) |
| Moderately strong | (2, 3, 4) | (1/4, 1/3, 1/2) |
| Equally strong | (1, 1, 1) | (1, 1, 1) |
| Intermediates | (7, 8, 9), (5, 6, 7), (3, 4, 5), (1, 2, 3) | (1/9, 1/8, 1/7), (1/7, 1/6, 1/5), (1/5, 1/4, 1/3), (1/3, 1/2, 1) |
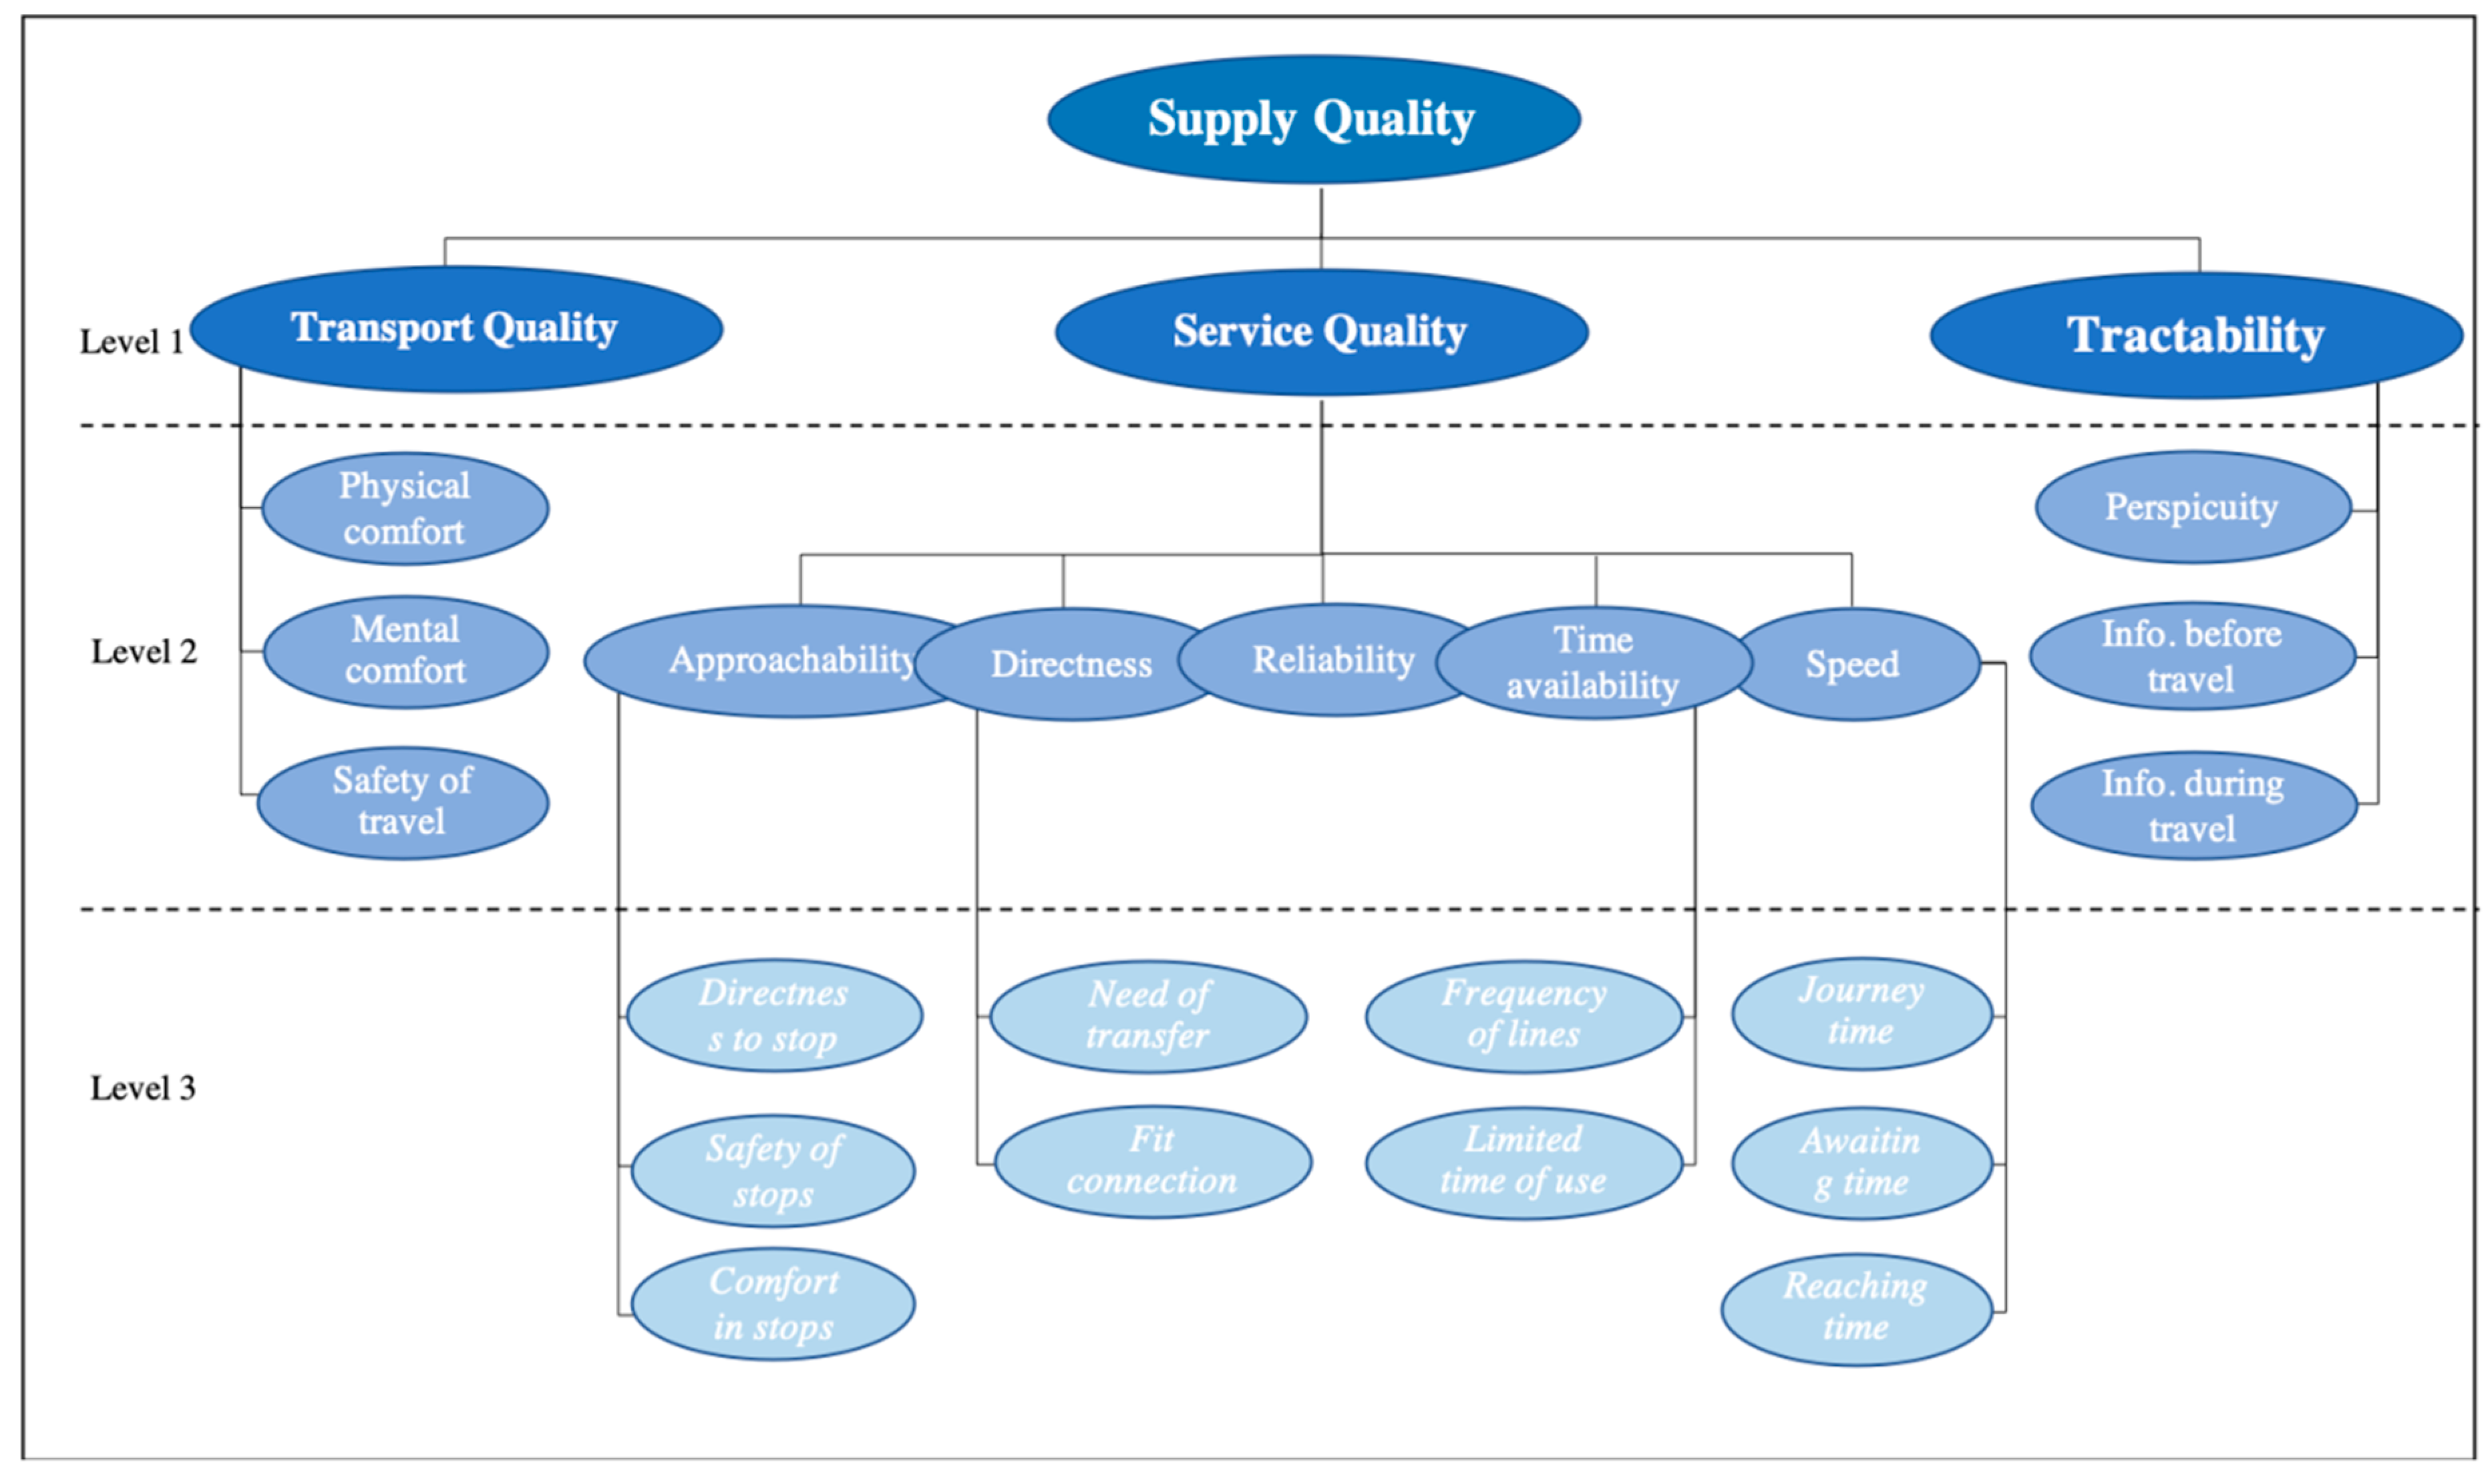
| Decision Elements (Criteria) | Level of Decision Elements | Description |
|---|---|---|
| Service quality | Level 1 | All service excluding transport services on the vehicle and information service |
| Transport quality | Level 1 | All service during the time spent on the public vehicle |
| Tractability | Level 1 | The provided information about the journey |
| Approachability | Level 2 | Service before starting the travel, accessing the lines |
| Directness | Level 2 | Reaching the destination without shifting vehicles |
| Time availability | Level 2 | The time frame when using a certain vehicle |
| Speed | Level 2 | The speed of the whole travel process |
| Reliability | Level 2 | On time arrivals, keeping the schedule |
| Physical comfort | Level 2 | The comfort of seats, physical space in the bus, air conditioning |
| Mental comfort | Level 2 | Environmental aspects, the behaviour of the driver and other passengers |
| Safety of travel | Level 2 | The perception of safety, the security of the journey |
| Perspicuity | Level 2 | A clear understanding of schedule and information |
| Information before travel | Level 2 | Amount and quality of information previously of the journey |
| Information during travel | Level 2 | Availability and quality of information on the vehicle |
| Distance to stops | Level 3 | Reaching the starting bus stop |
| Safety of stops | Level 3 | The security of bus stops in terms of road safety |
| Comfort in stops | Level 3 | Roof, heating and cooling systems, seats of the stops |
| Need of transfer | Level 3 | The need to change vehicles to the destination |
| Fit connection | Level 3 | On time connection between bus lines or between other types of public transport (trains) |
| Frequency of lines | Level 3 | Scheduled and realised the frequency of the buses |
| The limited time of use | Level 3 | The time frame between the first and the last line of the day |
| Journey Time | Level 3 | Time spent on the vehicle |
| Awaiting time | Level 3 | Waiting time for the proper line |
| Time to reach stops | Level 3 | Time to reach the departure bus stop |
| W | Interpretation |
|---|---|
| 0 | No agreement |
| 0.10 | Weak agreement |
| 0.30 | Moderate agreement |
| 0.60 | Strong agreement |
| 1 | Perfect agreement |
| Rank | Regular Users | Potential Users | Government | |||
|---|---|---|---|---|---|---|
| Criteria | Scores | Criteria | Scores | Criteria | Scores | |
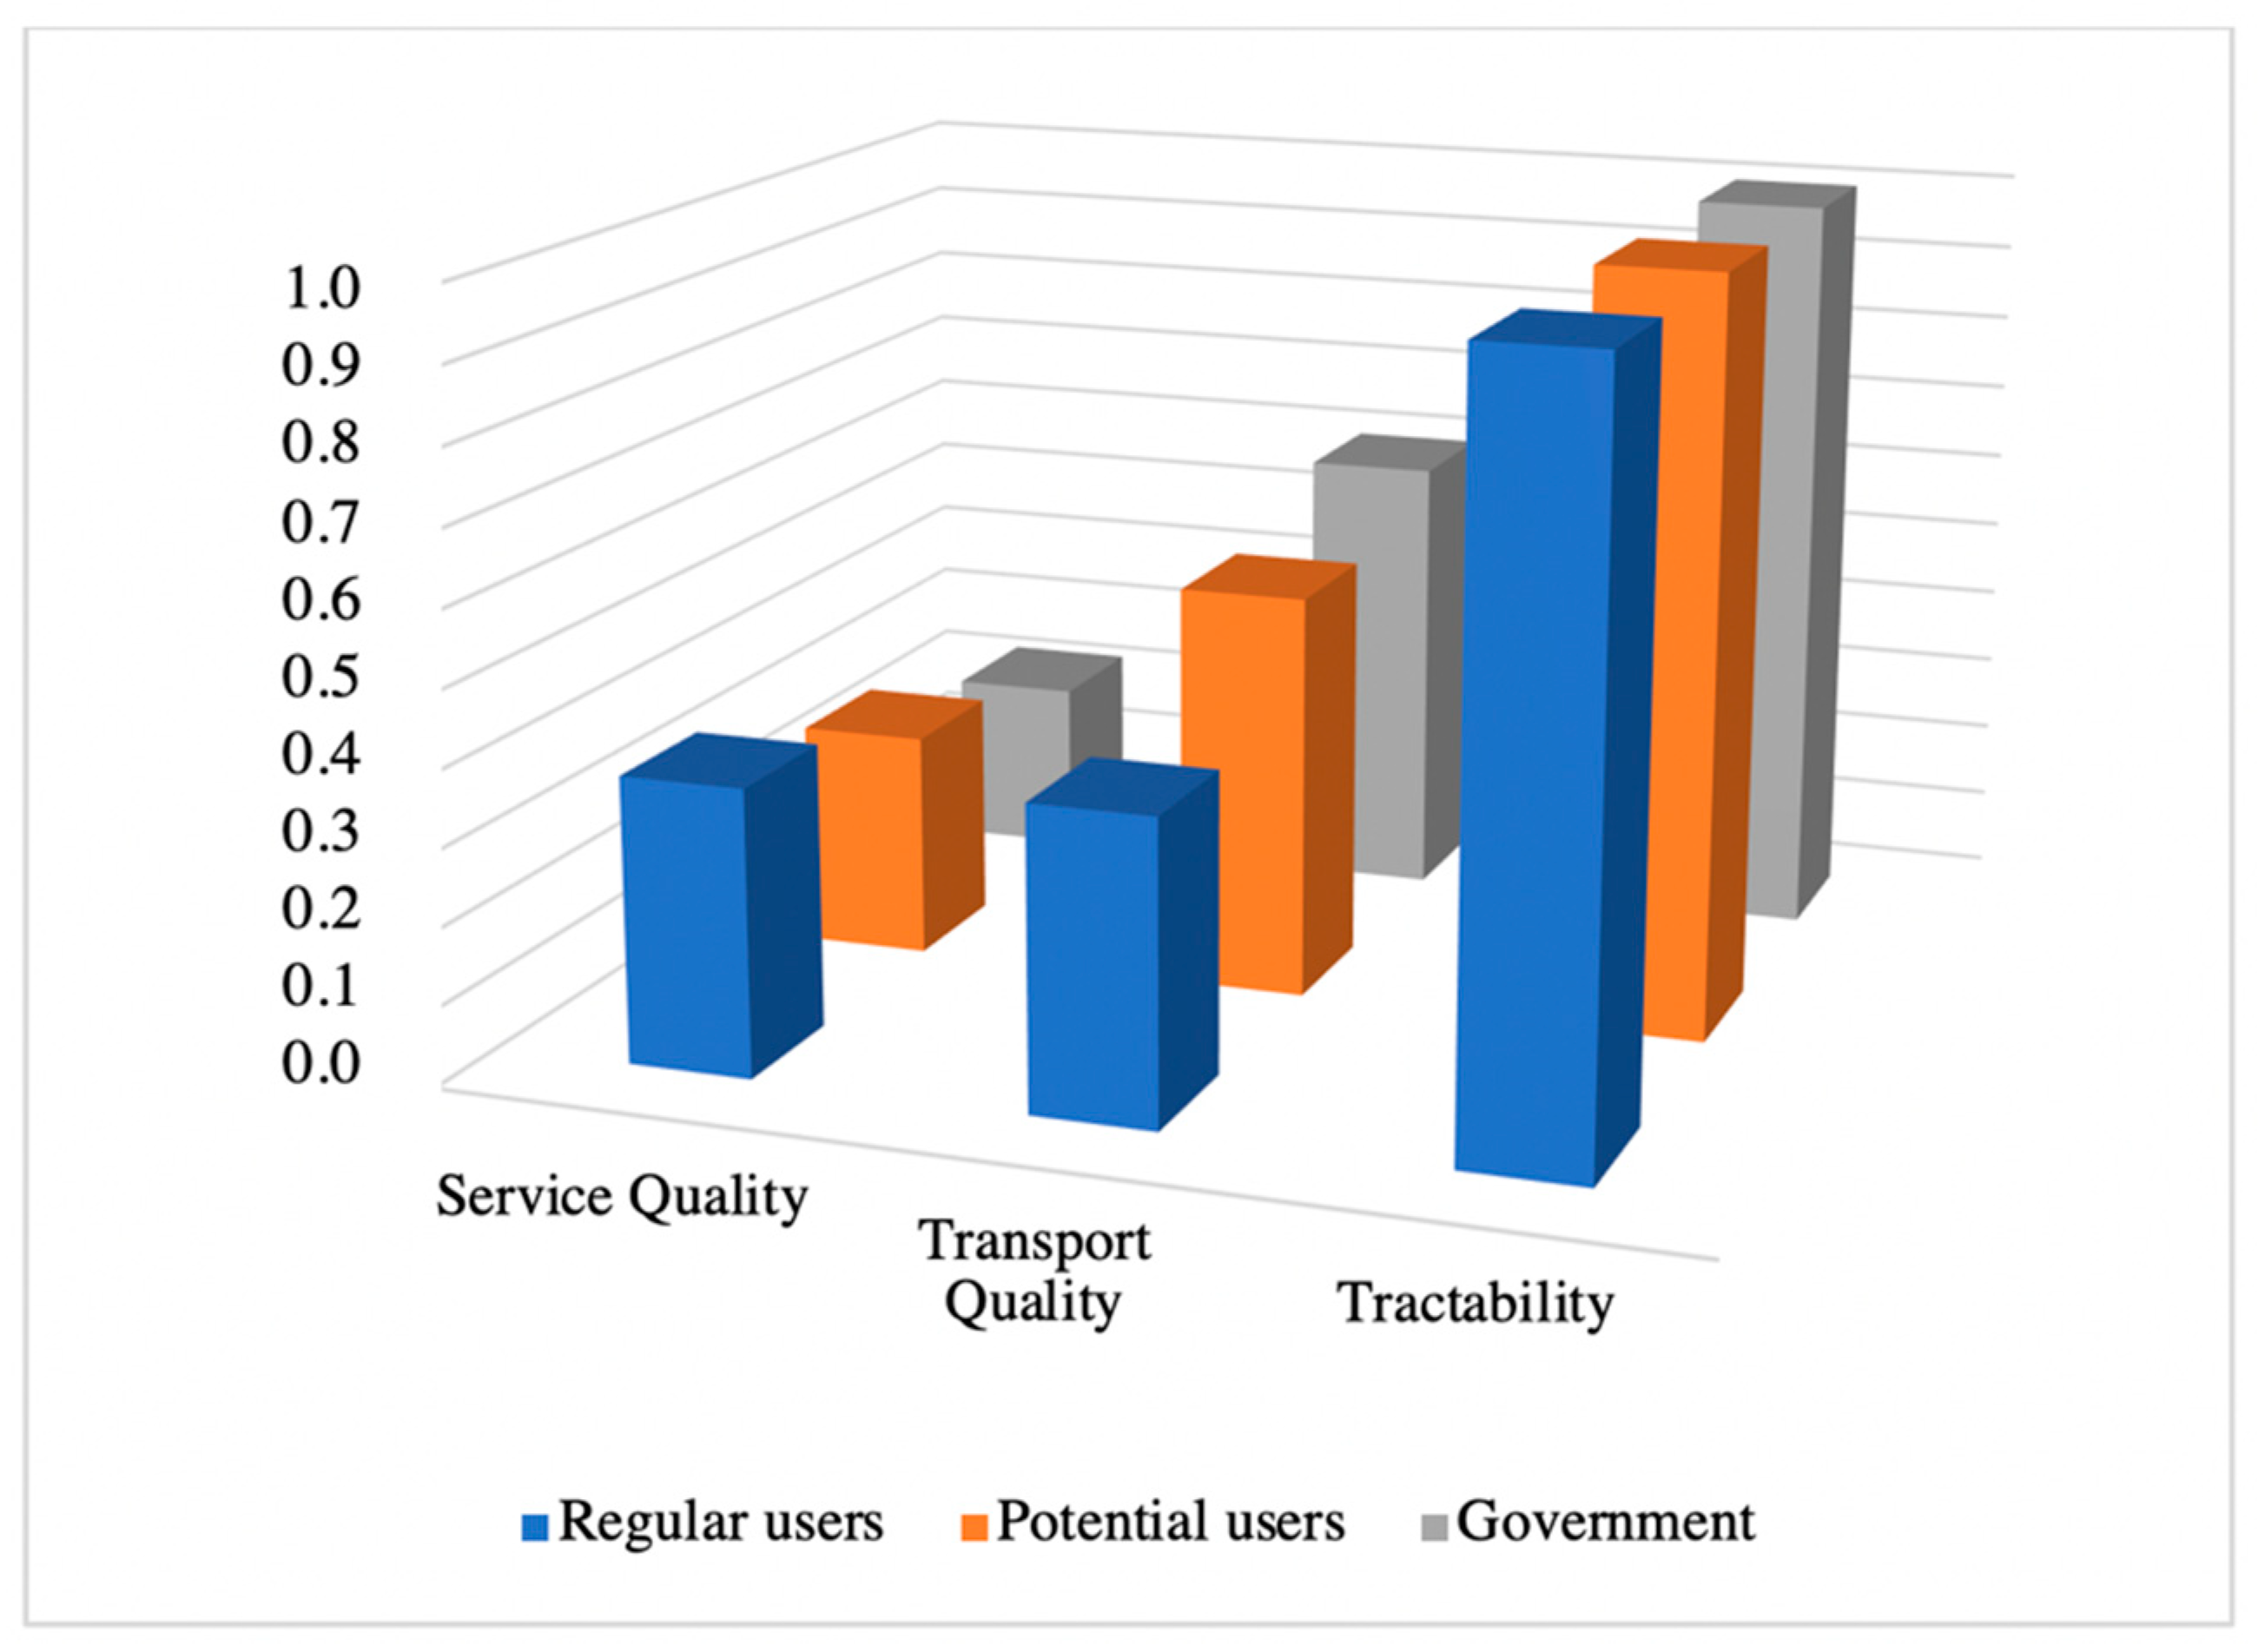
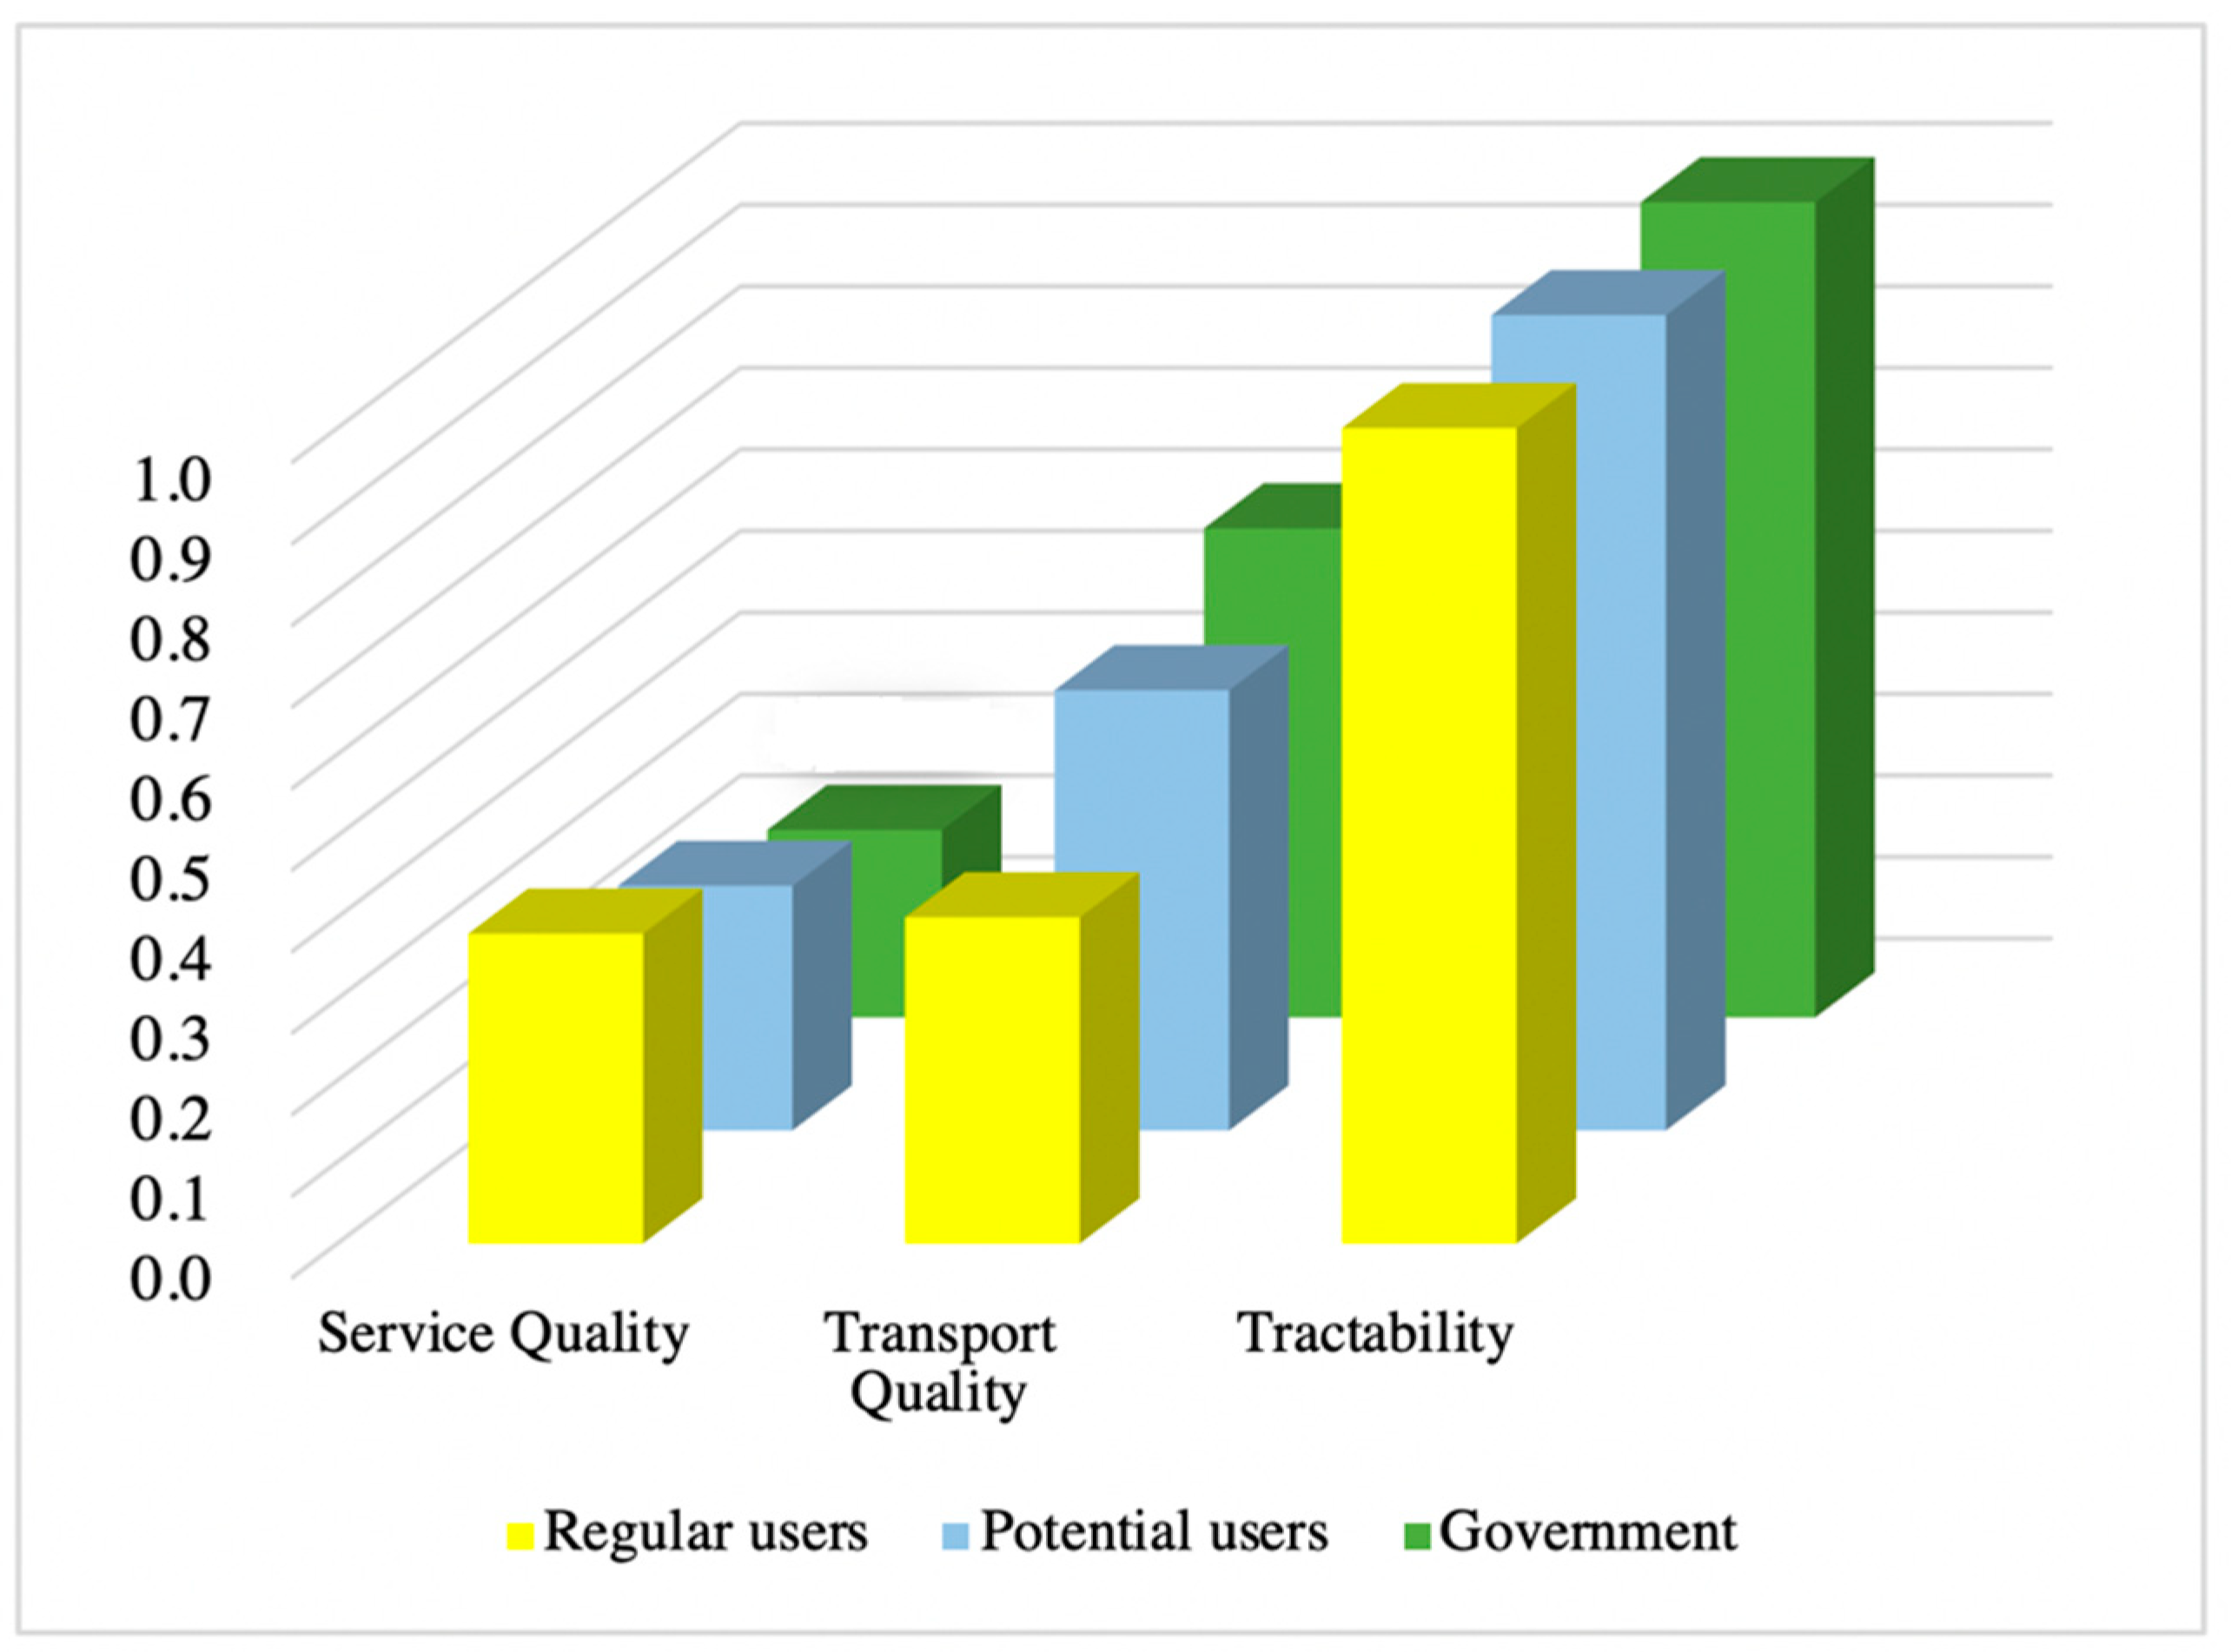
| 1 | Tractability | 0.595 | Tractability | 0.623 | Tractability | 0.607 |
| 2 | Service quality | 0.246 | Transport quality | 0.311 | Transport quality | 0.336 |
| 3 | Transport quality | 0.244 | Service quality | 0.155 | Service quality | 0.161 |
| Rank | Regular Users | Potential Users | Government | |||
|---|---|---|---|---|---|---|
| Criteria | Final Scores | Criteria | Final Scores | Criteria | Final Scores | |
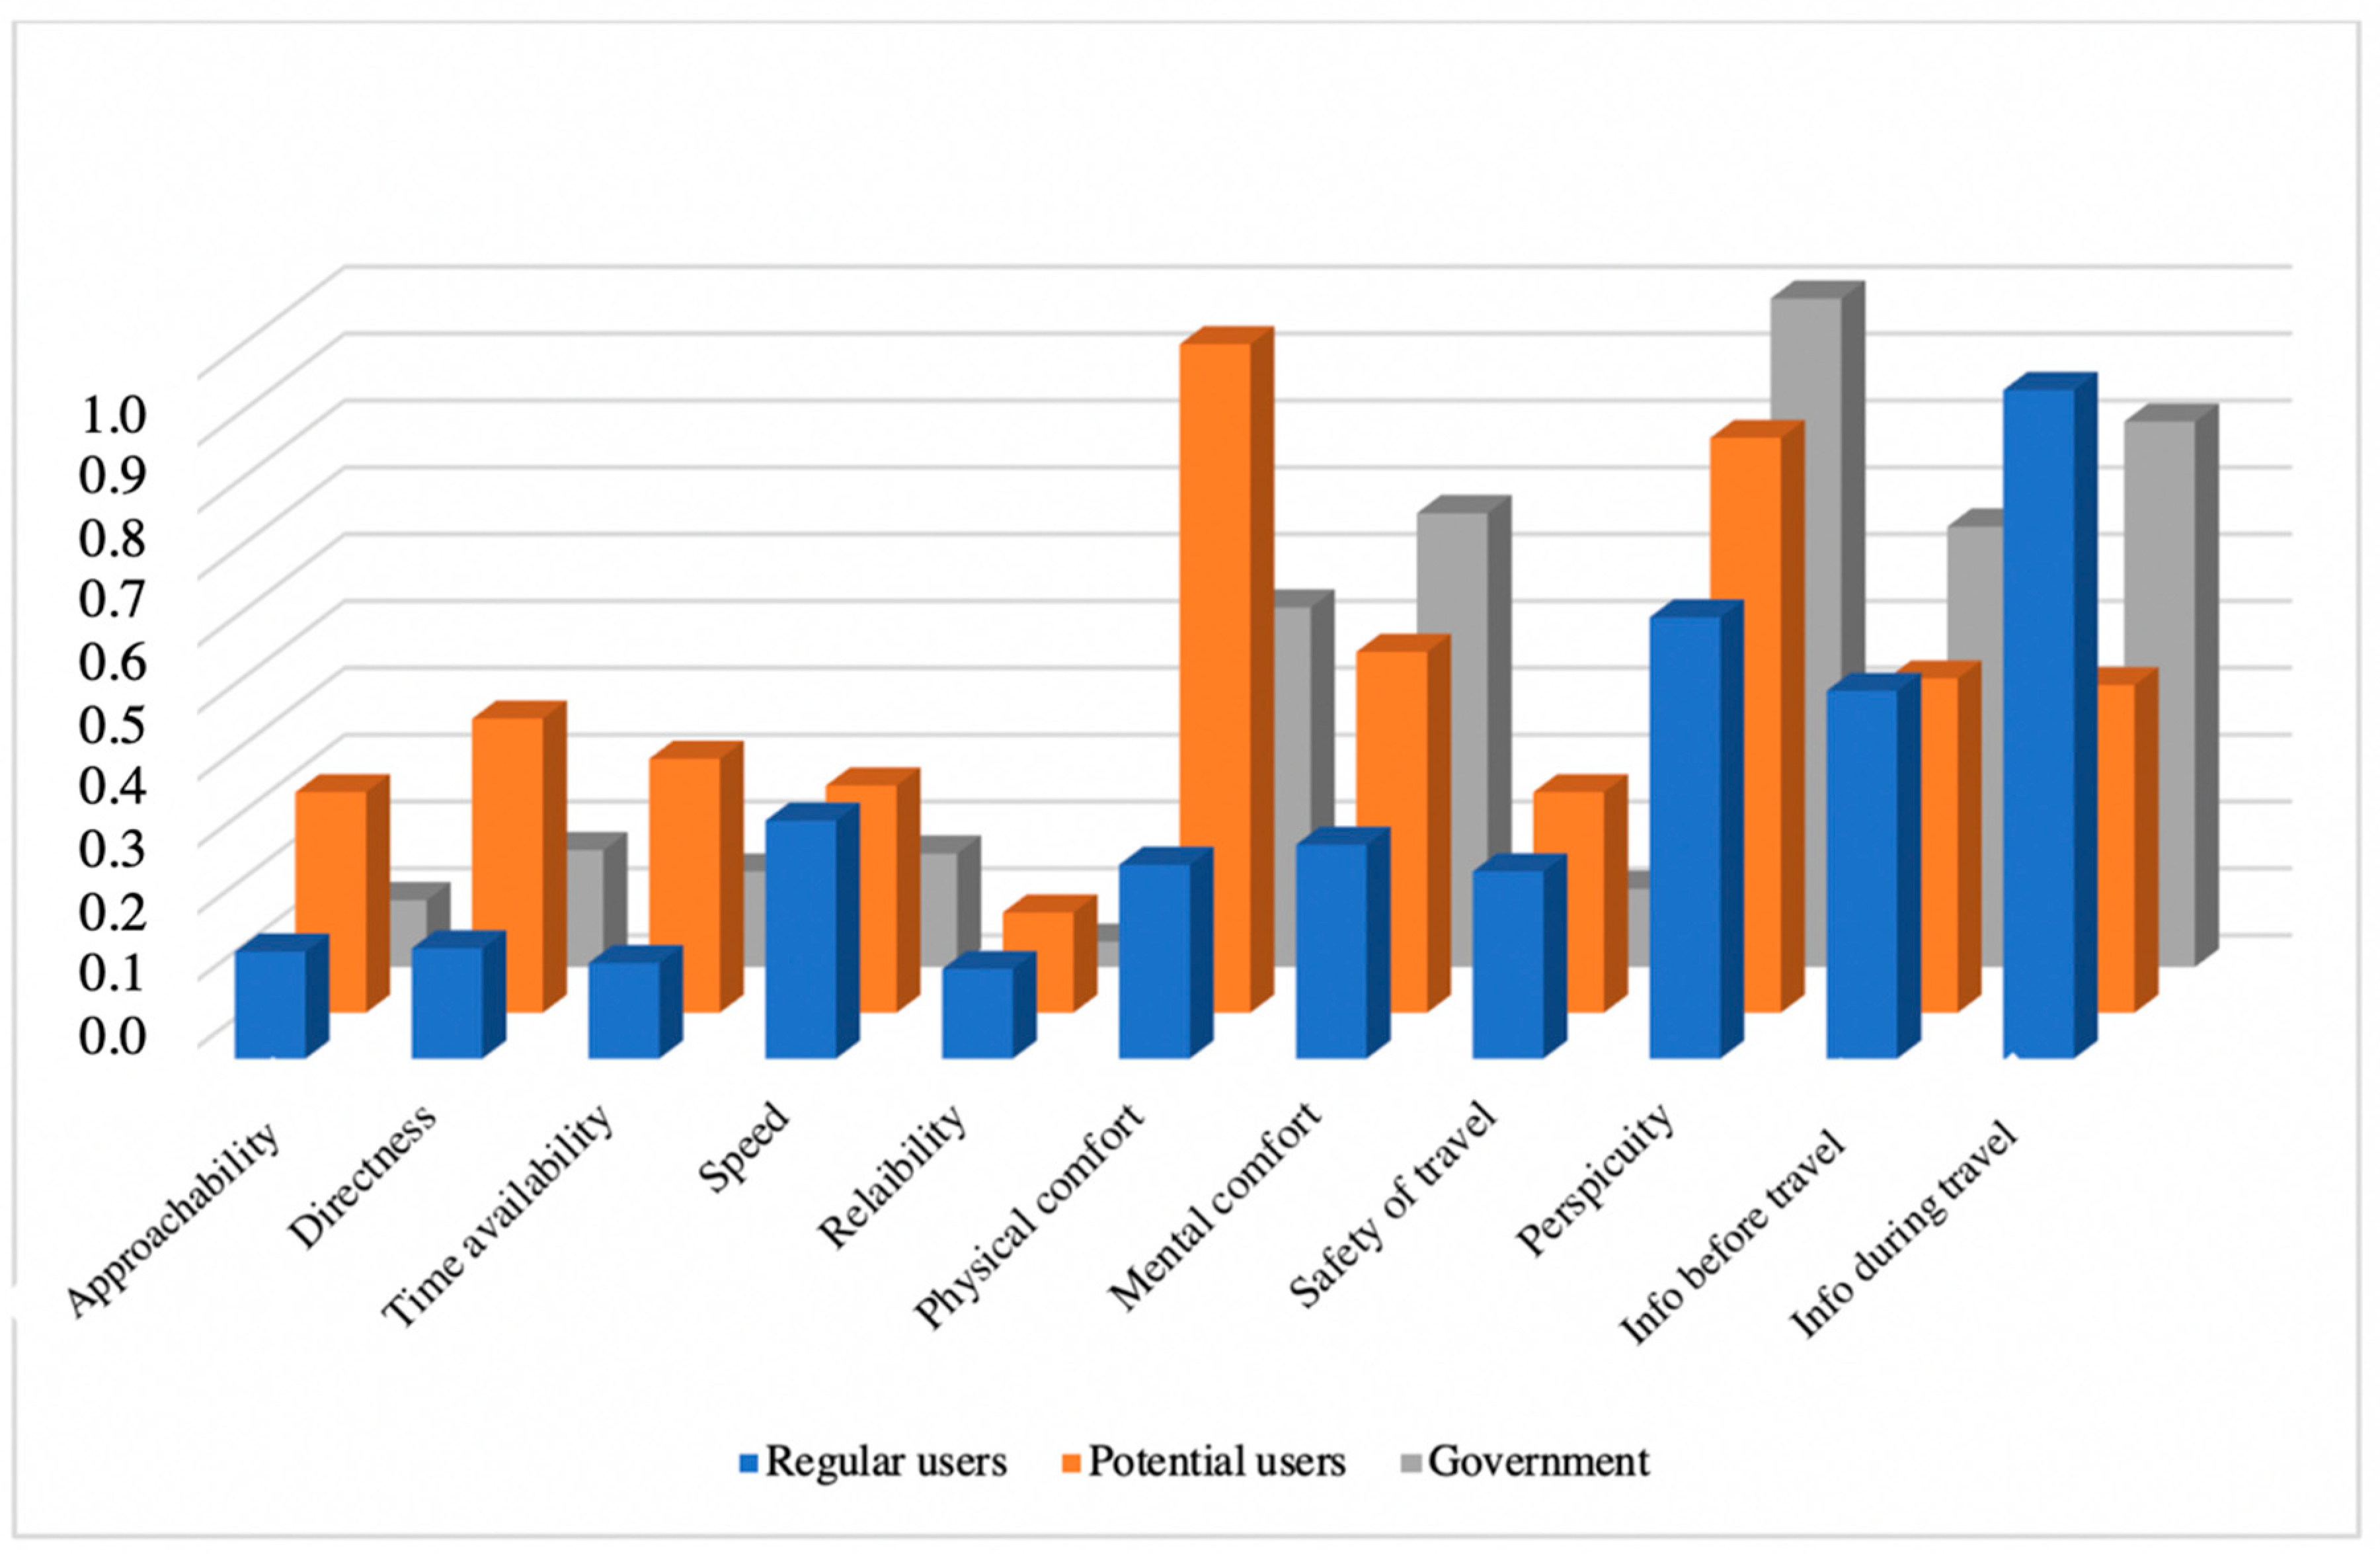
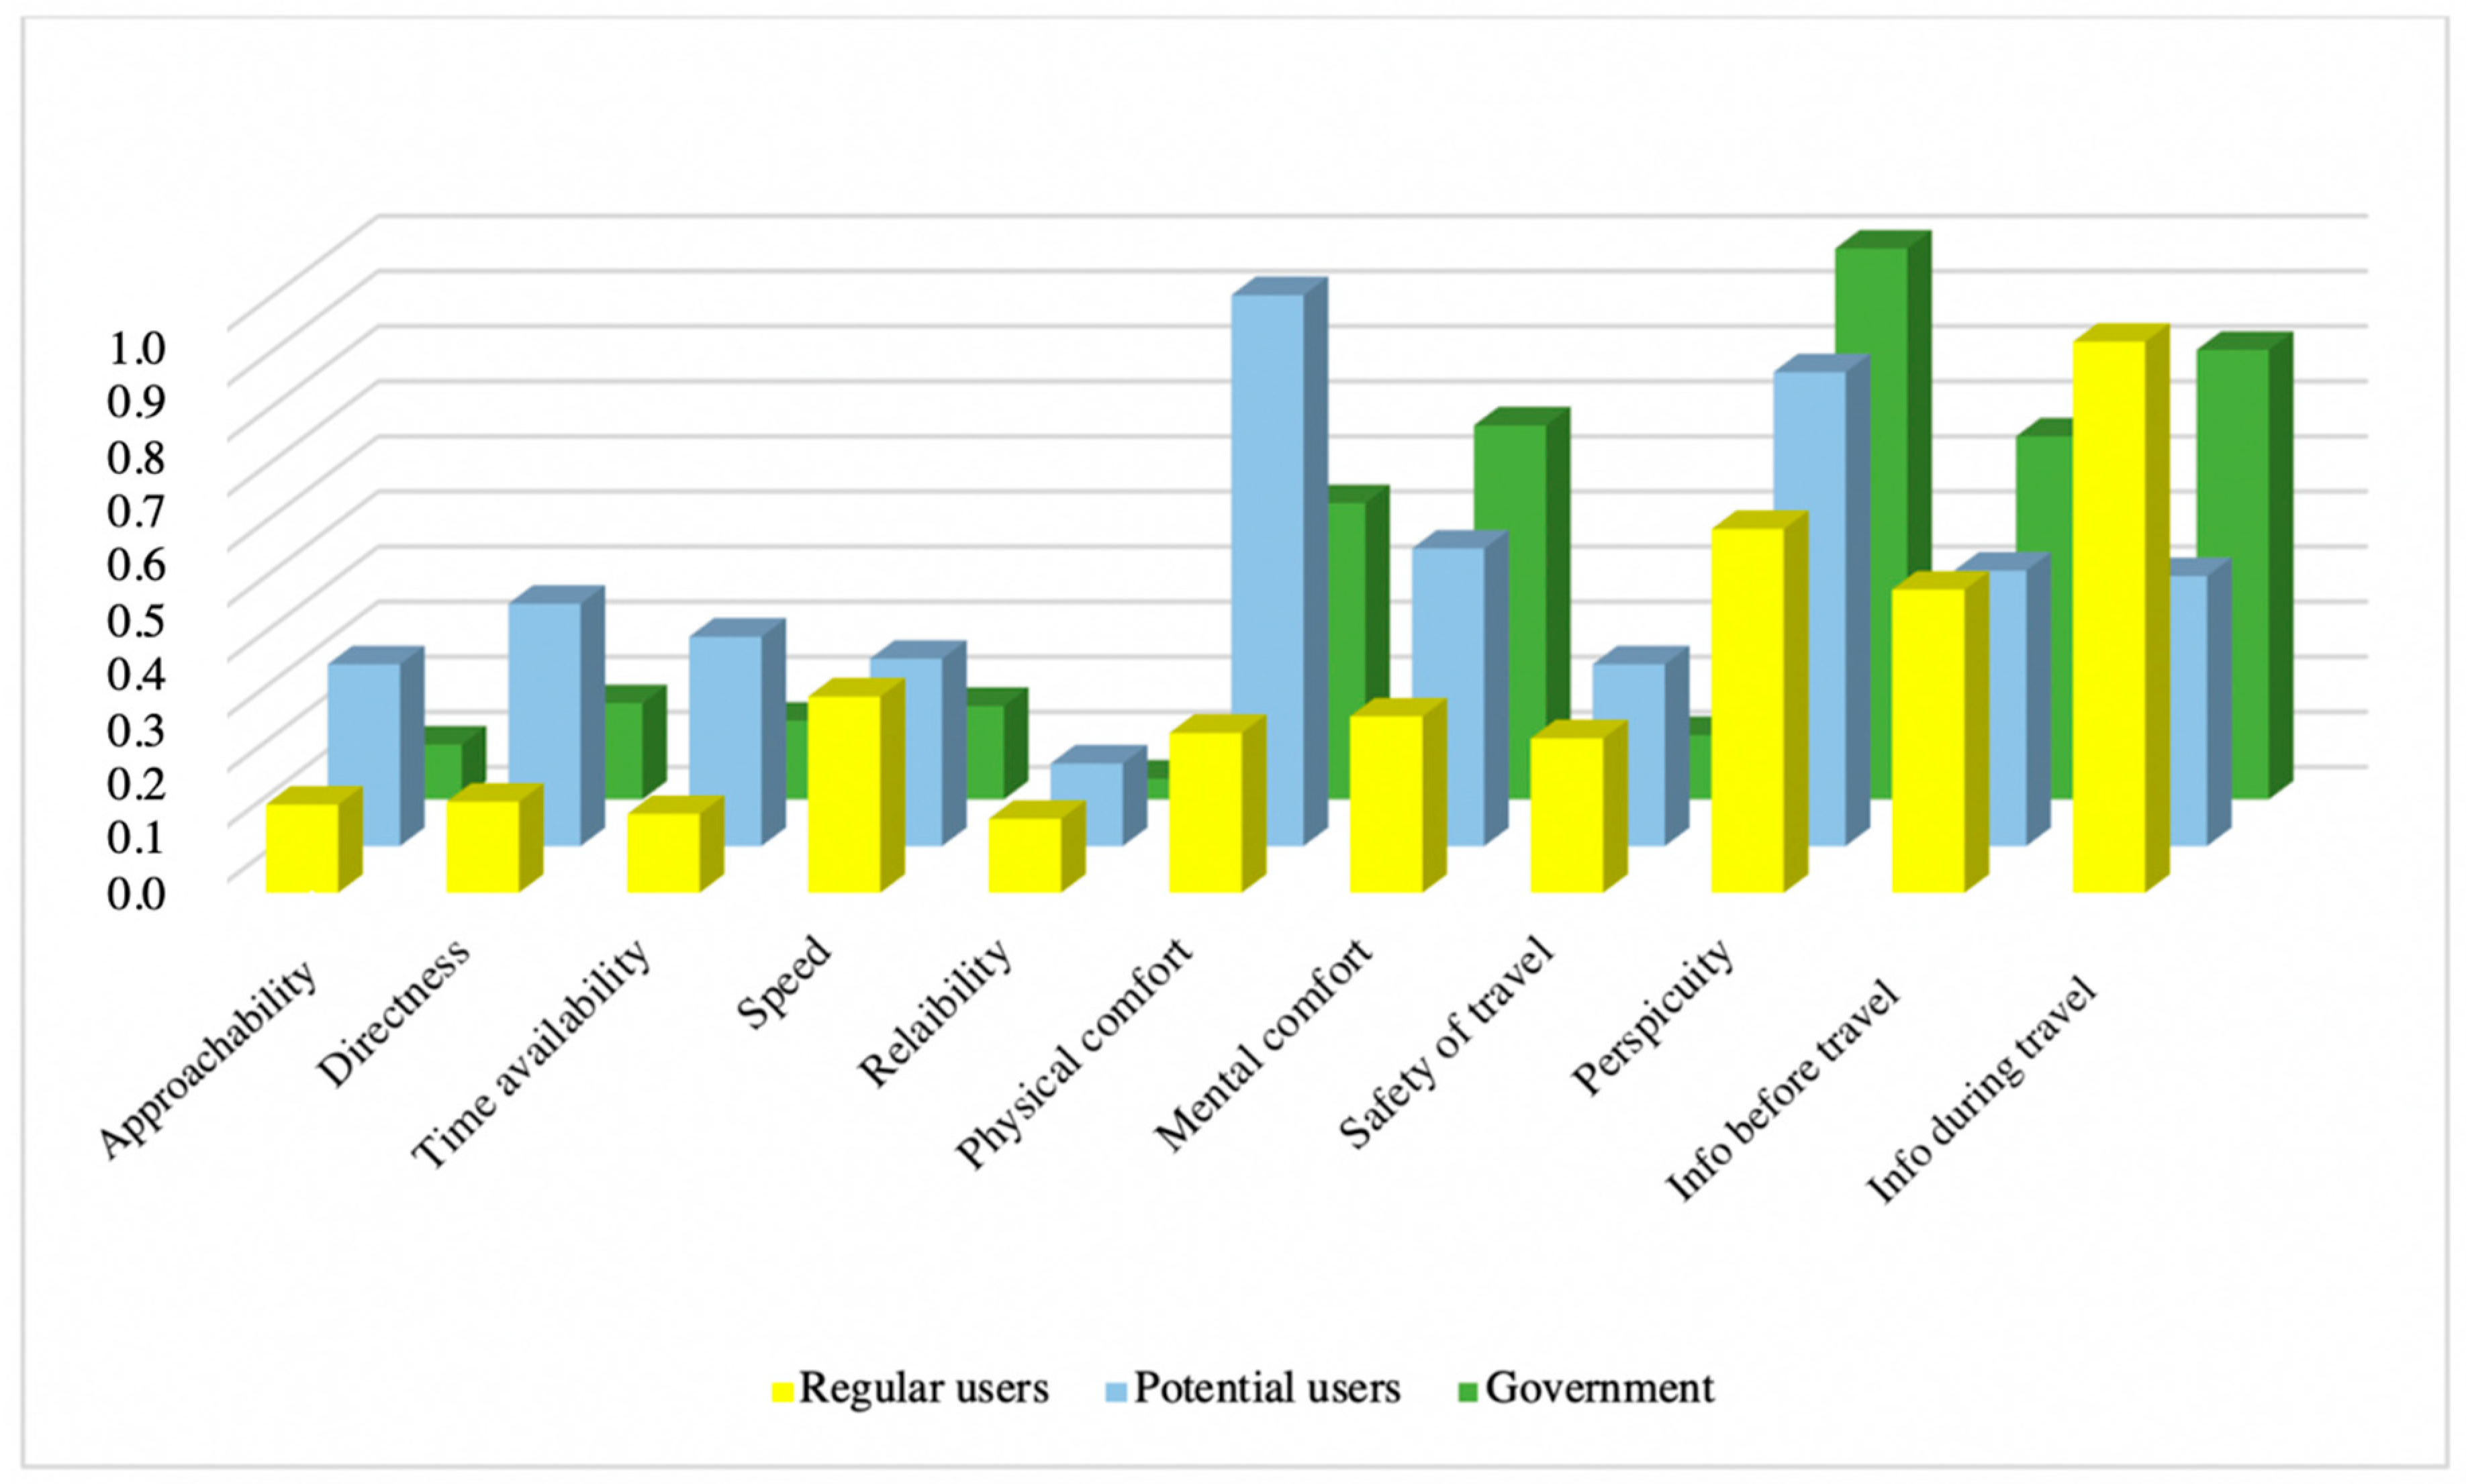
| 1 | Information during travel | 0.284 | Physical comfort | 0.204 | Perspicuity | 0.269 |
| 2 | Perspicuity | 0.185 | Perspicuity | 0.176 | Information during travel | 0.22 |
| 3 | Information before travel | 0.148 | Mental comfort | 0.113 | Mental comfort | 0.185 |
| 4 | Speed | 0.104 | Information before travel | 0.112 | Information before travel | 0.181 |
| 5 | Physical comfort | 0.086 | Directness | 0.099 | Physical comfort | 0.145 |
| 6 | Mental comfort | 0.086 | Information during travel | 0.098 | Speed | 0.049 |
| 7 | Safety of travel | 0.077 | Time availability | 0.076 | Directness | 0.048 |
| 8 | Directness | 0.0498 | Speed | 0.073 | Time availability | 0.038 |
| 9 | Approachability | 0.045 | Approachability | 0.071 | Safety of travel | 0.032 |
| 10 | Time availability | 0.043 | Safety of travel | 0.069 | Approachability | 0.025 |
| 11 | Reliability | 0.039 | Reliability | 0.035 | Reliability | 0.012 |
| Rank | Regular Users | Potential Users | Government | |||
|---|---|---|---|---|---|---|
| Criteria | Final Scores | Criteria | Final Scores | Criteria | Final Scores | |
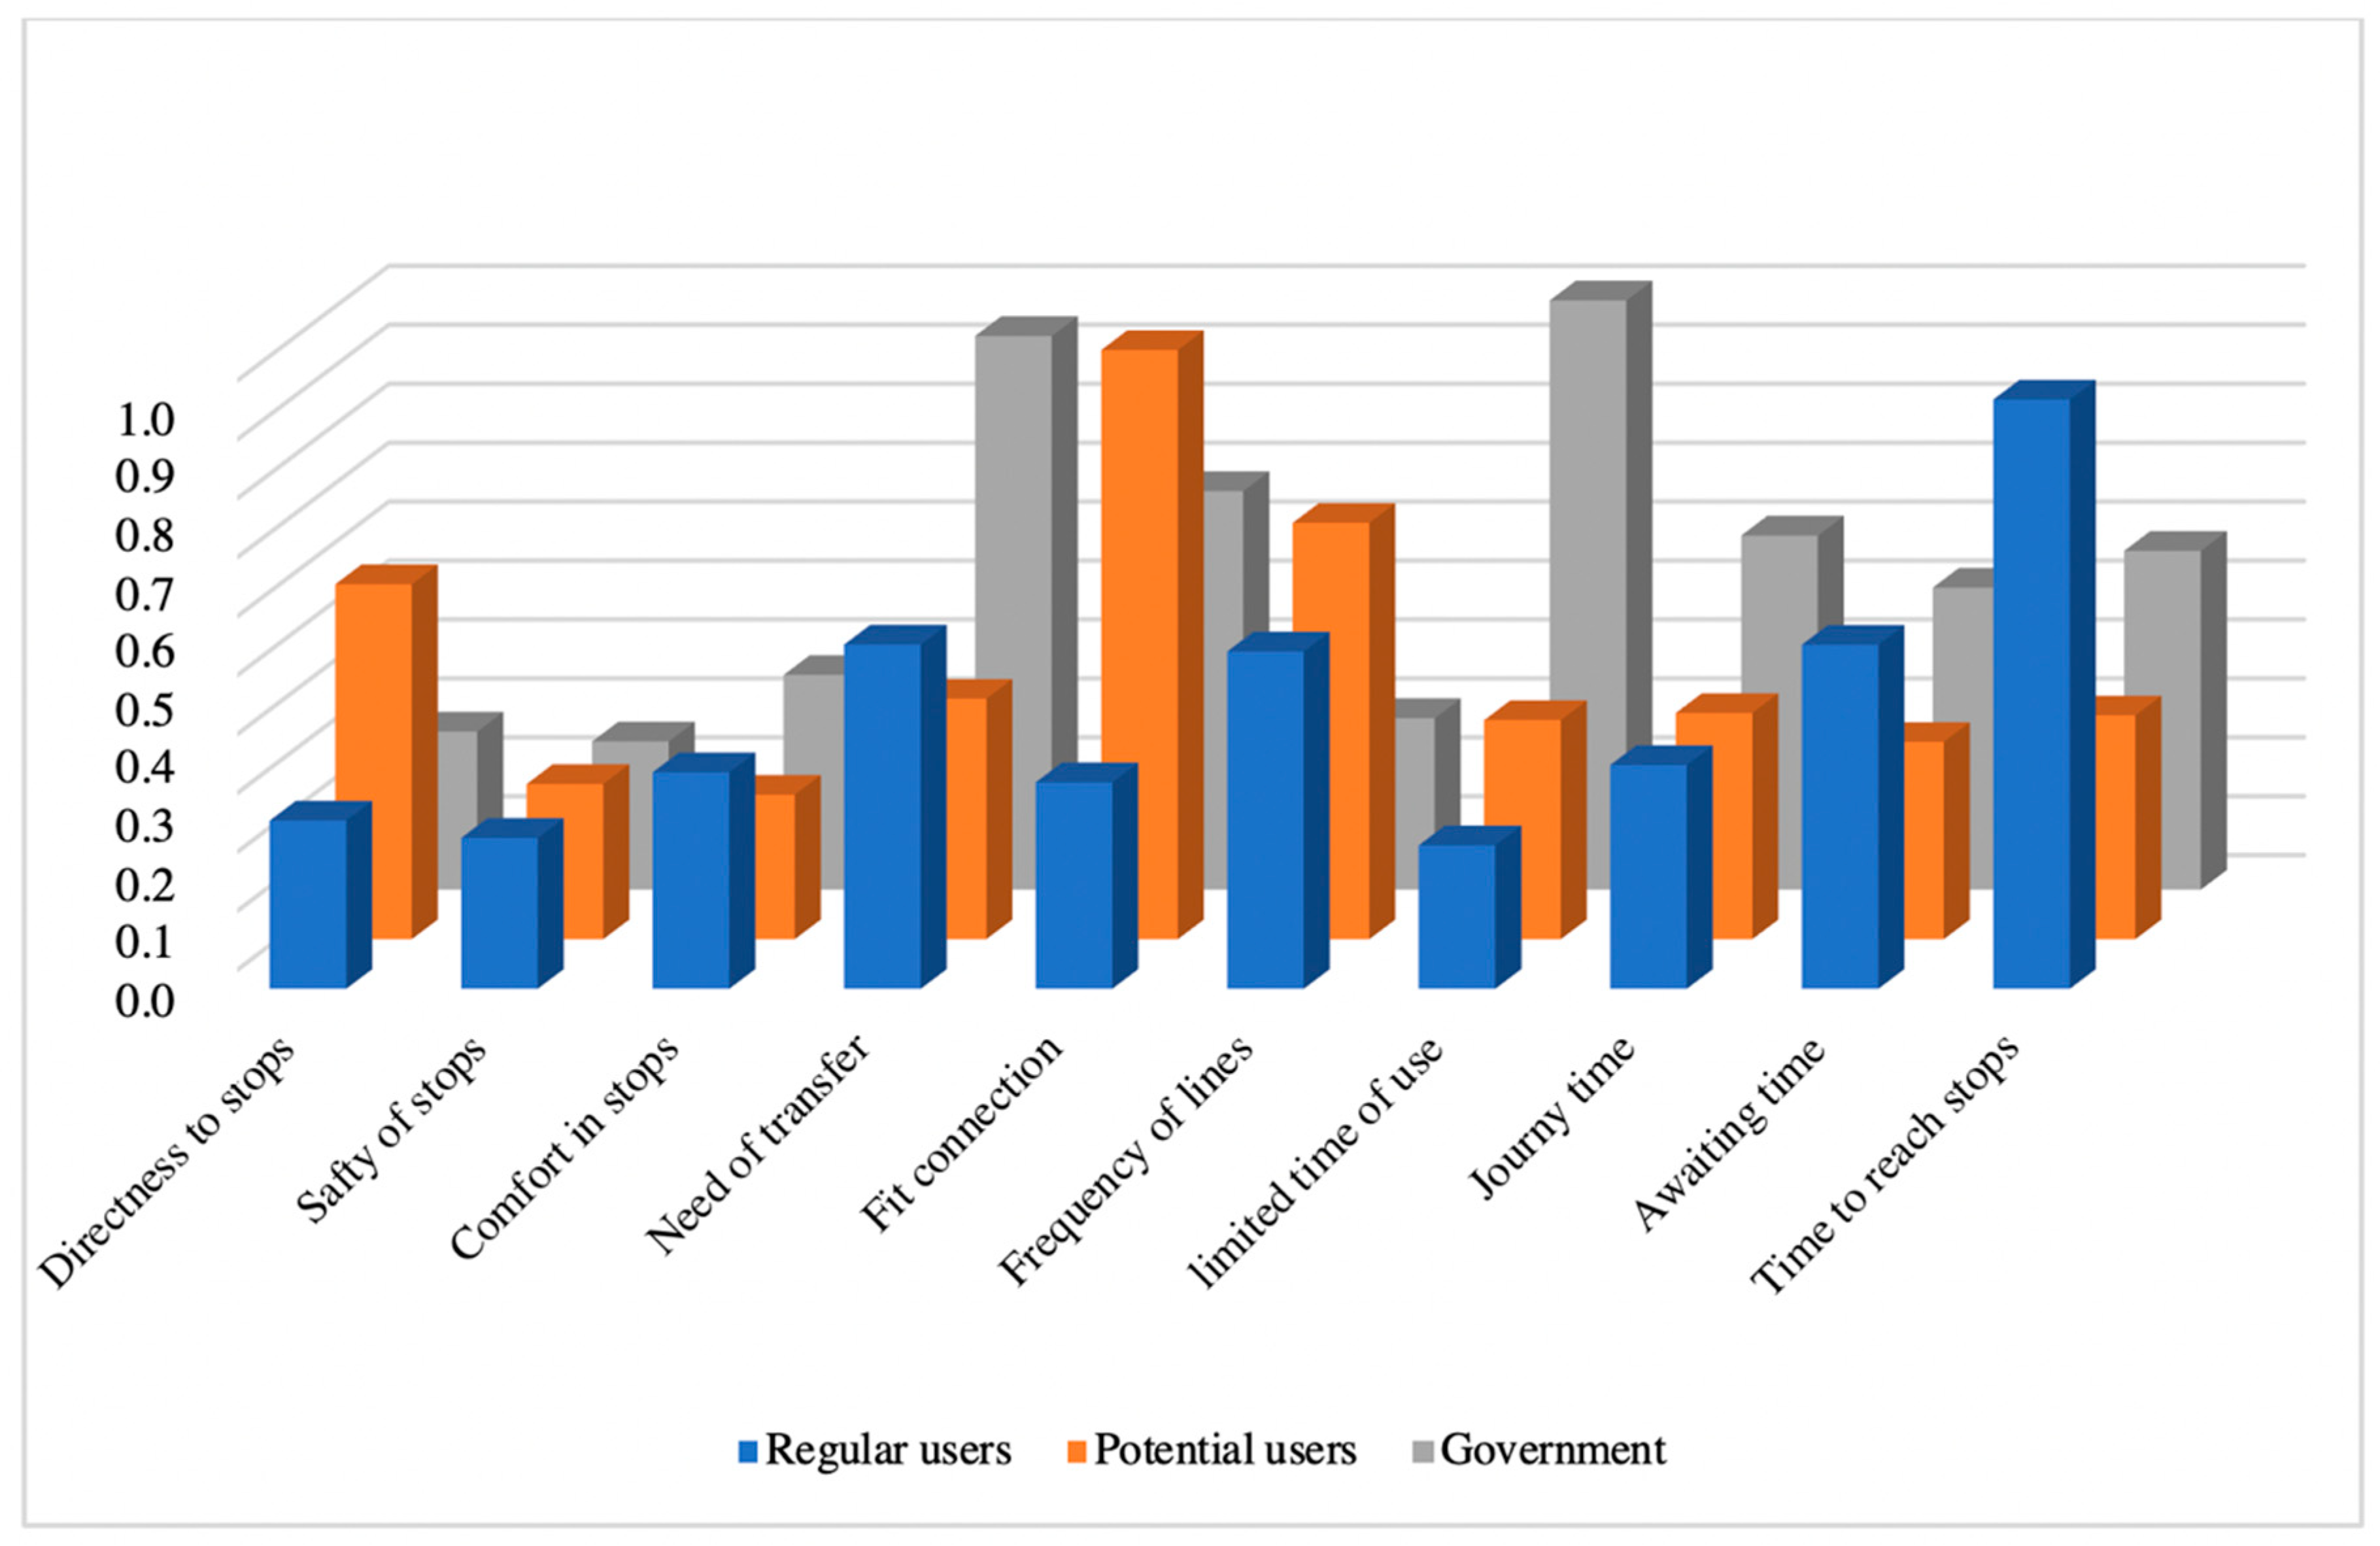
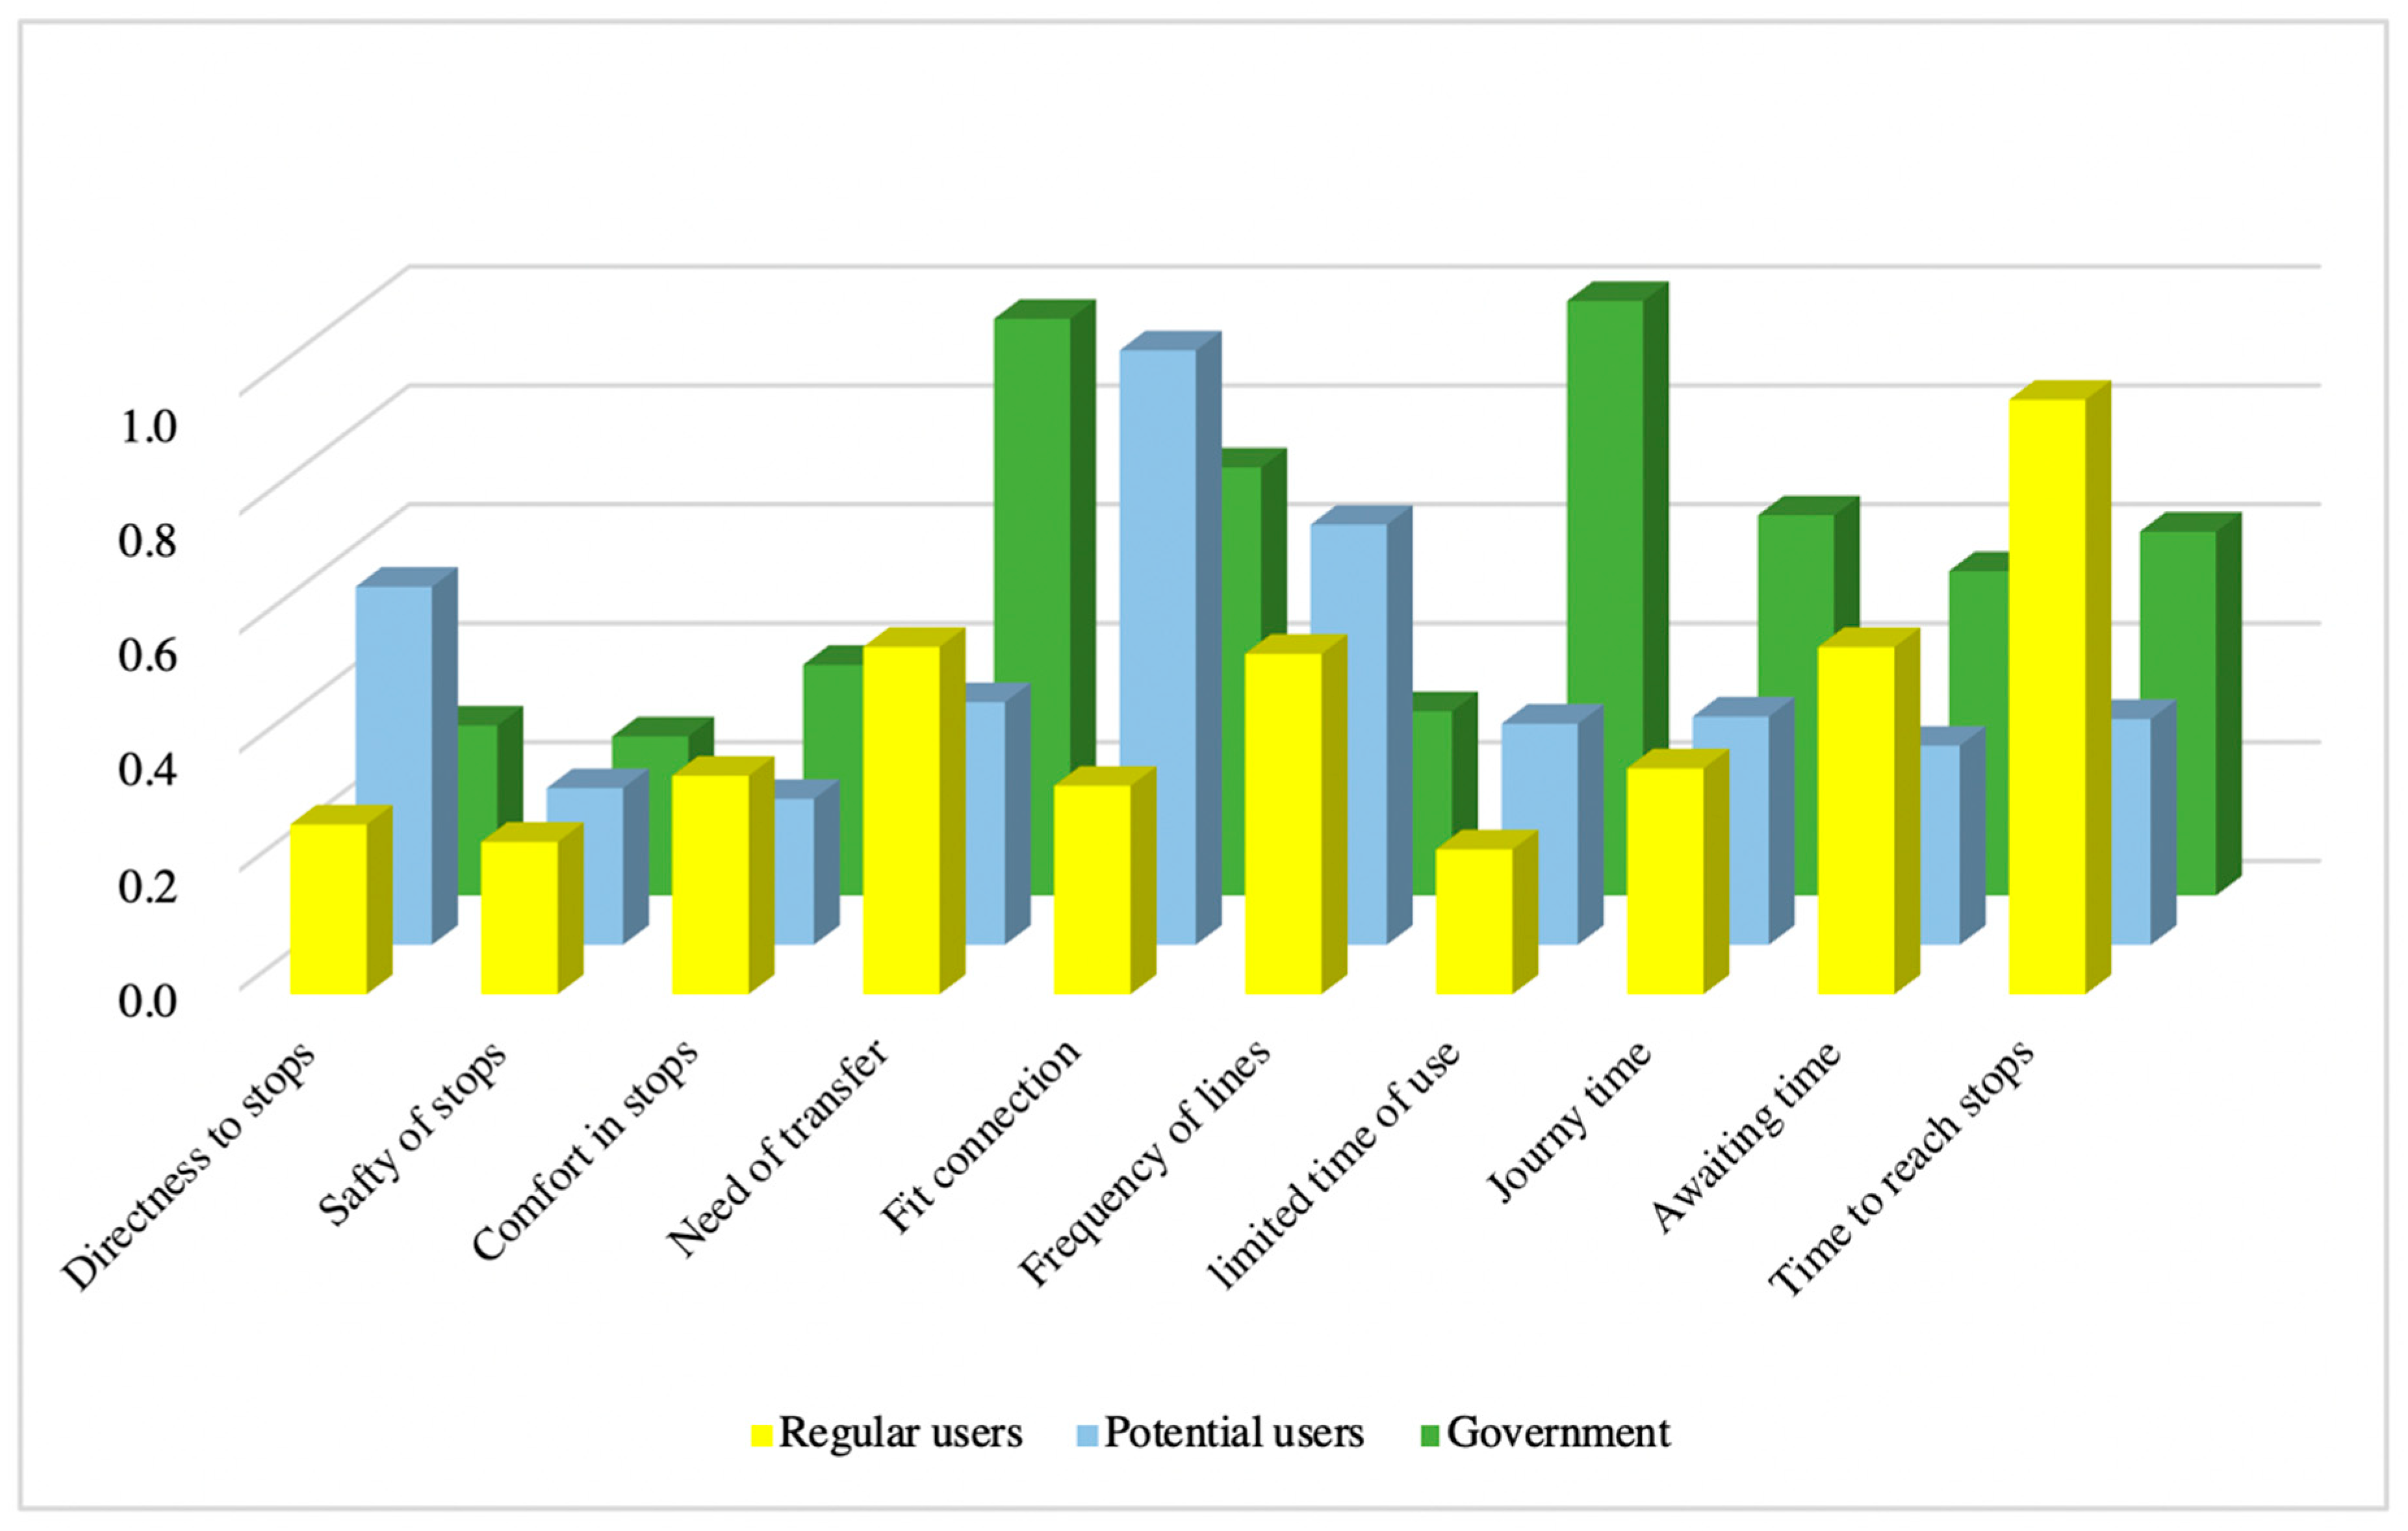
| 1 | Time to reach stops | 0.053 | Fit connection | 0.07 | Limited time of use | 0.029 |
| 2 | Need of transfer | 0.031 | Frequency of lines | 0.049 | Need of transfer | 0.027 |
| 3 | Awaiting time | 0.031 | Directness to stops | 0.042 | Fit connection | 0.0197 |
| 4 | Frequency of lines | 0.031 | Need of transfer | 0.029 | Journey time | 0.018 |
| 5 | Journey time | 0.020 | Journey time | 0.027 | Time to reach stops | 0.017 |
| 6 | Comfort in stops | 0.0196 | Time to reach stops | 0.027 | Awaiting time | 0.015 |
| 7 | Fit connection | 0.019 | Limited time of use | 0.026 | Comfort in stops | 0.011 |
| 8 | Directness to stops | 0.015 | Awaiting time | 0.024 | Frequency of lines | 0.009 |
| 9 | Safety of stops | 0.014 | Safety of stops | 0.019 | Directness to stops | 0.008 |
| 10 | The limited time of use | 0.013 | Comfort in stops | 0.017 | Safety of stops | 0.007 |
| Rank | Criteria | Final Scores |
|---|---|---|
| 1 | Tractability | 0.623 |
| 2 | Transport quality | 0.311 |
| 3 | Service quality | 0.155 |
| Rank | Criteria | Final Scores |
|---|---|---|
| 1 | Perspicuity | 0.285 |
| 2 | Information during travel | 0.215 |
| 3 | Information before travel | 0.199 |
| 4 | Mental comfort | 0.157 |
| 5 | Physical comfort | 0.135 |
| 6 | Speed | 0.047 |
| 7 | Directness | 0.046 |
| 8 | Time availability | 0.037 |
| 9 | Safety of travel | 0.0288 |
| 10 | Approachability | 0.024 |
| 11 | Reliability | 0.011 |
| Rank | Criteria | Final Scores |
|---|---|---|
| 1 | The limited time of use | 0.029 |
| 2 | Need for transfer | 0.027 |
| 3 | Fit connection | 0.0194 |
| 4 | Time to reach stops | 0.018 |
| 5 | Journey time | 0.017 |
| 6 | Awaiting time | 0.0145 |
| 7 | Comfort in stops | 0.011 |
| 8 | Directness to stops | 0.0095 |
| 9 | Frequency of lines | 0.008 |
| 10 | Safety of stops | 0.0067 |
| Rank | Criteria | Final Scores |
|---|---|---|
| 1 | Transport Quality | 0.4178 |
| 2 | Tractability | 0.3014 |
| 3 | Service Quality | 0.2776 |
| Rank | Criteria | Final Scores |
|---|---|---|
| 1 | Information before travel | 0.1532 |
| 2 | Physical comfort | 0.1486 |
| 3 | Information during travel | 0.1324 |
| 4 | Safety of travel | 0.1246 |
| 5 | Mental comfort | 0.1134 |
| 6 | Perspicuity | 0.0964 |
| 7 | Time availability | 0.0579 |
| 8 | Directness | 0.0535 |
| 9 | Speed | 0.0449 |
| 10 | Reliability | 0.0387 |
| 11 | Approachability | 0.0363 |
| Rank | Criteria | Final Scores |
|---|---|---|
| 1 | Fit connection | 0.1637 |
| 2 | The limited time of use | 0.1603 |
| 3 | Frequency of lines | 0.1403 |
| 4 | Need of transfer | 0.1367 |
| 5 | Time to reach stops | 0.0846 |
| 6 | Safety of stops | 0.0724 |
| 7 | Journey time | 0.0664 |
| 8 | Comfort in stops | 0.0653 |
| 9 | Directness to stop | 0.0603 |
| 10 | Awaiting time | 0.0499 |
| Criteria | Rate of Regular User Side | Rate of Potential User Side | Rate of Government Side | ||
|---|---|---|---|---|---|
| Service quality | 2 | 3 | 3 | 8 | 4 |
| Transport quality | 3 | 2 | 2 | 7 | 1 |
| Tractability | 1 | 1 | 1 | 3 | 9 |
| n = 3 | m = 3 | S = 14 | W = 0.7778 | ||
| Criteria | Rate of Regular User SIDE | Rate of potential User Side | Rate of Government Side | ||
|---|---|---|---|---|---|
| Approachability | 9 | 9 | 10 | 28 | 100 |
| Directness | 8 | 5 | 7 | 20 | 4 |
| Time availability | 10 | 7 | 8 | 25 | 49 |
| Speed | 4 | 8 | 6 | 18 | 0 |
| Reliability | 11 | 11 | 11 | 33 | 225 |
| Physical comfort | 5 | 1 | 5 | 11 | 49 |
| Mental comfort | 6 | 3 | 3 | 12 | 36 |
| Safety of travel | 7 | 10 | 9 | 26 | 64 |
| Perspicuity | 2 | 2 | 1 | 5 | 169 |
| Information before travel | 3 | 4 | 4 | 11 | 49 |
| Information during travel | 1 | 6 | 2 | 9 | 81 |
| n = 11 | m = 3 | S = 825 | W = 0.8343 | ||
| Criteria | Rate of Regular User Side | Rate of Potential User Side | Rate of Government Side | ||
|---|---|---|---|---|---|
| Directness to stops | 8 | 3 | 9 | 20 | 12.25 |
| Safety of stops | 9 | 9 | 10 | 28 | 132.25 |
| Comfort in stops | 6 | 10 | 7 | 23 | 42.25 |
| Need of transfer | 2 | 4 | 2 | 8 | 72.25 |
| Fit connection | 7 | 1 | 3 | 11 | 30.25 |
| Frequency of lines | 4 | 2 | 8 | 14 | 6.25 |
| Limited time of use | 10 | 7 | 1 | 18 | 2.25 |
| Journey time | 5 | 5 | 4 | 14 | 6.25 |
| Awaiting time | 3 | 8 | 6 | 17 | 0.25 |
| Time to reach stops | 1 | 6 | 5 | 12 | 20.25 |
| n = 10 | m = 3 | S = 324.5 | W = 0.437 | ||
© 2019 by the authors. Licensee MDPI, Basel, Switzerland. This article is an open access article distributed under the terms and conditions of the Creative Commons Attribution (CC BY) license (http://creativecommons.org/licenses/by/4.0/).
Share and Cite
Moslem, S.; Ghorbanzadeh, O.; Blaschke, T.; Duleba, S. Analysing Stakeholder Consensus for a Sustainable Transport Development Decision by the Fuzzy AHP and Interval AHP. Sustainability 2019, 11, 3271. https://0-doi-org.brum.beds.ac.uk/10.3390/su11123271
Moslem S, Ghorbanzadeh O, Blaschke T, Duleba S. Analysing Stakeholder Consensus for a Sustainable Transport Development Decision by the Fuzzy AHP and Interval AHP. Sustainability. 2019; 11(12):3271. https://0-doi-org.brum.beds.ac.uk/10.3390/su11123271
Chicago/Turabian StyleMoslem, Sarbast, Omid Ghorbanzadeh, Thomas Blaschke, and Szabolcs Duleba. 2019. "Analysing Stakeholder Consensus for a Sustainable Transport Development Decision by the Fuzzy AHP and Interval AHP" Sustainability 11, no. 12: 3271. https://0-doi-org.brum.beds.ac.uk/10.3390/su11123271