Impact of Perceived Livelihood Risk on Livelihood Strategies: A Case Study in Shiyang River Basin, China


1
School of Economics and Management, Shaanxi University of Science and Technology, Xi’an 710021, China
2
College of Humanities, Arts and Social Sciences, Flinders University, GPO Box 2100, Adelaide, SA 5001, Australia
*
Author to whom correspondence should be addressed.
Sustainability 2019, 11(12), 3349; https://0-doi-org.brum.beds.ac.uk/10.3390/su11123349
Submission received: 1 May 2019
/
Revised: 4 June 2019
/
Accepted: 13 June 2019
/
Published: 17 June 2019
(This article belongs to the Special Issue Economic Impacts of Energy and Climate Change Mitigation and Adaptation)
Abstract
:Using data collected from semi-structured interviews with 485 households, this research evaluates the effect of perceived livelihood risk on livelihood strategies within farming households in China’s Shiyang River Basin. Perceived livelihood risk was evaluated by establishing an index system of livelihood risk (health, environmental, financial, social, and information and connectivity risks). Different livelihood strategies were identified, including reducing consumption, seeking help from relatives and friends, securing loans, seeking employment, and converting assets into cash. The effect of perceived livelihood risk on livelihood strategies was measured and evaluated using multinomial logistic regression. The results indicate that the effect of different perceived livelihood risk on livelihood strategies varies. Personality traits, as well as perceived health risk, financial risk, social risk, and environmental risk influence livelihood strategies, while perceived information risk and connectivity risk do not appear to have obvious relationships to livelihood strategies. Finally, we present proposals for ensuring farmers’ livelihood strategies are more effective.
1. Introduction
The issue of “livelihood risk” in work on sustainable development has become the subject of intensive conceptual and empirical research [1,2,3,4,5,6]. Research-informed ways of adapting to livelihood risk are a key part of this consideration. Moreover, understanding adaptation mechanisms and processes are clearly vital to the shaping of relevant and effective policy [7]. As a foundation for understanding human response actions, risk cognition, based on experiences, feelings, and local knowledge, is fundamental to an appreciation of the interrelationship between people and risk change in particular places [8]. In light of their close dependence on natural resources, farmers perceive livelihood risk keenly and are also among the first to adopt coping behaviors. Research examining the influence of perceived livelihood risk on livelihood strategies offers a new perspective to help guide farmers’ effective coping behaviors and improve their adaptability [9].
1.1. Risk Perception
Since the 2000s, considerations of risk perception have become central to understanding how rural residents cope with livelihood risk. Usually individuals respond to livelihood risk through three interrelated stages, namely observation, perception, and action, with each stage based on the previous one. Among them, perception is the basis for adopting response actions. It plays a key role in shaping farmers’ adoption of appropriate behaviors. As an interpretive process including personal will, risk perception includes both subjective judgment of risk possibility and subjective understanding of risk outcome [10]. Under a rational decision-making model, risk perception prompts people to take action to reduce risk, which is an important explanatory variable for decision-making behavior [11].
There is increasing recognition that attitudes toward, and responses to, livelihood risk are dependent on farmers’ own resources and livelihood capital [12]. In general, more abundant livelihood capital endowments (including human capital, natural capital, physical capital, financial capital, and social capital) and higher income diversification appear to enhance farmers’ capabilities for risk response [13]. A number of studies have shown that factors such as age, gender, ethnicity, education level, household structure, productive experience, cognitive bias, media information, geographic location and farm soil type are all important influences on risk perception [14,15,16,17,18]. Additionally, the impact on risk perceptions of farmers’ information acquisition about favorable market environments, public opinion, and convenient credit services (such as more flexible patterns of lending and usage modes, and lower loan thresholds) cannot be ignored [19,20,21,22,23].
In addition, levels of risk perception are shaped by different means of livelihood [24]. Households which are engaged in a variety of occupations, rather than relying on agriculture only for their livelihood, are normally much more aware of livelihood risk. Exposure to different livelihood capital endowments and diversification of livelihood activities probably help these households with different occupations better appreciate livelihood risks.
1.2. Adaptive Capacity
Adaptation is a highly subjective process linked to specific social backgrounds and geographical locations. Adaptive capacity indicates the capability to adjust to environmental disruption (ecological systems and human social systems), to moderate potential damages, or to cope with consequences [25]. Although considerable attention is paid to adaptive capacity with reference to climate change, some scholars have extended work to hazard response, resource management, and sustainable development. Adaptive capacity is context-specific, playing out differently for different countries, communities, social groups, and individuals [26]. At the national level, those countries that have low levels of technology, poor infrastructure, weak institutions, inequitable empowerment, and limited access to economic resources are highly vulnerable. For individuals, adaptive capacity is highly related to their access to resources [27].
1.3. Livelihood Strategies
“Livelihood strategies” refer to that combination of livelihood activities and choices that farmers make to achieve their livelihood goals in terms of better living standards, improved levels of welfare, and greater employment opportunities [28]. They offer means to cope with external disturbances and to maintain livelihood capabilities (including what people can do and what they can obtain with their entitlements) [29,30,31,32,33]. Many studies on livelihood strategies indicate that farmers’ livelihood strategies are rational and effective means of reducing vulnerability and enhancing adaptability. When confronted with serious and frequent livelihood risks, many rural households adopt livelihood strategies intended to prevent, resolve, and adapt to livelihood risks according to their endowments and risk characteristics [34]. Much of the extant literature suggests that rural households’ choices of livelihood strategies are rational [35,36,37]. Moreover, the strategies for coping with vulnerable environments are diverse [38,39,40,41,42], being based mainly on perceptions of surrounding risks, the potential benefits or disadvantages of risk-taking, and the availability of livelihood “safety nets” at the worst times [43]. Strategies are also based on the economic status of the household [43].
It is evident from a review of the relevant literature that quantitative approaches have become increasingly popular in exploring the inter-relationships between livelihood strategies and factors influencing them. For instance, relationships between livelihood strategies and livelihood capital are already being described and quantified through regression analysis [44,45,46]. While such work deepens our understanding of the field of sustainable research in rural areas, there is lack of adequate empirical information and research exploring crucial linkages between risk perception, adaptive capacity, and livelihood strategies. Those studies that do exist focus mostly on perceptions of climate change [47], water resources shortages [48,49], and market shocks [50]. This study investigates the relationship between perceived livelihood risk and livelihood strategies concentrating on rural farming households in China’s Shiyang River Basin. The first section of the paper offers an introduction on perceived livelihood risk, adaptive capacity, and livelihood strategies. The second part describes the research area and methodology applied in our study. Here we introduce an index system of livelihood risk and an evaluation model of perceived livelihood risk. Section 3 reveals the impact of perceived livelihood risk on livelihood strategies using a logistic regression model. Conclusions are presented in Section 4.
2. Methodology
2.1. Description of Research Sites
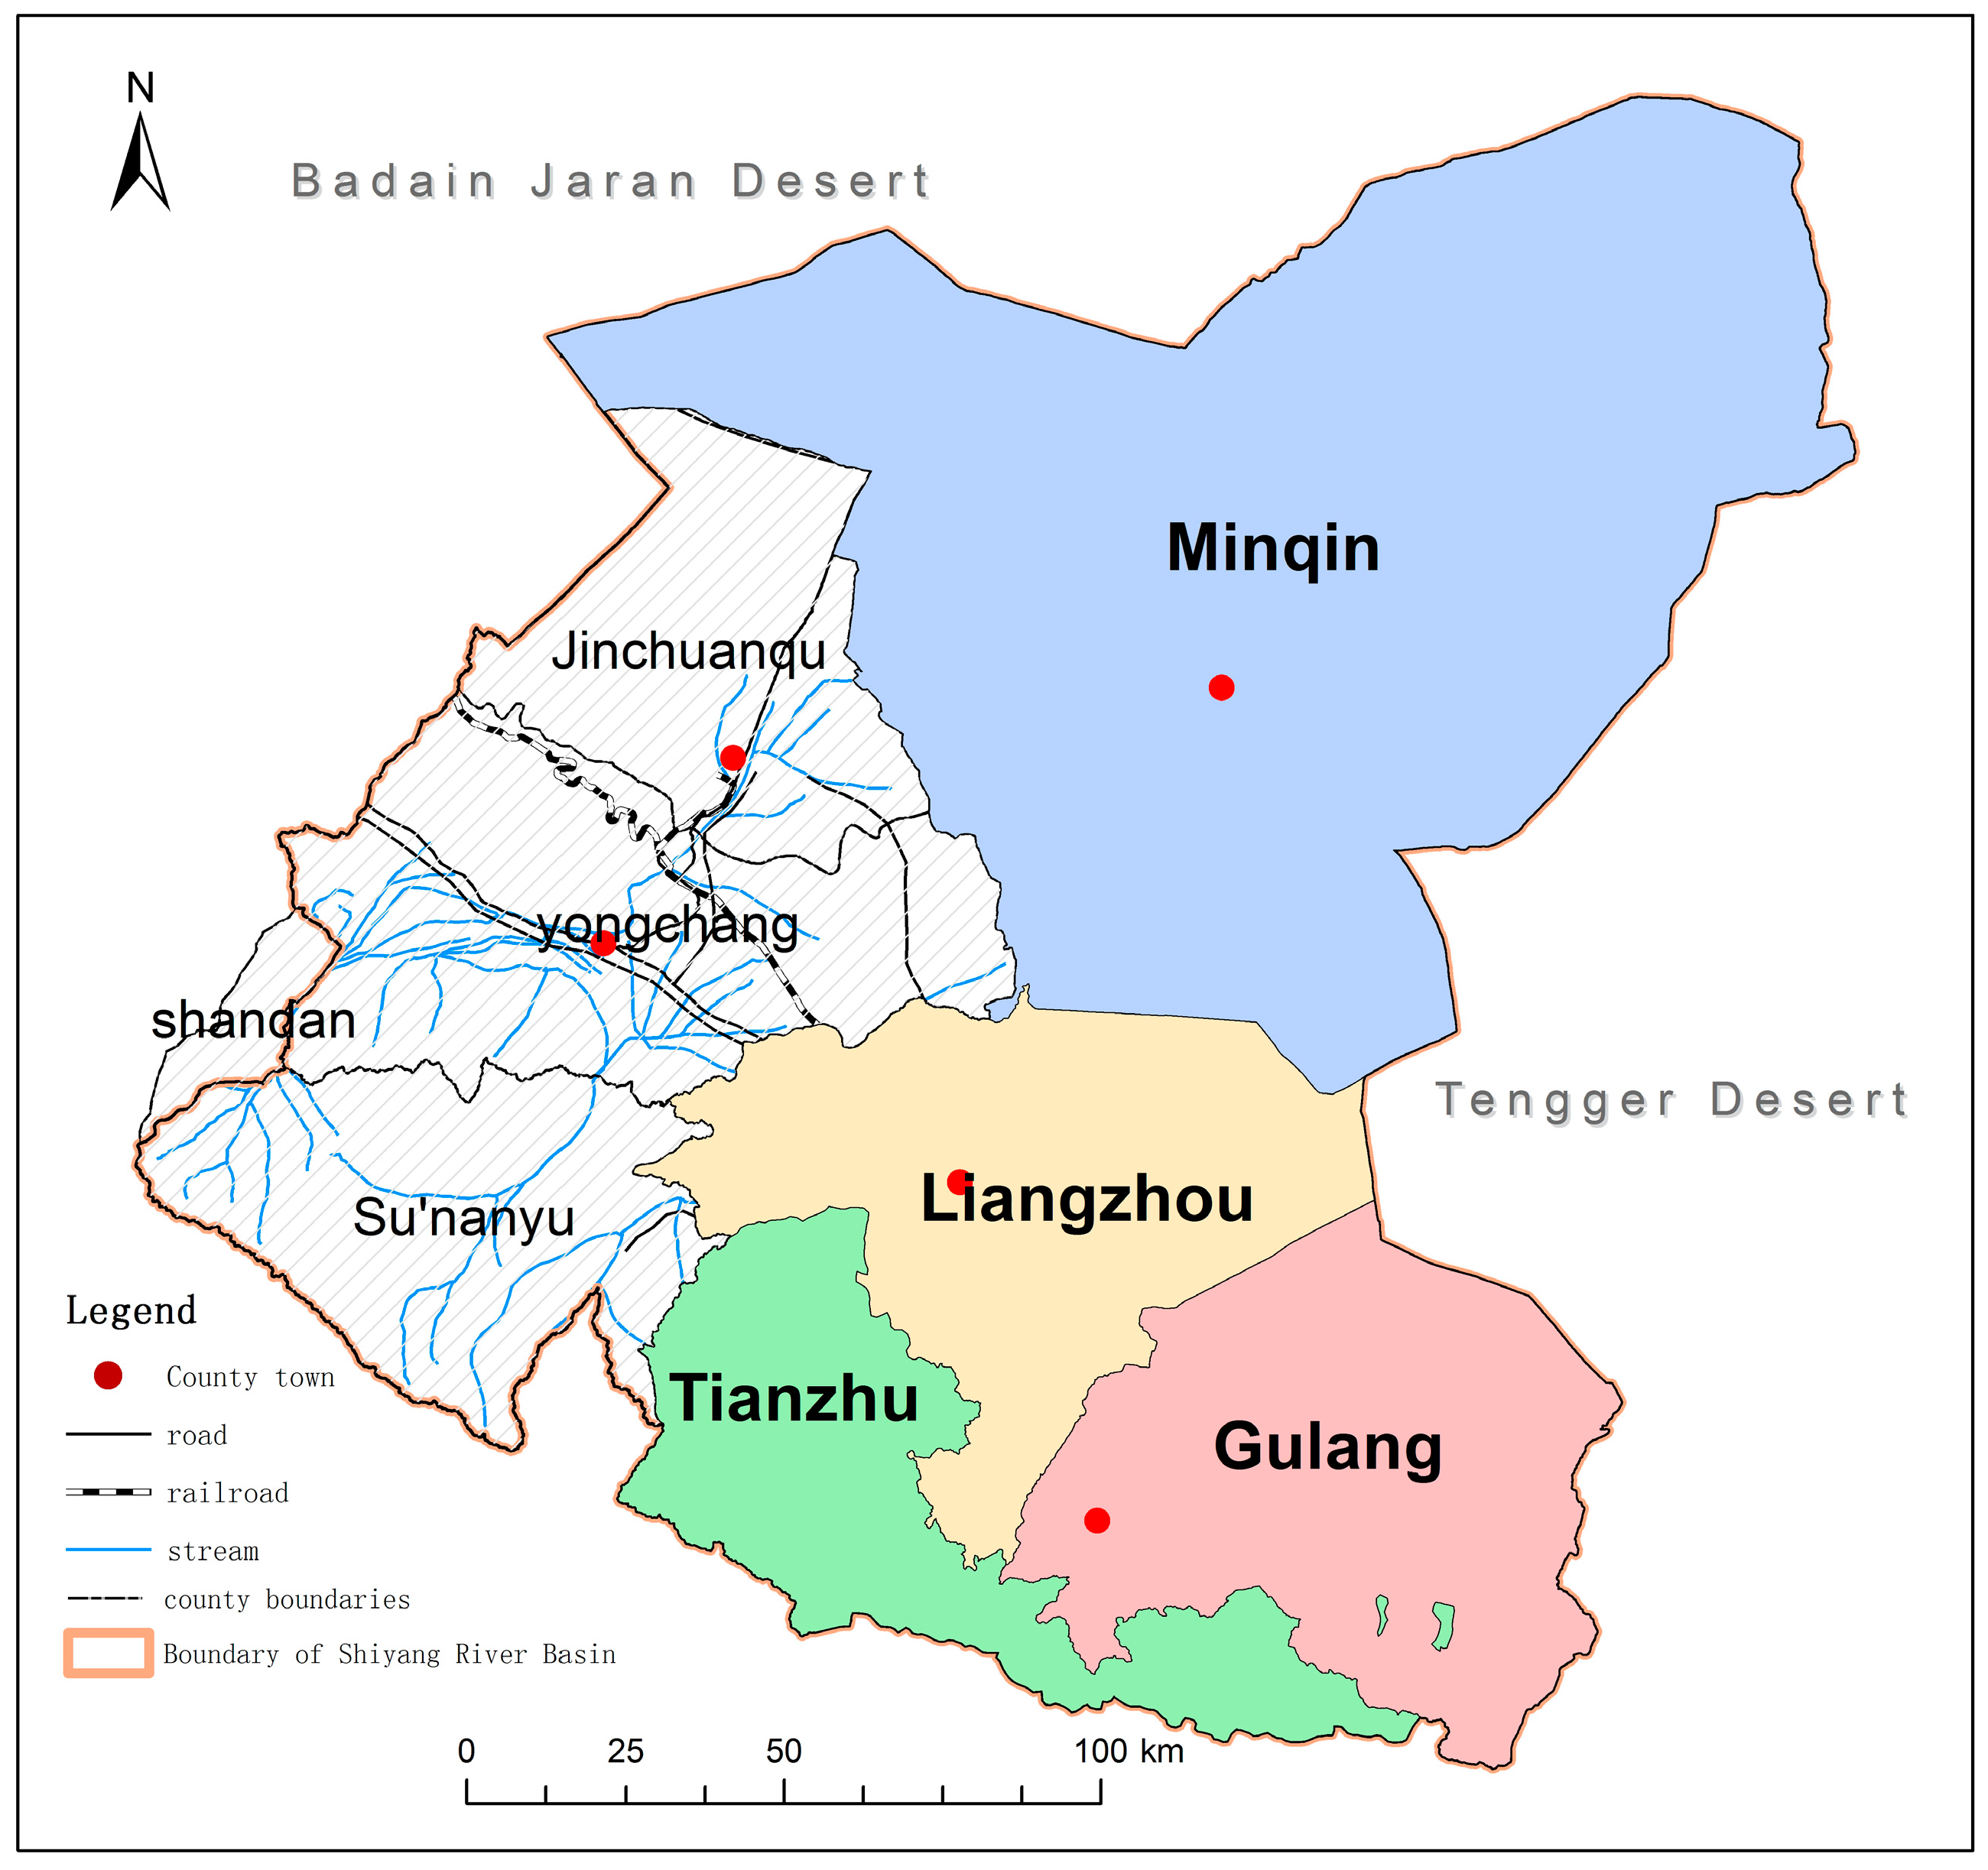
The Shiyang River Basin (Figure 1) is an arid inland river basin of China with a total area of about 41,600 km2. It is located in the eastern section of Hexi Corridor, on the western section of the Wushao ridge and the northern section of the Qilian Mountains. It has a population of about 2.358 million, giving it an average population density (55 people per square kilometer) about 3.4 times greater than that of Hexi Corridor [51]. Local farmers’ main strategies for living include plantations (wheat, corn, rapeseed, potatoes, and fruit) and livestock farming (cattle, sheep, and others). There is no significant gender difference of labor. The Shiyang River Basin is characterized by households with a single source of income or a single occupation, high labor turnover, and significant problems of population ageing, and limited access to educational and medical care [52]. More importantly, the basin is characterized by extreme ecological fragility, intensified by serious water shortages. There is a clear conflict between the supply and requirement for water resources. Inappropriate irrigation methods and water-intensive crops present a serious threat to food supply, water security, public health, and social security (Figure 1).
Vegetation in the Shiyang River Basin has been seriously damaged by climate change and human activities. This has had consequences for soil and water conservation in the region. Very large-scale irrigation agriculture and unreasonable water resource allocations have led to excessive water consumption, especially in the basin’s lower reaches. There is a significant water resources crisis involving the vulnerable local ecology and spreading desertification. Moreover, with rapid population growth and heightening intensity of development, the utilization of water, soil, and vegetation is increasing. As the pressures of demand exceed the capacity of an already fragile ecosystem, the basin’s ecological environment deteriorates further.
Due to very high population density, high-intensity economic activities, and significant ecological degradation, the biophysical environment of the Shiyang River Basin’s middle-lower reaches has been deteriorating quickly, limiting the sustainable development of the watershed and lowering levels of personal and family welfare. Given the Shiyang River Basin’s extreme ecological fragility, this research offers the promise of revealing useful coping mechanisms within it as well as effective livelihood strategies that may be applied to other continental river basins.
2.2. Methodological Approach
2.2.1. Data Gathering, Sample Size, and Distribution
The primary means of gathering data for this study was through household questionnaires requiring respondents to recall experiences. To minimize prospective problems associated with bias (e.g., recall bias and information bias) care was taken in the design of the questionnaire to make its content impartial and even-handed. Factors such as question order were considered to avoid the construction of preferential contexts. Surveyors were trained carefully to pay attention to question wording and to avoid phrasing that could lead to some dubious answers. Surveyors were also apprised of a range of contextual factors by the Chief Executive (i.e., village head, etc.) to assist in their efforts to reduce recall bias, for example.
Thirty surveyors (including colleagues and graduate students) were recruited from Lanzhou University of Technology before the investigation commenced in April 2017. Recruited surveyors were required to come from the research area, have some statistical knowledge, and have participated in similar studies before. After a one-month selection period, the investigative team comprising 25 formal surveyors and five backup surveyors was finalized. To both ensure the quality of the survey and improve the response rate of questionnaires, surveyors were trained for 15 days in May 2017.
In order to refine draft questionnaires and finalize sample size, pilot questionnaires were conducted among 50 households in the middle-lower reaches of Shiyang River Basin. Surveyors (ten surveyors selected randomly from the investigative team) also conducted group discussions with village heads, village party secretaries, and village accountants (responsible for village financial accounts) in different sample villages before the formal survey was undertaken. These discussions were also intended to obtain more background information and to uncover a deep-seated view of managers.
In June 2017, the formal study was carried out in the middle of Shiyang River Basin (including Gulang county, Tianzhu county, and Liangzhou district) and the lower reaches (including Minqin county). All 30 surveyors were involved in the investigation: 25 formal investigators were divided into five groups to participate in the whole process of the investigation, and five backup investigators replaced formal investigators on those occasions they were unable to participate. The language used in interviews and questionnaires was Chinese.
Generalized proportional and selective sampling was used in order to ensure that each individual from the survey areas was given equal opportunity to be selected for inclusion in the research. Villages in different sections (including Minqin county, Gulang county, Tianzhu county, and Liangzhou district) were selected at the proportion of 50% firstly, then households in each village were randomly sampled at the ratio of 1.5%. In the end, a total of 500 households were surveyed, and 485 valid questionnaires (including 110 of Minqin County, 120 of Gulang County, 102 of Tianzhu County, and 153 of Liangzhou district) were collected, yielding a response rate of 97.0%. We attribute the high response rate to the fact that our surveyors were from these areas, as local people were able to speak the local language, understand local nuances, and communicate extremely well with the respondents. Moreover, the household survey was conducted on a one-to-one basis, understood to contribute to a high response rate.
The questionnaire design was based on perceived livelihood risk, livelihood strategies, and personality traits. The main contents include: (1) Perceived livelihood risk. This included perceived health, environmental, financial, social, information, and connectivity risk; (2) Livelihood strategies for surveyed farmers. Different livelihood strategies were identified such as “reduce consumption”, “wait for relatives and friends help”, “use loans”, “seek employment”, and “convert assets into cash” (the variables employed to assess these were: “What strategies do you take when you are at risk?” and “What are your preferred strategies?”); and (3) Personality traits. In addition to perceived livelihood risk, farmers’ decision-making is also affected by their psychological capital especially personality traits, insights into which were obtained by questions such as “Have you suffered from anxiety or depression in the face of difficulties or adversity?” [9].
2.2.2. Measuring Method of Risk Perception
Based on the definition of livelihood risk [53] and existing regional conditions, as well as availability of data, we employed an index system of livelihood risk. This comprised five aspects, namely health, environmental, financial, social, and information and connectivity risk linked to six types of livelihood capital. These are human, natural, financial, physical, social capital, and information capital [54] with 23 specific indicators seen in Fang [55]. The indicators and the relationships between them were developed on the basis of a review of the literature on each major component [55].
2.2.3. Evaluation of Perceived Livelihood Risk among Farming Households
(1) Evaluation Model
According to the Model of Private Proactive Adaptation to Climate Change (MPPACC) proposed by Grothmann and Patt [27], two subcomponents contribute to perceived livelihood risk for rural households: Risk perception and Perceived adaptive capacity (Figure 2).
Risk Perception is the product of perceived probability and perceived severity. Perceived probability indicates the person’s expectation that a risk will occur. In the case of a natural hazard, this might be the likelihood that a flood would reach the house in which a person lives. Perceived severity is the person’s appraisal of the risk’s consequences in their life, for example, making a judgment that flooding in this area would damage something of value, such as a person’s home or private property. Perceived Adaptive Capacity is built on three subcomponents including perceived self-efficacy, perceived adaptation costs, and perceived adaptation efficacy. Perceived self-efficacy is the belief that one’s defensive behavior with respect to a risk would offer effective protection. Perceived adaptation efficacy refers to a person’s perceived ability to actually perform some adaptive responses. Perceived adaptation cost refers to the assumed costs of taking preventive responses.
(2) Evaluation on Perceived Livelihood Risk Indicators
The method of measuring risk cognition employed in this study was first proposed by Cunningham in 1964 [56]. Cunningham proposed that risk cognition is the product of risk probability and loss severity. Subsequently, and according to the MPPACC framework proposed by Grothmann and Patt [27], any perceived livelihood risk indicator can be estimated as the sum of risk perception and perceived adaptive capacity (product of perceived self-efficacy, perceived adaptation cost, and perceived adaptation efficacy):
where PRm indicates average perceived livelihood risk indicator m for different households; Pmi is defined as the perceived probability of risk indicator m occurring for household i; Gmi is perceived severity on risk indicator m occurring for household i; Emi is defined as perceived self-efficacy on risk indicator m for household i; Fmi is perceived adaptation cost on risk indicator m for household i; and Jmi is defined as perceived adaptation efficacy on risk indicator m for household i.
2.2.4. Model’s Estimation of Impact of Risk Perception on Livelihood Strategies
Multinomial logistic regression were used for all comparisons among dependent categories. It is used when the dependent variable has more than two nominal or unordered categories. In essence, multinomial logistic regression usually transforms logistic regression into a multinomial problem by the classification method. To put it in a more technical way, it is usually used to predict the probability of different outcomes for a categorically dependent variable, and finally determine which category the research subject is inclined to choose. The basic principle is to specify one category as the baseline category, and then compare other categories with it. However, no matter which category is selected as the reference, there will be the same parameter estimation for the same category. That is, the selection of the baseline category is arbitrary [57,58]. Therefore, a simple way to implement a multinomial regression model is to choose one of all k possible outcomes as the “baseline category”, and only run a k-1 independent binary logistic regression model.
In this study, livelihood strategies as dependent variables have many levels with no orders. Therefore, the simplest and most popular discrete choice model, multinomial logistic regression, was used in our study to analyze the influence of perceived livelihood risk of farm households on different living strategies. Based on definitions and classifications of livelihood strategies in previous research, the existing features of regional conditions, and data availability, K was identified as different livelihood strategies, namely “reduce consumption”, “wait for relatives and friends’ help”, “use loans”, “seek employment” and “convert assets into cash”, represented respectively as “1”, “2”, “3”, “4”, and “5”.
Then, the final category (the largest one) of the dependent variable assignments in ascending order is selected as the reference category (the control group). Therefore, the livelihood strategy “5” (convert assets into cash) is selected as the reference category, and the formulae are expressed as follows:
where refers to the set of regression coefficients related to different livelihood strategies , and is the set of independent variables related to observation i. Meanwhile, were converted into different perceived livelihood risk (health, environmental, financial, social, and information and connectivity risk) and represented by , , , , and , respectively. Personality traits are used as control variables.
The following formulas were developed:
Based on the fact that the sum of probabilities of K is 1, the following formula was formed:
To take advantage of this to identify other possibilities:
3. Results and Discussion
3.1. Evaluation of Perceived “Lack of Water Resources”
Each perceived risk indicator in the livelihood risk index system (including risk perception and perceived adaptive capacity) is explored through questions in our survey and assigned a value according to the responses from household heads. Table 1 shows data on one perceived risk indicator, namely “lack of water resources” for different areas.
(1) As shown in Table 1, the perceived probability (reaching 2.68) of water resource scarcity in the future is lower than perceived severity. Around 81% of all respondents believe that water resource scarcity will certainly increase in future. Farmers in the basin’s middle reaches perceive greater probability of water scarcity (2.85) than farmers downstream (2.51).
(2) Water resource scarcity has exacerbated the livelihood vulnerability of farmers in the middle and lower reaches of Shiyang River Basin, with around 73% of respondents believing that water resource scarcity has a serious impact on their livelihoods (with the index of perceived severity reaching 2.73). Compared with downstream farmers (2.63), the index of perceived severity amongst middle-stream farmers is higher (2.83).
Overall, the risk of water resource scarcity is felt keenly among farmers in both the middle and lower reaches of Shiyang River Basin, though it is felt more intensely among those in the middle reaches. The reason for this difference is that risk perceptions associated with water resources scarcity are influenced not only by information and public opinion, but also the adaptability of farmers, risk experience, cognitive bias, and intuitive judgment. The Shiyang River Basin is a typical resource-based water shortage zone characterized in recent years by reduced upstream runoff. Over time runoff from the Qilian Mountains in the basin’s upper reaches has decreased, leading to diminished water resources in the middle and lower reaches. Upstream reservoirs and irrigation areas have been built and while these have allowed expansion of upstream irrigation areas and an associated increase in water consumption, they are also associated with the reduction in runoff to the basin’s middle and lower reaches. Of course, this makes water resources scarcer in the middle and lower reaches and underpins heightened risk perception of water resources scarcity in that region. At the same time, with the 2005/6 implementation and continuing application of a water allocation scheme for the Shiyang River Basin by the People’s Government of Gansu, the availability of midstream water resources has been reduced and the amount of sediment downstream has increased. This has intensified middle-stream farmers’ perceptions of water resources scarcity. In our interviews, most midstream farmers indicated that their use of water resources is significantly less than it was before the water transfer program and the degree of water scarcity has increased. By contrast, some downstream farmers consider that the amount of water has increased significantly, the shortage of water resources has been alleviated, and the ecological environment has also improved following the water transfer program’s implementation.
(3) Around 80% of respondents believe that by taking measures to conserve water (e.g., water-saving irrigation modes such as micro-spraying and drip irrigation or water and fertilizer integration) they could alleviate water resource scarcity effectively. The index of perceived adaptation efficacy is 2.55. However, the index of perceived adaptation efficacy in the middle-stream (reaching 2.73) is higher than that of downstream farmers (reaching 2.37). In our interviews, downstream farmers recognized that the effectiveness of their own measures to alleviate the water shortage was not obvious.
(4) As for the perceived self-efficacy index, only 11.25% of the respondents think that they have strong adaptability. And as shown in Table 1 the perceived self-efficacy index is only 2.26 among all farmers, while in midstream farmers it is relatively low, at 2.17. In general, farmers in the middle and lower reaches of the Shiyang River Basin lack sufficient confidence in self-efficacy, which is inconsistent with their risk perception.
(5) The index of perceived adaptation cost for all households combined reaches 2.47. However, the index of perceived adaptation cost in the middle-stream (2.90) is higher than that of downstream farmers (2.04). Only 5% of respondents believe that the cost of adaptation is low. In our interviews, most farmers reflected that the cost of adaptation to the shortage of water resources was relatively high, and they were unable to afford them. Most pointed out that the shortage of water resources was caused by many factors, and it was impossible for them to solve the problem effectively.
3.2. Evaluation of Perceived Livelihood Risk
Table 2 indicates that local households are more sensitive to financial risk than environmental risk. According to the definition of each index, 23 variables related to five perceived livelihood risks were selected and calculated. The results illustrate that there is a significant difference in distribution of different types of perceived livelihood risk in different areas of the river basin. In addition, for each type of perceived livelihood risk, the average index values of different subcategories (variables) are significantly different. Financial risk (especially for fake agricultural products) and health risk (especially for unhealthy external environment) are the most sensitive problems for rural households in Shiyang River Basin. In addition, financial risk awareness amongst the midstream residents appears higher than that of those downstream. Environmental risks are also a concern for local farmers, and downstream farmers are more sensitive than midstream farmers.
3.3. Description of Livelihood Strategy Options
Based on the classification of different livelihood strategies, we calculated the statistical results of five types of livelihood strategies. The results show that particular livelihood strategies are more popular than others (Figure 3). Among the 485 surveyed households, “seek employment” is the preferred livelihood strategy. When facing livelihood risk, farmers tend to seek employment to cope: They also rely on getting help from relatives and friends to cope with livelihood risk. It is worth noting that “use loans” is not the preferred livelihood strategy for local farmers, which indicates that the local credit system is not ideal. Farmers find it difficult to use loans because of high credit thresholds. Most farmers did not choose to “reduce consumption” (considered to be a direct way of reducing farmers’ happiness) to cope with livelihood risks.
3.4. Evaluation of the Effect of Perceived Livelihood Risk on Livelihood Strategies
The regression results on the relationship between perceived livelihood risk, personality traits, and livelihood strategies are shown in Table 3. The significant variables in the multinomial logistic regression were chosen on the basis of a significance level of 0.1.
According to the R2 pseudo-statistics and chi-square test result, the multinomial logistic regression model fits well and has statistical significance at the 1% level. It should be noted that the likelihood ratio statistic expressed by the X2 statistic (1338.585) is very significant (p = 0.0001), indicating that the estimated value obtained is sufficient to run the analysis. Based on the Log likelihood value, this model fully explained the impact of perceived livelihood risk on livelihood strategies. The estimated coefficients for each category are compared with the basic category of “convert assets into cash”.
All strategies are included in Table 3 except the category of “convert assets into cash” (this group is the baseline category and thus doesn’t appear in Table 3).
For category 1 (reduce consumption), the independent variables “personality traits” and “perceived financial risk” were found to be statistically significant at the 5% and 10% significance level, respectively (p < 0.05, p < 0.1), and were negatively correlated with the dependent variable, suggesting that survey respondents who had optimistic personality traits and higher “perceived financial risk” were less likely to select “reduce consumption”. The reasons for this may be that rural householders with optimistic personality traits are more conscious of quality of life, so they will increase consumption to develop their overall quality of life. It is worth mentioning that the “consumption” mentioned above refers to productive consumption on agricultural goods. So rural households realized financial risk is high because of unstable agricultural prices. In such a situation, they had to reduce the purchase of such items in order to avoid risks. The independent variable “perceived health risk” is significant (p < 0.05) and shows a positive sign. This means that survey respondents who had higher “perceived health risk” were more likely to select “reduce consumption” to increase savings to cope with health risks at any time. However, none of the independent variable “perceived social risk”, “perceived environmental risk”, and “perceived information and connectivity risk” were significant, suggesting that the livelihood strategies of reducing consumption could not be affected by these three perceived livelihood risks.
For category 2 (wait for relatives and friends’ help), we found none of the six risks was significantly associated with the dependent variable, suggesting that the livelihood strategies of “wait for relatives and friends” help’ could not be affected by the perceived livelihood risk and personality traits.
For category 3 (use loans), the independent variables “personality traits”, “perceived health risk”, and “perceived social risk” were found to be statistically significant at the 1%, 5%, and 10% significance level, respectively (p < 0.01, p < 0.05, p < 0.1), and correlated positively with the dependent variable, whereas the independent variable “perceived financial risk” is significant (p < 0.1) and shows a negative sign. This means that survey respondents with optimistic personality traits and higher “perceived health risk” and “perceived social risk” were more likely to select “use loans”, and those with higher “perceived financial risk” were less likely to select “use loans” to cope with livelihood risk. The reason for this is that rural householders with optimistic personality traits prefer to choose “use loans” to achieve more income to sustain livelihoods in the future and to improve the quality of life by a diverse livelihood approach. Meanwhile, rural households with higher “perceived health risk” and “perceived social risk” believe that they can rely on increasing their loans to maintain livelihoods more effectively. In addition, when rural households realized financial risk is high, they assumed that there is a risk in the process of loan acquisition, so they tend to select livelihood strategies other than “use loans”. However, the independent variables “perceived environmental risk” and “perceived information and connectivity risk” were both not significant, suggesting that the livelihood strategies of “use loans” could not be affected by these two perceived livelihood risks.
For category 4 (seek employment), the independent variables “personality traits”, “perceived health risk”, and “perceived environmental risk” were found to be statistically significant at the 1%, 5%, and 10% significance level, respectively (p < 0.01, p < 0.05, p < 0.1), and correlated positively with the dependent variable, whereas the independent variable “perceived financial risk” is significant at the 10% significance level (p < 0.1) and correlated negatively with the dependent variable. This suggests that survey respondents with optimistic personality traits and higher “perceived health risk” and “perceived environmental risk” were more likely to select “seek employment”, but those who had higher “perceived financial risk” were less likely to select “seek employment” to cope with livelihood risk especially financial risk. The reason for this result may be that rural householders with optimistic personality traits and higher “perceived health risk” are more willing to “seek employment” to obtain more income, improve their quality of life and deal with all kinds of potential risks, including health risk. When respondents realize that they are located in a vulnerable environment, they prefer to leave their living conditions, opting to migrate and “seek employment” to avoid environmental risk. In addition, rural householders with higher “perceived financial risk” also assumed that there is a risk (such as income instability) in the process of’ “seek employment”. However, neither the independent variables “perceived social risk” nor “perceived information and connectivity risk” were significant, suggesting that the livelihood strategy “seek employment” could not be affected by these two perceived livelihood risks.
4. Conclusions
Over the past 40 years, “livelihood risk” has become a growing and intensive theme of conceptual and empirical research. In the field of sustainable development, rural households and their adaptations to livelihood risk have become a global issue of concern. Use of accurate assessments of the impacts of perceived livelihood risk on livelihood strategies in key areas characterized by ecological fragility, high-risk, and extreme poverty zones are helpful to inform relevant policies, which may improve risk perception capabilities and enhance the effectiveness of livelihood strategies. The main contribution of this paper is to analyze the various dimensions of perceived livelihood risk in detail and to consider their potential significance for the livelihood strategies of local farmers in the Shiyang River Basin. Different perceived livelihood risks have different effects on livelihood strategies. Our analysis indicates that personality traits, perceived health risk, perceived financial risk, perceived social risk, and perceived environmental risk, influence livelihood strategies significantly, while perceived information and connectivity risk have no obvious influence on livelihood strategies.
Perceived livelihood risks tend to shape individual livelihood strategies. Hence an in-depth understanding of risk perceptions is essential and should be integral to policies such as those surrounding climate change adaptation [59]. To enhance the capacity of farmers to understand risks well and accurately, it is important to provide them with a system that can assist them to secure correct information on time [60]. On this basis, local governments could work to support development of farmers’ knowledge of risks, thereby altering their risk perceptions and helping them achieve appropriate and effective livelihood strategies. Services such as technology training (e.g., water-saving technology, planting technology, and management skills) could be offered through centralized and individual training. In addition, government should speed up the construction of rural cooperative organizations (e.g., the cooperation between herder households and farmer families, or regional cooperation) ensuring sharing of resources such as information, technology, and funds. Meanwhile, government could also reshape industrial structures in ways that contribute to the development of specialty industries (such as agricultural and sideline products or the livestock product processing industry). These could help farmers find more work and diversify their livelihoods-outcomes that may increase their capacity to cope with livelihood risk. Moreover, construction of infrastructure and implementation of endowment and medical insurance should be improved to reduce the losses caused to farmers in the face of risks.
As part of the relationship between humans and changing external environments, perceived livelihood risk is a combination of natural and humanistic systems, embracing human experience, perception and knowledge. Although there is a growing body of research on risk perception, adaptive capacity and livelihood strategies, there is a lack of empirical information and research on the relationships between them. In particular there are few analytical studies on perceived livelihood risk. Farmers’ selection of livelihood strategies is very complex, including variables such as individual knowledge structure, mood, sense of worth, culture type, risk intensity, and personal familiarity with livelihood risk and so on. This study helps us comprehend the ways rural households adapt to livelihood risk. It is important to realize that our analytical framework can systematically decouple the correlation between various forms of perceived livelihood risk and livelihood strategies, and point to relevant policy preferences on the basis of this correlation. In the meantime, the construction of institutional systems supportive of farmers should be accelerated to help promote their capacities to adapt in the face of livelihood risk. For future research, other factors which may influence livelihood strategies (such as intergenerational support, near-neighbor imitation effect, and other related policy factors) are needed for in-depth discussion. Meanwhile, the differentials in standard of living can lead to differences in impacts of the factors on livelihood. Here, and for future work, our initial idea is to divide farmers into different types according to their livelihood capital endowments and to evaluate differences among different sub-groups.
Author Contributions
F.S. wrote the draft, and all three authors contributed equally to the finalization of the paper.
Acknowledgments
This study was funded by the MOE project of Humanities and Social Sciences of China under Grant No.19YJAZH076; ‘Thousand People Plan’ specially invited expert for young professionals in Shaanxi Province; Shaanxi soft Science Research Program under Grant No.2018KRM065; National Social Science Fund of China under Grant No.17XJY018; Strategic Leading Science and Technology Project of Chinese Academy of Sciences under Grant No.XDA23060304.
Conflicts of Interest
The authors declare no conflict of interest.
References
- Moser, C. The Asset Vulnerability Framework: Reassessing Urban Poverty Reduction Strategies. World Dev. 1998, 26, 1–19. [Google Scholar] [CrossRef]
- Delor, F.; Hubert, M. Revisiting the concept of ‘vulnerability’. Soc. Sci. Med. 2000, 50, 1557–1570. [Google Scholar] [CrossRef]
- Slovic, P.; Weber, E.U. Perception of Risk Posed by Extreme Events. Risk Manag. Strat. Uncertain World 2002, 1–21. [Google Scholar] [CrossRef]
- Brauch, H.G. Threats, Challenges, Vulnerabilities and Risks in Environmental and Human Security; UNU-EHS: Bonn, Germany, 2005; pp. 457–471. ISBN 3981020057. [Google Scholar]
- Knutsson, O. A Process-Oriented Sustainable Livelihoods Approach—A Tool for Increased Understanding of Vulnerability, Adaptation and Resilience. Mitig. Adapt. Strat. Glob. Chang. 2006, 12, 365–372. [Google Scholar] [CrossRef]
- Shahbaz, B. Risk, Vulnerability and Sustainable Livelihoods: Insights from Northwest Pakistan; Sustainable Development Policy Institute: Islamabad, Pakistan, 2008. [Google Scholar]
- Lorenzoni, I.; Jeanne, X.; Kasperson, R.E. The Social Contours of Risk. Environ. Values. 2007, 16, 401–404. Available online: https://0-www-jstor-org.brum.beds.ac.uk/stable/30302188 (accessed on 28 December 2018).
- Valdivia, C.; Seth, A.; Gilles, J.L.; García, M.; Jiménez, E.; Cusicanqui, J.; Navia, F.; Yucra, E. Adapting to climate change in andean ecosystems: Landscapes, capitals, and perceptions shaping rural livelihood strategies and linking knowledge systems. Ann. Assoc. Am. Geogr. 2010, 100, 818–834. [Google Scholar] [CrossRef]
- Zhao, X.Y. Review on farmers’ climate change perception and adaptation. Chin. J. Appl. Ecol. 2014, 25, 2440–2448. [Google Scholar] [CrossRef]
- Bord, R.J.; Fisher, A. Public perceptions of global warming: United States and international perspectives. Clim. Res. 1998, 11, 75–84. [Google Scholar] [CrossRef]
- Leiserowitz, A. Climate change risk perception and policy preferences: The role of affect, imagery, and values. Clim. Chang. 2006, 77, 45–72. [Google Scholar] [CrossRef]
- Babulo, B.; Muys, B.; Nega, F.; Tollens, E.; Nyssen, J.; Deckers, J.; Mathijs, E. Household livelihood strategies and forest dependence in the highlands of Tigray, Northern Ethiopia. Agric. Syst. 2008, 98, 147–155. [Google Scholar] [CrossRef]
- Barrett, C.B.; Reardon, T.; Webb, P. Nonfarm income diversification and household livelihood strategies in rural Africa: Concepts, dynamics, and policy implications. Food Policy 2001, 26, 315–331. [Google Scholar] [CrossRef]
- Ishaya, S.; Abaje, I.B. Indigenous people’s perception of climate change and adaptation strategies in Jema’a local government area of Kaduna State, Nigeria. J. Geogr. Reg. Plan. 2008, 1, 138–143. [Google Scholar]
- Edwards, J.G.; Plassmann, K.; Harris, I.M. Carbon footprinting of lamb and beef production systems: Insights from an empirical analysis of farms in Wales, UK. J. Agric. Sci. 2009, 147, 707–719. [Google Scholar] [CrossRef]
- Akter, S.; Bennett, J. Household perceptions of climate change ad preferences for mitigation action: The case of the carbon pollution reduction scheme in Australia. Clim. Chang. 2011, 109, 417–436. [Google Scholar] [CrossRef]
- Shi, X.F.; Tian, M.; Li, J.L. The influence factors and assessment of risk perception for agricultural drought based on household-scale. Agric. Sci. Technol. 2015, 16, 1517–1521. [Google Scholar] [CrossRef]
- Zhong, Z.B.; Li, F.; Feng, H.C. The Influence of the Old—Age Security Capability Assessment on the Risk Perception of the Farmers on the Provides for the Elderly and the Difference between Generations: An Empirical Analysis Based on 1573 Samples from 5 Provinces. Popul. Econ. 2016, 6, 72–81. [Google Scholar]
- Bradshaw, B.; Dolan, H.; Smit, B. Farm-level adaptation to climatic variability and change: Crop diversification in the Canadian prairies. Clim. Chang. 2004, 67, 119–141. [Google Scholar] [CrossRef]
- Mertz, O.; Mbow, C.; Reenberg, A. Farmers’ perceptions of climate change and agricultural adaptations strategies in rural Sahel. Environ. Manag. 2009, 43, 804–816. [Google Scholar] [CrossRef]
- Han, Y.; Hou, X.Y. Perceptions and adaptation strategies of herders in desert steppe of Inner Mongolia to climate change. Chin. J. Appl. Ecol. 2011, 22, 913–922. [Google Scholar] [CrossRef]
- Hou, X.Y.; Han, Y. Herdsmen’s perceptions and adaptation of climate change in typical areas of Inner Mongolia. Geogr. Res. 2011, 30, 1753–1764. [Google Scholar] [CrossRef]
- Su, F.; Yin, J.; He, C.; Huang, J.Y. Visualizing the Knowledge Domain of Flood Risk Perception Research: A Scietometric Review. J. Catastrophology 2016, 31, 145–149. [Google Scholar] [CrossRef]
- Li, J. Livelihood adaptation strategy and perceived adaptive capacity of rural relocated households in Southern Shaanxi Province, China. China Popul. Resour. Environ. 2016, 26, 44–52. [Google Scholar] [CrossRef]
- IPCC. Section 18 ‘Inter-Relationships between Adaptation and Mitigation’ in Climate Change 2007: Impacts, Adaptation, and Vulnerability. Working Group II. 4th Assessment Report of the IPCC; Cambridge University Press: Cambridge, UK, 2007. [Google Scholar]
- Smit, B.; Pilifosova, O. From adaptation to adaptive capacity and vulnerability reduction. In Climate Change, Adaptive Capacity and Development; Smith, J.B., Klein, R.J.T., Huq, S., Eds.; Imperial College Press: London, UK, 2003; ISBN 9781860943737. [Google Scholar]
- Grothmann, T.; Patt, A. Adaptive capacity and human cognition: The process of individual adaptation to climate change. Glob. Environ. Chang. 2005, 15, 199–213. [Google Scholar] [CrossRef]
- Food and Agriculture Organization (FAO). Rapid Guide for Missions: Analyzing Local Institution Sand Livelihoods; FAO: Rome, Italy, 2005; pp. 15–32. ISBN 9789251054291. [Google Scholar]
- Chambers, R.; Conway, G.R. Sustainable Rural Livelihoods: Practical Concepts for the 21st Century; IDS Discussion Paper; Brighton, Institute of Development Studies: East Sussex, UK, 1992; pp. 1–33. ISBN 0903715589. [Google Scholar]
- Ellis, F. Household strategies and rural livelihood diversification. J. Dev. Stud. 1998, 35, 1–38. [Google Scholar] [CrossRef]
- Ellis, F. Rural Livelihoods and Diversity in Developing Countries; Oxford University Press: Oxford, UK, 2000; pp. 25–36. ISBN 9780198296966. [Google Scholar]
- DFID. Sustainable Livelihoods Guidance Sheets; DFID: London, UK, 1999; Available online: www.ennonline.net/dfidsustainableliving (accessed on 20 December 2015).
- Leach, M.; Mearns, R.; Scoones, I. Environmental entitlements: Dynamics and institutions in community-based natural resource management. World Dev. 1999, 27, 225–247. [Google Scholar] [CrossRef]
- Wheeler, S.; Zuo, A.; Bjornlund, H. Farmers’ climate change beliefs and adaptation strategies for a water scarce future in Australia. Glob. Environ. Chang. 2013, 23, 537–547. [Google Scholar] [CrossRef]
- Dercon, S. Income risk, coping strategies, and safety nets. World Bank Res. Obs. 2002, 17, 141–166. [Google Scholar] [CrossRef]
- Wiens, T.B. Peasant Risk Aversion and Allocative Behavior: A Quadratic Programming Experiment. Am. J. Agric. Econ. 1976, 58, 629–635. [Google Scholar] [CrossRef]
- Ding, S.J.; Chen, C.B. Analysis of Farmers’ Risk Coping Mechanisms. Res. Agric. Mod. 2001, 22, 346–349. [Google Scholar] [CrossRef]
- Temesgen, M. Determinants of tillage frequency among smallholder farmers in two semiarid areas in Ethiopia. Phys. Chem. Earth 2008, 33, 183–191. [Google Scholar] [CrossRef]
- Reidsma, P.; Ewert, F.; Lansink, A.O.; Leemans, R. Adaptation to climate change and climate variability in European agriculture: The importance of farm level responses. Eur. J. Agron. 2010, 32, 91–102. [Google Scholar] [CrossRef]
- Jin, L.S.; Wei, T.Y.; Hu, Z.T. Herdsmen’s Perceptions and Adaption to Climate Change: A Case Study in Chaganbulige, Siziwang Banner, Inner Mongolia. J. Nat. Resour. 2014, 29, 211–222. [Google Scholar] [CrossRef]
- Zhou, Y.Z.; Chos, G.; Guo, Y.C. The Climate Change Perception and Adaptation of Population in the Yarlung Zangbo River Basin. Tibet. Stud. 2014, 3, 90–96. [Google Scholar] [CrossRef]
- Lu, H.L.; Zhou, L.H.; Chen, Y.; Ma, B.; Wei, X. Adaptive strategy of peasant households and its influencing factors under the grazing prohibition policy in yanchi county, ningxia hui autonomous region. Acta Ecol. Sin. 2016, 36, 5601–5610. [Google Scholar] [CrossRef]
- Paul, B. An Asset-Based Approach to Social Risk Management: A Conceptual Framework; Social Protection Discussion Paper Series; World Bank: Washington, DC, USA, 1999; Volume 10, pp. 125–128. Available online: http://documents.worldbank.org/curated/en/837121468765606678/An-asset-based-approach-to-social-risk-management-a-conceptual-framework (accessed on 1 July 2010).
- Fang, S.; Shang, H.Y. Relationship analysis between livelihood assets and livelihood strategies: A Heihe River Basin example. Sci. Cold Arid Reg. 2012, 4, 265–274. [Google Scholar] [CrossRef]
- Ulrich, A.; Speranza, C.I.; Roden, P.; Kiteme, B.; Wiesmann, U.; Nüsser, M. Small-scale farming in semi-arid areas: Livelihood dynamics between 1997 and 2010 in Laikipia, Kenya. J. Rural Stud. 2012, 28, 241–251. [Google Scholar] [CrossRef]
- Zenteno, M.; Zuidema, P.A.; de Jong, W.; Boot, R.G. Livelihood strategies and forest dependence: New insights from Bolivian forest communities. For. Policy Econ. 2013, 26, 12–21. [Google Scholar] [CrossRef]
- Wardekker, J.A.; Petersen, A.C.; van Der Sluijs, J.P. Ethics and public perception of climate change: Exploring the Christian voices in the US public debate. Glob. Environ. Chang. 2009, 19, 512–521. [Google Scholar] [CrossRef] [Green Version]
- Kelkar, U.; Narula, K.K.; Sharma, V.P.; Chandna, U. Vulnerability and adaptation to climate variability and water stress in Uttarakhand State, India. Glob. Environ. Chang. 2008, 18, 564–574. [Google Scholar] [CrossRef]
- Gandure, S.; Walker, S.; Botha, J.J. Farmers’ perceptions of adaptation to climate change and water stress in a South African rural community. Environ. Dev. 2013, 5, 39–53. [Google Scholar] [CrossRef]
- Tucker, C.M.; Eakin, H.; Castellanos, E.J. Perceptions of risk and adaptation: Coffee producers, market shocks, and extreme weather in Central America and Mexico. Glob. Environ. Chang. 2010, 20, 23–32. [Google Scholar] [CrossRef]
- Zhang, Q. Impacts of Climate change on farmers’ livelihood capital in the Shiyang river basin of China. J. Desert Res. 2016, 36, 814–822. [Google Scholar] [CrossRef]
- Gao, J.F. Evaluation on ecological security in Shiyanghe river Valley, Gansu. For. Resour. Manag. 2009, 2, 65–69. [Google Scholar] [CrossRef]
- Giddens, A. Runaway World; Profile Books: London, UK, 1999; pp. 45–57. ISBN 1861974299. [Google Scholar]
- Odero, K. Information Capital: 6th Asset of Sustainable Livelihood Framework. Discov. Innov. 2006, 18, 83–91. [Google Scholar] [CrossRef]
- Fang, S.U.; Saikia, U.; Hay, I. Relationships between Livelihood Risks and Livelihood Capitals: A Case Study in Shiyang River Basin, China. Sustainability 2018, 10, 509. [Google Scholar] [CrossRef]
- Mitchell, V. Consumer perceived risk: Conceptualisations and models. Eur. J. Mark. 1999, 33, 163–195. [Google Scholar] [CrossRef]
- Greene, W.H. Econometric Analysis, 5th ed.; Prentice-Hall: New Jersey, NJ, USA, 2002; pp. 569–592. ISBN 9780130661890. [Google Scholar]
- Qiu, L.; Du, M.; Zhang, D. A research on fuzzy composite appraisal of various biological indexes. J. Harbin Univ. Ce Archit. 2003, 33, 50–54. [Google Scholar]
- Kuruppu, N.; Liverman, D. Mental preparation for climate adaptation: The role of cognition and culture in enhancing adaptive capacity of water management in Kiribati. Glob. Environ. Chang. 2011, 21, 657–669. [Google Scholar] [CrossRef]
- Yarnal, B.; Diaz, H.F. Relationships between extremes of the Southern oscillation and the winter climate of the Anglo-American Pacific Coast. Int. J. Climatol. 2010, 6, 197–219. [Google Scholar] [CrossRef]
Figure 1.
Map showing the location of the Shiyang River Basin, Gansu Province, China.

Figure 2.
The framework of perceived livelihood risk.

Figure 3.
Livelihood strategy options chosen by farmers surveyed. Note: Percentages in Figure 3 represent specific livelihood strategies chosen by farmers (N = 485 surveyed households).
Figure 3.
Livelihood strategy options chosen by farmers surveyed. Note: Percentages in Figure 3 represent specific livelihood strategies chosen by farmers (N = 485 surveyed households).


Table 1.
Farmers’ perceptions of perceived water resource scarcity in different areas.
| Perception Index | Appraisal Question | Assignment | Middle Reaches | Lower Reaches | Average | Variance | ||
|---|---|---|---|---|---|---|---|---|
| Perceived water resource shortage | Risk Perception | Perceived Probability | What is the possibility of growing water shortages in the future? | Very small = 1, Small = 2, Middle = 3, Big = 4, Very big = 5 | 2.85 | 2.51 | 2.68 | 0.56 |
| Perceived Severity | What damage are water resource shortages doing to your livelihood? | Very small = 5, Small = 4, Middle = 3, Big = 2, Very big = 1 | 2.83 | 2.63 | 2.73 | 0.69 | ||
| Perceived Adaptive Capacity | Perceived Adaptation Efficacy | How well do adaptation actions mitigate the negative effects of water resource shortage? | Very poorly = 1, Poorly = 2, Middle = 3, Well = 4, Very Well = 5 | 2.73 | 2.37 | 2.55 | 0.51 | |
| Perceived Self-efficacy | How well do rural households adapt to water resources shortages? | Very poorly = 1, Poorly = 2, Middle = 3, Well = 4, Very Well = 5 | 2.17 | 2.35 | 2.26 | 0.71 | ||
| Perceived Adaptation Cost | What is the cost you expect for adaptive action? | Very low = 1, Low = 2, Middle = 3, High = 4, Very High = 5 | 2.90 | 2.04 | 2.47 | 1.08 | ||
Table 2.
Estimated values of perceived livelihood risk indicators in different areas of the Shiyang River Basin.
Table 2.
Estimated values of perceived livelihood risk indicators in different areas of the Shiyang River Basin.
| Livelihood Risk Cognition | Perceived Risk Value | Weight | Surveyed Households in Middle Reaches | Surveyed Households in Lower Reaches | Total Surveyed Households | |
|---|---|---|---|---|---|---|
| Perceived health risk | X1 | 25.03 | 0.325 | 25.01 | 27.21 | 26.11 |
| 27.48 | 0.327 | |||||
| 25.82 | 0.348 | |||||
| Perceived environmental risk | X2 | 25.44 | 0.104 | 25.04 | 26.52 | 25.78 |
| 23.21 | 0.121 | |||||
| 26.21 | 0.162 | |||||
| 25.81 | 0.179 | |||||
| 26.38 | 0.121 | |||||
| 28.13 | 0.179 | |||||
| 24.11 | 0.134 | |||||
| Perceived financial risk | X3 | 26.43 | 0.188 | 27.31 | 25.07 | 26.19 |
| 27.17 | 0.195 | |||||
| 27.31 | 0.112 | |||||
| 26.42 | 0.202 | |||||
| 25.30 | 0.162 | |||||
| 24.35 | 0.141 | |||||
| Perceived social risk | X4 | 23.18 | 0.185 | 25.08 | 22.74 | 23.91 |
| 25.14 | 0.168 | |||||
| 24.29 | 0.259 | |||||
| 26.37 | 0.183 | |||||
| 20.88 | 0.205 | |||||
| Perceived information and connectivity risk | X5 | 20.35 | 0.225 | 21.34 | 22.32 | 21.83 |
| 22.31 | 0.155 | |||||
Table 3.
The relationship between perceived livelihood risk and livelihood strategies.
| Variables | B | Std. Error | Wald | df. | Sig. | Exp(B) | 95% Confidence Interval for Exp(B) | ||
|---|---|---|---|---|---|---|---|---|---|
| Lower Bound | Upper Bound | ||||||||
| Reduce consumption | Intercept | 65.707 | 7.690 | 73.001 | 1 | 0.000 | — | — | — |
| Personality traits | −1.131 | 0.132 | 73.580 | 1 | 0.000 | 0.323 | 0.249 | 0.418 | |
| Perceived health risk | 0.180 | 0.092 | 3.830 | 1 | 0.050 | 1.197 | 1.000 | 1.433 | |
| Perceived environmental risk | −0.016 | 0.123 | 0.017 | 1 | 0.895 | 0.984 | 0.773 | 1.253 | |
| Perceived financial risk | −0.220 | 0.133 | 2.729 | 1 | 0.099 | 0.802 | 0.618 | 1.042 | |
| Perceived social risk | 0.049 | 0.123 | 0.159 | 1 | 0.690 | 1.050 | 0.825 | 1.337 | |
| Perceived information and connectivity risk | −0.043 | 0.113 | 0.144 | 1 | 0.704 | 0.958 | 0.768 | 1.195 | |
| Wait for relatives and friends’ help | Intercept | 66.698 | 7.730 | 74.446 | 1 | 0.000 | — | — | — |
| Personality traits | −2.927 | 0.000 | — | 1 | — | 0.054 | 0.054 | 0.054 | |
| Perceived health risk | 0.122 | 0.127 | 0.917 | 1 | 0.338 | 1.129 | 0.880 | 1.449 | |
| Perceived environmental risk | 0.068 | 0.182 | 0.140 | 1 | 0.708 | 1.071 | 0.749 | 1.530 | |
| Perceived financial risk | −0.187 | 0.157 | 1.423 | 1 | 0.233 | 0.829 | 0.610 | 1.128 | |
| Perceived social risk | 0.023 | 0.136 | 0.029 | 1 | 0.864 | 1.024 | 0.783 | 1.338 | |
| Perceived information and connectivity risk | 0.317 | 0.194 | 2.680 | 1 | 0.102 | 1.373 | 0.939 | 2.007 | |
| Use loans | Intercept | 65.413 | 7.569 | 74.682 | 1 | 0.000 | — | — | — |
| Personality traits | 1.072 | 0.119 | 80.877 | 1 | 0.000 | 0.342 | 0.271 | 0.433 | |
| Perceived health risk | 0.170 | 0.069 | 6.034 | 1 | 0.014 | 1.186 | 1.035 | 1.358 | |
| Perceived environmental risk | 0.033 | 0.081 | 0.163 | 1 | 0.687 | 1.033 | 0.881 | 1.212 | |
| Perceived financial risk | −0.206 | 0.113 | 3.361 | 1 | 0.067 | 0.814 | 0.653 | 1.014 | |
| Perceived social risk | 0.027 | 0.081 | 0.109 | 1 | 0.071 | 1.027 | 0.876 | 1.204 | |
| Perceived information and connectivity risk | 0.073 | 0.078 | 0.868 | 1 | 0.351 | 1.075 | 0.923 | 1.253 | |
| Seek employment | Intercept | 53.527 | 7.333 | 53.277 | 1 | 0.000 | — | — | — |
| Personality traits | 0.760 | 0.112 | 45.711 | 1 | 0.000 | 0.468 | 0.375 | 0.583 | |
| Perceived health risk | 0.107 | 0.062 | 2.997 | 1 | 0.083 | 1.113 | 0.986 | 1.257 | |
| Perceived environmental risk | 0.032 | 0.072 | 0.195 | 1 | 0.059 | 1.032 | 0.896 | 1.189 | |
| Perceived financial risk | −0.174 | 0.104 | 2.810 | 1 | 0.094 | 0.840 | 0.685 | 1.030 | |
| Perceived social risk | 0.077 | 0.070 | 1.223 | 1 | 0.269 | 1.080 | 0.942 | 1.239 | |
| Perceived information and connectivity risk | 0.053 | 0.075 | 0.499 | 1 | 0.480 | 1.054 | 0.911 | 1.221 | |
Number of observations: 485; Pseudo R2: Cox and Snell 0.937; Nagelkerke 0.980; chi-square: 1338.585; −2 Log likelihood 175.041. The base category is “convert assets into cash”.
© 2019 by the authors. Licensee MDPI, Basel, Switzerland. This article is an open access article distributed under the terms and conditions of the Creative Commons Attribution (CC BY) license (http://creativecommons.org/licenses/by/4.0/).
Share and Cite
MDPI and ACS Style
Su, F.; SAIKIA, U.; HAY, I. Impact of Perceived Livelihood Risk on Livelihood Strategies: A Case Study in Shiyang River Basin, China. Sustainability 2019, 11, 3349. https://0-doi-org.brum.beds.ac.uk/10.3390/su11123349
AMA Style
Su F, SAIKIA U, HAY I. Impact of Perceived Livelihood Risk on Livelihood Strategies: A Case Study in Shiyang River Basin, China. Sustainability. 2019; 11(12):3349. https://0-doi-org.brum.beds.ac.uk/10.3390/su11123349
Chicago/Turabian StyleSu, Fang, Udoy SAIKIA, and Iain HAY. 2019. "Impact of Perceived Livelihood Risk on Livelihood Strategies: A Case Study in Shiyang River Basin, China" Sustainability 11, no. 12: 3349. https://0-doi-org.brum.beds.ac.uk/10.3390/su11123349
Note that from the first issue of 2016, this journal uses article numbers instead of page numbers. See further details here.